- 1Institute for Disaster Management and Reconstruction, Sichuan University, Chengdu, China
- 2State Key Laboratory of Hydraulics and Mountain River Engineering, Sichuan University, Chengdu, China
River blockage and dam break usually occur in mountainous areas with many valleys, and are frequent and extremely harmful natural disasters. With the construction of infrastructures in mountainous areas, the demand for disaster prevention and control has been further increased. Based on an innovative flume model for simulating whole process of river blockage and dam break, the present study carried out eight groups tests under different inflow rates. In the analysis, the whole process of river blockage and dam break was divided into four stages: ESBA (Early stage of blockage), LSBA (Late stage of blockage), ESBK (Early stage of breaking) and LSBK (Late stage of breaking). By analyzing the relationship between Qin and Qmax, it is found that Qmax shows an overall trend of increase with the increase of Qin while some contrarily decreasing Qmax cases exist when Qin slightly increases. The cases of irregularities may come from the inflow condition impact and randomness during the dam formation process. In addition, the slope of the curve Qin–Qmax/Qin parameter shows a decreasing trend with the increase in the median particle size of the soil. The present study proposes a new method for model experiments, providing new ideas for subsequent model experiments. Furthermore, these conclusions can provide reference for disaster prevention and mitigation in mountainous areas.
Introduction
Due to natural disasters, such as earthquakes, rainstorms, typhoons and melting glaciers, destructive landslides or debris flows can easily form near mountain valleys (Coussot and Meunier, 1996; Cruden, 2005; Sassa, 2007; Chae et al., 2017; Chen et al., 2022). These material sources would very likely block river channels, causing these to stop flowing and form natural dams (Costa and Schuster, 1988; Fan et al., 2020; Zhong et al., 2021). The water volume of these resulting dammed lakes would gradually increase over time, and the threat to downstream human infrastructures and life would be self-evident.
Research on whole process of river blockage and dam break has been the basis and focus for solving the above problems. Research in this area has been mainly carried out from the perspective of field observation, model test, numerical simulation and theoretical analysis. Present studies generally divide the continuous process of river blockage and dam break into independent researches on the formation process of blocked rivers and its process of breaking. Recent developments in the field of formation process of river blockage have led to a renewed interest in the statistical analysis of field research data. Fan et al. (2014) developed an empirical method to predict coseismic landslide dam formation using landscape parameters obtained from digital elevation models. Chen and Wu. (2018) take Xinmo landslide for example, studied the post-failure behavior of the landslide using two-dimensional discontinuous deformation analysis (2D DDA). Li et al. (2020) proposed a discrete element simulation model to predict the geometry and formation process of landslide dams. In addition, Zhao et al. (2019b) and Wu et al. (2020) have explored the formation mechanism through model tests and numerical simulations. However, the results in this regard remains relatively lacking. For researches on whole process of river blockage and dam break, a large part of these researches adopt the method of combining the model test and theoretical analysis. The reason is because the model test can reproduce the actual block and break process in a small-scale model, allowing researchers to summarize the physical mechanism similar to the prototype. Rapid progress has been taken in the recent 30 years in the field of the experimental study on landslide dams. Coleman et al. (2002) made a detailed exploration of the overtopping process of homogeneous noncohesive embankments using model test. Awal (2008) identified the mechanism of landslide dams failure under different breaking modes through model tests. Schmocker and Hager. (2009) carried out a series of overtopping breach tests and indicated definite minimum dimensions for both the dike height and width, sediment diameter and overtopping discharge. Nian et al. (2020) proposed a dimensionless River Blockage Criterion (RBC) to judge the formation of landslide dams based on a series of model tests. And (Peng et al., 2021) investigated the breaching mechanisms of landslide dams composed of different materials under surge waves. However, the forming or breaking mechanism presents to be heterogeneous and highly test condition dependent, which greatly restricts the extrapolation. Although there are many reports in the above literature on the outcome of simple flume experiment, most are restricted to geometric similarity. Therefore, in recent years, there are a large number of published studies (Hanson et al., 2002; Höeg et al., 2004; Morris et al., 2007; Sheng-shui et al., 2014; Zhao et al., 2019; Li et al., 2021) that describe the landslide dam’ failure mechanism using large-scale field models or centrifugal models. Although the cost of this kind of experiment is high, this can better meet similar conditions, and the obtained test results are more similar to the prototype phenomenon, making this a better research method. Other approaches were performed through the establishment of the mathematical and physical model of a dam, and a high-performance computer simulates the dam breaking process, including the evolution process of breaches and floods (Cristofano, 1973; Fread, 1988; Chang and Zhang, 2010; Liu, 2018; Luo et al., 2019; Ruan et al., 2021; Tian et al., 2021; Zhang et al., 2021). However, these models have high simulation accuracy only when the input parameters are sufficiently large and accurate (Zhong et al., 2021).
In view of all that has been mentioned so far, one may suppose that a phenomenon or mechanism of river blockage or dam break is explained in depth. However, the above research has tended to focus on only one part of the whole process of river blockage and dam break rather than the continuous whole process. These studies have not able to convincingly confirm the relevance between model and prototype. The key issue is that the actual whole process of river blockage and dam break contains a number of uncertainties. First, the uncertainty of the occurrence time of natural disasters can lead to the triggering of landslides or debris flow that block the river, and this uncertainty puts forward more urgent time requirements for the prevention and control of such disasters. Second, after a landslide or debris flow forms, it is difficult to accurately predict whether and how the river would be blocked. Third, after the dam is formed, the breaking mode and the location of the breach have strong randomness. Finally, under the action of these above-mentioned random events, the outburst flood process would cause great changes. These suggests that a more realistic and continuous model test may lead to a more consistent conclusion with the actual prototype. Therefore, we developed a model that simulates the whole process in order to explore more valuable conclusions.
In addition, the impact of river flow on dam formation and break is a critical and interesting issue. The impact of the inflow on whole process of river blockage and dam break has strong uncertainties. For the same river, the flow may greatly vary at different time points of the year. For example, in the Jinsha River in China, where river blockage events frequently occur, the flood season from June to October accounts for 74–81% of the annual water volume (Wang et al., 2022). As a results, the consequences and prevention methods of river blockage events in different periods would be quite different. And the flow rate and water depth of the river would also affect the size of the formed dam (Chen et al., 2019). Therefore, considering only the inflow rate, there are a number of uncontrollable factors involved in the overall blockage and breakage process, and it would be difficult to fully grasp the key mechanism of the inflow rate on the whole process of river blockage and dam break. However, in recent years, some scholars have investigated the influence mechanism of inflow rate on the breaking process of natural dams through small-scale model tests. Xu et al. (2013) considered that the upstream inflow is the main factor that impacts the dam-break process through model tests with three groups of different inflow rates. Yang et al. (2015) investigated the change process of a breach under four different inflow rates. Zhou M. et al. (2019) concluded the relationship between the inflow rate and peak discharge of a breach through three groups of different inflow rates. These studies have carried out in-depth explorations on the impact of different flow rates on the breaking process, but the initial conditions were set too ideally. For example, the shape of the dam body have a fixed shape, the gradation was uniform, and the influence of water flow on the formation of the dam body was ignored. Based on some defects in the above tests, conducting the whole-process tests under different inflow rates are not only helpful to verify the reliability of previous research conclusions, but also to further explore the mechanism from a new perspective.
In summary, there are many uncertain factors in whole process of river blockage and dam break. Considering that the initial input quantity, such as initial hydrodynamic conditions, topographic conditions and provenance conditions, can be regarded as a definite initial quantity, the breaking flood flow and the change process of upstream and downstream water levels are correlated to the risk of this disaster chain. The present study used the newly developed model for the whole process of river blockage and dam break to explore new research methods for whole process of river blockage and dam break. In addition, under the condition of changing the initial inflow rate, the present study investigated the influence and internal mechanism of input parameters (inflow, topography, provenance, etc.) on output parameters (breach discharge, water level, etc.).
Methods
Model design
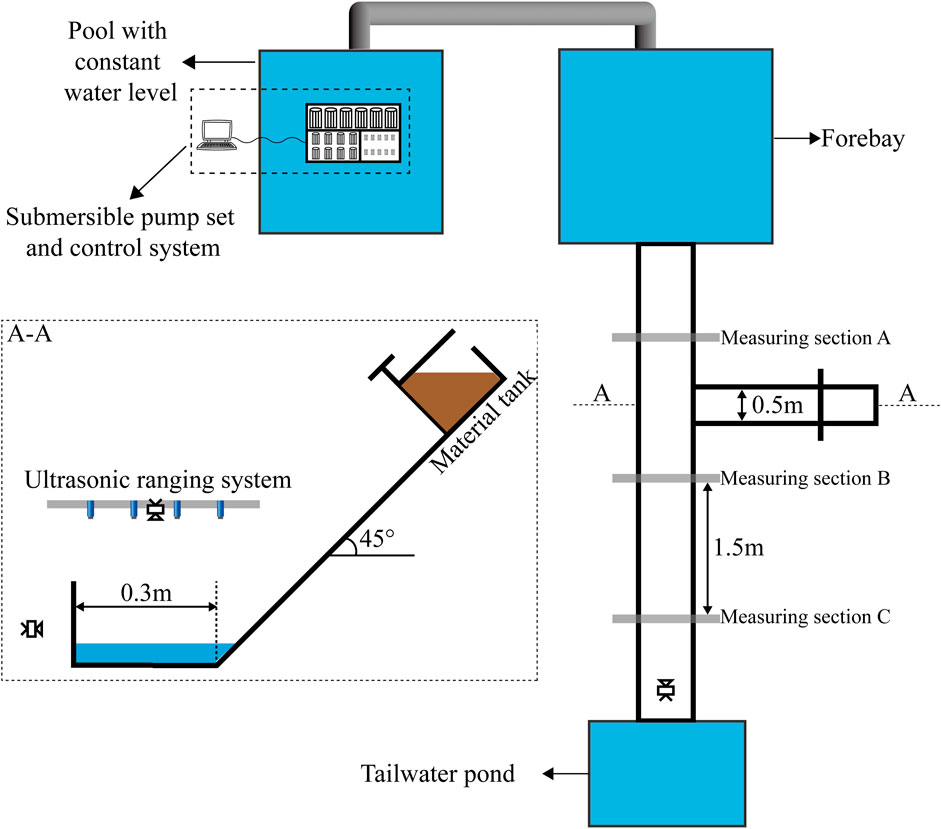
The experimental model is presented in Figure 1. The width and slope of the main channel, and the width and slope of the slope channel was adjusted according to the requirements. For the main channel, the length was 10.0 m, the height was 0.8 m, the width was adjusted between 0.1 m and 1.5 m, and the slope was adjusted between 1° and 15°. In the present experiment, the width was 30 cm and the slope was 1° for the main channel, while the width was 0.5 m, the height was 0.6 m, the length was 3.5 m, and the slope range was adjusted within 20°–70° for the slope channel. Furthermore, in the present experiment, the slope was 45°, the landslide material was stored in the material tank on the slope channel, and the maximum storage volume of the material tank was 0.3 m3. Furthermore, the mass of the landslide source was fixed at 80.0 kg. The water supply system included the laboratory water supply facilities, a pool with a constant water level, a forebay, a submersible pump set, and a control system. The storage capacity of the pool with a constant water level was 10.0 m3, and the maximum storage capacity of the forebay can reach up to 5.0 m3. When the laboratory water supply facility filled the pool up to the constant water level, the excess water flowed back to the large underground pool of the water supply facility after filling. Hence, the water level of the flat pool remained unchanged. The submersible pump set included three types of submersible pumps: six large water pumps with a maximum flow rate of 2 L/s, eight medium water pumps with a maximum flow rate of 1 L/s, and eight small water pumps with a maximum flow rate of 0.5 L/s. The pump set was fixed at the central position of the forebay, and the control system was used to integrate and control the switches of each water pump. The designed output flow range was 0.5–24.0 L/s. Due to the energy loss in the pumping process, the output flow was attenuated by 40%, and the actual output flow range was within 0.3–14.4 L/s.
During the experiment, the water level was measured using an ultrasonic ranging system. The ultrasonic wave was reflected after encountering the water surface. The measurement accuracy was high, and the maximum measurement frequency was 60 Hz. The phenomenon of the whole process of blocking and breaking was captured using a high-speed camera, as presented in Figure 1.
Materials
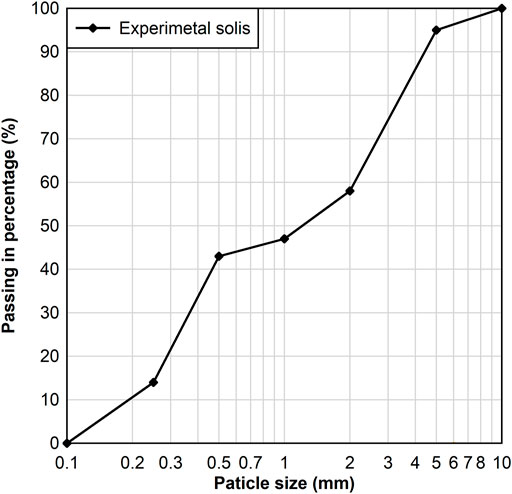
Grain size distribution has a great influence on whole process of river blockage and dam break. In order to make the gradation as consistent as possible with the actual situation, a wide-graded soil was used. Furthermore, in order to prevent more serious seepage phenomenon, fine particles were also present in the soil to fill the pores, allowing the experimental soil to have low permeability. The grain size distribution for the present experiment is presented in Figure 2.
In traditional dam model experiments, researchers usually design the shape of the dam (dam height, dam width, etc.) in advance, and most of these are two-dimensional models. In order to achieve the design effect, the compaction of the dam body may be unintentionally affected, and the stacking method used is usually manual stacking or simple tool-assisted stacking, resulting in some errors. In the present study, the project of building a dam was abandoned in the experiment, and the initial parameters (mass, gradation, etc.) of the soil were entered to the designed landslide device. The landslide dam was formed by the sliding soil from the slope channel, which had authenticity and three-dimensionality. For example, the designed dam body is often a trapezoid or triangle with clear edges and corners (Figure 3A), but the actual accumulation geometry is irregular (Figures 3C,D). Comparing Figures 3B–D, we can see that the geometry of the naturally sliding landslide dam is more consistent with the prototype while the artificial dam is not.
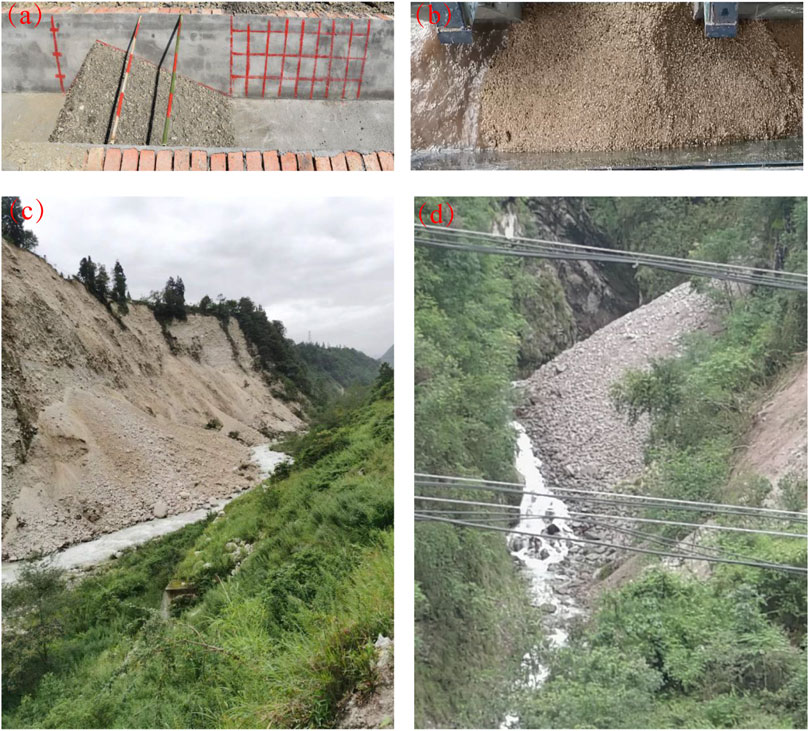
FIGURE 3. Comparison of experimental landslide dams and prototypes: (A) manual stacked dam; (B) natural sliding dam in this paper; (C,D) are photographs of landslides blocking river.
For the random phenomenon of dam formation during the test, the dam geometry was calibrated in advance. The dam geometries measured in three tests under the same conditions are presented in Table 1. The dam’s geometry in the three pretests is presented in Figure 4. It can be observed that the change in shape was relatively small. Furthermore, since the dam’s geometry has influence on the experiment, and the dam height is an important parameter to control the process for breaking, the influence of the dam’s height on the dam’s geometry on the whole process of blocking and breaking was considered for the present study.
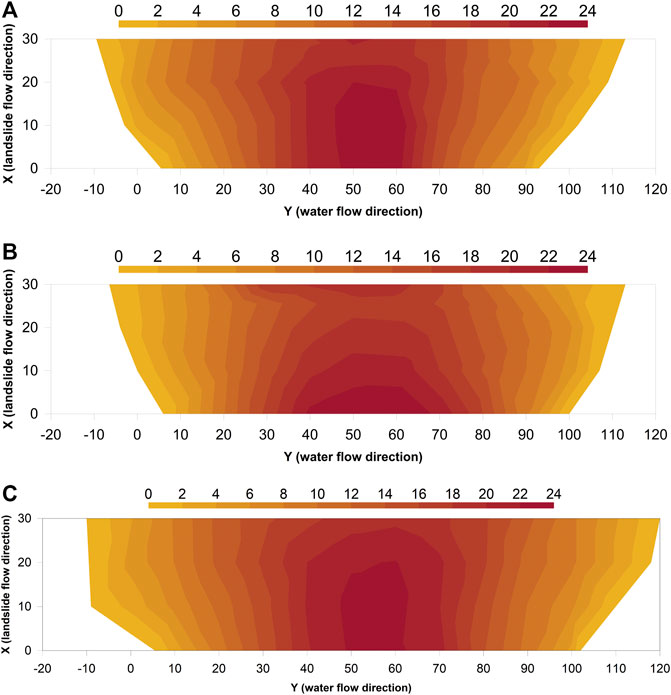
FIGURE 4. Dam geometry comparison: (A-C) are dam geometry obtained in three pre-experiments under the same conditions. All units are in centimeters. The sliding direction of the landslide along the horizontal direction is the same as the positive direction of the x-axis, the water flow direction is the same as the positive direction of the y-axis, and the exit position of the landslide into the main channel is between y = 50 and y = 60.
Costa and Schuster (1988) reported that the potential energy of water is an important parameter that affects dam breakage and flooding, and is correlated to the storage capacity of the impoundment (Vl). After field investigations, Korup (2004) considered that dam height (Hd) and dam volume (Vd) are the two key variables that can be used to assess the dam stability, and determine whether this would induce flood risk. Subsequently, Peng and Zhang (2012) proposed a set of dimensionless numbers, (
Therefore, the model designed for the present experiment comprehensively considered these parameters, and these key parameters were measured in multiple pre-experiments. The specific parameters are presented in Table 1. All parameters were within the feasible range (Zhou M. et al., 2019). This shows that the model, material and hydraulic properties of the present experiment can meet the actual situation.
Experimental procedure
The only initial variable in the present experiment is the inflow rate of the main channel. In order to simulate whole process of river blockage and dam break, the present experiment did not carry out human intervention after setting the initial parameters. The specific implementation process for the present experiment is, as follows:
(1) Clarify the initial conditions of the test;
(2) Initially place the preset landslide soil into the bearing device of the side slope, and turn on the pump set to make the river flow meet the preset flow;
(2) Arrange ultrasound sensors in the river to measure the upstream and downstream water levels;
(4) Arrange high-speed cameras around the model to measure the process of the landslide movement, the blocking process of the dam body, and the breaking process of the dam;
(5) After the measuring device is arranged and the river flow is stable, release the landslide;
(6) Wait for the end of the test, the sign at the end of the test is, the dam height is reduced to 1/2 of the maximum dam height.
Results and discussion
General description of whole process of river blockage and dam break
The test arrangements and results are presented in Table 2. In determining the breaking flow, the water balance equation is usually used to calculate the breach discharge, especially in model experiments and numeral calculations (Zhong et al., 2021). The simplified calculation equation used for the present study is, as follows:
where Qout refers to the flow discharge, and can be considered as the breach discharge (due to the characteristics of the dam material, the influence of the seepage discharge on the calculation is ignored); Qin refers to the inflow rate; A refers to the lake area; Lw refers to the upstream water level. Since the slope of the main channel is 1°, the variation of A with time is relatively low. In order to simplify the calculation in the absence of large errors, A is regarded as a constant. Lw can be obtained by the ultrasonic sensor, Qin is a designed constant quantity, then the breach discharge can be calculated according to Eq. 1.
The variation process of the upstream water level and breach discharge with time is presented in Figure 5. According to the upstream water level, breach discharge, and actual observation results, the whole process of blocking and breaking was divided into four stages.
(1) Early stage of blockage (ESBA): At this time, the landslide has not blocked the main channel, the upstream flow is stable, and the water level at the measuring point remains unchanged, as shown in Figure 6A;
(2) Late stage of blockage (LSBA): At this time, the landslide just blocks the river, there is no discharge for the time being, and the upstream water level gradually increases, as shown in Figure 6B;
(3) Early stage of breaking (ESBK): At this time, the overtopping water flow gradually erodes the dam crest, forming a breach, which gradually expands, and the breach discharge gradually increases and reaches a peak value, as shown in Figure 6C;
(4) Late stage of breaking (LSBK): At this time, the shape of the landslide dam slightly changes, and the breach discharge gradually decreases to the initial inflow rate, as shown in Figure 6D.
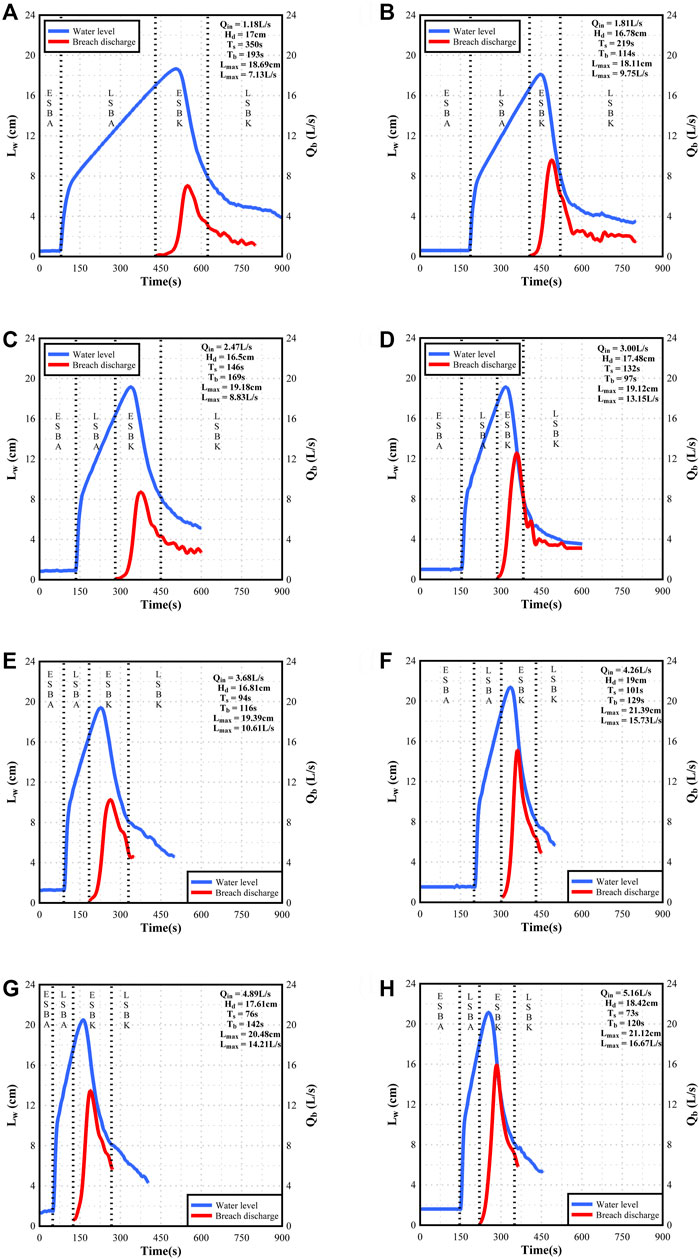
FIGURE 5. The upstream water level curve and the breach discharge curve at different stages: (A-H) expressed the water level and breach discharge process under different flow rates, respectively.
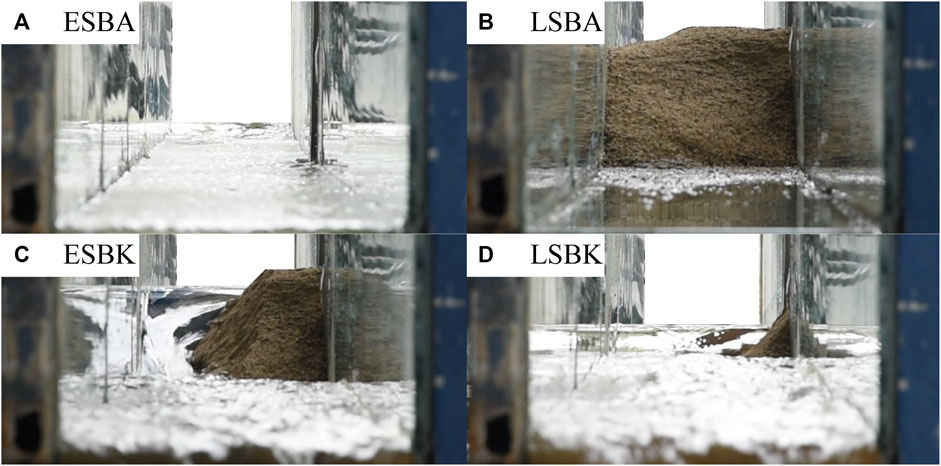
FIGURE 6. The four stages of the whole process of river blockage and dam breaking: (A) early stage of blockage; (B) Late stage of blockage; (C) Early stage of breaking; (D) Late stage of breaking.
Effect of Qin on Qmax
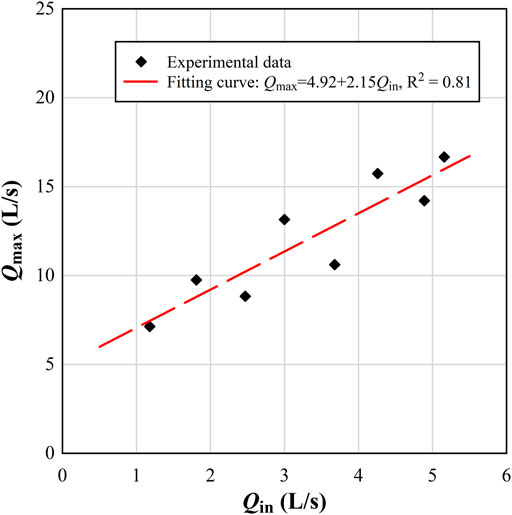
The relationship between Qin and Qmax was drawn, as shown in Figure 7, and the test data was fitted. The fitting formula is, as follows:
where Qin refers to the inflow rate (L/s) and Qout refers to the breach discharge (L/s). In the formula, R2=0.81, indicating that Qmax and Qin have a high linear correlation. In the whole process, Qmax increased with the increase in Qin.
The relational expression of Lw’ can be obtained from Eq. 1:
where
A larger Qin would cause the upstream water level at have a higher value when the flow just overtops, and this would have a higher flow area during the rising stage of the water level at ESBK. For the soil erosion rate in Eq. 4 (Hanson and Simon, 2001), it can be observed that a larger flow area would speed up the erosion process of the dam body, thereby shortening the breaking duration.
where E refers to the soil erosion rate (mm3/m2-s), Kd refers to the material property of the soil, and
Due to the rapid widening of the breach and slow drop in water depth, the outflow area would rapidly increase and become larger. According to experience and based on Eq. 5, this is often used to calculate the breach discharge in a dam breach model (Singh and Scarlatos, 1988). It can be observed that this case tends to have a larger peak discharge.
where: B refers to the width of the bottom of the breach, hb refers to the depth of the breach, and
In summary, the influence of the increase in Qin in the whole process mainly lies in two aspects. On one hand, the upstream water level at the beginning of ESBK would have a high value, resulting to a higher flow area during the rising stage before breaking. On the other hand, a larger flow area would accelerate the erosion process. In addition, Walder et al. (2015) explained that Qmax is an increasing function of initial water level through some theoretical analysis on a series of model tests. Therefore, combined with the experimental phenomenon, it can be observed that a higher water level and a faster erosion process causes the peak discharge to arrive earlier and become larger.
The investigators also considered that this is what contributed to the conclusion that the dimensionless peak discharge (
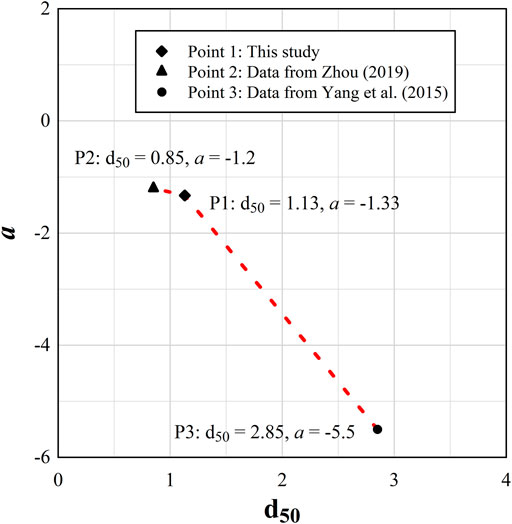
where a and b represent the fitting parameters, respectively. It was found that parameter a is correlated to d50. As observed in Figure 9, a decreased as d50 increased. This shows that the breach evolution of soil with a larger d50 would be more sensitive to the influence of the inflow rate. For example, for Curve3 in Figure 8, the
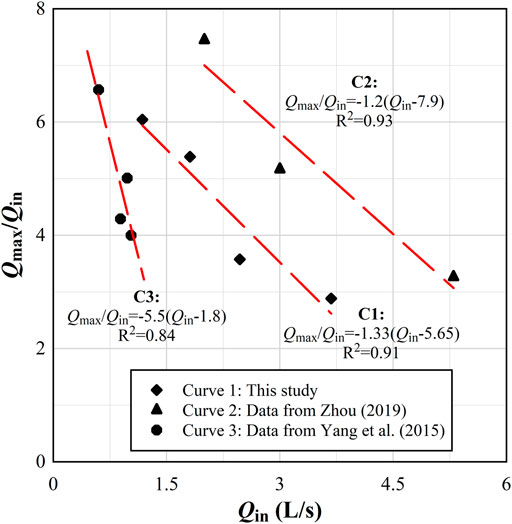
FIGURE 8. The relationship between Qin and Qmax/Qin. In order to avoid the influence of different dam heights, only four sets of data with the closest dam height are selected.
Effect of Qin and Hd on Qmax
Although Qmax increased with the increase in Qin in the whole process, it was observed in Figure 7 that when the inflow rate only changed within a small range and Qin increased, Qmax did not necessarily increase. This result was mainly caused by the randomness of friction and collision during the movement of soil particles during the sliding of the landslide. The short-term process of a landslide blocking the main channel to form a dam is shown in Figure 10. Dams with different shapes would lead to different subsequent processes. Hence, Qmax may not necessarily increase with the increase in inflow rate. However, the above phenomenon would only occur when the inflow rate changes in a relatively small range, because the dam height changes caused by randomness are limited. Therefore, when the inflow rate increases to a sufficient level, Qmax would increase with the increase in Qin.
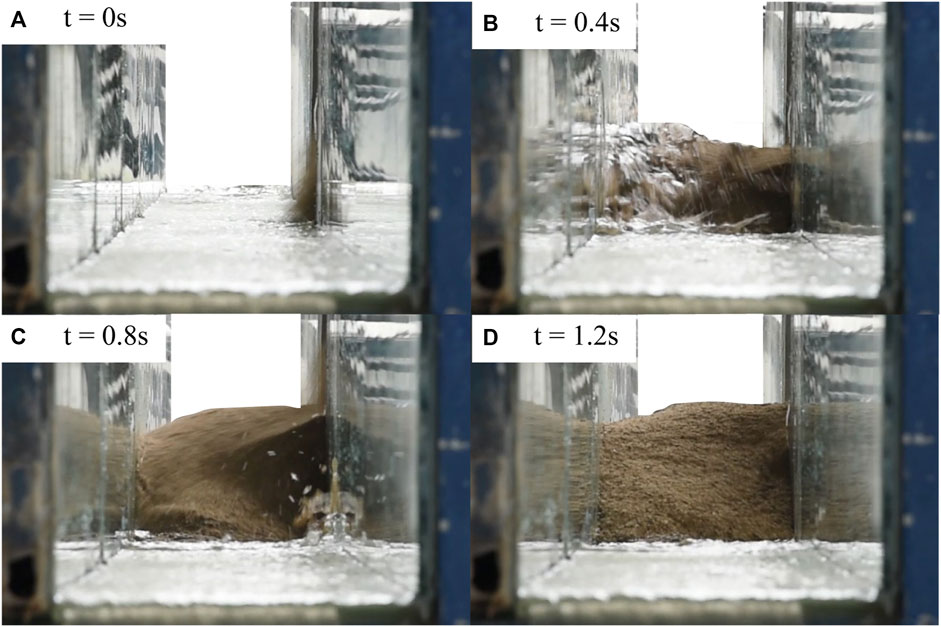
FIGURE 10. Short-term process of landslide blocking the main channel to form a dam: (A) At t = 0 s, the landslide is about to reach the channel; (B) At t = 0.4 s, the landslide just blocked the river; (C,D) the landslide dam is formed.
It would be relatively one-sided to only analyze the effect of Qin on Qmax. Furthermore, it is given that multiple linear regression can help to analyze the relationship between multiple independent variables and dependent variables (Andrews, 1974; Aiken et al., 2003; Uyanık and Güler, 2013). In order to explain the influencing factors of Qmax, multiple linear regression was used to determine the effect of Qin and Hd on Qmax. The analysis results are presented in Table 3, and the regression equation is presented in Eq. 7:
in this model, the interpretation degree of Qin and Hd to Qmax is R2=0.93, which is higher than the interpretation degree for Qin to Qmax. It is noteworthy that Qin and Hd can predict Qmax very well. The coefficient of Hd was 1.88, and the coefficient of Qin was 1.37, indicating that the increase in Qmax per unit of increase in Hd was higher, when compared to that of Qmax for each increase in unit of increase.
The absolute value of Beta indicates the order of importance of the independent variables. As presented in Table 3, it can be observed that the Beta value of Qin is slightly larger than the Beta value of Hd. This means that the independent value Qin contributes more to the model, when compared to Hd. Although the significance of the constant was slightly larger than 0.05, the significance p for all three variables was less than 0.06. This means that the independent variable coefficient is statistically significant. The variance increase factors VIF in the present model were all lower than 10, as shown in Table 3. This means that there are no multiple correlations among variables.
Conclusion
The whole process of river blockage and dam break under different hydrodynamic conditions was investigated in a flume model for a range of inflow rates between 1.18 and 5.16 L/s. The phenomenon and process of river blockage and dam break were preliminarily demonstrated and the mechanism of how the inflow rate influences the whole process was explored. The main conclusions are summarized as follows:
Four stages including ESBA, LSBA, ESBK, and ESBK, can be distinguished during the whole process of river blockage and dam break due to significant differences in hydraulic properties. ESBA occurs at the initial stage of blockage and gradually evolves to LSBA when the soil accumulated dam cut off the river. It develops to ESBK as the stored water overtops and expands breaches. Followed by LSBK, the breach flow decreases after the peak breach flow. Among these stages, ESBK is the most violent period, Breaking flooding occurs at this time, and its duration and peak flow are important factors in assessing the risk; LSBK is the final stage in the whole process during when the change of the dam body becomes relatively slow, and the breaking process slows down.
The impact of Qin on Qout was explained theoretically. As is expected, the increase in Qin will cause a relatively high upstream water level at the beginning of ESBK and accelerate the erosion process. Qmax shows an overall trend of increase with the increase of Qin while some contrarily decreasing Qmax cases exist when Qin slightly increases. The multiple regression analysis for Qin and Hd on Qmax explained the cases of irregularities may come from the inflow condition impact and randomness during the dam formation process.
The present study investigated the effect of Qin on Qmax/Qin. The development trend of Qin-Qmax/Qin in this paper is consistent with that in the previous dam break flume experiment. By analyzing the soil gradation adopted in previous flume model experiments, we found that the slope of the curve Qin-Qmax/Qin parameter shows a decreasing trend with the increase in the median particle size of the soil.
The multiple regression equation for Qin and Hd on Qmax was obtained. Qin and Hd fits the Qmax multiple regression extremely well, and the goodness of fit reached 93%. And we found that when compared to the increase in Qmax per increase unit Furthermore, the increase in Qmax per increase unit of Hd was higher, when compared to the increase in Qmax per increase unit.
Data availability statement
The original contributions presented in the study are included in the article/Supplementary Materials, further inquiries can be directed to the corresponding authors.
Author contributions
XW-L, NZ-P, DB-F, and MC-K contributed significantly to the conception of the study; MC-K, LY, and YH performed the experiment; NZ-P and MC-K contributed to analysis and manuscript preparation; XW-L and DB-F reviewed the original draft; NZ-P, MC-K, XW-L, DB-F, LY, and YH helped perform the analysis with constructive discussions.
Funding
This research was supported by the National Key Research and Development Plan of China (Grant No.2019YFC1510704-01) and CAS Light of West China Program (No. 2021160160).
Conflict of interest
The authors declare that the research was conducted in the absence of any commercial or financial relationships that could be construed as a potential conflict of interest.
Publisher’s note
All claims expressed in this article are solely those of the authors and do not necessarily represent those of their affiliated organizations, or those of the publisher, the editors and the reviewers. Any product that may be evaluated in this article, or claim that may be made by its manufacturer, is not guaranteed or endorsed by the publisher.
Abbreviations
a, a fitting parameter in Equation 6; B, partial regression coefficient; Beta, standard regression coefficient; d50, the particle size when the cumulative particle size distribution percentage reaches 50%; Hd, Dam height, the dam’s geometry is random due to particle collision and other reasons during the sliding movement of the soil, and there are slight differences in dam height under different initial parameters; kd, downstream slope ratio; ku, upstream slope ratio; Ld, Dam length; Lmax, The highest water level in front of the dam; P, Significance; Qin, Inflow rate, initial parameter manually set at the beginning of a test; Qmax, The maximum discharge of the breach; Std. Error, standard error; t0, The moment when the landslide slides into the main channel just after it stabilizes; t1, The moment when the flow just overtops; t2, After the dam breaks, the upstream water level just drops to 8 cm, which refers to the end of breaking; T, results of t-test on regression coefficients; Tb, Breaking time, the breaking time is the difference between t2 and t1, and the formula to calculate this is Tb = t2 - t1; Ts, Water storage time, the water storage time is the difference between the time when the water flow just overtops and the time when the landslide just stabilizes after sliding into the main channel, and the formula to calculate this is Ts = t1 - t0; Vl, the maximum volume of the dam lake; Vd, Dam volume; VIF, Variance Inflation Factor; Wd, Dam width.
References
Aiken, L. S., West, S. G., and Pitts, S. C. (2003). Multiple linear regression. Hand. book. Psychol., 481–507. doi:10.1007/978-1-59745-530-5_9
Andrews, D. F. (1974). A robust method for multiple linear regression. Technometrics 16, 523–531. doi:10.1080/00401706.1974.10489233
Awal, R. (2008). Study on landslide dam failure due to sliding and overtopping. Kyoto, Japan: Kyoto University.
Chae, B.-G., Park, H.-J., Catani, F., Simoni, A., and Berti, M. (2017). Landslide prediction, monitoring and early warning: A concise review of state-of-the-art. Geosci. J. 21, 1033–1070. doi:10.1007/s12303-017-0034-4
Chang, D., and Zhang, L. (2010). Simulation of the erosion process of landslide dams due to overtopping considering variations in soil erodibility along depth. Nat. Hazards Earth Syst. Sci. 10, 933–946. doi:10.5194/nhess-10-933-2010
Chen, H., Ruan, H., Chen, J., Li, X., and Yu, Y. (2022). Review of investigations on hazard chains triggered by river-blocking debris flows and dam-break floods. Front. Earth Sci. 10, 830044. doi:10.3389/feart.2022.830044
Chen, K.-T., Chen, X.-Q., Hu, G.-S., Kuo, Y.-S., and Chen, H.-Y. (2019). Effects of river flow velocity on the formation of landslide dams. J. Mt. Sci. 16, 2502–2518. doi:10.1007/s11629-018-5319-1
Chen, K.-T., and Wu, J.-H. (2018). Simulating the failure process of the Xinmo landslide using discontinuous deformation analysis. Eng. Geol. 239, 269–281. doi:10.1016/j.enggeo.2018.04.002
Coleman, S. E., Andrews, D. P., and Webby, M. G. (2002). Overtopping breaching of noncohesive homogeneous embankments. J. Hydraul. Eng. 128128, 8299–8838. doi:10.1061/(asce)0733-9429(2002)128:9(829)
Costa, J. E., and Schuster, R. L. (1988). The formation and failure of natural dams. Geol. Soc. Am. Bull. 100, 1054–1068. doi:10.1130/0016-7606(1988)100<1054:tfafon>2.3.co;2
Coussot, P., and Meunier, M. (1996). Recognition, classification and mechanical description of debris flows. Earth-Science Rev. 40, 209–227. doi:10.1016/0012-8252(95)00065-8
Cristofano, E. A. (1973). Method of computing erosion rate for failure of earthfill dams. Denver, CO, United States: US Department of the Interior, Bureau of Reclamation, Engineering and Research Center. 727.
Cruden, D. (2005). Debris-flow hazards and related phenomena. Can. Geotech. J. 42, 1723. doi:10.1139/t05-075
Fan, X., Dufresne, A., Siva Subramanian, S., Strom, A., Hermanns, R., Tacconi Stefanelli, C., et al. (2020). The formation and impact of landslide dams – state of the art. Earth-Science Rev. 203, 103116. doi:10.1016/j.earscirev.2020.103116
Fan, X., Rossiter, D. G., van Westen, C. J., Xu, Q., and Görüm, T. (2014). Empirical prediction of coseismic landslide dam formation: Coseismic landslide dam formation. Earth Surf. Process. Landforms 39, 1913–1926. doi:10.1002/esp.3585
Fread, D. (1988). BREACH, an erosion model for earthen dam failures. NOAA: Hydrologic Research Laboratory, National Weather Service.
Hanson, G., Cook, K., and Temple, D. (2002). Research results of large-scale embankment overtopping breach tests. ASDSO Annu. Conf.
Hanson, G. J., and Simon, A. (2001). Erodibility of cohesive streambeds in the loess area of the midwestern USA. Hydrol. Process. 15, 23–38. doi:10.1002/hyp.149
Höeg, K., Løvoll, A., and Vaskinn, K. (2004). Stability and breaching of embankment dams: Field tests on 6 m high dams. Int. J. Hydropower. Dams 11, 88
Jiang, X., Wörman, A., Chen, P., Huang, Q., and Chen, H. (2020). Mechanism of the progressive failure of non-cohesive natural dam slopes. Geomorphology 363, 107198. doi:10.1016/j.geomorph.2020.107198
Korup, O. (2004). Geomorphometric characteristics of New Zealand landslide dams. Eng. Geol. 73, 13–35. doi:10.1016/j.enggeo.2003.11.003
Li, D., Nian, T., Wu, H., Wang, F., and Zheng, L. (2020). A predictive model for the geometry of landslide dams in V-shaped valleys. Bull. Eng. Geol. Environ. 79, 4595–4608. doi:10.1007/s10064-020-01828-5
Li, L., Yang, X., Zhou, J., Zhang, J., and Fan, G. (2021). Large-scale field test study on failure mechanism of non-cohesive landslide dam by overtopping. Front. Earth Sci. 9, 660408. doi:10.3389/feart.2021.660408
Liu, W., and He, S. (2018). Dynamic simulation of a mountain disaster chain: Landslides, barrier lakes, and outburst floods. Nat. Hazards (Dordr). 19, 757–775. doi:10.1007/s11069-017-3073-2
Luo, J., Xu, W., Tian, Z., and Chen, H. (2019). Numerical simulation of cascaded dam-break flow in downstream reservoir. Proc. Institution Civ. Eng. - Water Manag. 172, 55–67. doi:10.1680/jwama.15.00088
Morris, M. W., Hassan, M. A. A. M., and Vaskinn, K. A. (2007). Breach formation: Field test and laboratory experiments. J. Hydraulic Res. 45, 9–17. doi:10.1080/00221686.2007.9521828
Nian, T., Wu, H., Li, D., Zhao, W., Takara, K., and Zheng, D. (2020). Experimental investigation on the formation process of landslide dams and a criterion of river blockage. Landslides 17, 2547–2562. doi:10.1007/s10346-020-01494-4
Peng, M., Ma, C.-Y., Chen, H.-X., Zhang, P., Zhang, L.-M., Jiang, M.-Z., et al. (2021). Experimental study on breaching mechanisms of landslide dams composed of different materials under surge waves. Eng. Geol. 291, 106242. doi:10.1016/j.enggeo.2021.106242
Peng, M., and Zhang, L. M. (2012). Breaching parameters of landslide dams. Landslides 9, 13–31. doi:10.1007/s10346-011-0271-y
Ruan, H., Chen, H., Wang, T., Chen, J., and Li, H. (2021). Modeling flood peak discharge caused by overtopping failure of a landslide dam. Water 13, 921. doi:10.3390/w13070921
Schmocker, L., and Hager, W. H. (2009). Modelling dike breaching due to overtopping. J. Hydraulic Res. 47, 585–597. doi:10.3826/jhr.2009.3586
Sheng-shui, C., Xu-shun, F., Qi-ming, Z., and Yun-hui, L. (2014). Centrifugal model tests and numerical simulations for break of earth-rock dams due to overtopping. Chin. J. Geotech. Eng. 36, 922–932. doi:10.11779/CJGE201405017
Singh, V. P., and Scarlatos, P. D. (1988). Analysis of gradual earth-dam failure. J. Hydraul. Eng. 1141141, 21–42. doi:10.1061/(asce)0733-9429(1988)114:1(21)
Tian, Z., Yang, H., Wang, W., and Cao, D. (2021). Numerical analysis of sand bed degrading and sediment transport rate under tailings dam break. Front. Earth Sci. 9, 686277. doi:10.3389/feart.2021.686277
Uyanık, G. K., and Güler, N. (2013). A study on multiple linear regression analysis. Procedia - Soc. Behav. Sci. 106, 234–240. doi:10.1016/j.sbspro.2013.12.027
Walder, J. S., Iverson, R. M., Godt, J. W., Logan, M., and Solovitz, S. A. (2015). Controls on the breach geometry and flood hydrograph during overtopping of noncohesive earthen dams: DAM-BREACH hydraulics and hydrographs. Water Resour. Res. 51, 6701–6724. doi:10.1002/2014WR016620
Wang, F., Bao, K., Huang, C., Liu, R., Han, W., Yi, C., et al. (2022). Distribution, characteristics, and research status of microplastics in the trunk stream and main lakes of the yangtze river: A review. China Geol. 5, 1–15. doi:10.31035/cg2022002
Wu, H., Nian, T., Chen, G., Zhao, W., and Li, D. (2020). Laboratory-scale investigation of the 3-D geometry of landslide dams in a U-shaped valley. Eng. Geol. 265, 105428. doi:10.1016/j.enggeo.2019.105428
Xu, F., Yang, X., Zhou, J., and Hao, M. (2013). Experimental research on the dam-break mechanisms of the jiadanwan landslide dam triggered by the wenchuan earthquake in China. Sci. World J., 1–13. doi:10.1155/2013/272363
Yang, Y., Cao, S., Yang, K., and Li, W. (2015). Experimental study of breach process of landslide dams by overtopping and its initiation mechanisms. J. Hydrodyn. 27, 872–883. doi:10.1016/S1001-6058(15)60550-9
Zhang, J., Wang, W., Tian, Z., and Li, Y. (2021). An investigation of the characteristics of dam-break flood in a confluence channel based on the lattice Boltzmann method. AIP Adv. 11, 045320. doi:10.1063/5.0045256
Zhao, T., Chen, S., Fu, C., and Zhong, Q. (2019). Centrifugal model test on the failure mechanism of barrier dam overtopping. KSCE J. Civ. Eng. 23, 1548–1559. doi:10.1007/s12205-019-0375-9
Zhong, Q., Wang, L., Chen, S., Chen, Z., Shan, Y., Zhang, Q., et al. (2021). Breaches of embankment and landslide dams - state of the art review. Earth-Science Rev. 216, 103597. doi:10.1016/j.earscirev.2021.103597
Zhou, G. G. D., Zhou, M., Shrestha, M. S., Song, D., Choi, C. E., Cui, K. F. E., et al. (2019a). Experimental investigation on the longitudinal evolution of landslide dam breaching and outburst floods. Geomorphology 334, 29–43. doi:10.1016/j.geomorph.2019.02.035
Keywords: landslide dam, inflow rate, breach discharge, dam geometry, river blockage, dam break
Citation: Niu Z, Meng C, Xu W, Di B, Long Y and Yang H (2023) Experimental study on whole process of river blockage and dam break under different hydrodynamic conditions. Front. Earth Sci. 10:977246. doi: 10.3389/feart.2022.977246
Received: 24 June 2022; Accepted: 28 September 2022;
Published: 10 January 2023.
Edited by:
Wen Zhang, Jilin University, ChinaReviewed by:
Ming Chang, Chengdu University of Technology, ChinaGuisheng Hu, Chinese Academy of Sciences (CAS), China
Copyright © 2023 Niu, Meng, Xu, Di, Long and Yang. This is an open-access article distributed under the terms of the Creative Commons Attribution License (CC BY). The use, distribution or reproduction in other forums is permitted, provided the original author(s) and the copyright owner(s) are credited and that the original publication in this journal is cited, in accordance with accepted academic practice. No use, distribution or reproduction is permitted which does not comply with these terms.
*Correspondence: Weilin Xu, eHV3bEBzY3UuZWR1LmNu
†These authors have contributed equally to this work
 Zhipan Niu1,2†
 Chuke Meng