- Key Laboratory of Mountain Hazards and Earth Surface Processes, Institute of Mountain Hazards and Environment, Chinese Academy of Sciences, Chengdu, China
Distribution of landslide is controlled by various causative factors that have different impacts on the occurrence of landslide in different regions. Using one single model to build the hazard assessment is not enough to fully reflect the spatial differences of landslide controlling factors especially for large area. Landslide hazard assessment based on zonation was therefore proposed in this study with an attempt to take effective measures to address this problem. The China–Pakistan Economic Corridor was taken as the study area where landslide hazard assessment was carried out. Based on the features of geological structure, topography, and climate, the study area was divided into three zones. The controlling factors were further analyzed by the geographical detectors method. It was found that the main controlling factors for landslides in these three zones were related to the site’s topography (altitude, slope gradient, and relief amplitude), land use, and distance to an earthquake epicenter. Furthermore, different factors for landslide hazard assessment were selected based on the result of a controlling factor analysis. An artificial neural network model was employed to build the hazard assessment models, and hazard assessment maps were generated. Validations were conducted, showing that the accuracy of hazard assessment maps by zones was higher than that by the whole study area, despite there was no significant difference during the modeling process.
Introduction
The China–Pakistan Economic Corridor (CPEC) is an important geographical linkage that strengthens the transportation, energy, and communication between China and Pakistan. Due to special geological, geomorphic, and climatic conditions, geo-hazards are frequent and widely distributed along the corridor, causing disasters to major infrastructure establishments and projects. For example, the Karakoram Highway (KKH) constructed between 1966 and 1979 was often broken due to highly frequent geo-hazards until 2007. On 8 October 2005, a 7.6 magnitude earthquake in Northern Kashmir triggered a large number of landslides which caused damages to the KKH (Sato et al., 2007; Aydan et al., 2009). Subsequently, in 2010, a huge landslide occurred in Attabad village and formed a large landslide lake, disrupting the traffic for 5 years (NDMA, 2010). Therefore, it is necessary to carry out landslide hazard assessment for this area.
Landslide hazard assessment at the regional scale was carried out for CPEC in this research. These regional-scale landslide hazard assessment methods include expert experience method (Ercanoglu et al., 2008; Thiery et al., 2014), statistical analysis (Lee and Min, 2001; Demir, 2018; Barella et al., 2019), and physical-based model (van Beek and van Asch, 2004; Xie et al., 2004; Rana and Babu, 2022). In recent years, data mining and machine learning methods, such as artificial neural network (ANN) (Yilmaz, 2009; Liu, 2010), logistic regression models (Xu et al., 2013; Meten et al., 2015; Zhang et al., 2019a), and support vector machine (SVM) (Su et al., 2015; Zhang et al., 2019b) were widely used to assess landslide hazard and showed satisfactory results in practice.
There are already plethora of studies on earthquake and rainfall-triggered landslide inventories, as well as related landslide risk and hazard assessments, that have been carried out in the region, mainly in Pakistan (Dunning et al., 2007; Khattak et al., 2010; Ahmed and Rogers, 2015; Basharat et al., 2016; Khan et al., 2019; Imtiaz et al., 2022). In recent years, landslide-oriented research has been extended to the entire CPEC, especially for landslides along the KKH (Bacha et al., 2018; Rashid et al., 2020; Chang et al., 2021; Hussain et al., 2021; Maqsoom et al., 2022; Su et al., 2021). Hazard and risk assessments of some large-sized landslides were also carried out in this area, such as the Attabad landslide (Chen et al., 2017), where landslide dam breach and its hazards to the KKH project construction site downstream was discussed.
Generally, landslide hazard assessment only builds one model for one area. However, for a regional scale of landslide hazard assessment, the characteristics of landslide and causative factors can be spatially different due to the large size of the study area. One hazard model is thus not able to represent the situation of landslides. In the case of CPEC, for example, landslides are widely distributed in the northern high mountains including the Hindu Kush Mountains, the Himalayas, and the Karakoram Mountains. These regions are characterized by complex geological structures, steep terrains, and intense glacier activities. In addition, landslides also occur in the Sulaiman Mountains, Central Barhui Range, Kirthar Range, and Central Makran Range in the west and southwest of CPEC. However, these landslides are small due to gentle slopes and low precipitation. Hence, the study area was first divided into different zones to account different environmental background factors and distribution of landslide. Then landslide hazard assessment models were built for each zone. In doing so, the accuracy of the regional-scale landslide hazard assessment of this study was improved.
Study area
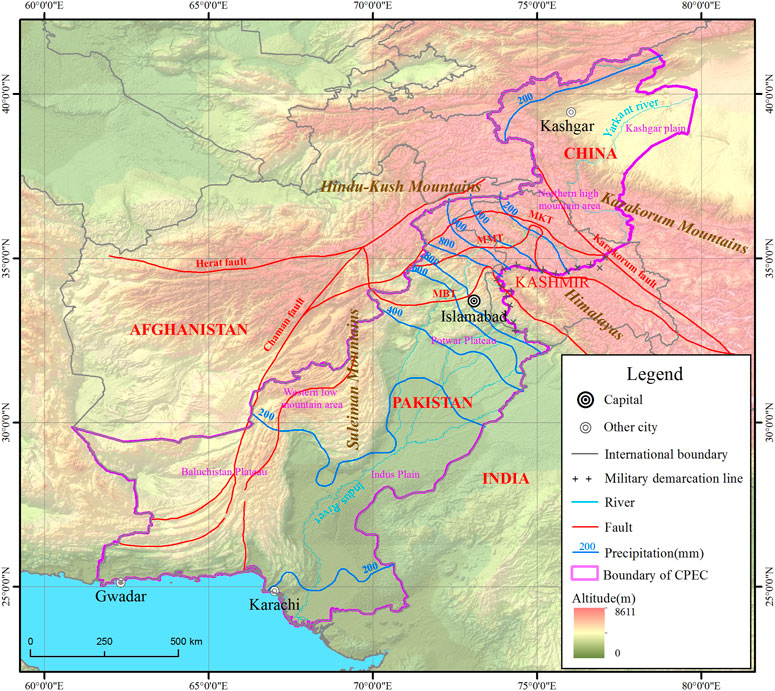
Spanning two countries, the study area of CPEC starts from Kashgar in Xinjiang Uygur Autonomous Region of China in the north and reaches Gwadar in Pakistan in the south. It is adjacent to Afghanistan to the west and India to the East. With an area of as large as 1.06 million square kilometers (Figure 1), CEPC has a large area with a wide north–south span with different environmental and landslide characteristics.
Geological structure
CPEC passes through the western edge of the Tibetan Plateau and is located at the junction of the Western Himalayan and Pamir syntaxes, which is one of the most tectonically active regions worldwide (Kumar et al., 2013). The main active faults of CPEC include the Kashir River Fault, Tashikurgan Fault, Karakorum Fault, Main Himalayan Thrust (MHT), and Pamir Frontal Thrust. The structural deformation is mainly concentrated in the Karakoram strike-slip fault zone and the Tashikurgan Fault (Martin, 2017).
Geomorphology
The landform type of CPEC from north to south include Kashgar Plain, northern high mountain area, western low mountain area, Baluchistan Plateau, Potwar Plateau, and Indus Plain (Yang and Liu, 2005). The northern high mountain area covers the Karakoram Range and Himalayan and Hindu Kush ranges, with K2 and Nanga Parbat, two mountain peaks of higher than 8000 m located in this region. The Baluchistan Plateau, located in the western part of the corridor, is mainly composed of north–south parallel ranges with an average altitude above 3000 m, and the plateau is at an altitude between 500 and 2000 m. The Potwar Plateau is bounded by Hazara Mountain and Pirpanjai Mountain in the north; Salt range in the south; and Indus River and its tributary Jelum River in the west and east, respectively. The area of the Potwar Plateau is 4,350 km2 and the altitude is around 500 m (Xu et al., 1982; Miller and Craig, 1996).
Climate
The climate of CPEC is affected by the interaction of Westerly and Southwest monsoons. Most of the area has an arid and semiarid climate, except the western coast where the climate is tropical monsoon. Annual precipitation increases first and then decreases from south to north. The maximum annual precipitation is exceeding 1200 mm and the minimum rainfall is less than 100 mm (Yu et al., 2021).
Data source and methodology
Data source
Causative factors
Based on the distribution and characteristics of landslides in this region, causative factors (e.g., topography, geology, and land use) and triggering factors (e.g., earthquake and rainfall) were considered for the landslide hazard assessment in this study. Altitude, slope gradient, slope aspect, relief amplitude, distance to fault, distance to epicenter, and annual precipitation were selected as alternative landslide hazard assessing factors.
Topographic factors including slope gradient, slope aspect, and relief amplitude were calculated based on SRTM DEM, with spatial resolution of 30 m. Fault data of CPEC were obtained from the Geological Map of North Pakistan and Adjacent Areas of Northern Ladakh and Western Tibet with a scale of 1:650,000 (Searle and Asif Khan, 1997; Yaseen et al., 2021), based on which the distance to fault was calculated. The average annual precipitation was calculated on historical monthly weather data from year 2010 to 2018 by WorldClim with resolution of 2.5 min (Harris et al., 2014). The historical seismic data of CPEC were obtained from the USGS Earthquake Disaster Project, including epicenter location, magnitude, and occurrence time of earthquakes with magnitude above three since 1960, based on which distance to epicenter was calculated. Land use data were obtained from global land use data of Tsinghua University in 2017 with resolution of 10 m (Gong et al., 2019). All these factors were rasterized with a grid size of 0.5 × 0.5 km.
Landslide inventory
A dataset including 2045 rockfalls and landsides that occurred from 1970 to 2020 was utilized in this research (Yi et al., 2021). Landslide inventory mapping was supported by the project of “Comprehensive Investigation and Assessment of Natural Disasters along the China–Pakistan Economic Corridor”. High resolution images from Google Earth were utilized to identify the location and boundary of landslide by the artificial interpretation method in the study area, and then a field investigation was conducted along the Karakoram Highway (KKH) in 2019 to validate the landslide data and obtain more information including landslide triggers, volumes, height differences, and so forth.
Methodology
Geographical detectors method
The geographical detectors method (Wang et al., 2010) was employed to detect the controlling factors for landslides in different regions. Geographical detectors are a set of statistical methods utilized to detect the spatial heterogeneity of geographical phenomena and find the driving forces. The geographical detectors method is based on the assumption that if an independent variable has an important influence on a dependent variable, the spatial distribution of the independent variable and the dependent variable should be similar. In this study, the differentiation and factor detection were utilized to detect the spatial differentiation of dependent variable Y (numbers for landslide), so as to probe how strong the influence of independent variable X (causative factors for landslide) on Y, which was measured by q value with the equation:
In this equation, h = 1...; L is the classification or partition of variable Y or factor X; Nh and N are the number of classification and the number of units in the study area, respectively;
Artificial neural networks
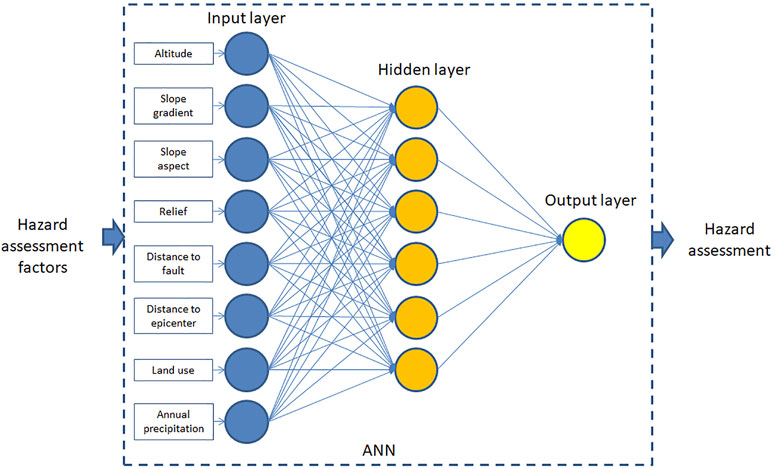
Artificial neural networks (ANN) have also been utilized for landslide hazard assessment (Figure 2). The artificial neural network model is based on the principle of multilayer perceptron, which is composed of three layers of neurons: input layer, hidden layer, and output layer. Neurons are the basic components of neural networks, and the connection between neurons is realized by synaptic weights wij. Generally, the greater the value of wij, the higher contribution given by the factor. A positive value of wij indicates that the factor is positively correlated with the hazard assessment result, otherwise negatively.
In this study, an open-source GIS-integrated tool, r.landslide was used to carry out the hazard assessment based on the ANN model in the GIS software named Geographic Resources Analysis Support System (GRASS) (Bragagnolo et al., 2020; GRASS Development Team, 2017). The tool was written in Python language and works on the ANN model and landslide database. The sigmoid activation function, defined in Eq. 4, was used in r.landslide to depict a balance between linear and non-linear behaviors.
In this equation, x refers to the input value of the intermediate or output layer neuron after weight-bearing by the synaptic weights; β is the slope parameter; and sigmoid functions with different slopes are obtained by assigning varied β values.
Training of ANNs was performed by using the back-propagation algorithm, which the weight is calculated by evaluating the error between the response value obtained by propagation and the known true value (Haykin, 1999). During the training process, each sample is given a corresponding output value O, which is compared with the reference value OD. T stands for the transpose, which defines the error function by Eq. 5:
Moreover, Δwij is the increment of synaptic wij, and it is calculated by Eq. 6:
where α is the learning rate which controls the adjustment strength related to the synaptic weights. The objective of the back-propagation algorithm is to adjust the synapse weights so that the error function E is minimized during the training process.
Integrated natural zonation
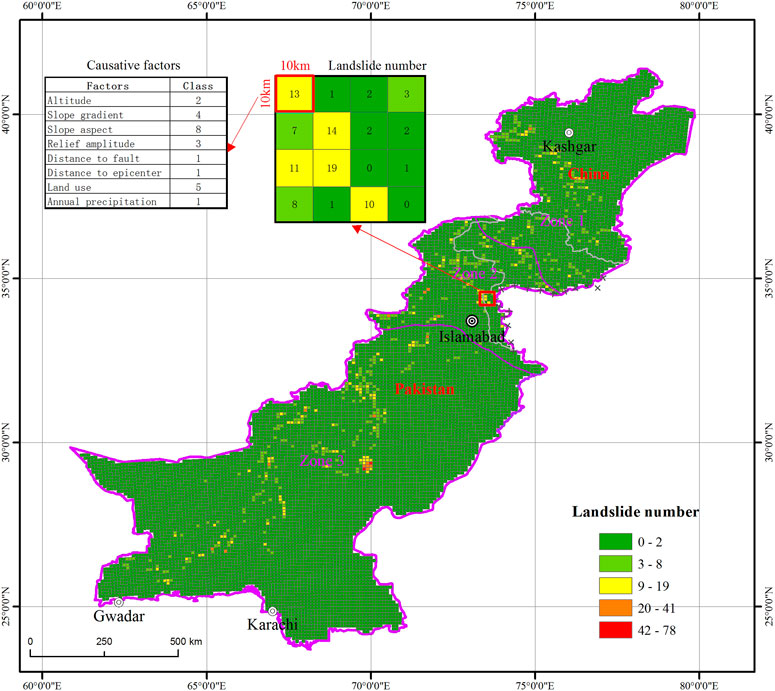
An integrated natural zonation was carried out based on mountain ranges, main fault systems, and precipitation in this research. The study area was divided into three zones (Figure 3; Table 1). Zone 1 is located in the northernmost of CPEC, where the topography is mainly dominated by the Karakoram Mountains with an annual precipitation less than 200 mm. The Main Karakoram Thrust and Main Mantle Thrust are the main fault systems in this area. In Zone 2, the mountains include the Hindu Kush and the Himalayas, and the main fault is the Main Boundary Thrust. This region has the highest annul precipitation between 200 and 1600 mm. Zone 3 covers the southern part of CPEC, with the Sulaiman Mountains, Central Barhui Range, Kirthar Range, and Central Makran Range located in this region. The main faults in this zone are the Chaman Fault and Zhob Valley Thrust (ZVT). The annual rainfall in this region is less than 500 mm. The quantities of landslides are counted by zones. From the landslide inventory, 37.4, 20.4, and 42.3% landslides fall in Zone 1, Zone 2, and Zone 3, respectively.
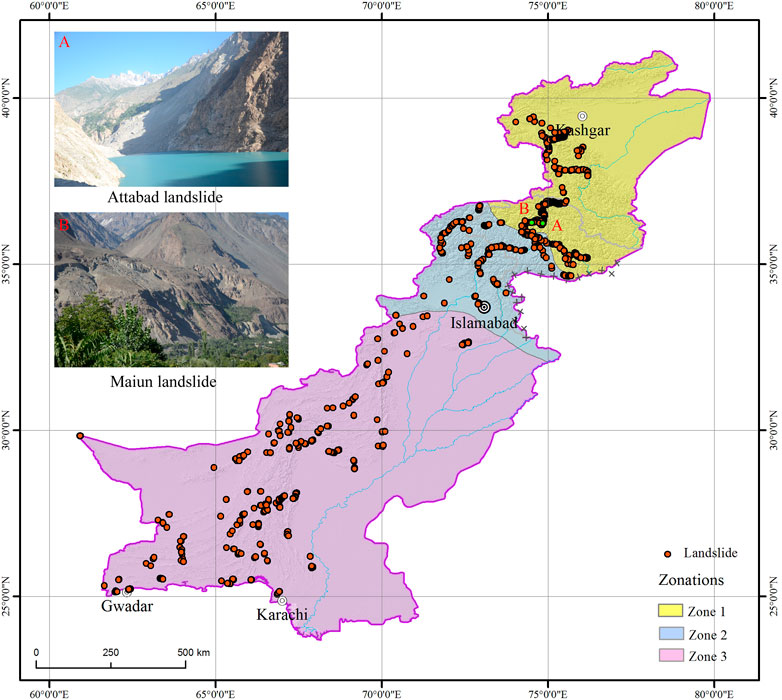
FIGURE 3. Zonation in CPEC [(A) Attabad landslide with coordinates of N 36°18'48.66", E 74°49'6.43"; (B) Maiun landslide with coordinates of N 36°14'34.71", E 74°25'11.98"].
Controlling factors of landslide distribution
Causative factors
Landslide causative factors are chosen as the parameters of the hazard assessment model. At present, there is no unified causative factor system for landslide hazard assessment. Mostly, researchers select landslide causative factors through field investigation and characteristics analysis of landslide distribution in the study area. In this study, landslide triggering conditions and environmental background conditions are considered. Precipitation and earthquake were mainly considered as the triggering conditions, and geology, topography, and land cover were considered as the environmental background conditions. Finally, a total of eight factors were selected as landslide causative factors.
Classifications were carried out on eight causative factors: altitude (x1), slope gradient (x2), slope aspect (x3), relief amplitude (x4), distance to fault (x5), distance to epicenter (x6), land use type (x7), and annual precipitation (x8) (Figure 4). In specific, the altitude was classified into six classes by an interval of 1000m; and the slope gradient was classified into six classes by an interval of 10°.
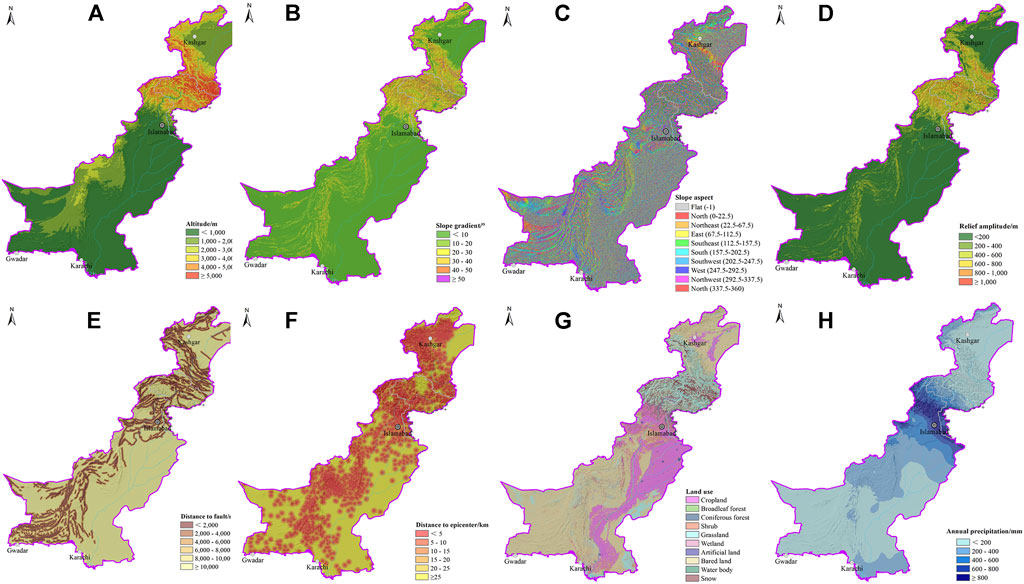
FIGURE 4. Landslide hazard assessment factors of CPEC [(A) altitude; (B) slope gradient; (C) slope aspect; (D) relief amplitude; (E) distance to fault; (F) distance to epicenter; (G) land use; and (H) annual precipitation].
According to the statistics of the area for each factor classification and landside quantities, it can be seen that the environmental conditions and distribution of landslides are different in three zones. In terms of altitude factor (Figure 5A), in Zone 1, there is a large area with the altitude between 1000 and 2000 m. The altitude in Zone 2 is mostly below 5000 m. The altitude of Zone 3 is mostly below 3000 m, and the proportion of the area with an altitude less than 1000 m is especially high, accounting for almost 80%. There are also significant differences for the distribution of landslides. In Zone 1, landslides are most distributed in the area with an altitude of 2000–3000 m, while in Zone 2, landslides are mostly distributed in the altitude of 1,000–2000 m. In Zone 3, landslides are mainly distributed in the area with an elevation less than 1000 m.
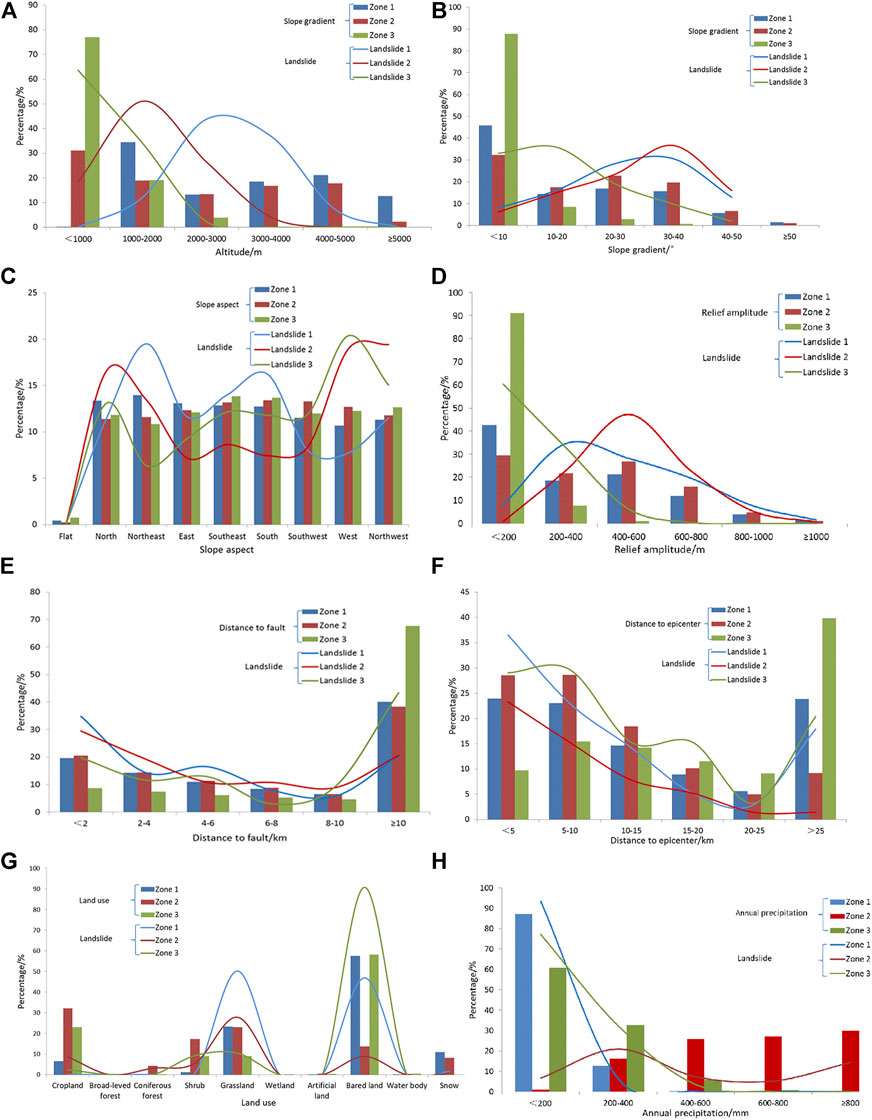
FIGURE 5. Classification of different factors and distribution of landslides in each zone [(A) altitude; (B) slope gradient; (C) slope aspect; (D) relief amplitude; (E) distance to fault; (F) distance to epicenter; (G) land use; and (H) annual precipitation).
Slope gradient is considered as one of the most significant factors for landslide. If the slope gradient is larger than the natural angle of repose of the substrate, landslide may occur when there is no enough cohesion (Kamp et al., 2008). Proportions of slope gradient divisions are consistent in Zone 1 and 2, but different in Zone 3. The distribution of landslides also shows the same tendency. In Zone 1 and 2, more landslides are distributed in the area with a slope gradient of 30°–40°, while in Zone 3, more landslides tend to be distributed in areas with a slope gradient of 10°–20°(Figure 5B). The proportions of slope aspect in different classes are highly consistent in each zone, but the proportions of landslides distributed in slope aspect divisions are different in three zones (Figure 5C).
The relief amplitude factor represents the gravitational potential energy of the slope. The greater relief amplitude value is, the greater the gravitational potential energy of the slope will be, which may cause higher susceptibility and large scales of landslides. Proportions of relief amplitude are similar in Zone 1 and Zone 2, but there is a big difference in Zone 3, where the proportion of relief amplitude with a value less than 200 is particularly high. The correlation between landslides and relief amplitude is explained as, there are large numbers of landslides distributed in the area with relief amplitude of 400–600 m in Zone 2, more landslides distributed in the area with relief amplitude of 200–400 m in Zone 1, but in Zone 3 most landslides are distributed in the area with relief amplitude of less than 200 m (Figure 5D).
The distance to faults, whether area proportion or landslide quantity, are consistent in the three zones (Figure 5E). The distance to an earthquake epicenter reflects the influence of the earthquake, and the proportion of the earthquake-affected areas in Zone 2 is higher.
Earthquake is one significant trigger for landslides. Earthquake with big magnitude can cause a large number of co-seismic landslides, and it can also destroy the stability of slope and lead more sliding after the shake. Historical earthquake epicenters were concentrated in north–west of CPEC in China, North high mountain area and western low mountain area in Pakistan.
Generally, the quantity of landslides shows a gradual decreasing trend against the distance from the earthquake (Figure 5F). Since land use types of bare land and grassland cover large areas in CPEC, therefore more landslides are distributed in the area of these land use type (Figure 5G). Finally, annual precipitation is low in Zone 1 and Zone 3. Hence, the effect of annual precipitation on landslides is not significant in both zones. However, the number of landslides is increased in Zone 2 as a result of the zone’s higher annual precipitation (Figure 5H).
Controlling factor analysis
The landslide controlling factor was defined as the most significant causative factors, which affect the distribution of landslides at the regional scale. The landslide controlling factor analysis was carried out based on landslide inventory and causative factors. First, the study area was divided into small units by the size of 10 × 10 km (Figure 6). Then the number of landslides was counted in each unit of the eight causative factors that are associated with landslide occurrence. Finally, the q value was calculated by geographical detectors, and the main controlling factors were analyzed for landslide in each zone.
Results showed that the controlling factors are different in each zone (Table 2). Topographical factors including altitude, slope gradient, and relief amplitude are controlling factors in Zone 1, especially for the altitude factor. In addition, land use factor also plays a significant role on the distribution of landslides. The q values for all these four factors are larger than 0.04. In Zone 2, altitude is also the most significant factor for landslide, followed by relief amplitude and slope gradient. But the q values of these three factors are smaller than in Zone 1. Large differences for controlling factors are showed in Zone 3, where the distance to the epicenter is the most significant factor, which means earthquake affects strongly on the occurrence and distribution of landslide in this region. Other main controlling factors are topographical factors including relief amplitude, altitude, and slope gradient in Zone 3. But all the q values in this region are smaller than either Zone 1 or Zone 2. When it comes to the entire study area, topographical factors including altitude, relief amplitude, and slope gradient are the top controlling factors for landslide, followed by the distance to the epicenter.
Landslide hazard assessment
Hazard assessment
Landslide hazard assessment was conducted for each zone. In order to make a contrast, landslide hazard assessment in the whole study area was also carried out.
Based on the analysis of main controlling factors, the top six factors ranked by q values were selected as the hazard assessment factors in different zones. Altitude, slope gradient, land use, relief amplitude, distance to fault, and distance to epicenter were selected for Zone 1; altitude, relief amplitude, slope gradient, annual precipitation, distance to fault, and land use were selected for Zone 2; and distance to epicenter, altitude, relief amplitude, slope gradient, annual precipitation, and land use were selected for Zone 3. For the whole study area, altitude, relief amplitude, slope gradient, distance to epicenter, distance to fault, and annual precipitation were selected as the hazard assessment factors.
The artificial neural network is defined as a supervised classification model that determines part of landslide samples that need to be selected to train and build the hazard model. In this study, the landslide inventory was divided into two parts in each zone. In addition, 80% of landslides were selected randomly for building the model, and the other 20% samples were taken for validation. The hazard assessment models of landslides were modeled by using the artificial neural network method based on r.slope. Proportions of the dataset for the training, validation, and test of the ANN were 70, 15, and 15%, respectively. A three-layer neural network was used to train the data. The input layer had six neurons, the hidden layer had 14 neurons, and the number of iterations was 200.
Finally, landslide hazard assessment maps were generated by the hazard assessment models for the three zones as well as the whole region (Figure 7). The value of hazard assessment map ranged from 0 to 1, and it was classified into four classes by the intervals of 0–0.25, 0.25–0.5, 0.5–0.75, and 0.75–1. The hazard levels were defined as very low, low, high, and very high. Areas of very high and high landslide hazard levels in three zones were very similar, accounting for 17.2, 17.4, and 17.6%, respectively. But for the hazard assessment map by the whole region, the proportion of very high and high landslide hazard levels reaches 23.6%. Obvious differences could be recognized between two assessment maps, especially in Zone 3. Areas near the earthquake epicenters showed very high or high landslide hazard level.
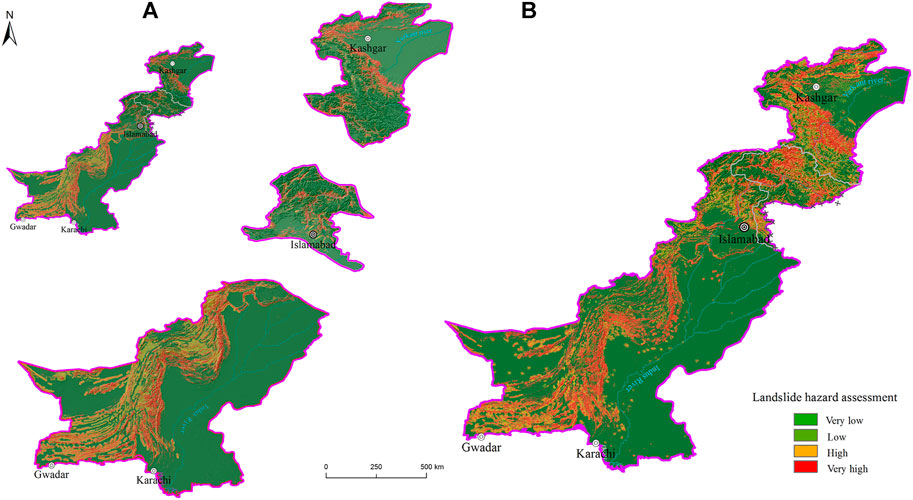
FIGURE 7. Landslide hazard assessment maps [(A) landslide hazard assessment map by zones; (B) landslide hazard assessment map of the whole region].
Landslide hazard assessment model validation
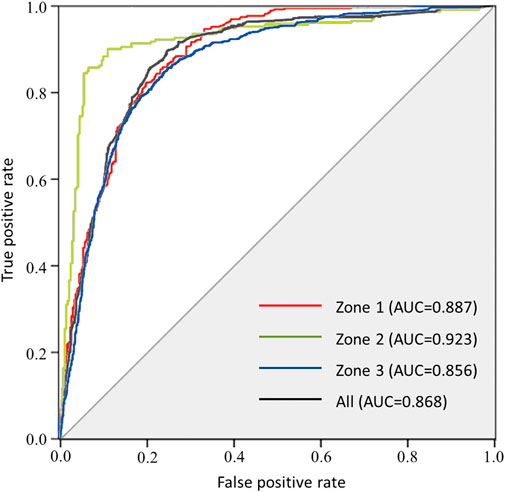
The receiver operating characteristic (ROC) curve was utilized to validate the landslide hazard assessment models for three zones and the whole region, and the area under curve (AUC) value was calculated for each curve to compare the accuracy of each model quantitatively (Figure 8). The result shows that all the AUC values were greater than 0.5, indicating that all these models were effective. A larger AUC value indicates a higher accuracy of the model. The AUC values of landslides for three zones and the whole region were very similar.
Validation of landslide hazard assessment maps
By using the 20% samples of landslides not involved in the model construction, the proportion of hazards located in different hazard zone levels was counted to validate the hazard assessment results. If more landslide samples are located in high and very high hazard level region, it means that the hazard assessment map has a higher accuracy (Table 3).
Comparing the accuracy level of landslide hazard assessment maps in three zones and the whole region, some phenomena were found: 1) the accuracy of hazard assessment by zone was higher than that of the whole region. Accuracies of hazard assessment in three zones were 87.6, 90.4, and 85.6% respectively, and average accuracy in the whole region could reach 87.3%, but the accuracy for the whole region by one landslide hazard model was only 84.4%. 2) Compared with Zone 1 and 2, the accuracy of hazard maps for Zone 3 was relatively low.
The validation of the landslide hazard assessment map of Zone 3 showed the lowest accuracy (Figure 9). Not as same as high mountains and deep valleys in Zone 1 and Zone 2, the topography in Zone 3 is much gentler. Misevaluated landslides are mostly located in the front edge of the slope area or on the sides of the gullies. Due to low precision of topographic factors, especially slope gradient, relief amplitude, the micro-geomorphology and characteristics of these areas could not be described precisely. Therefore, the landslide hazard could not be incorrectly assessed in these areas. In addition, the area of Zone 3 is the largest during three zones, and the landslide quantity is also the largest one. Hence, the effect on landslide by causative factors on landslide may vary in different areas of this zone.
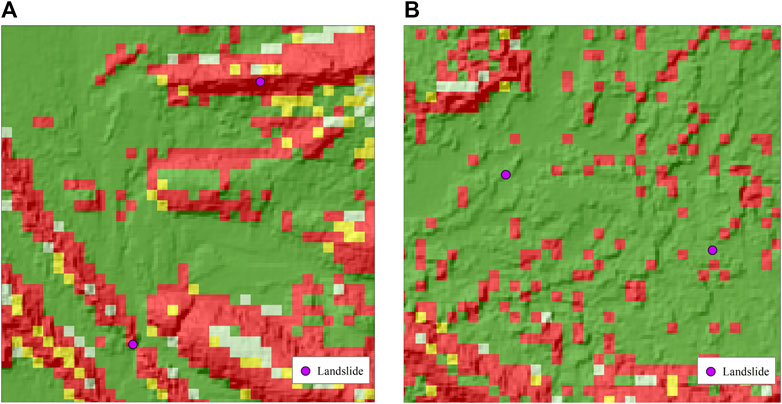
FIGURE 9. Validation landslide samples [(A) correctly assessed landslide; (B) wrongly assessed landslide].
Results analysis
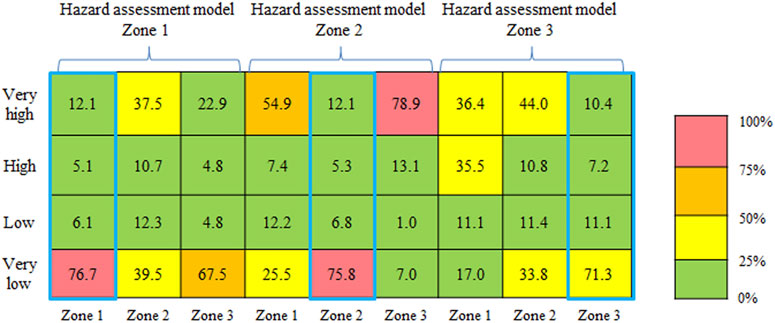
The landslide hazard assessment models were applied to different zones to analyze the applicability for each model (Figures 10, 11). Landslide hazard model built in Zone 1 was applied to Zone 2 and Zone 3. The landslide hazard map shows that the proportion of very high hazard zones in these two zones were much larger than in Zone 1, reaching more than three times and nearly two times, respectively. By using the landslide hazard model built in Zone 2 to Zone 1 and Zone 3, the proportion of very high hazard area in Zone 1 and Zone 3 exceeded 50% due to the influence of precipitation, which was in fact inconsistent with the situation of landslide activities. The landslide hazard model built in Zone 3 was applied to Zone 1 and Zone 2, and the proportion of very high hazard area was 36.4 and 44.0%, respectively, which was also much higher than the proportion of very high hazard in Zone 3.
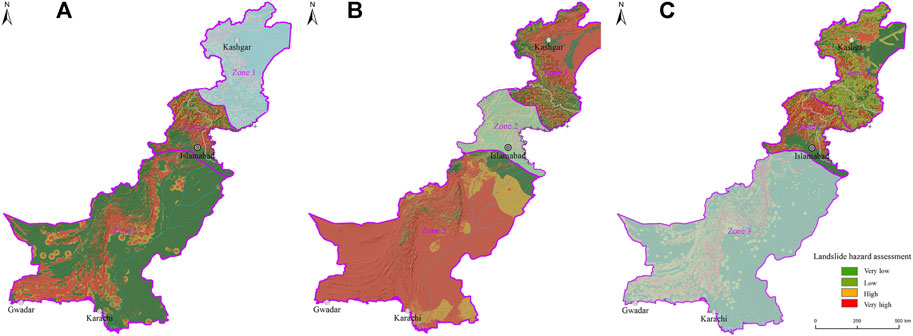
FIGURE 10. Landslide hazard maps base on different models [(A) landslide hazard model built in Zone 1 applied in the whole region; (B) landslide hazard model built in Zone 2 applied in the whole region; and (C) landslide hazard model built in Zone 3 applied in the whole region].
The accuracy level of landslide hazard assessment result was compared by using landslide validation samples (Table 3). The landslide hazard assessment model built in Zone 1 had a very high accuracy in Zone 2, while a very low accuracy in Zone 3. The landslide hazard assessment model built in Zone 2 had a very high accuracy in both Zone 1 and 3. However, it was due to the extremely large proportion of a very high hazard level area in Zone 1 and 3, the high accuracy in both zones was of no practical significance. The landslide hazard assessment model built in Zone 3 had a low accuracy in both Zone 1 and Zone 2.
Therefore, it suggests that the landslide hazard model should be built within the subzones of a study area, which suits for specific environmental backgrounds of landslides in the region. If the model is applied to other regions, especially for the places that have significant differences from the modeling region, it could lead to decreased landslide evaluation accuracy, and even erroneous results.
Conclusion
From this research, the following conclusions were drawn.
1) The controlling factors for landslides vary in different area of CPEC. Considering diverse features of geological, topography, and precipitation, the study area was divided into three zones. Geographical detectors were utilized to analyze the controlling factors for landslides in different zones. Landslide controlling factors were very similar in Zone 1 and Zone 2. Topographical features including altitude, slope gradient, and relief amplitude influenced the occurrence of landslides significantly. In addition, the land use type played an important role in Zone 1 rather than in Zone 2. In Zone 3, the distance to epicenter was the most significant factor, which was different with Zone 1 and Zone 2.
2) Landslide hazard assessments were carried out by using the ANN method in three zones and the whole region based on 80% random landslide samples. The ROC curve was utilized to validate the accuracy of hazard assessment modeling. All AUC values of ROC curve were similar and greater than 0.5, which indicated that all these models were valid. The accuracy of landslide hazard maps of all three zones and the whole region was validated by the 20% samples not involved in the modeling. Results show that the accuracy level of landslide hazard assessment maps by zones was higher than by the whole region. Therefore, hazard assessment by subzones is a more advantageous approach than that of the whole region.
3) Landslide hazard model built by ANN within the subzones has a high accuracy. However, if it is applied to other regions, especially for the places that have significantly different environmental backgrounds from the modeling region, it could lead to lower accuracy, even bringing erroneous results.
4) In addition to landslides, CPEC suffers from multiple natural hazards, such as mudslides, avalanches, and glacial lake outburst floods (GLOF). It is particularly important to carry out a comprehensive multi-hazard assessment on top of the single-hazard assessment. First, it is especially crucial to clarify the relationship between different types of hazards. For example, Cees van Westen et al. (2014) analyzed the interrelationships between different types of mountain hazards, which are broadly summarized into three types: 1) different types of mountain hazards induced by the same trigger; 2) one hazard provides development conditions for another hazard to occur; and 3) hazard chains or cascading hazards, in which one hazard causes another. Second, the different types of mountain hazards determine that the units for their evaluation cannot simply use uniform-sized pixel cells. Some scholars have proposed the concept of slope units as the basic unit for multi-hazard assessment. Susceptibility and risk of different types of hazards could then be carried out for each slope unit (Alvioli et al., 2016; Lombardo et al., 2020). This method can also be applied to regional scale studies such as CPEC, which may be useful for integrated multi-hazard assessments.
Data availability statement
The datasets presented in this study can be found in online repositories. The names of the repository/repositories and accession number(s) can be found at: http://www.csdata.org/p/634/.
Author contributions
ZJ in charge of landslide hazard modeling and paper writing; GY made the zonation and analyzed the controlling factors of landslide; LY optimized the methodology and improved the manuscript; ZQ, JY, and CH carried out the landslide field investigation; and CX designed the methodology of the research.
Funding
This research was supported by the Special Foundation for National Science and Technology Basic Research Program of China: Comprehensive Investigation and Assessment of Natural Disasters along the China–Pakistan Economic Corridor, Topic 6: Integrated Assessment and Data Sharing Platform for Natural Disasters (2018FY100506), and the International Science & Technology Cooperation Program of China (2018YFE0100100).
Conflict of interest
The authors declare that the research was conducted in the absence of any commercial or financial relationships that could be construed as a potential conflict of interest.
Publisher’s note
All claims expressed in this article are solely those of the authors and do not necessarily represent those of their affiliated organizations, or those of the publisher, the editors, and the reviewers. Any product that may be evaluated in this article, or claim that may be made by its manufacturer, is not guaranteed or endorsed by the publisher.
References
Ahmed, M. F., and Rogers, J. D. (2015). Regional level landslide inventory maps of the Shyok River watershed, Northern Pakistan. Bull. Eng. Geol. Environ. 75, 563–574. doi:10.1007/s10064-015-0773-2
Alvioli, M., Marchesini, I., Reichenbach, P., Rossi, M., Ardizzone, F., Fiorucci, F., et al. (2016). Automatic delineation of geomorphological slope units with <tt>r.slopeunits v1.0</tt> and their optimization for landslide susceptibility modeling. Geosci. Model. Dev. 9, 3975–3991. doi:10.5194/gmd-9-3975-2016
Aydan, Ö., Ohta, Y., and Hamada, M. (2009). Geotechnical evaluation of slope and ground failures during the 8 October 2005 Muzaffarabad earthquake, Pakistan. J. Seismol. 13, 399–413. doi:10.1007/s10950-008-9146-7
Bacha, A. S., Shafique, M., and van der Werff, H. (2018). Landslide inventory and susceptibility modelling using geospatial tools, in Hunza-Nagar valley, northern Pakistan. J. Mt. Sci. 15, 1354–1370. doi:10.1007/s11629-017-4697-0
Barella, C. F., Sobreira, F. G., and Zêzere, J. L. (2019). A comparative analysis of statistical landslide susceptibility mapping in the southeast region of Minas Gerais state, Brazil. Bull. Eng. Geol. Environ. 78, 3205–3221. doi:10.1007/s10064-018-1341-3
Basharat, M., Shah, H. R., and Hameed, N. (2016). Landslide susceptibility mapping using GIS and weighted overlay method: A case study from NW Himalayas, Pakistan. Arab. J. Geosci. 9, 292. doi:10.1007/s12517-016-2308-y
Bragagnolo, L., da Silva, R. V., and Grzybowski, J. M. V. (2020). Landslide susceptibility mapping with r.landslide: A free open-source GIS-integrated tool based on artificial neural networks. Environ. Model. Softw. 123, 104565. doi:10.1016/j.envsoft.2019.104565
Chang, M., Cui, P., Dou, X., and Su, F. (2021). Quantitative risk assessment of landslides over the China-Pakistan economic corridor. Int. J. Disaster Risk Reduct. 63, 102441. doi:10.1016/j.ijdrr.2021.102441
Chen, X., Cui, P., You, Y., Cheng, Z., Khan, A., Ye, C., et al. (2017). Dam-break risk analysis of the Attabad landslide dam in Pakistan and emergency countermeasures. Landslides 14, 675–683. doi:10.1007/s10346-016-0721-7
Demir, G. (2018). Landslide susceptibility mapping by using statistical analysis in the North Anatolian Fault Zone (NAFZ) on the northern part of Suşehri Town, Turkey. Nat. Hazards (Dordr). 92, 133–154. doi:10.1007/s11069-018-3195-1
Dunning, S. A., Mitchell, W. A., Rosser, N. J., and Petley, D. N. (2007). The Hattian Bala rock avalanche and associated landslides triggered by the Kashmir Earthquake of 8 October 2005. Eng. Geol. 93, 130–144. doi:10.1016/j.enggeo.2007.07.003
Ercanoglu, M., Kasmer, O., and Temiz, N. (2008). Adaptation and comparison of expert opinion to analytical hierarchy process for landslide susceptibility mapping. Bull. Eng. Geol. Environ. 67 (4), 565–578. doi:10.1007/s10064-008-0170-1
Gong, P., Liu, H., Zhang, M., Li, C., Wang, J., Huang, H., et al. (2019). Stable classification with limited sample: Transferring a 30-m resolution sample set collected in 2015 to mapping 10-m resolution global land cover in 2017. Sci. Bull. 64 (6), 370–373. doi:10.1016/j.scib.2019.03.002
GRASS Development Team (2017). Geographic resources analysis support system (GRASS GIS) software. version 7.2. Beaverton: Open Source Geospatial Foundation. URL: http://grass.osgeo.org.
Harris, I., Jones, P. D., Osborn, T. J., and Lister, D. H. (2014). Updated high-resolution grids of monthly climatic observations - the CRU TS3.10 Dataset. Int. J. Climatol. 34, 623–642. doi:10.1002/joc.3711
Haykin, S. (1999). Editor second ed. (New Jersey: Prentice-Hall), 897.Neural networks: A comprehensive foundation
Hussain, M. L., Shafique, M., Bacha, A. S., Chen, X. q., and Chen, H. y. (2021). Landslide inventory and susceptibility assessment using multiple statistical approaches along the Karakoram highway, northern Pakistan. J. Mt. Sci. 18 (3), 583–598. doi:10.1007/s11629-020-6145-9
Imtiaz, I., Umar, M., Latif, M., Ahmed, R., and Azam, M. (2022). Landslide susceptibility mapping: Improvements in variable weights estimation through machine learning algorithms—a case study of upper Indus River basin, Pakistan. Environ. Earth Sci. 81, 112. doi:10.1007/s12665-022-10233-y
Kamp, U., Growley, B. J., Khattak, G. A., and Owen, L. A. (2008). GIS-based landslide susceptibility mapping for the 2005 Kashmir earthquake region. Geomorphology 101 (4), 631–642. doi:10.1016/j.geomorph.2008.03.003
Khan, H., Shafique, M., Khan, M. A., Bacha, M. A., Shah, S. U., and Calligaris, C. (2019). Landslide susceptibility assessment using Frequency Ratio, a case study of northern Pakistan. Egypt. J. Remote Sens. Space Sci. 22 (1), 11–24. doi:10.1016/j.ejrs.2018.03.004
Khattak, G. A., Owen, L. A., Kamp, U., and Harp, E. L. (2010). Evolution of earthquake-triggered landslides in the Kashmir Himalaya, northern Pakistan. Geomorphology 115, 102–108. doi:10.1016/j.geomorph.2009.09.035
Kumar, M. R., Mishra, D. C., and Singh, B. (2013). Lithosphere, crust and basement ridges across ganga and Indus basins and seismicity along the himalayan front, India and western fold belt, Pakistan. J. Asian Earth Sci. 75, 126–140. doi:10.1016/j.jseaes.2013.07.004
Lee, S., and Min, K. (2001). Statistical analysis of landslide susceptibility at Yongin, Korea. Environ. Geol. 40 (9), 1095–1113. doi:10.1007/s002540100310
Liu, Y. L. (2010). Application of logistic regression and artificial neural networks in spatial assessment of landslide hazards. Hydrogeology Eng. Geol. 37 (5), 92–96.
Lombardo, L., Tanyas, H., and Nicu, I. C. (2020). Spatial modeling of multi-hazard threat to cultural heritage sites. Eng. Geol. Geology277, 105776. doi:10.1016/j.enggeo.2020.105776
Maqsoom, A., Aslam, B., Khalil, U., Kazmi, Z. A., Azam, S., Mehmood, T., et al. (2022). Landslide susceptibility mapping along the China Pakistan Economic Corridor (CPEC) route using multi-criteria decision-making method. Model. Earth Syst. Environ. 8, 1519–1533. doi:10.1007/s40808-021-01226-0
Martin, A. J. (2017). A review of Himalayan stratigraphy, magmatism, and structure. Gondwana Res. 49, 42–80. doi:10.1016/j.gr.2017.04.031
Meten, M., Bhandary, N. P., and Yatabe, R. (2015). GIS-Based frequency ratio and logistic regression modelling for landslide susceptibility mapping of debre sina area in Central Ethiopia. J. Mt. Sci. 12 (6), 1355–1372. doi:10.1007/s11629-015-3464-3
Miller, D. J., and Craig, S. R. (1996). Rangelands and pastoral development in the Hindu kush-himalayas: Proceedings of a regional experts’ meeting. Kathmandu: ICIMOD. doi:10.53055/ICIMOD.267
NDMA(National Disaster Management Authority Pakistan) (2010). NDMA newsletter. Available at: https://cms.ndma.gov.pk/storage/app/public/publications/October2020/tzYh8Fgm2dpYjhjAqSdp.pdf.1#2
Rana, H., and Babu, G. L. S. (2022). Regional back analysis of landslide events using TRIGRS model and rainfall threshold: An approach to estimate landslide hazard for kodagu, India. Bull. Eng. Geol. Environ. 81, 160. doi:10.1007/s10064-022-02660-9
Rashid, B., Iqbal, J., and Su, L. (2020). Landslide susceptibility analysis of Karakoram highway using analytical hierarchy process and scoops 3D. J. Mt. Sci. 17 (7), 1596–1612. doi:10.1007/s11629-018-5195-8
Sato, H. P., Hasegawa, H., Fujiwara, S., Tobita, M., Koarai, M., Une, H., et al. (2007). Interpretation of landslide distribution triggered by the 2005 Northern Pakistan earthquake using SPOT 5 imagery. Landslides 4, 113–122. doi:10.1007/s10346-006-0069-5
Searle, M. P., and Asif Khan, M. (1997). Geological map of North Pakistan and adjacent areas of northern Ladakh and western Tibet. Hague: Shell International Exploration and Production.
Su, C., Wang, L., Wang, X., Huang, Z., and Zhang, X. (2015). Mapping of rainfall-induced landslide susceptibility in Wencheng, China, using support vector machine. Nat. Hazards (Dordr). 76, 1759–1779. doi:10.1007/s11069-014-1562-0
Su, X., Zhang, Y., Meng, X., Yue, D. x., Ma, J. h., Guo, F. y., et al. (2021). Landslide mapping and analysis along the China-Pakistan Karakoram Highway based on SBAS-InSAR detection in 2017. J. Mt. Sci. 18, 2540–2564. doi:10.1007/s11629-021-6686-6
Thiery, Y., Maquaire, O., and Fressard, M. (2014). Application of expert rules in indirect approaches for landslide susceptibility assessment. Landslides 11, 411–424. doi:10.1007/s10346-013-0390-8
van Beek, L., and van Asch, T. (2004). Regional assessment of the effects of land-use change on landslide hazard by means of physically based modelling. Nat. Hazards 31, 289–304. doi:10.1023/B:NHAZ.0000020267.39691.39
van Westen, C., Kappes, M. S., Luna, B. Q., Frigerio, S., Glade, T., and Malet, J. P. (2014). “Medium-scale multi-hazard risk assessment of gravitational processes,” in Mountain risks: From prediction to management and governance. Advances in natural and technological hazards research. Editors T. Van Asch, J. Corominas, S. Greiving, J. P. Malet, and S. Sterlacchini (Dordrecht: Springer), Vol. 34. doi:10.1007/978-94-007-6769-0_7
Wang, J., Li, X., Christakos, G., Liao, Y., Zhang, T., Gu, X., et al. (2010). Geographical detectors-based health risk assessment and its application in the neural tube defects study of the heshun region, China. Int. J. Geogr. Inf. Sci. 24 (1-2), 107–127. doi:10.1080/13658810802443457
Xie, M., Esaki, T., and Zhou, G. (2004). GIS-based probabilistic mapping of landslide hazard using a three-dimensional deterministic model. Nat. Hazards 33, 265–282. doi:10.1023/B:NHAZ.0000037036.01850.0d
Xu, C., Xu, X., Dai, F., Wu, Z., He, H., Shi, F., et al. (2013). Application of an incomplete landslide inventory, logistic regression model and its validation for landslide susceptibility mapping related to the May 12, 2008 Wenchuan earthquake of China. Nat. Hazards (Dordr). 68, 883–900. doi:10.1007/s11069-013-0661-7
Xu, S., Li, J., and Ai, N. (1982). Studies of the structural landforms of the Potwar plateau, Pakistan. Sci. Geogr. Sin. 2 (2), 125–134.
Yaseen, M., Shahab, M., Ahmad, Z., Khan, R., Shah, S. F. A., and Naseem, A. A. (2021). Insights into the structure and surface geology of balanced and retrodeformed geological cross sections from the Nizampur basin, Khyber Pakhtunkhwa, Pakistan. J. Pet. Explor. Prod. Technol. 11, 2561–2571. doi:10.1007/s13202-021-01180-8
Yi, X., Shang, Y., Shao, P., and Meng, H. (2021). A dataset of spatial distributions and attributes of typical rockfalls and landslides in the China-Pakistan Economic Corridor from 1970 to 2020. China Sci. Data 6 (4). doi:10.11922/11-6035.csd.2021.0057.zh
Yilmaz, I. (2009). A case study from Koyulhisar (Sivas-Turkey) for landslide susceptibility mapping by artificial neural networks. Bull. Eng. Geol. Environ. 68, 297–306. doi:10.1007/s10064-009-0185-2
Yu, Z., Yu, X., and Yang, F. (2021). Spatio-temporal characteristics of climate change in China-Pakistan Economic Corridor from 1980 to 2019. Arid Zone Res. 38 (3), 695–703. doi:10.13866/j.azr.2021.03.11
Zhang, J., van Westen, C. J., Tanyas, H., Mavrouli, O., Ge, Y., Bajrachary, S., et al. (2019a). How size and trigger matter: Analyzing rainfall- and earthquake-triggered landslide inventories and their causal relation in the koshi river basin, central himalaya. Nat. Hazards Earth Syst. Sci. 19, 1789–1805. doi:10.5194/nhess-19-1789-2019
Keywords: China–Pakistan Economic Corridor, landslide, controlling factor, hazard assessment, artificial neural networks
Citation: Jianqiang Z, Yonggang G, Yong L, Qiang Z, Yuhong J, Huayong C and Xiaoqing C (2022) Zonation-based landslide hazard assessment using artificial neural networks in the China-Pakistan Economic Corridor. Front. Earth Sci. 10:927102. doi: 10.3389/feart.2022.927102
Received: 23 April 2022; Accepted: 04 July 2022;
Published: 10 August 2022.
Edited by:
Chong Xu, Ministry of Emergency Management, ChinaReviewed by:
Yuandong Huang, Ministry of Emergency Management, ChinaIonut Cristi Nicu, Norwegian Institute for Cultural Heritage Research, Norway
Xiangli He, Ministry of Emergency Management, China
Matebie Meten, Addis Ababa Science and Technology University, Ethiopia
Sajid Ali, RWTH Aachen University, Germany
Copyright © 2022 Jianqiang, Yonggang, Yong, Qiang, Yuhong, Huayong and Xiaoqing. This is an open-access article distributed under the terms of the Creative Commons Attribution License (CC BY). The use, distribution or reproduction in other forums is permitted, provided the original author(s) and the copyright owner(s) are credited and that the original publication in this journal is cited, in accordance with accepted academic practice. No use, distribution or reproduction is permitted which does not comply with these terms.
*Correspondence: Zhang Jianqiang, emhhbmdqcUBpbWRlLmFjLmNu
 Zhang Jianqiang
 Ge Yonggang
 Li Yong
 Zou Qiang
 Jiang Yuhong
 Chen Huayong
 Chen Xiaoqing