 Jiyu Wang
 Runsheng Han1*
- 1Southwest Institute of Geological Survey, Non-Ferrous Metal Minerals Geological Survey, Kunming University of Science and Technology, Kunming, China
- 2Chengdu University of Technology, Chengdu, China
A full-space tunnel gravity prediction method for evaluating the deep extension of high-density vertical orebodies has been developed based on the significant density differences between surrounding rocks and their characteristics as large-scale orebodies. This method uses the residual gravity anomaly parameters in the tunnel to determine whether the orebody is upright based on the symmetry of the anomaly. Moreover, it identifies the deep extensional characteristics of high-density upright orebodies based on the positive and negative anomalies. This method has characteristics such as strong anti-interference ability, slight influence from the terrain, and high detection accuracy. It has produced promising outcomes in the detection of deep, concealed orebodies in the Huangshaping skarn-type tin–tungsten polymetallic deposit located in southern Hunan. This method not only resolves the problem of rapid identification of the deep extension of single-hole high-density orebodies and provides reference basis for deep exploration but also proposes a new method for mineral resource evaluation.
Introduction
When an orebody is discovered through trenching during the exploration of ore deposits, estimating the depth of extension of orebody is typically concerning. The most direct way to evaluate the deep extension of an orebody is by constructing a trench or drill hole. However, the deep extension of the orebody should be predicted before designing a deep prospecting trench or drill hole. Therefore, physical prospecting is generally conducted before designing the exploration project. Common geophysical exploration methods include gravity, magnetic, electrical, seismic, radioactive, and geothermal exploration. Seismic, radioactive, and geothermal exploration methods are typically ineffective for non-radioactive metal orebodies, and magnetic and electrical exploration methods cannot be employed owing to electromagnetic interference in the pit (Zeng, 2008). However, the gravity measurement in the pit is unaffected by electromagnetic interference. When there is a significant density difference between a certain size of the orebody and surrounding rock, good detection results can be obtained via gravity method.
With improvements in the accuracy of gravity instruments and the wide range of research targets, gravity exploration methods have transitioned from traditional surface gravity exploration to underground-, aviation-, satellite-, and marine gravity-based exploration methods (Zeng, 2008). Currently, the theory of gravity exploration is relatively well developed as the factors of interference and terrain influence have been extensively studied (Fu, 2010; Hu, 2015; Zhang et al., 2015). Research on the instruments (Cai, 1980; Zeng, 1999; Geng, 2016; Lu et al., 2018), operating methods, data processing, forward and inverse calculations, non-ferrous metal detection, and coal mine safety (Goodacre, 1973; Beyer, 1979; Okabe, 1979; Schmoker, 1980; Casten and Gram, 1989; Li and Chouteau, 1998; Nagy et al., 2000; Yang et al., 2000; Fan, 2007; Luo, 2008; Yi et al., 2008; Cao, 2011; Zhdanov et al., 2011; Howell et al., 2012; Luo and Liu, 2012; Zhang, 2012; Zhang et al., 2012; Teng et al., 2013; Liu and Liu, 2014; Wang et al., 2014; Zhang, 2017; Ming et al., 2021) has been conducted worldwide.
In the study of underground gravity, Smith (1950) described the methodologies to solve various problems and interference factors, which should be considered in underground gravity measurements. Hammer (1950) comprehensively discussed the methodology of underground gravity measurement and proposed potential factors that may trigger errors, basic approaches for data processing, and formulas for calculating the density from underground gravity measurements. Xu and Zhou (1989) translated their studies and illustrated the characteristics of borehole gravity. Nevertheless, these studies reveal a greater inclination toward the field of borehole gravity rather than tunnel gravity.
Studies on the tunnel gravity detection related to the construction method, interference factors, near-area ground improvement, tunnel correction, and abnormal characteristics were conducted according to previous results from (Wu, 2011). Tao (2017) suggested the tunnel gravity terrain correction and summarized the influencing rules followed by the three kinds of models: positive, negative, and combined terrains under the conditions of one, two, and three dimensions, respectively, by applying forward modeling. The patent applied by Han Runsheng and Li Wenyao (Han and Li, 2014; Li and Han, 2014; Han et al., 2021) resolved the problem of orienting the high-density or high-density upright cuboid metal orebodies in tunnel exploration by locating and detecting deeply concealed orebodies using four main parameters; these included the gravity anomaly
Prediction Principle of the Deep Extension of High-Density Vertical Orebody
Formula for the Abnormal Weight of the Upright Rectangle
Assuming that the orebody is a rectangular parallelepiped with a uniform residual density σ, the half-length, half-width, and half-height of the orebody are a, b, and c, respectively. The length, width, and height of the orebody are parallel to the x, y, and z axes of the spatial rectangular coordinate system, respectively. The center point coordinates of the orebody are
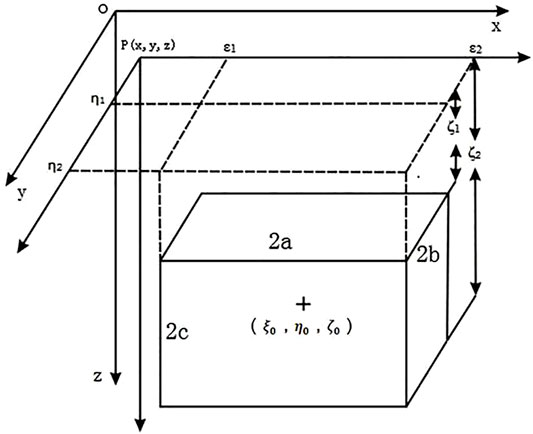
FIGURE 1. Schematic of the coordinate conversion and forward model of the vertical cuboid.
According to Newton’s law of universal gravitation, the gravity anomaly for a cuboid with a uniform residual density σ in the geological body can be expressed as follows (Zeng, 2008):
where G is the gravitational constant, and (x, y, z) are the coordinates of the observation point.
The distance from the center point of the orebody to the measuring point can be expressed as follows:
Eq. 1 can be transformed into
which is
where
The coordinates of the observation point are
Eqs. 2, 3 are used to calculate the weight of the upright rectangle.
Distribution of the Abnormal Sections of Vertical High-Density Orebodies
The gravity anomaly of an upright high-density orebody can be calculated using Eq. 3. Through forward calculation, the gravity of the
Figure 2 shows the gravity anomaly characteristics on the
(1) When
(2) When
(3) When
(4) When
(5) When
(6) When
(7) When
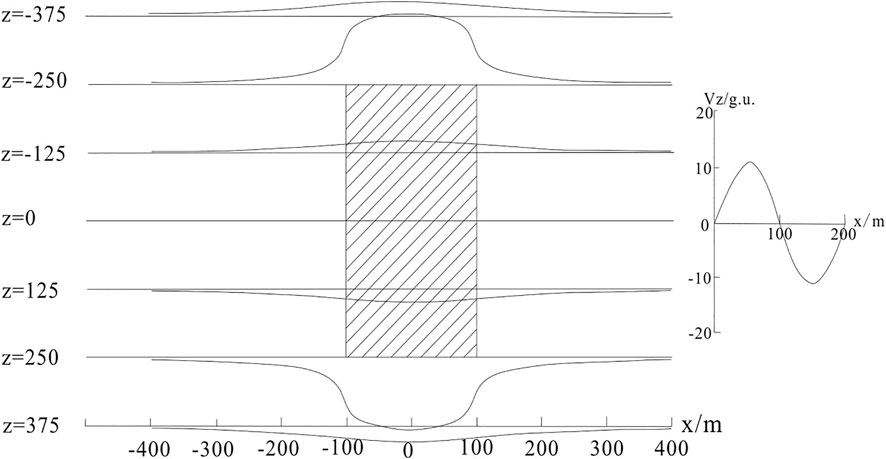
FIGURE 2. Cross-sectional model of the gravity anomaly of an upright, high-density orebody.
The abnormal value on the center plane is 0, and the gravity anomaly values above and below the center plane are positive and negative, respectively. The outlier is the most positive on the top plane of the model and most negative on the bottom plane of the model. The abnormal value of the same profile line is the largest above the center point, and the abnormal curve is symmetrical. When x approaches ±∞, the abnormal value is infinitely close to 0. Below the center point, the abnormal value is the smallest, and the abnormal curve is symmetrical; when x approaches ±∞, the outlier is infinitely close to
Spatial Distribution of Anomalies in Vertical High-Density Orebodies
Assuming that the length
(1)
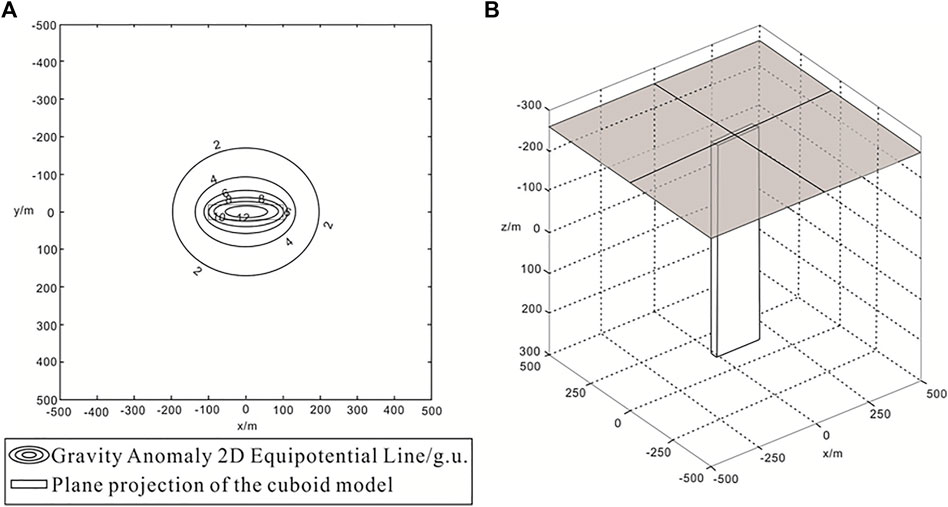
FIGURE 3. Contour map of the gravity anomaly on the observation plane at z = -260 m.
Figure 3A shows the gravity anomaly characteristics of the vertical cuboid on the observation plane at
1) The abnormal contour is elliptical; it is dense near the cuboid and sparse in the area away from the cuboid.
2) The entire upright cuboid is located below the observation plane; the residual density of the model is greater than 0, and the gravity anomaly is positive.
3) The contour map of the gravity anomaly is symmetric about the x and y axes, and the anomaly profile is a single-peak curve.
4) The observation plane is
(2)
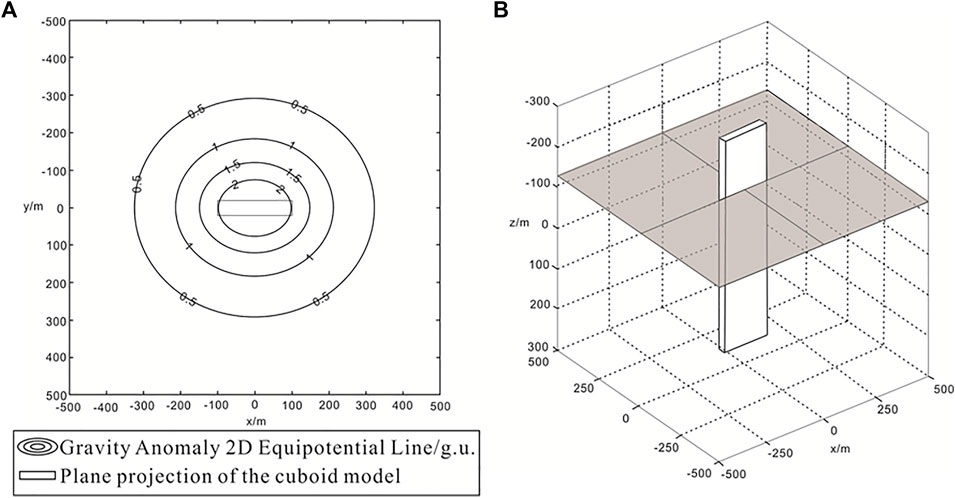
FIGURE 4. Contour map of the gravity anomaly on the observation plane at z = -125 m.
Figure 4A shows the gravity anomaly characteristics of the oblique cuboid on the observation plane at
1) The abnormal contours near the cuboid are dense, and those far away from the cuboid are sparse.
2) The observation plane passes through the upright cuboid; the part of the upright cuboid below the observation plane is larger than that in the upper part; the residual density of the model is greater than 0, and the gravity anomaly is positive.
3) The contour map of the gravity anomaly is symmetrical about the x and y axes, and the anomaly curve is a bimodal curve.
4) The observation plane is 125 m away from the center of the cuboid, and the maximum value of the anomaly is at the center of the cross-section between the vertical cuboid and the observation plane, which is approximately
(3)
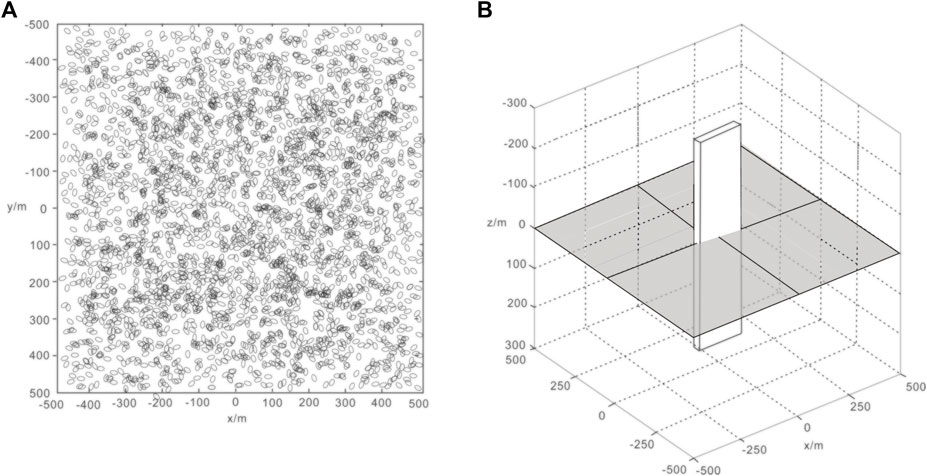
FIGURE 5. Contour map of the gravity anomaly on the observation plane at z = 0 m.
Figure 5A shows the gravity anomaly characteristics of the oblique cuboid on the observation plane at
1) The observation plane passes through the center of the cuboid; the upright cuboid is equal in the upper and lower parts of the observation plane, and the gravity anomaly is
2) Owing to the presence of random errors, the contour map of the gravity anomaly appears disorderly and irregular.
3) The observation plane is located at the center plane of the cuboid,
(4)
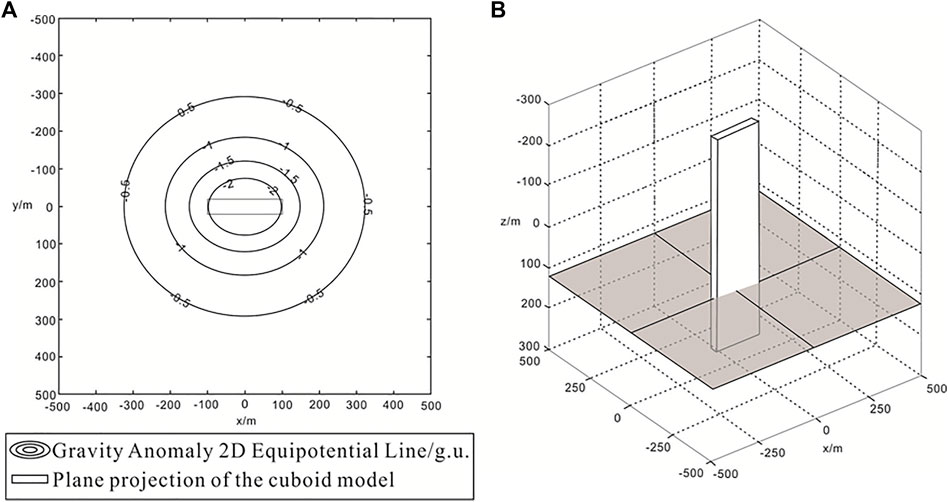
FIGURE 6. Contour map of the gravity anomaly on the observation plane at z = 125 m.
Figure 6A shows the gravity anomaly characteristics of the vertical cuboid on the observation plane at
1) The abnormal contours near the cuboid are dense, and those far away from the cuboid are sparse.
2) The observation plane intersects the upright cuboid; the lower part of the upright cuboid is smaller than the upper part of the observation plane, and the gravity anomaly is negative.
3) The contour map of the gravity anomaly is symmetric about the x and y axes, and the anomaly curve is a single-peak curve.
4) The observation plane is
(5) The observation plane at
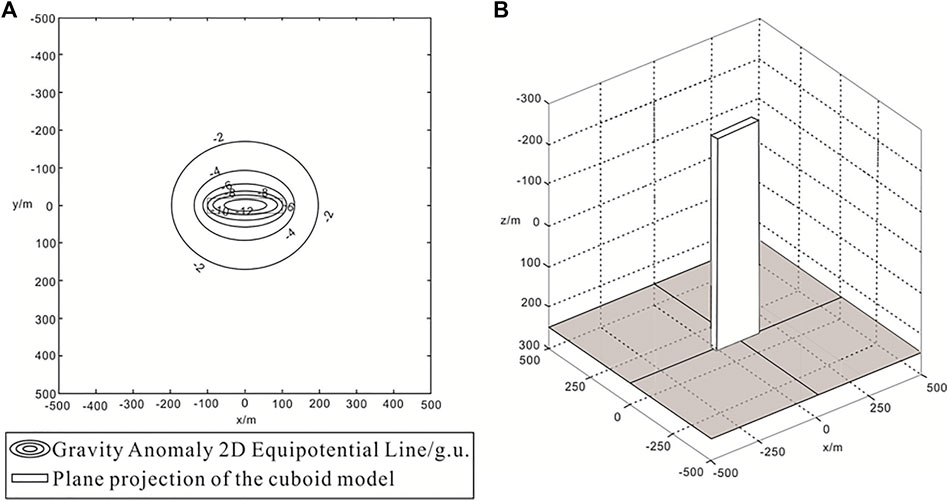
FIGURE 7. Contour map of the gravity anomaly on the observation plane at z = 260 m.
Figure 7A shows the gravity anomaly characteristics of the upright cuboid on the observation plane at
1) The abnormal contours near the cuboid are dense, and those far away from it are sparse.
2) The whole rectangular body is located above the observation plane, and the gravity anomaly is negative.
3) The contour map of the gravity anomaly is symmetric about the x and y axes, and the anomaly profile is a single-peak curve.
4) The observation plane is
Overall, the anomaly contour is generally elliptical; it is dense near the cuboid, and sparser away from the cuboid. Its equipotential line is symmetric about the x and y axes. The anomaly values are 0, positive, and negative on, above, and below the central plane, respectively. The outlier values are most positive and most negative on the top and bottom planes of the model, respectively. The abnormal value is largest above the center point of the same plane; it gradually decreases from the center to the surroundings to a minimum value of
Prediction Method for the Deep Extension of a High-Density Vertical Orebody
Method Steps
(1) Various rocks and ores in the survey area were collected, identified, and their types were determined.
(2) The densities of rocks and ores in the survey area were determined.
(3) Gravity observations of the tunnel were made using point coordinate measurements, selecting gravity base points, and collecting point gravity anomaly observations.
(4) Data processing methods (including the temperature, tilt, solid tide, zero drift, terrain, Bouguer, and latitude corrections, as well as the separation of regional and local fields) were applied for tunnel gravity observations.
(5) Qualitative predictions of deep vertical high-density orebody extensions were made.
(6) Quantitatively evaluated the extension of the deep vertical high-density orebodies.
Qualitative Prediction
According to the qualitative analysis from Eq. 3 and the forward calculations of Figure 3 to Figure 7, we obtained the deep extension characteristics of the high-density vertical orebody, as presented in Supplementary Table S1.
(1) When the observation tunnel is in the upper middle part of the orebody, the residual gravity anomaly
In particular, when the residual gravity anomaly of the observation tunnel is a symmetrical positive anomaly, the orebody extends to the deeper part, and the depth of the unknown orebody under the tunnel is greater than its height above the tunnel.
(2) When the observation tunnel is in the middle of the orebody, the residual gravity anomaly
In particular, when the remaining gravity of the observation tunnel is not abnormal, the depth of the unknown orebody below the tunnel is equal to its height above the tunnel.
(3) When the observation tunnel is in the lower middle part of the orebody, the residual gravity anomaly ∆g is symmetrical and negative.
In particular, when the residual gravity anomaly of the observation tunnel is symmetrical and negative, the extension of the orebody to the deep part is less; specifically, the depth of the unknown orebody below the tunnel is less than the height of the orebody controlled above the tunnel.
Quantitative Evaluation
Eq. 3 can be used to calculate the extended length of the high-density orebody and the number of prospective resources; namely, the half-length a and half-width b of the known high-density upright orebody can be substituted into Eq. 3 to calculate and plot the residual gravity anomaly. In the residual gravity anomaly map, the value of the half-height c is continuously adjusted, and the shape and intensity of the residual gravity anomaly curve obtained after the calculation and measurement of the residual gravity anomaly curve are observed. When the two curves satisfy Eq. 4, the c value in this state represents the semi-extended length of the deep part of the orebody.
where
An estimated range for c can be established using Eq. 3 to calculate multiple estimated gravity anomalies for c within a given range
where Z2 is the threshold.
Furthermore, the prospective resources of high-density orebodies can be calculated.
Method Characteristics
Based on the above principles, the method has the following characteristics:
(1) Although few parameters are used, only one parameter is used for the remaining gravity anomaly measurements of the pit.
(2) Good detection results are obtained for orebodies with large density differences between the ore and surrounding rock. Thus, it is applicable to both slab- or vein-type high-density orebodies and columnar high-density orebodies.
(3) This method can quickly determine the deep extension of high-density upright ore bodies, which can significantly shorten the prospecting cycle and reduce the exploration cost.
(4) It is unaffected by electromagnetic interference.
(5) It is only slightly influenced by the surface topography.
(6) The observation trench is basically flat and is anomalous without curvilinear leveling.
(7) The gravity method is exceptionally simple and thus can be easily applied.
Application Examples
This study conducted gravity detection in the deep pit of the Huangshaping tungsten–tin polymetallic deposit in the Pingbao mining field in south Hunan and achieved good results. This deposit is a representative copper–tin polymetallic deposits in south Hunan, and its formation is closely related to the SK rocks in the contact zone between the early and middle Yanshan quartz porphyry and enclosing rocks in the area. The deposit is primarily controlled by the contact zone, and the main orebodies are in the form of large veins and irregularities, primarily on both sides of the contact zone between the quartz porphyry and the crystalline tuff in the area. The deposit has been developed and utilized for decades, and the significant resource crisis necessitates the exploration of the deep orebody, which provides the prerequisite for gravity exploration in the pit.
The gravity measurement used a CG-5 high-precision gravimeter manufactured by the Canadian Scintrex Instrument Company. The resolution of the instrument is
The gravimeter was placed in the tunnel gravity measurement after passing the static, dynamic, stabilization time tests after adjusting the measuring range, and grid value calibration test.
The gravity base point of the tunnel was near the tunnel entrance, and the ground was stable and free of interference, which facilitated the observation of the base point in the morning and evening. The morning and evening base points were observed using the observation method of “base point-auxiliary reference point.” Base-measuring points from 1 to n were adopted by the observation method. The gravity measurement points of the tunnel were located using a plan view of the middle section of the tunnel combined with a measuring tape and a laser rangefinder, and the point distance was 25 m.
We performed temperature, tilt, solid tide, zero drift, terrain, Bouguer, and latitude corrections, as well as the regional field and local field separations using the tunnel gravity observation results. Subsequently, field separation of the Bouguer gravity anomaly was conducted. Finally, the results were analyzed to explain the obtained residual gravity anomaly and predict the deep extension of the orebody.
Among which, the correction of temperature, solid tide and tilt is automatically completed by the CG-5 gravimeter. The correction of near area terrain which ranges from 0 to 20 m in the tunnel is carried out by the cylinder formula (Wang, 2003). The height of the cylinder for terrain correction of near area terrain equals to the difference of elevation between the projection point on the ground and the survey point in the tunnel, which original elevation values comes from 1:2000 topographic map.
The cylinder formula of near area terrain correction for tunnel gravity measurement (Wang, 2003) shows below:
Where △g is the near area terrain correction value of the tunnel (g.u.);
G is the universal Gravitational Constant, 6.67 × 10⁻¹¹m3/(kg•s2);
σ is the residual density, generally 2.67 × 10³ kg/m3;
h is the upper top depth, the unit is m;
H is the height of the cylinder (difference of elevation), the unit is m;
R is the radius of the cylinder, approximately 20 m.
The method of sector division correction is applied on middle area terrain correction. The elevation value of middle area terrain correction origins from the 1:2000 topographic map. The correction conducted by RGIS software which ranges from 20 to 2000m.
Formulas for sector division correction (Hammer, 1950) and supplementary angle correction show below:
Where Rm is the inner radius of sector, which the unit is m;
Rm+1 is the outer radius of sector, which the unit is m;
△H is the difference of elevation between the average elevation of the sector and the measuring point, which the unit is m;
n is the number of orientations, that is the number of small sectors divided from near area terrain when the observation point is supposed to be vertex
Where S is the area of the supplementary angle,
R is the radius of inscribed circle, 1.105r = R;
△H is the difference of elevation between the average elevation of the supplementary angle and the measuring point, which the unit is m.
The elevation of remote area terrain correction origins from the RGIS software and is able to be adjusted by the RGIS software, which from 2 to 166.7 km.
The calculation formula of square field algorithm (Hammer, 1950) for remote area terrain correction shows below:
Where (εi, ηj) are the coordinates of the center point in the square grid located in the ith row and the jth column;
△ε is the increment in the x direction;
Δη is the increment in the y direction;
hij is the elevation of the grid center point.
Gravity measuring point is generally located in the central of tunnel. Therefore the impact triggered by gravitational effect origins from gravity measuring point in the central tunnel is vanishingly small. That means further tunnel correction is no needed in terms of the remote area terrain.
The regional field and the local field of Bouguer gravity anomaly data in the central area of 136-mining area were separated by RGIS trend analysis module. The results express in Supplementary Table S2.
Twenty-eight rock and ore specimens were collected in the mining area, including eight skarn-type tin–tungsten polymetallic ores and twenty rocks (seventeen quartz rocks and three crystalline limestones). The average density of the skarn orebodies in the survey area was
Comprehensive analysis of the gravity profile of the tunnel at the 109-section line in the middle section of -136 m in the Huangshaping mining area (shown in Figure 8) revealed that the orebodies above the middle section of -136 m were controlled orebodies. The gravity anomaly curve measured in the middle section of -136 was symmetrical and evidently positive, and its anomalous position corresponded to a skarn orebody in the quartz porphyry contact zone, which is a high-density body. When the measurement section was located above the middle of the skarn-type orebody, a positive anomaly was observed. This indicated that the deep extension of the skarn-type orebody is greater than the extension above the middle section of -136. The occurrence of the orebody was primarily characterized as upright.
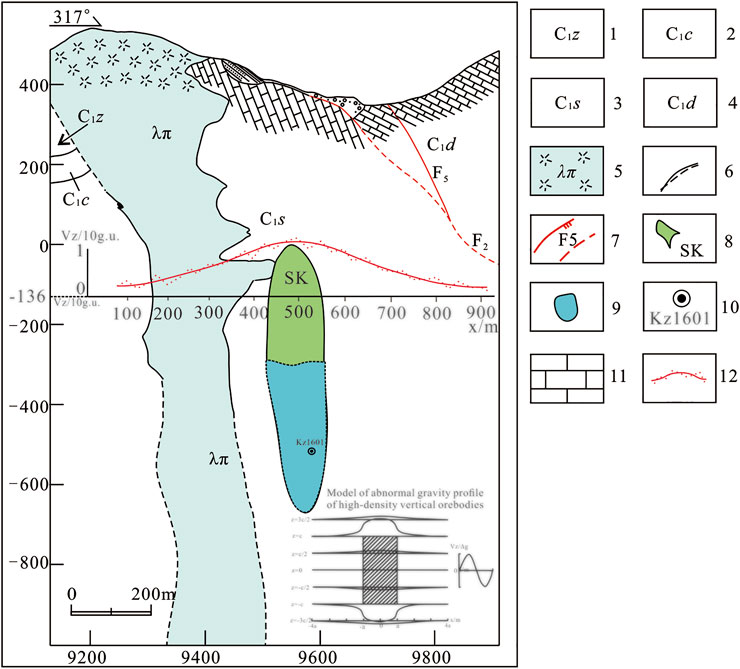
FIGURE 8. Gravity profile of the geological tunnel at the 109 line in the middle section of -136 m in the Huangshaping mining area.
According to the known characteristics of the orebody above the tunnel, the strike length, thickness, density difference, and upper control height of the skarn-type orebody were approximately
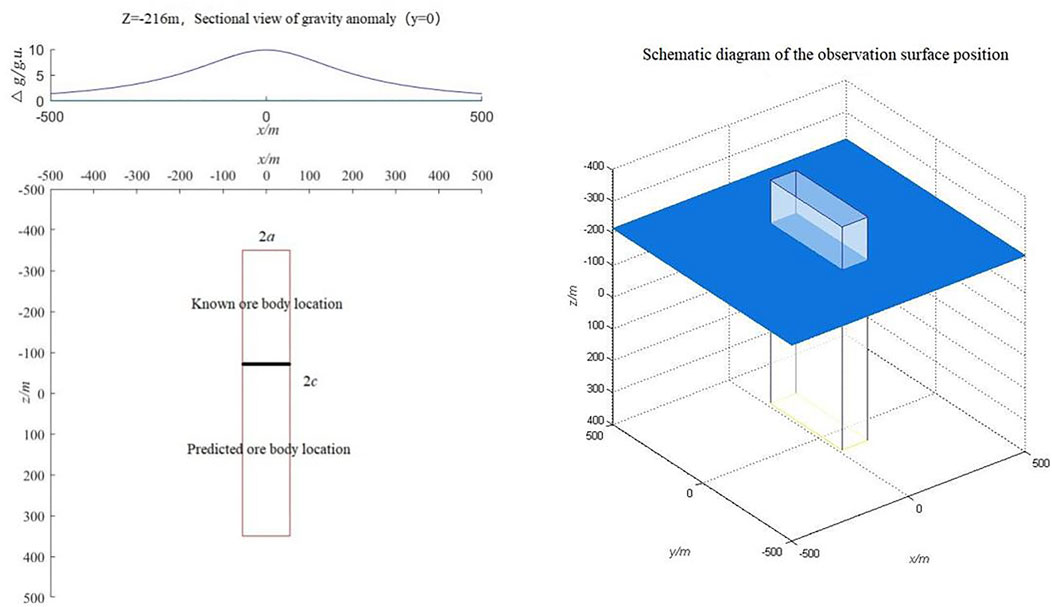
FIGURE 9. Screenshot of the inversion procedure of the fitting method.
Through the quantitative flat method inversion of Eq. 5, we concluded that when the half-height
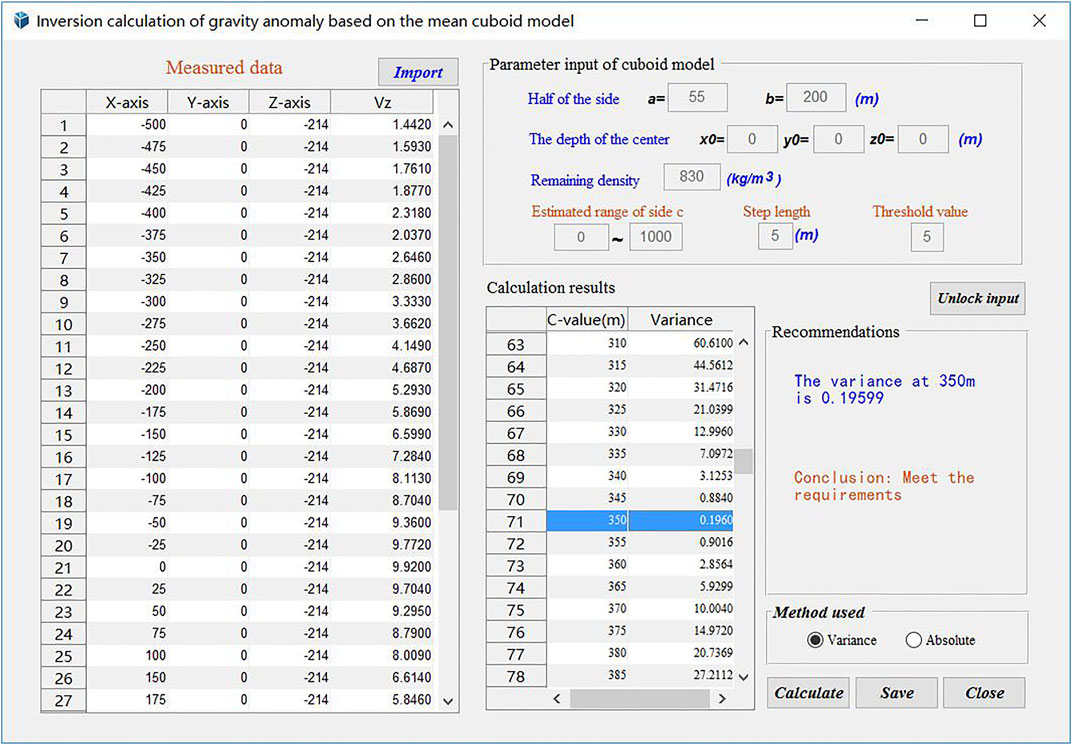
FIGURE 10. Screenshot of the results of the flat method inversion program.
When the result of the absolute value method was
Based on the drilling of KZ1601, the ore was deep; this demonstrated the presence of concealed orebodies and the effectiveness of this method in their detection.
The tunnel-controlled orebody length was
Conclusion
The tunnel gravity prediction method for evaluating the deep extension of an orebody is suitable when the ore and surrounding rock have a significant density difference. It can effectively predict the extension depth and number of ores in the deep orebody. This method involves few parameters, is simple and unaffected by electromagnetic interference, and has high detection accuracy. It can overcome the ambiguity of other geophysical methods for the spatial positioning and detection of orebodies. This method was verified by deep exploration in the Huangshaping mining area. Therefore, this method has important application potential and promotion value for predicting prospective deep resources of the same type of high-density vertical orebodies.
Data Availability Statement
The original contributions presented in the study are included in the article/Supplementary Material, further inquiries can be directed to the corresponding author.
Author Contributions
All authors listed have made a substantial, direct, and intellectual contribution to the work and approved it for publication.
Funding
This study was funded by the National Key R and D Program Project “Ore-controlling structural system and the law of occurrence of deep-seated ore” (2018YFC0603902) and Three-dimensional fine detection and deep orebody positioning (2018YFC0603903). This research project was jointly funded by the National Key Research and Development Program of China (SQ2018YFC06017102), Projects of YMLab. (2010), and Innovation Team of Yunnan province (2012).
Conflict of Interest
The authors declare that the research was conducted in the absence of any commercial or financial relationships that could be construed as a potential conflict of interest.
Publisher’s Note
All claims expressed in this article are solely those of the authors and do not necessarily represent those of their affiliated organizations, or those of the publisher, the editors and the reviewers. Any product that may be evaluated in this article, or claim that may be made by its manufacturer, is not guaranteed or endorsed by the publisher.
Supplementary Material
The Supplementary Material for this article can be found online at: https://www.frontiersin.org/articles/10.3389/feart.2022.897909/full#supplementary-material
References
Beyer, L. A. (1979). Terrain Corrections for Borehole Gravity Measurements. Geophysics 44 (9), 1584–1587. doi:10.1190/1.1441028
Cai, B. (1980). Introduction to Foreign Well-Well Gravimeters and Well-Well Gravity Measurements[J]. Geophys. Geochem. Explor. 4 (1), 61–63.
Cao, L. (2011). Application and Prospect of Geophysical Methods in Deep Prospecting for Metal Deposits[J]. Prog. Geophys. 26 (2), 701–708. doi:10.3969/j.issn.1004-2903.2011.02.040
Casten, U., and Gram, C. (1989). Recent Developments in Underground Gravity Surveys. Geophys prospect 37 (1), 73–90. doi:10.1111/j.1365-2478.1989.tb01822.x
Fan, X. (2007). Fast Calculation of Terrain Correction in the Vicinity of Regional Gravity Survey [J]. J. Eng. Geophys. 4 (6), 560–562. doi:10.3969/j.issn.1672-7940.2007.06.009
Fu, J.-W. (2010). Progress in Gravity Logging Technology[J]. Prog. Geophys. 25 (2), 596–601. doi:10.3969/j.issn.1004-2903.2010.02.032
Geng, Q. (2016). Representative Foreign Products of Gravity Instruments and the Latest Progress in Domestic Research and Development [J]. Geol. Equip. 17 (01), 27–30. doi:10.3969/j.issn.1009-282X.2016.01.006
Goodacre, A. K. (1973). Some Comments on the Calculation of the Gravitational and Magnetic Attraction of a Homogeneous Rectangular Prism. Geophys Prospect 21 (1), 66–69. doi:10.1111/j.1365-2478.1973.tb00014.x
Hammer, S. (1950). Density Determinations by Underground Gravity Measurements. Geophysics 15, 637–652. doi:10.1190/1.1437625
Han, R., and Li, W. (2014). A Method of Locating and Detecting High-Density Concealed Ore Bodies in the Whole Space Domain of Tunnel Gravity[P].11.
Han, R., Li, W., Cheng, R., Wang, F., and Zhang, Y. (2020). 3D High-Precision Tunnel Gravity Exploration Theory and its Application for Concealed Inclined High-Density Ore Deposits. J. Appl. Geophys. 180, 104119. doi:10.1016/j.jappgeo.2020.104119
Han, R., Li, W., Cheng, R., and Wang, J. (2021). 3D High-Precision Tunnel Gravity Exploration Method for Locating and Detecting Deeply Concealed Inclined High-Density Orebodies, [P].
Han, R., Wang, F., Hu, Y., Wang, X., Ren, T., Qiu, W., et al. (2014). Study on the Dynamics of the Metallogenic Structure of the Huize-type (HZT) Germanium-Rich Silver-Lead-Zinc Deposit and its Chronological Constraints[J]. Tect. Metallogeny 38 (04), 758–771. doi:10.3969/j.issn.1001-1552.2014.04.003
Howell, L. G., Heintz, K. O., and Barry, A. (2012). The Development and Use of a High-Precision Downhole Gravity Meter. Geophysics 31 (4), 764–772. doi:10.1190/1.1439808
Hu, M. (2015). “Research and Application of Terrain Correction Methods in Gravity Exploration [D],” (Chengdu, Sichuan, China: Chengdu University of Technology). Dissertation.
Li, W., and Han, R. (2014). A Method of Locating and Detecting Low-Density Concealed Ore Bodies in the Whole Space Domain of Tunnel Gravity[P].11.
Li, X., and Chouteau, M. (1998). Three-dimensional Gravity Modeling in All Space[J]. Surv. Geophys. 19 (4), 339–368. doi:10.1023/a:1006554408567
Liu, Z., and Liu, S. (2014). Mine Geophysical Prospecting[M]. Wudaokou, Haidian, China: China University of Mining and Technology Press.
Lu, L., Zhou, M., Bruce, L., et al. (2018). Common Problems and Solutions in Field Work of CG-5 Gravimeter. [J]. Geol. Equip. doi:10.3969/j.issn.1009-282X.2018.04.012
Luo, D., and Liu, Z. (2012). Research on the Forward Modeling Method of Gravity in Borehole Based on the Internal Theory of Field Sources[J]. Comput. Tech. Geophys. Geochem. Explor. 34 (6), 656–665. doi:10.3969/j.issn.1001-1749.2012.06.06
Luo, Y. (2008). Two New Rectangular Gravitational Force Field Forward Expressions and Theoretical Derivation [J]. J. Eng. Geophys. 5 (2), 210–214. doi:10.3969/j.issn.1672-7940.2008.02.015
Ming, Y., Niu, X., Xie, X., Han, Z., Li, Q., and Sun, S. (2021). Application of Gravity Exploration in Urban Active Fault Detection[J]. IOP Conf. Ser. Earth Environ. Sci. 660 (1), 012057. doi:10.1088/1755-1315/660/1/012057
Nagy, D., Papp, G., and Benedek, J. (2000). The Gravitational Potential and its Derivatives for the Prism[J]. J. Geod. 74 (7-8), 552–560. doi:10.1007/s001900000116
Okabe, M. (1979). Analytical Expressions for Gravity Anomalies Due to Homogeneous Polyhedral Bodies and Translations into Magnetic Anomalies. Geophysics 44 (4), 730–741. doi:10.1190/1.1440973
Schmoker, J. W. (1980). Terrain Effects of Cultural Features upon Shallow Borehole Gravity Data. Geophysics 45 (12), 1869–1871. doi:10.1190/1.1441071
Smith, N. J. (1950). The Case for Gravity Data from Boreholes. Geophysics 15, 605–636. doi:10.1190/1.1437623
Tao, Wei. (2017).”Research on High-Precision Gravity Terrain Correction of Tunnels[D],” (Kunming, China: Kunming University of Science and Technology). Dissertation.
Teng, L., Ni, S., Zhang, B., Di, B., Zhu, H., Yin, Q., et al. (2013). Application of CORS System in Gravity Survey[J]. Geophys. Geochem. Explor. 37 (06), 1018–1022. doi:10.11720/j.issn.1000-8918.2013.6.11
Wang, J. (2019). Influencing Factors of High-Precision Tunnel Gravity Exploration in the Huangshaping W-Sn-Cu-Pb-Zn Polymetallic Mining Area, Southern Hunan. [C]. Acta Geol. Sin. Engl. Ed. 93 (Suppl. 2), 418.
Wang, W., Ren, F., Wang, Y., Ji, X., Li, J., and Li, Q. (2014). Application of Gravity Exploration in the Investigation of Sedimentary Bauxite Deposits[J]. Geophys. Geochem. Explor. 38 (03), 409–416. doi:10.11720/wtyht.2014.3.01
Wu, Z. (2011). “Tunnel Gravity Research and its Application in the Prospecting of Lead-Zinc Deposits [D],” (Kunming, China: Kunming University of Science and Technology). Dissertation.
Xu, G., and Zhou, G. (1989). Gravity Measurement in Wells and tunnels[M]. Beijing: Beijing Geological Publishing House.
Yang, H., Ding, H., Wang, Y., and Cao, Q. (2000). Discussion on Several Issues in Gravity Correction in Mountainous Areas [J]. Pet. Geophys. Prospect. (4), 479–487. doi:10.3321/j.issn:1000-7210.2000.04.010
Yi, B., Zeng, Z. F., and Xue, J. (2008). Application of Geophysical Method in City Active Fault Detection. Prog. Geophys. 23 (02), 599–604. doi:10.3969/j.issn.1672-562X.2019.04.079
Zeng, H. (1999). Current Status and Development of Gravimeter[J]. Geophys. Geochem. Explor. 23 (2), 84–89. doi:10.3969/j.issn.1000-8918.1999.02.002
Zeng, H. (2008). Gravity Field and Gravity Exploration [M]. Beijing: Geological Publishing House, 85–86.
Zhang, D. (2017). “Application of High-Precision Gravity in the Prospecting of Xiaozhuqing Survey Area in Huize Lead-Zinc Mining Area,” (Kunming, China: Kunming University of Science and Technology). Dissertation.
Zhang, G., Zhao, G., Kuang, H., Teng, F., Su, Y., Liang, J., et al. (2015). Some Advances in Ground Gravity Survey Methods and Techniques in Recent Years[J]. Prog. Geophys. 30 (1), 386–390. doi:10.6038/pg20150156
Zhang, Y., Xu, R. G., and Yu, Y. (2012). The Application of High Precision Gravity Prospection in the Detection of Concealed Faults. Recent Dev. World Seismol. (05), 9–10. doi:10.3969/j.issn.1674-7801.2012.03.021
Zhang, Z. (2012). Application of Gravity and CSAMT Method for Lead-Zinc Mining in Caixia Mountain, Xinjiang. Mineral. Explor. 3 (3), 389–396. doi:10.3969/j.issn.0235-4975.2012.05.002
Zhdanov, M. S., Liu, X., Wan, L., Čuma, M., and Wilson, G. A. (2011). “3D Potential Field Migration for Rapid Imaging of Gravity Gradiometry Data — A Case Study from Broken Hill, Australia, with Comparison to 3D Regularized Inversion,” in SEG Technical Program Expanded Abstracts. doi:10.1190/1.3628202
Keywords: tunnel gravity exploration, high-density vertical orebody, extension prediction of the deep orebody, huangshaping tin-tungsten polymetallic deposit, pingbao mining, southern Hunan
Citation: Wang J, Han R, Li W and Cheng R (2022) Gravity Prediction Method and the Application of Full-Space Tunnels in the Deep Extension of High-Density Vertical Orebodies. Front. Earth Sci. 10:897909. doi: 10.3389/feart.2022.897909
Received: 16 March 2022; Accepted: 27 April 2022;
Published: 17 May 2022.
Edited by:
Shuanggen Jin, Shanghai Astronomical Observatory (CAS), ChinaReviewed by:
Animireddi Satya Kumar, National Geophysical Research Institute (CSIR), IndiaArkoprovo Biswas, Banaras Hindu University, India
Shi Chen, China Earthquake Administration, China
Copyright © 2022 Wang, Han, Li and Cheng. This is an open-access article distributed under the terms of the Creative Commons Attribution License (CC BY). The use, distribution or reproduction in other forums is permitted, provided the original author(s) and the copyright owner(s) are credited and that the original publication in this journal is cited, in accordance with accepted academic practice. No use, distribution or reproduction is permitted which does not comply with these terms.
*Correspondence: Runsheng Han, NTU0NjcwMDQyQHFxLmNvbQ==