- 1State Key Laboratory of Geohazard Prevention and Geoenvironment Protection, College of Computer Science and Cyber Security, Chengdu University of Technology, Chengdu, China
- 2School of Civil Engineering, Chongqing University, Chongqing, China
- 3School of Civil Engineering, Qingdao University of Technology, Qingdao, China
Denudation processes induced by external loading show scale-independent traits in rocks. Therefore, monitoring of micro-cracking features offers a possibility for assessing the structural health or rock massifs; eventually leading to early-warning systems capable of estimating the risk of catastrophic collapses. This study assesses the behaviour of acoustic emissions monitored while a sandstone sample was subjected to staged monotonic uniaxial compression. Particularly, waveform characteristics were recorded and analysed to identify the most predominant factors for classification. Then an unsupervised k-means algorithm was employed to cluster these parameters into two categories, related to the source being either a tensile or shear dislocation. Clusters showed noticeable differences, whilst results indicate that properties of AE waveforms vary significantly amongst diverse stages of loading, being the rise time the most sensitive parameter. Moreover, it seems that transitions amongst diverse behavioural stages of the sample are preceded by changes in the first lag of the autocorrelation function and the variance of the ratio of maximum amplitude and rise time of the ensemble of time histories observed within each stage. This trend is significantly more noticeable during the last stage, just before the collapse. This trait is in accord with the critical slowdown theory (CSD). This allows for the development of early-warning systems signalling partial collapse of rock masses.
Introduction
Thorough knowledge of rock failure is essential in the fields of slope stability, underground geotechnical engineering, rock mechanics and engineering seismology (Hedayat et al., 2014; Murton et al., 2016; Cremen & Galasso, 2020; Cui et al., 2021; Yin et al., 2022). Being testing on samples the most popular and efficient approach for understanding the failure mechanisms in rock masses. Conventionally, the strength and deformation of rock have been measured to evaluate damage processes and significant features at different stages. These features can only provide a limited characterization of rock failure without details about the inner fracturing mechanism since the accumulated force-displacement curve can only be observed in experiments. In this case, the acoustic emission (AE) technique is considered an innovative non-destructive testing (NDT) approach that has recently been used in rock mechanics and rock engineering (Zhang et al., 2019; Liu et al., 2020; Zhou et al., 2021).
Acoustic emission (AE) is defined as “transient elastic stress waves produced by a release of energy from a localized source” (Moradian et al., 2012; Vidya Sagar & Dutta, 2019), it is actually a mechanical vibration spreading on the material, which was generated by the micro cracking, dislocation and fractures in the materials. As the waveforms characteristics depend on the rupture properties, AE signals showcase the relevant information regarding the micro cracking process (Loo Christopher et al., 2019). Monitoring and analysing AE signals to evaluate the features of fracture sources has attracted researchers’ interest in rock engineering in recent years. Jian-po et al. (2015) studied the cracking behaviour of granite samples with pre-existing holes using moment-tensor analysis of acoustic emission signals. Liu et al. (2015) developed an artificial neural network to predict different rocks based on acoustic emission signal analysis. Moradian et al. (2015) investigated the crack level in brittle rocks by parameter analysis of AE signals and correlating these parameters (e.g., hits and energy) to stress-strain plots of rocks. The result demonstrates that the number of AE hits/counts is related to the number of cracks, while the AE energy is related to magnitude of the cracking event. And the evolution of cracking sequences can be divided into eight stages based on the micro- and macro-cracking levels: crack closure, linear elastic deformation, micro-crack initiation, micro-crack growth, micro-crack coalescence, macro-crack growth, macro-crack coalescence and failure. Appropriate analysis techniques such as parameter-based statistical analysis are commonly performed to observe the change in rock and identify the signal parameters concerning specific mechanisms. Chen et al. (2015) identified the failure mechanism of rock bridges using the AE technique based on the physical model test. It has been shown that AE signals are very effective for identifying a specific failure mechanism (Yang et al., 2015). However, few studies identify the cracking mode of rock using the machine learning method with AE parameters. Thus, it is possible to employ Artificial Intelligent (AI) technique to analyse AE signal. (Li et al., 2021a; Wang C. et al., 2021; Li et al., 2021b; Wang T. et al., 2021; Li et al., 2022). Yang et al. (2015) concluded that the frequency of AE signals could be regarded as a key indicator in discriminating the failure types of thermal barrier coatings using automatic cluster analysis. Artificial neural network (ANN) has been reported to predict the ultimate strength of aluminium 6061 strengthened by silicon carbide particles based on AE parameters (Loo Christopher et al., 2019). This paper proposes a simple method for discriminating rock-fracture mechanisms based on the clustering of AE parameters. In this case, an unsupervised machine learning method, namely the k-means clustering algorithm (Sause et al., 2012; Nopiah et al., 2013; Li et al., 2014), was employed for classification of AE signals generated by micro-fracturing/cracking. This allowed for identification of diverse mechanisms of stiffness and strength degradation, which could be precursors of catastrophic failure. In recent years, it has been found that many complex dynamic systems have critical transition characteristics at which the system shifts abruptly amongst diverse equilibrium states (Scheffer et al., 2009; Dakos et al., 2012b; Dexing et al., 2019; Tu et al., 2020). Moreover, rock masses tend to show a low resilience when they are close to instability, which is referred to as critical slowing down (CSD). Research indicates that such shifts may be announced in advance by generic leading indicators for critical transitions, such as abrupt increases of temporal autocorrelation coefficient and variance of the observed data in a dynamic system. (Scheffer et al., 2009; Marconi et al., 2020; Nazarimehr et al., 2020).
From the dynamical system point of view, the critical slowing down phenomenon can provide a promising way to identify sudden shifts of rock destruction during the compression test and predict rock failure reasonably. A method for identifying trends in acoustic emissions during diverse stages of loading in sandstone were uncovered. The changes were found to be significant enough to identify changes in the source mechanism. Moreover, it is possible to distinguish if the whole sample is observing early damage, or rather it has experienced extensive degradation and is now prone to collapse. The method can be scaled upwards to develop early-warning systems to forecast collapses of parts of rock massifs.
In this study, to investigate the critical failure characteristics of rock, multi-stage uniaxial compression experiments on sandstone were carried out, and AE signals produced by crack initiation and growth were obtained and analysed. The cracking modes are classified using k-means algorithms. Therefore, allowing for identification critical transitions of rock destruction are analysed based on the CSD theory. The autocorrelation coefficient and the variance of rising angle (RA) indicate that characterize the critical transition.
Experiment
Acoustic Emission Parameters
Acoustic emission (AE) monitoring is a of remarkable non-destructive technique for detecting a real-time micro-fracturing in material. Physically, AE is a phenomenon of radiation of elastic waves in the material, due to the sudden release of strain during to fissure openings. The AE transducers placed on the surface sense the elastic waves as they spread through the material. In general, three major applications of the AE technique are 1) event source location, 2) mechanical performance, and 3) damage evaluation of material. Unlike other non-destructive testing (NDT) methods, the AE technique not only monitors and evaluates crack initiation, propagation and coalescence on the surface but also inside rock material over time, making it useful in the field of rock mechanics.
AE monitoring aims to provide damage-related information in the material, by correlating detected AE signals while fracturing growth. Because of the non-stationary and high-frequency characteristics of the AE phenomena, as shown in Figure 1, a triggering threshold is conventionally set to recognize AE signals.
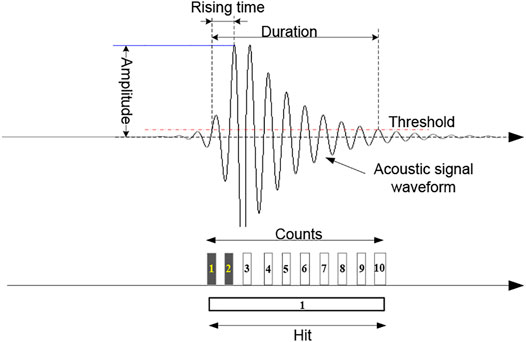
FIGURE 1. Schematic diagram of conventional AE signal features (Ali et al., 2019).
Figure 1 illustrates the definition of conventional AE parameters, which can be explained as follows (Ali et al., 2019):
1) Amplitude is the maximum measured voltage in a signal waveform, which is directly related to the AE energy release in the dislocation. The units of decibels (dB) or millivolt (mV) are often used to indicate the AE amplitude.
2) Duration is defined as the time length between the first and the last threshold crossings by the AE signal. The unit of duration is generally expressed in microseconds (
3) Rise time is the time interval between the triggering time of the AE signal and the time of AE signal peak. Similar to the duration, the rise time is generally expressed in microseconds (
4) AE counts are used for describing the number of times where the signal exceeds the threshold. The number of counts is also used to quantify the AE activity. In Figure 1, the AE counts is 10.
5) Energy is defined as the area under the rectified signal envelope, with units that usually rely on the AE data acquisition method. In this paper, the energy is proportional to voltage and the duration of a signal.
Additionally, two further parameters were used in this study:
6) RA value: a calculated feature defined as “Rise time” divided by “Amplitude”. The unit of RA is generally expressed in
7) AF value: an average frequency of the AE signal in Hz Hz.
AE Location Technique
One of the most important characteristics of the AE technique is localizing the source of an AE event. Therefore, it allows for assessing of the evolution of cracking phenomena within a rock mass as it is stressed. Following the evolution of source locations, this technique can better identify the behaviour of rock under load.
The principle of 3-D localization is similar to the determination of earthquake hypocentres in seismology, where the arrival time differences of seismic waves at multiple seismometers and the velocity of seismic waves in the Earth crust are recorded. Then triangulation is employed to find the source. In this study, the 3-D localizing algorithm packaged in the AE Win Software is utilized to determine three coordinates and the source time of an event when four travel times are available. Generally, the travel times for 3-D localization can be calculated as follows:
the coordinates
Experimental Setup
Four test samples were prepared from blocks of granite into a cylindrical shape with a length of 100 mm and a diameter of 50 mm according to the ISRM (1981). The AE wave velocity of the samples was determined before the uniaxial tests using a special velocity measuring device (PROCEQ Ultra Sonic Tester).
As shown in Figure 2, the prepared rock sample was placed in the MTS loading frame, controlled by the PC-based servo-controlled hydraulic testing system. Multi-phases force control mode was chosen to verify the relationship between the stress concentration and AE activities in this study. The loads and displacement data were recorded automatically by the testing system during all tests. Two pieces of plastic shim plates were matted between the loading cell and sample to reduce noise generation due to friction and edge effects. An advanced Micro-II Digital AE system was used to monitor AE activities within the rock sample under uniaxial compression conditions. It is a high-speed AE testing and analysing system equipped with the novel digital data acquisition system developed by Physical Acoustical Company in the United States. During the experiment processes, all conventional AE parameters were calculated in real-time by this system. The maximum number of sampling channels is 16. Eight Nano30 type piezoelectric crystal transducers (PZT) with frequency sensitivities between 125 and 750 kHz were fixed to the rock sample to convert dynamic motions at the surface to an electrical signal coupling of the sensors to the samples, which is crucial for proper signal detection. All AE sensors were mounted on the rock surface with superglue to mitigate the attenuation of signal transmission from rock to sensors. A 40 dB pre-amplifier (1220A-AST) was connected to each transducer to improve the signal-to-noise ratio because AE signals are typically weak. The threshold was set at 30 dB to reduce influence of background noises. The sampling rate of the AE system was 3 MHz. The spatial distribution of AE events within the samples was calculated using the abovementioned AE location algorithm based on synchronous data from the multi-channel and displayed in nearly real-time.
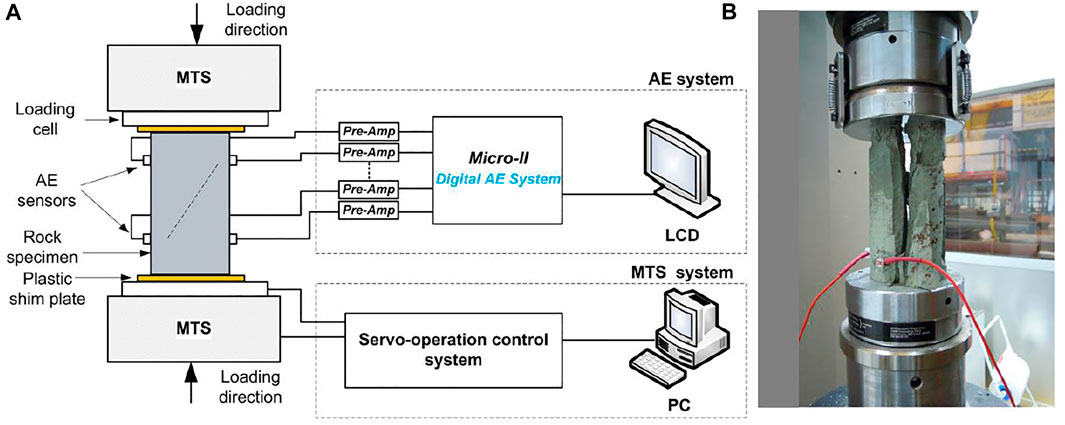
FIGURE 2. Experimental setup, (A) schematic diagram of the laboratory test system, (B) compression test sample.
K-Means Classification and CSD Indicators
Determination of Principal AE Parameters
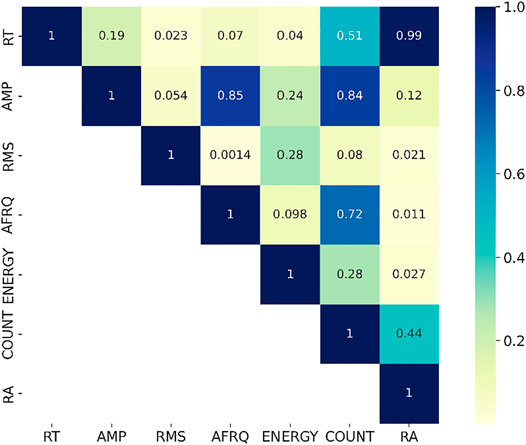
During the experiment, AE parameters were extracted (see Figure 1) to describe an individual AE event signal quantitatively. Commonly, the number of cracks can be reflected by the counts of AE events. Amplitude and energy are usually used to describe the strength of the AE signal, which is associated with the size of cracks. The duration, frequency and rise time are used to identify the source characteristics (Grosse & Ohtsu, 2008; Yang et al., 2015). However, some parameters are highly correlated making co-linearity an issue. Pearson correlation analysis was carried out among these acoustic emission parameters before clustering. Two-nine hundred groups of acoustic emission hits were selected for calculating the correlation coefficients among seven parameters, namely, rise time (RT), Count (COUNT), Amplitude (AMP), Average frequency (AFRQ), energy, the ratio of RT and AMP (RA), root mean squared of acoustic emission (RMS). As shown in Figure 3, the correlation coefficient between RT and RA value indicates that the two parameters are highly correlated, while other correlated parameter couples were indicated with deeper bule colour. Accordingly, five parameters, including the RT, AMP, RMS, AFRQ and ENERGY, were selected for clustering of AE signals associated with rock failure in the study.
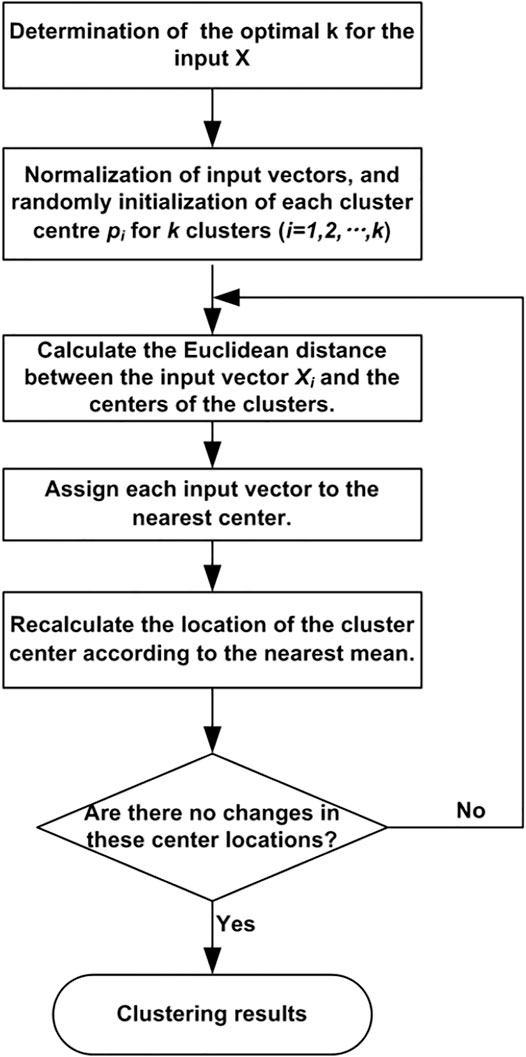
Description of K-Means Algorithm
The k-means clustering algorithm is one of the simplest pattern recognition algorithms that aims at partitioning the data set into a specific number of clusters. It was firstly proposed by James MacQueen in 1967 (MacQueen, 1967). In this study, the k-means algorithm is utilized to classify AE signals collected into a few categories to recognize the occurrence and propagation of micro-cracks and large-cracks while the samples are subjected to uniaxial compression in the laboratory. Classification of features would be essential in detecting the AE signal linked to various rock failure mechanisms.
Given an input data set constructed with feature vectors
where pj is the centre of cluster cj. Figure 4 shows the flow chart of the
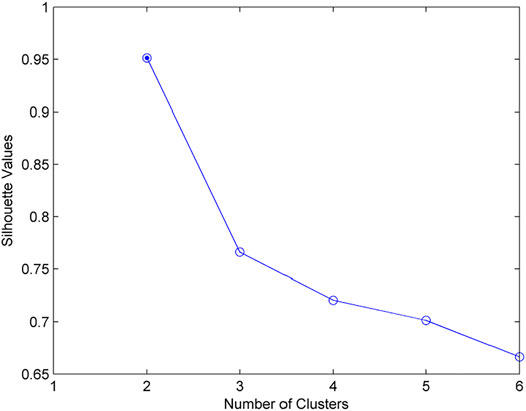
To obtain the optimal number of clusters, values from two to six are chosen and tested to calculate the silhouette values at the first stage of the clustering procedure. The quality of each k clustering solution is evaluated according to the silhouette values previously defined (Gutkin et al., 2011; Momon et al., 2012; Yang et al., 2015):
where,
CSD Indicators: Autocorrelation Coefficient and Variance
To investigate the precursor prediction method for rock macroscopic failure in terms of various AE parameters, analysis of variance, and autocorrelation coefficient are introduced as specific features to seek their relationship with time based on the critical slowing down (CSD) theory (Scheffer et al., 2009). In this paper, the time series of variance and autocorrelation function of AE parameters during the whole process is computed by rolling time window to define the mutation of characteristics approaching the failure.
Analysis of variance is a common method describing the degree to which data in a sample deviates from the mean value, which can be presented as (Dakos et al., 2012a):
In CSD theory, the rate of return to equilibrium following a perturbation slows down as systems approach critical transitions (Dakos et al., 2012a; DAKOS et al., 2012b; Dakos et al., 2015). And this slow return rate can be detected by changes in the autocorrelation function of a time series. Autocorrelation is the simplest method to detect slowing down. An increase in autocorrelation at-lag-1 indicates that the state of the system has become increasingly similar between consecutive observations (Dakos et al., 2012a; van de Leemput et al., 2014).
The autocorrelation coefficient is supposed to be obtained as follows:
where lag is the lag step of characteristic time series, n is the sequence length used to calculate the autocorrelation coefficient,
Results
Clustering of AE Signals
Rise time (RT), Amplitude (A), Average Frequency (AF), RMS of AE signals from uniaxial rock compression tests were extracted as the principal feature parameters to form the input vector in the clustering algorithm. As suggested by previous, the silhouette value is supposed to be over 0.6 to ensure sufficient quality of clustering (Gutkin et al., 2011; Momon et al., 2012; Yang et al., 2015). Figure 5 presents a trend of the silhouette value as a function of cluster k from AE data obtained in the rock failure tests. It is worthy to note that the silhouette value reaches the maximum of 0.953 (>0.6) when k equals 2, which ensures clustering efficiency.
Accordingly, the optimum cluster number k for the rock sample under the uniaxial compression test is 2, suggesting that the AE data is divided into two clusters. Figure 6 illustrates the distributions of these two clusters (labelled as cluster A and cluster B, respectively) of the AE data in various parametric spaces. In Figure 5 a-e, clusters A and B can be easily distinguished based on their rise time (RT) distributions, which show low-class overlapping, suggesting a precise clustering process. Cluster A was composed of AE events with a rise time lower than 2.273 ms. In contrast, Cluster B was characterised with long RT (>2.3 ms). Meanwhile, it is worth noting that cluster B generally has a greater RA value, larger amplitude, more counts, and is more decentralized than cluster A according to the centroid distribution of clusters. It also reveals that cluster A has a significantly higher number of AE events than cluster B. Clusters A and B are clearly distinguished in AE parametric spaces with RT (see Figures 6A–E), while in the spaces without RT are confused together (as shown in Figure 6F), two clusters of AE events partially overlapped and were difficult to distinguish. As a result, RT is a key parameter for discriminating the two types of AE signals, indicating two different rock failure mechanisms (tensile and shear mode).
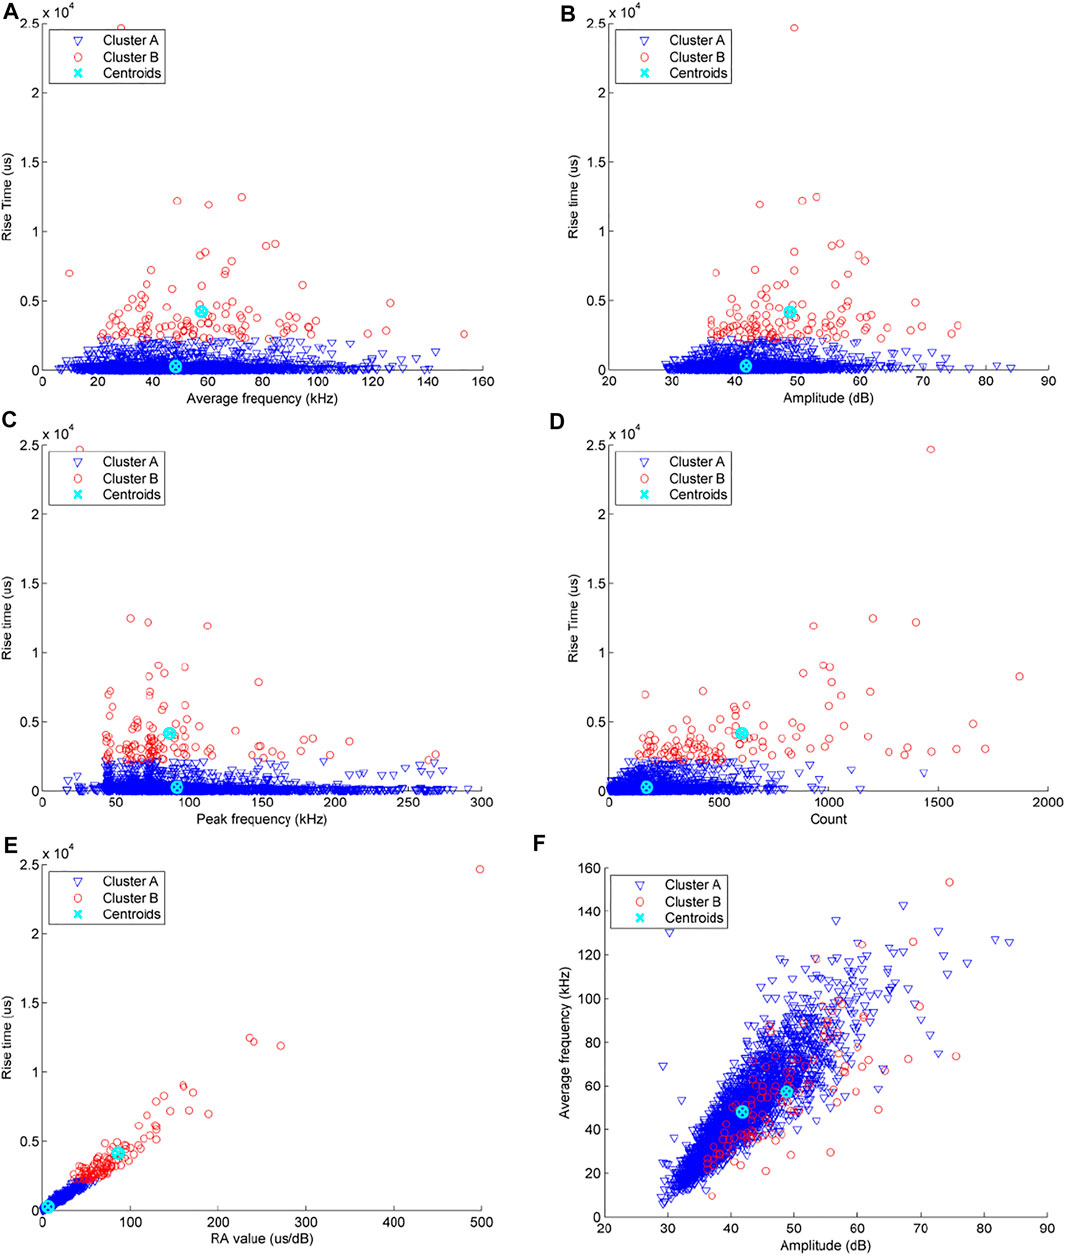
FIGURE 6. The distribution of two clusters of AE signal (labelled cluster A and B respectively) of rock under uniaxial compression in (A) Average frequency-Rise time space, (B) Amplitude-Rise time space, (C) Peak frequency-Rise time space, (D) Count-Rise time space, (E) RA value-Rise time space, (F) Amplitude-Average frequency space.
Evolution of Clustered AE Activities
To further know the evolution process of fracture modes, Figures 7A,B demonstrate the measured AE count over the loading time and the amplitude distributions of the two classes, respectively. Similar conclusions can be drawn for the remaining three rock samples under uniaxial compression.
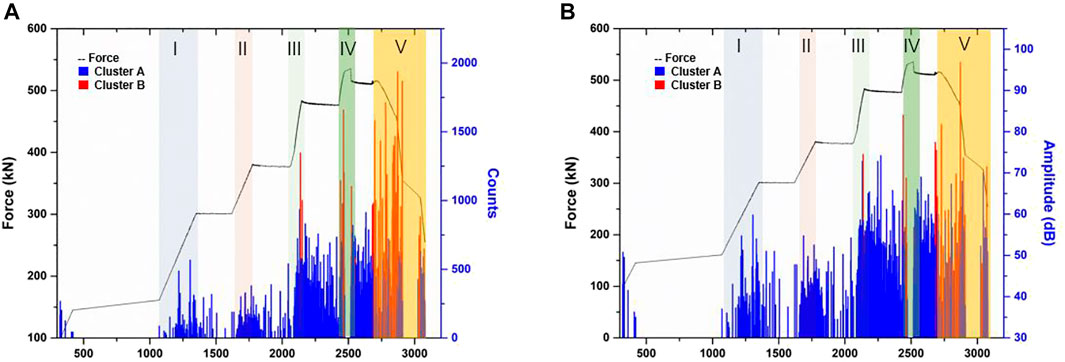
FIGURE 7. Temporal distributions of AE parameters count (A) and amplitude (B) of two classified AE signals corresponding to two cracking modes in rock. Cluster A and B are indicated with blue and red respectively.
A multi-phase loading strategy was carried out in our study to investigate the pre-failure characteristics of the rock. The rock sample was compressed in force-controlled mode with a loading speed of 30 kN/min during phases I and II, while the same controlled mode with a loading speed of 75 kN/min was implemented for phases III and IV.
The number of AE signals indirectly indicates the generation and development of internal micro-cracks. Figure 7 shows the evolution of micro-cracking activities, in which different cracking modes release different clusters of AE signals. In temporal property, the rock cracking mechanisms hold the following characteristics:
1) With the increase of loading force, stress concentration leads to crack occurrence and propagation, followed by more frequent acoustic emission. The AE count peak values increase as the load rate becomes larger before reaching the maximum strength of the rock sample.
2) Cluster A dominates the AE activities in the fracture process before reaching peak strength (phases I-IV), while Cluster B dominates the AE activities in the strain softening phase (V). Almost all AE events that load with less than 2000 s belong to cluster A, after which the AE events associated with the fracturing mechanism of cluster B become notoriously significant. Eventually, cluster B almost nearly dominates the strain softening phase (V). It is worth noting that those AE events of cluster B only appear during the increasing force periods (e.g., III, IV).
3) In the pre-failure point, longer-duration and larger-amplitude AE signals in cluster B began to be observed. Consequently, the appearance of AE signals of cluster B can be considered as a precursor of rock failure.
According to Figure 8, AE signals associated with the fracturing source of cluster A predominate in the early stage of the loading path. The total number of AE signals of cluster B begins to increase at 75% of the crucial strength of the sample. The total energy corresponding to fractures of cluster B is increasing rapidly during the post-damage phase, presenting a sudden release of the stored strain-energy due to the stress concentration in the stage of deformation (less than the 2,500 s in this example) of brittle rock.
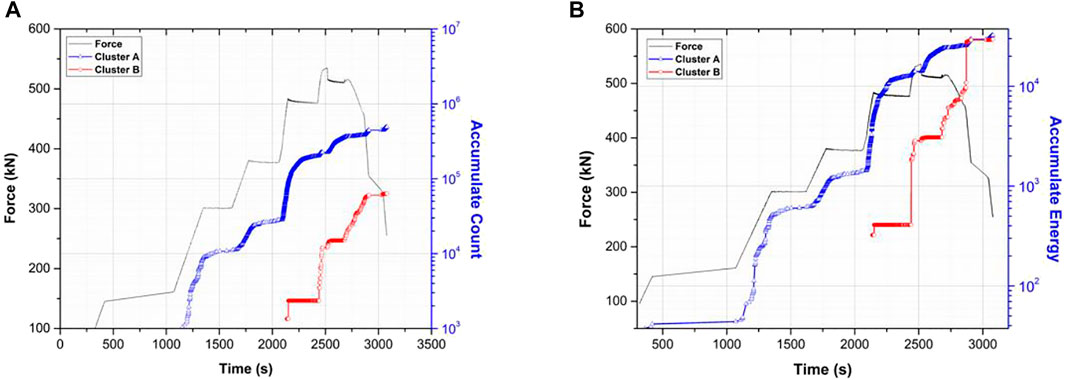
FIGURE 8. Accumulate counts (A) and accumulate energies (B) of two clusters of AE signals corresponding to two cracking modes over entire loading path.
Precursors of Sandstone Failure Based on CSD
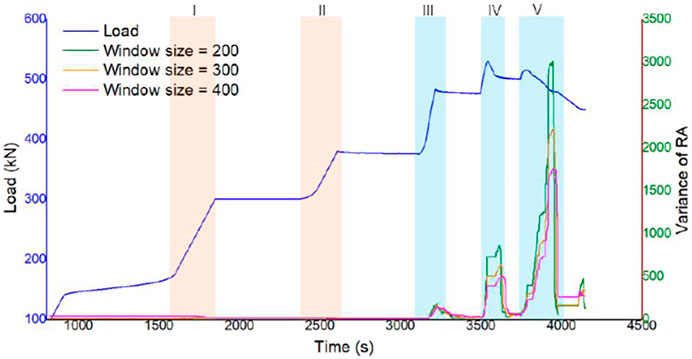
With varying sliding window lengths, the variation of the RA values varies. As revealed by Figure 9, the lower time step sliding window (window size shown in Figure 9) calculates a more sensitive variance fluctuation. The variance of RA value shows a consistent pattern during the loading period, increasing marginally at loading stage III and then gradually decreasing. In the loading stage IV, the variance increases dramatically when the maximum load level is reached, then climbs fast again when the stress following failure is released swiftly, reaching the maximum value in the whole process. As a result, the variation of RA has a major impact when stress concentrates and releases after the rock reaches the plastic fracturing point, indicating that the AE has a clear critical slowing phenomenon. The mechanism by which RA features develop rapidly in the loading process after stage III until they reach the highest value at failure could be considered an obvious precursor feature of rock macroscopic failure.
On the other hand, the 1-lag autocorrelation function of RA value rises dramatically before failure (Figure 10), suggesting a clear critical slowing phenomenon prior to the catastrophic failure of rock. In the loading stage near the failure, the autocorrelation coefficient of the RA value goes up, although the range is smaller than in the failure. However, its autocorrelation function during loading stages I and II do not rise much, suggesting that the internal damage and fracture condition have not shifted appreciably. It improves drastically after entering stage III, implying that the fracture condition has changed dramatically, which is consistent with the findings of the variance study above. Specifically, in rock failure analysis, the shear stress wave with a long rise time is progressively created in the process of deformation and failure after entering stage III, and the gradual growth of microcracks leads to the local shear fracture. Thus, these variations of fracture mechanism can be reflected by the autocorrelation coefficient and variance analysis of RA features. It was found that the start time of critical transition is the same as the start occurrence time of fracture mode cluster B.
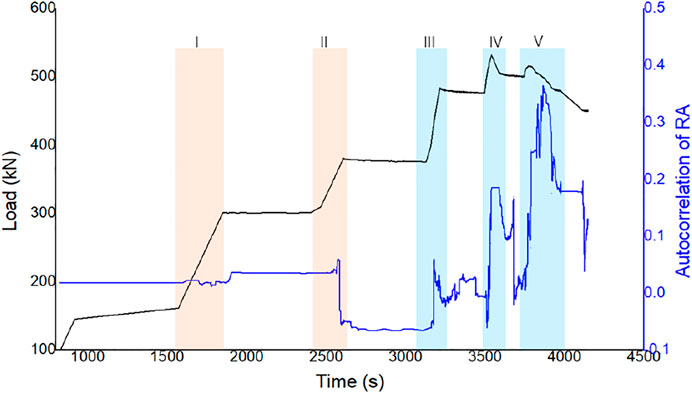
FIGURE 10. Stage changes of autocorrelation coefficient of AE characteristics of rock under multi-phase uniaxial compression.
Discussions
The above experiment results presented that the total monitored AE count increases rapidly when reaching 70 to 80% of the peak strength. This is caused by stress concentration within the sample, and seems to be independent of loading conditions. Factor that (Michihiro et al., 1997) noticed while performing uniaxial compression tests on rock samples. Likewise, AE signals in cluster B were produced until the loading force reached the same ratio of 70–80% of the crucial strength, after which the measured AE count increased rapidly in the subsequent stages. Clearly, two distinct failure mechanism are developing in tandem, as both type A and type B AE signals are observed at the same time. In Figure 6A, the AE activity became stronger at the beginning of each phase and increased with increasing loading force, indicating the development of an interconnected and transmissible network of microscopic cracks. At phase V, however, it characterized a significant increase of the AE activity of cluster B due to the accumulation of cracks in zones of high shear stress, which formed a cone of conjugate shear bands.
As the rock near the final failure, tensile cracks are usually followed by shear cracks. When a tensile crack occurs, the sides of the crack turn away from each other (shown in Figure 10A), resulting in a transient volumetric shift of the rock material. Consequently, most of the energy is transmitted in the form of longitudinal waves. In tensile cracking, the delay between the onset and the peak amplitude is short, whilst in the case of shear cracking, RT is longer than the former because the material around the dislocation experiences distortion instead of volumetric changes (Aggelis et al., 2011). Therefore, AE signals of cluster B have longer rise time and higher amplitude might be generated by the shear fractures in rock samples (See Figure 11). On the other hand, the AE events of cluster A are more prevalent in the early stage of rock deformation with the tensile fracturing mechanism. Aggelis et al. also discriminated different fracture modes in marble under bending test using AE technology and observed that tensile cracking characterized shorter waveform (duration time) unlike shear events (Aggelis et al., 2013). The transition point where the number of AE events of cluster B drastically increases can be used to roughly evaluate the damage level of the rock sample and provide precursor information for rock final failure.
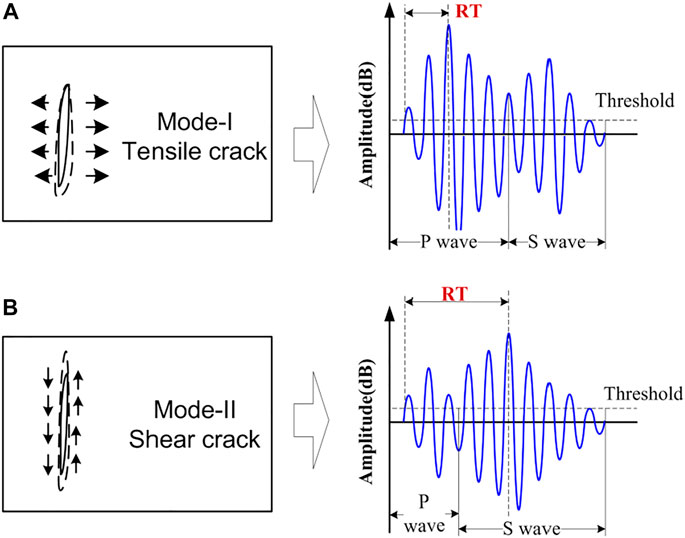
FIGURE 11. Relation between cracking modes and corresponding AE waveforms. (A) Model-I/Tensile crack characterised with lower RT value, while (B) Model-II/Shear crack characterised with longer RT value.
Conclusion
In this study, the k-means algorithm is utilized as an automatic clustering approach to classify and identify AE signals originating from the uniaxial compression test on rock samples. Several principal parameters (e.g., Rise time, Amplitude, Average frequency, etc.) were selected as the input vector of the k-means algorithm by Pearson correlation analysis. The results showed that two clusters of AE events are associated with distinct source mechanisms of rock under the uniaxial compression test. From the distribution results of clustered AE events in multiple parameter correlation spaces, rise time was regarded as the most critical parameter for AE signal classification and the identification of the AE source mechanism. Therefore, the following conclusions can be drawn:
1) The k-means algorithm was proved to be a remarkable tool for AE signals clustering in laboratory rock mechanical tests. The Pearson correlation approach could be used to effectively pick the principal parameters as the input vector of the multivariate analysis-based k-means algorithm.
2) Two types of AE signals were classified using the k-means algorithm combined with four principal parameters, indicating tensile cracking and shear cracking mode, respectively. In this study, rise time was identified as the key feature as the classifier for AE signal clustering. Signals from shear cracking have a longer rise time than cluster A produced by tensile cracking. Cluster B of AE signals for shear cracks have more energy relatively.
3) Cluster A dominated the early stage of rock deformation, whereas AE signals in cluster B appeared and sharply developed about 70–80% of the peak strength of rock. Finally, cluster B dominated the post-failure stage of rock, in which the rise time parameter was more than 2.27 ms. Furthermore, the amplitude and released energy rate from fracturing cluster B were much higher than that from fracturing events of cluster A, which can be caused by the large cracks coalescing or sliding in the fracture zone.
4) It was shown that AE signals in cluster B start to distribute at the critical failure stage of the rock sample and dominate in the post-failure stage. Furthermore, based on the critical slowing down theory, the autocorrelation coefficient and the variance of rising angle (RA) also show abrupt increases, which indicate the critical transition of rock destruction state before collapse. It is worth noting that the start time of CSD is almost the same as with the time of transition of mode from tensile to shear in this study. Compared with the 1-lag autocorrelation function value, the variance of RA is a better indicator of rock destruction. The critical transition of AE parameters can provide a promising way to early warning of rock-related disasters.
Data Availability Statement
The raw data supporting the conclusion of this article will be made available by the authors, without undue reservation.
Author Contributions
XZ: Conceptualization, Methodology, Formal analysis, Investigation, Data curation, Writing—original draft. LW: Methodology, Investigation, Data curation. YY: Conceptualization, Methodology, Validation, Resources, Writing—review and editing, Funding acquisition. WZ: Validation, Writing—review and editing. PZ: Conceptualization, Validation, Writing—review and editing.
Funding
This work was supported by the National Natural Science Foundation of China (Nos. 52108300 and 41877254) and the National Key Research and Development Program (No.2019YFC1509602).
Conflict of Interest
The authors declare that the research was conducted in the absence of any commercial or financial relationships that could be construed as a potential conflict of interest.
Publisher’s Note
All claims expressed in this article are solely those of the authors and do not necessarily represent those of their affiliated organizations, or those of the publisher, the editors and the reviewers. Any product that may be evaluated in this article, or claim that may be made by its manufacturer, is not guaranteed or endorsed by the publisher.
References
Aggelis, D. G., Kordatos, E. Z., and Matikas, T. E. (2011). Monitoring of Metal Fatigue Damage Using Acoustic Emission and Thermography. J. Acoust. Emission 29, 113–122.
Aggelis, D. G., Mpalaskas, A. C., and Matikas, T. E. (2013). Acoustic Signature of Different Fracture Modes in marble and Cementitious Materials under Flexural Load. Mech. Res. Commun. 47, 39–43. doi:10.1016/j.mechrescom.2012.11.007
Ali, S. M., Hui, K. H., Hee, L. M., Leong, M. S., Abdelrhman, A. M., and Al-Obaidi, M. A. (2019). Observations of Changes in Acoustic Emission Parameters for Varying Corrosion Defect in Reciprocating Compressor Valves. Ain Shams Eng. J. 10 (2), 253–265. doi:10.1016/j.asej.2019.01.003
Chen, G., Zhang, Y., Huang, R., Guo, F., and Zhang, G. (20152015). Failure Mechanism of Rock Bridge Based on Acoustic Emission Technique. J. Sensors 2015, 1–11. doi:10.1155/2015/964730
Cremen, G., and Galasso, C. (2020). Earthquake Early Warning: Recent Advances and Perspectives. Earth-Science Rev. 205, 103184. doi:10.1016/j.earscirev.2020.103184
Cui, S., Pei, X., Jiang, Y., Wang, G., Fan, X., Yang, Q., et al. (2021). Liquefaction within a Bedding Fault: Understanding the Initiation and Movement of the Daguangbao Landslide Triggered by the 2008 Wenchuan Earthquake (Ms = 8.0). Eng. Geology. 295, 106455. doi:10.1016/j.enggeo.2021.106455
Dakos, V., Carpenter, S. R., Brock, W. A., Ellison, A. M., Guttal, V., Ives, A. R., et al. (2012a). Methods for Detecting Early Warnings of Critical Transitions in Time Series Illustrated Using Simulated Ecological Data. PLoS One 7 (7), e41010. doi:10.1371/journal.pone.0041010
Dakos, V., Carpenter, S. R., Van Nes, E. H., and Scheffer, M. (2015). Resilience Indicators: Prospects and Limitations for Early Warnings of Regime Shifts. Phil. Trans. R. Soc. B: Biol. Sci. 370 (1659), 0263. doi:10.1098/rstb.2013.0263
Dakos, V., van Nes, E. H., D'Odorico, P., and Scheffer, M. (2012b). Robustness of Variance and Autocorrelation as Indicators of Critical Slowing Down. Ecology 93 (2), 264–271. doi:10.1890/11-0889.1
Dexing, L., Enyuan, W., Xiangguo, K., Haishan, J., Dongming, W., and Muhammad, A. (2019). Damage Precursor of Construction Rocks under Uniaxial Cyclic Loading Tests Analyzed by Acoustic Emission. Construction Building Mater. 206, 169–178. doi:10.1016/j.conbuildmat.2019.02.074
Gutkin, R., Green, C. J., Vangrattanachai, S., Pinho, S. T., Robinson, P., and Curtis, P. T. (2011). On Acoustic Emission for Failure Investigation in CFRP: Pattern Recognition and Peak Frequency Analyses. Mech. Syst. Signal Process. 25 (4), 1393–1407. doi:10.1016/j.ymssp.2010.11.014
Hedayat, A., Pyrak-Nolte, L. J., and Bobet, A. (2014). Precursors to the Shear Failure of Rock Discontinuities. Geophys. Res. Lett. 41 (15), 5467–5475. doi:10.1002/2014gl060848
Jian-Po, L., Yuan-Hui, L., Shi-Da, X., Shuai, X., and Chang-Yu, J. (2015). Cracking Mechanisms in Granite Rocks Subjected to Uniaxial Compression by Moment Tensor Analysis of Acoustic Emission. Theor. Appl. Fracture Mech. 75, 151–159. doi:10.1016/j.tafmec.2014.12.006
Li, H., Deng, J., Feng, P., Pu, C., Arachchige, D. D. K., and Cheng, Q. (2021a). Short-Term Nacelle Orientation Forecasting Using Bilinear Transformation and ICEEMDAN Framework. Front. Energ. Res. 9, 780928. doi:10.3389/fenrg.2021.780928
Li, H., Deng, J., Yuan, S., Feng, P., and Arachchige, D. D. K. (2021b). Monitoring and Identifying Wind Turbine Generator Bearing Faults Using Deep Belief Network and EWMA Control Charts. Front. Energ. Res. 9, 799039. doi:10.3389/fenrg.2021.799039
Li, H., He, Y., Xu, Q., Deng, J., Li, W., and Wei, Y. (2022). Detection and Segmentation of Loess Landslides via Satellite Images: a Two-phase Framework. Landslides 19, 673–686. doi:10.1007/s10346-021-01789-0
Li, Y., Wang, Q., Chen, J., Xu, L., and Song, S. (2014). K-means Algorithm Based on Particle Swarm Optimization for the Identification of Rock Discontinuity Sets. Rock Mech. Rock Eng. 48 (1), 375–385. doi:10.1007/s00603-014-0569-x
Liu, X., Han, M., He, W., Li, X., and Chen, D. (2020). A New B Value Estimation Method in Rock Acoustic Emission Testing. J. Geophys. Res. Solid Earth 125 (12). doi:10.1029/2020jb019658
Liu, X., Liang, Z., Zhang, Y., Wu, X., and Liao, Z. (20152015). Acoustic Emission Signal Recognition of Different Rocks Using Wavelet Transform and Artificial Neural Network. Shock and Vibration 2015, 1–14. doi:10.1155/2015/846308
Loo Christopher, C. M., Sasikumar, T., and Suresh, S. (2019). Analysis of Failure Mode and Fracture Behavior by Using Acoustic Emission Parameter and Artificial Neural Network. Eng. Res. Express 1 (1). doi:10.1088/2631-8695/ab3268
Macqueen, J. B. (1967). Some Methods for Classification and Analysis of Multivariate Observations. Proc. Fifth Berkeley Symp. Math. Stat. Probabilty 1, 281–297.
Marconi, M., Métayer, C., Acquaviva, A., Boyer, J. M., Gomel, A., Quiniou, T., et al. (2020). Testing Critical Slowing Down as a Bifurcation Indicator in a Low-Dissipation Dynamical System. Phys. Rev. Lett. 125 (13), 134102. doi:10.1103/physrevlett.125.134102
Michihiro, K., Hata, K., Fujiwara, T., and Yoshioka, H. (1997). Prediction of Failure in Rock Masses by Acoustic Emission. Mater. Sci. Res. Int. 3 (2), 106–111. doi:10.2472/jsms.46.6appendix_106
Momon, S., Godin, N., Reynaud, P., R’Mili, M., and Fantozzi, G. (2012). Unsupervised and Supervised Classification of AE Data Collected during Fatigue Test on CMC at High Temperature. Composites A: Appl. Sci. Manufacturing 43 (2), 254–260. doi:10.1016/j.compositesa.2011.10.016
Moradian, Z. A., Ballivy, G., and Rivard, P. (2012). Application of Acoustic Emission for Monitoring Shear Behavior of Bonded concrete-rock Joints under Direct Shear Test. Can. J. Civ. Eng. 39 (8), 887–896. doi:10.1139/l2012-073
Moradian, Z., Einstein, H. H., and Ballivy, G. (2016). Detection of Cracking Levels in Brittle Rocks by Parametric Analysis of the Acoustic Emission Signals. Rock Mechanics Rock Eng. 49 (3), 785–800. doi:10.1007/s00603-015-0775-1
Murton, J. B., Kuras, O., Krautblatter, M., Cane, T., Tschofen, D., Uhlemann, S., et al. (2016). Monitoring Rock Freezing and Thawing by Novel Geoelectrical and Acoustic Techniques. J. Geophys. Res. Earth Surf. 121 (12), 2309–2332. doi:10.1002/2016jf003948
Nazarimehr, F., Jafari, S., Perc, M., and Sprott, J. C. (2020). Critical Slowing Down Indicators. EPL (Europhysics Letters) 132 (1). doi:10.1209/0295-5075/132/18001
Nopiah, Z. M., Junoh, A. K., and Ariffin, A. K. (2013). K-means Clustering and Neural Network for Evaluating Sound Level Vibration in Vehicle Cabin. J. Vibration Control. 21 (9), 1698–1720. doi:10.1177/1077546313488408
Sause, M. G. R., Gribov, A., Unwin, A. R., and Horn, S. (2012). Pattern Recognition Approach to Identify Natural Clusters of Acoustic Emission Signals. Pattern Recognition Lett. 33 (1), 17–23. doi:10.1016/j.patrec.2011.09.018
Scheffer, M., Bascompte, J., Brock, W. A., Brovkin, V., Carpenter, S. R., Dakos, V., et al. (2009). Early-warning Signals for Critical Transitions. Nature 461 (7260), 53–59. doi:10.1038/nature08227
Tu, C., D’odorico, P., and Suweis, S. (2020). Critical Slowing Down Associated with Critical Transition and Risk of Collapse in Crypto-Currency.
Van De Leemput, I. A., Wichers, M., Cramer, A. O. J., Borsboom, D., Tuerlinckx, F., Kuppens, P., et al. (2014). Critical Slowing Down as Early Warning for the Onset and Termination of Depression. Proc. Natl. Acad. Sci. U.S.A. 111 (1), 87–92. doi:10.1073/pnas.1312114110
Vidya Sagar, R., and Dutta, M. (2019). Combined Usage of Acoustic Emission Technique and Ultrasonic Pulse Velocity Test to Study Crack Classification in Reinforced concrete Structures. Nondestructive Test. Eval., 1–35. doi:10.1080/10589759.2019.1692013
Wang, C., Chang, X., Liu, Y., and Gong, F. (2021a). Experimental Study on Fracture Patterns and Crack Propagation of Sandstone Based on Acoustic Emission. Adv. Civil Eng. 2021, 1–13. doi:10.1155/2021/8847158
Wang, T., Wang, L., Xue, F., and Xue, M. (2021b). Identification of Crack Development in Granite under Triaxial Compression Based on the Acoustic Emission Signal. Int. J. Distributed Sensor Networks 17 (1). doi:10.1177/1550147720986116
Yang, L., Kang, H. S., Zhou, Y. C., Zhu, W., Cai, C. Y., and Lu, C. (2015). Frequency as a Key Parameter in Discriminating the Failure Types of thermal Barrier Coatings: Cluster Analysis of Acoustic Emission Signals. Surf. Coat. Tech. 264, 97–104. doi:10.1016/j.surfcoat.2015.01.014
Yin, Y., Wang, L., Zhang, W., Zhang, Z., and Dai, Z. (2022). Research on the Collapse Process of a Thick-Layer Dangerous Rock on the Reservoir Bank. Bull. Eng. Geol. Environ. 81, 02618. doi:10.1007/s10064-022-02618-x
Zhang, G., Li, H., Wang, M., Li, X., Wang, Z., and Deng, S. (2019). Crack-induced Acoustic Emission and Anisotropy Variation of Brittle Rocks Containing Natural Fractures. J. Geophys. Eng. 16 (3), 599–610. doi:10.1093/jge/gxz031
Keywords: k-means, acoustic emission, rock failure, critical slowing down, precursory signature
Citation: Zhu X, Wang L, Yang Y, Zhang W and Zhang P (2022) Cracking Modes and AE Precursors of Sandstone Failure Under Multi-Stage Uniaxial Compression. Front. Earth Sci. 10:874543. doi: 10.3389/feart.2022.874543
Received: 12 February 2022; Accepted: 18 March 2022;
Published: 06 April 2022.
Edited by:
Jingren Zhou, Sichuan University, ChinaReviewed by:
Yunzhong Jia, Uppsala University, SwedenAndres Felipe Alonso Rodriguez, University of Liverpool, United Kingdom
Copyright © 2022 Zhu, Wang, Yang, Zhang and Zhang. This is an open-access article distributed under the terms of the Creative Commons Attribution License (CC BY). The use, distribution or reproduction in other forums is permitted, provided the original author(s) and the copyright owner(s) are credited and that the original publication in this journal is cited, in accordance with accepted academic practice. No use, distribution or reproduction is permitted which does not comply with these terms.
*Correspondence: Yang Yang, eXl5b3VuZ0BjcXUuZWR1LmNu
 Xing Zhu1
 Luqi Wang
 Yang Yang
 Wengang Zhang