 Xing Huang
 Xin Yin
 Bin Liu1
94% of researchers rate our articles as excellent or good
Learn more about the work of our research integrity team to safeguard the quality of each article we publish.
Find out more
ORIGINAL RESEARCH article
Front. Earth Sci., 28 February 2022
Sec. Geohazards and Georisks
Volume 10 - 2022 | https://doi.org/10.3389/feart.2022.857463
This article is part of the Research TopicGeological Disasters in Deep Engineering Mechanism, Warning and Risk mitigationView all 39 articles
Surrounding rock squeezing deformation is a common and prominent hazard in tunnel engineering projects, which often induces the shield jamming disaster during the TBM tunneling process. Based on the 139 groups of historical squeezing deformation cases, this study developed a hybrid PCA-IWGO-PNN model for squeezing classification. According to the influencing factors and characteristics of squeezing deformation, the strength-stress ratio, tunnel burial depth, tunnel equivalent diameter, rock mass quality index, and support stiffness were selected to establish the prediction index system of squeezing level. Because the probabilistic neural network (PNN) requires that the input variables are independent, principal component analysis (PCA) was used to preprocess the original data to eliminate the correlation between prediction indexes and achieve dimensionality reduction. The spread coefficient was the critical hyper-parameter in the PNN, and the improved gray wolf optimization (IGWO) algorithm was used to realize its efficient automatic optimization. Then, the PNN model was applied to engineering practice. Only 1 of 20 test samples was misjudged, achieving the 95% prediction accuracy. Finally, the comparison analysis with the artificial neural network (ANN) model, support vector machine (SVM) model, and random forest (RF) model was conducted. Among them, the PNN model achieved the highest prediction accuracy, followed by the artificial neural network (85%), RF (85%), and SVM (80%). In addition, the PNN model had the fastest running speed, which only consumed 5.6350 s, while the running time of ANN, SVM, and RF was 8.8340, 6.2290, and 6.9260 s, respectively. The hybrid PCA-IWGO-PNN model developed in this research provides an effective method for surrounding rock squeezing classification, and it has superiorities in both prediction accuracy and running speed.
In recent years, limited by the shallow resources, underground space development and tunnel engineering construction have ushered in a peak period (Zhu et al., 2019). TBM (tunnel boring machine) is widely used in deep-buried and ultra-long tunnels because of high excavation efficiency, low construction cost, and minor environmental disturbance (Liu et al., 2016). However, most of these tunnels are located in areas with high seismic intensity, complex surface topography, and harsh geological conditions. These tunnels’ safe and efficient construction faces enormous challenges, especially when TBM traverses the deep-buried, high-stress, weak, and broken stratum. Due to the narrow overcut gap between the TBM shield and surrounding rock, shield jamming disaster will be caused when the squeezing deformation of surrounding rock exceeds the overcut gap (Hasanpour et al., 2014). The handling of TBM jamming accidents not only seriously delays the construction schedule and threatens the safety of equipment and workers, but also causes huge economic losses and social impacts. Therefore, carrying out the study on the advancing prediction of surrounding rock squeezing levels is essential for TBM jamming disaster prevention and control.
Early studies primarily focused on empirical criteria, such as Singh B (Singh et al., 1992), Jimenez R (Jimenez and Recio, 2011) and Farhadian H (Farhadian and Nikvar-Hassani, 2020) proposed empirical criteria based on tunnel burial depth and rock quality index, and Jethwa J L (Jethwa, 1981), Aydan (Aydan et al., 1996), and Barla G (Barla, 1995) put forward empirical criteria based on tunnel burial depth, rock specific gravity, and uniaxial compressive strength. However, squeezing level prediction is a complex nonlinear problem, and it is difficult for empirical criteria to consider this nonlinear relationship between influencing factors and squeezing. With the deepening of researches, some soft science methods based on artificial intelligence have been introduced to solve nonlinear problems (Liu et al., 2020; Yin et al., 2021a; Zhang et al., 2020a; Zhang et al., 2021b; Yin et al., 2021b; Ge et al., 2021; Zhang et al., 2021a; Yin et al., 2022; Ge et al., 2022; Zhang and Phoon, 2022). Zhang J et al. (Zhang et al., 2020b) proposed a BP neural network method for predicting the squeezing level. Feng X and Jimenez R (Feng and Jimenez, 2015) adopted the strength-stress ratio, tunnel burial depth, tunnel diameter, rock quality index, and support stiffness as predictive indicators and established a Bayesian network (BN) model to predict the squeezing level. Sousa et al. (Sousa and Einstein, 2011) proposed a Bayesian network (BN)-based perception model of harsh geological conditions in front of the tunnel face with TBM tunneling data. R. Hasanpour et al. (Hasanpour et al., 2020a) applied the artificial neural network (ANN) and Bayesian network (BN) to TBM tunneling risk assessment under adverse geological conditions, such as the large squeezing deformation. Sun Y et al. (Sun et al., 2018) proposed a multi-class support vector machine (SVM) method based on tunnel burial depth, tunnel diameter, rock quality index, and support stiffness to evaluate the squeezing level. Chen Y et al. (Chen et al., 2020) developed a novel probabilistic multi-classification prediction framework for the squeezing level. The above prediction methods reveal the laws of squeezing occurrence from different aspects, which enriches the theory of squeezing deformation prediction. However, due to many factors influencing squeezing deformation, its inoculation mechanism is still unclear. It is necessary to make full use of the evaluation index information, explore the intrinsic relationship between the evaluation index characteristics and squeezing level, and combine multiple prediction techniques to conduct the squeezing level prediction, achieving a higher accuracy. Therefore, this study developed a novel multi-algorithm fusion prediction model based on PCA-IGWO-PNN for the squeezing level.
Probabilistic neural network (PNN) has the advantages of simple structure, easy training, fast convergence speed, and robust fault tolerance, etc. It can use a linear learning algorithm to realize the function of a nonlinear learning algorithm, and it has been widely applied to pattern classification problems such as fault diagnosis (Zhang et al., 2021c). When the activation function of the PNN adopts the Gaussian function, the evaluation index need to be uncorrelated and identically distributed. In fact, there is a certain correlation between most of the evaluation indexes of squeezing levels and it is necessary to eliminate the correlation between them before applying PNN.
Common methods to eliminate the correlation between variables include limiting the number of variables, separating overlapping elements, modifying indicator weights, principal component analysis, and factor analysis, etc. Considering that there are multiple evaluation indexes selected in this research, the principal component analysis method (PCA) is used to preprocess the evaluation indexes of squeezing levels. In addition to eliminating the correlation between the indexes, it can also achieve dimensionality reduction and improve the training and prediction speed of the PNN. Finally, this study established a hybrid squeezing level prediction model based on the PCA and PNN, and the hyper-parameter of PNN was automatically tuned by the improved gray wolf optimization (IGWO) algorithm.
Probabilistic neural network (PNN) is based on the radial basis neural network, using activation functions derived from statistical methods to replace sigmoid activation functions. The decision boundary realized by PNN approaches the Bayesian optimal decision surface, which is an organic fusion of radial basis network, Bayesian decision theory, and non-parametric probabilistic density function estimation (Sanal Kumar and Bhavani, 2019). The PNN network is composed of input, pattern, accumulation, and output layers (Dukov et al., 2019), and the network topology is shown in Figure 1.
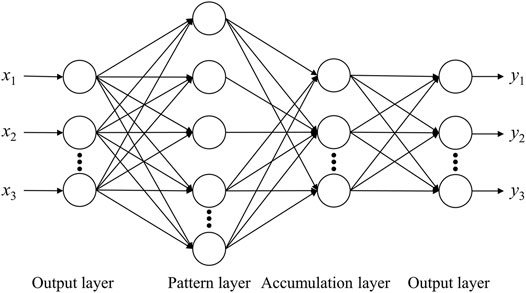
FIGURE 1. The topology of probabilistic neural network.
The input layer receives training samples and the number of neurons is equal to the length of the input vector.
The pattern layer is used to calculate the matching relationship between the input vector and each pattern and returns a scalar value. The number of neurons in this layer is the same as the number of input training samples. The vector x is input to the pattern layer, then the output relationship of the j-th neuron of the i-th type pattern in the pattern layer is:
where: d is the dimension of the metric space, σ is the spread coefficient, xij is the j-th center of the i-th sample, and ϕij is the output value of the j-th neuron of the i-th pattern in the pattern layer.
The main function of the accumulation layer is a linear summation and then weighted average. The number of neurons in this layer is the same as the total number of patterns.
The output layer is composed of competing neurons. The number of neurons is the same as the total number of patterns and each neuron corresponds to a pattern. The output of the neuron with the maximum posterior probability density is 1 and the others are 0.
Gray wolf optimization algorithm is an intelligent algorithm based on the social behavior of wolves. Its basic idea is to search and locate prey for wolves with three leadership levels: α, β, and γ according to hierarchical social characteristics, and guide ω wolf to track and capture prey. The implementation steps of the gray wolf optimization algorithm are described in (Mirjalili et al., 2014a). The gray wolf optimization algorithm has fast optimization speed and high accuracy, but it still has the shortcoming of being easy to fall into the local optimum. Therefore, this paper proposes two strategies to improve the algorithm.
The performance of traditional gray wolf optimization algorithm is affected by the convergence factor a. The linear decreasing strategy of a cannot meet the balance of global and local search. Therefore, this paper proposes a cosine-based non-linear decreasing strategy (Eq. 2). This strategy is shown in Figure 2. As a gradually decreases, the ergodicity increases in the early stage and the local search can be emphasized later to balance the algorithm’s global and local search capabilities.
Where: t is the current iteration number; n is the maximum iteration number.
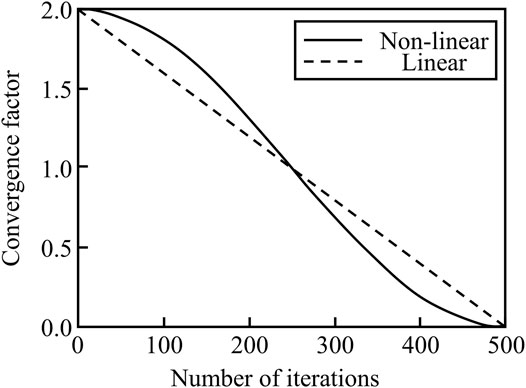
FIGURE 2. Convergence factor decreasing strategy.
In the traditional gray wolf optimization algorithm, the guidance of α wolf, β wolf, and γ wolf to ω wolf is the same, which violates the unique social hierarchical characteristics of the algorithm. So, a dynamic weighting strategy based on Euclidean distance is proposed to handle this problem (Mirjalili et al., 2014b).
This strategy mainly calculates the learning ability of ω wolf against α wolf, β wolf, and γ wolf in the iterative process, and then finds the updated position of ω wolf under the guidance of α wolf, β wolf, and γ wolf, which can be expressed as:
When a correlation exists between input variables, it will increase the information redundancy, and then increase the running time of the model (Yin et al., 2021c). To eliminate the correlation, dimensionality reduction provides a practical way, such as principal component analysis (PCA) (Schimit and Pereira, 2018).
The detailed procedure of PCA is introduced as follows:
1) Establish the raw data matrix
2) Standardize the raw data matrix using;
where:
3) Calculate the correlation coefficient matrix
where:
4) Calculate the eigenvalues
5) Obtain the data matrix after dimensionality reduction using
where:
The ratio (
The model’s framework is: (1) Collect squeezing cases according to the selected indicators; (2) In order to eliminate the dimension and magnitude order differences between indicators, standardize the original data; (3) Use principal component analysis (PCA) to preprocess the data for eliminating the correlation between indicators and reducing data dimensionality; (4) Set the IGWO parameters such as the number of wolves, the maximum number of iterations, etc.; (5) Initialize the location of the wolf pack, utilize α wolf, β wolf and γ wolf to guide ω wolf, and select Eq. 11 as the fitness function; (6) Input the training and validation sets into the PNN and introduce the IGWO algorithm for iterative search to obtain the optimal spread coefficient σ of the PNN; (7) Bring the test set into the trained PNN and output the prediction results of the squeezing level; (8) Compare the prediction results of the PCA-IGWO-PNN with the actual situations and the prediction results of other models.
where: Accuracy is the model’s prediction accuracy on the validation set.
A total of 139 squeezing cases were collected from (Jiao et al., 2021), including China, Nepal, India, and so on (Supplementary Appendix SA). In the 139 cases, no squeezing (Ⅰ) accounted for 20% (28 cases), slight squeezing (Ⅱ) accounted for 27% (37 cases), medium squeezing (Ⅲ) accounted for 23% (33 cases), severe squeezing (Ⅳ) accounted for 19% (26 cases), and extremely severe squeezing (Ⅴ) accounted for 11% (15 cases) (Figure 3). The determination of squeezing levels was based on the relative strain (ε), namely no squeezing with ε < 1%, slight squeezing with 1%≤ ε ≤ 2.5%, medium squeezing with 2.5%< ε ≤ 5%, severe squeezing with 5%< ε ≤ 10%, and extremely severe squeezing with ε > 10% (Jiao et al., 2021). The relative strain (ε) is defined as .
where:
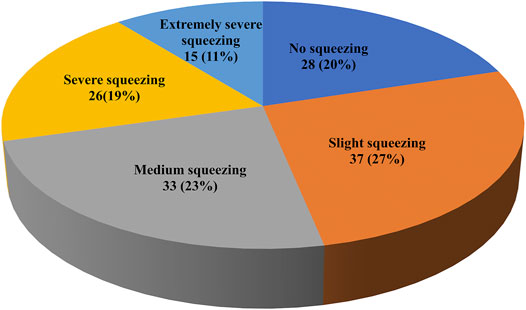
FIGURE 3. Proportion of different squeezing levels in the database.
The occurrence of squeezing is closely related to geological structure, ground stress, rock mass conditions, and excavation disturbances (Hasanpour et al., 2020b; Xu et al., 2021). The selection of squeezing prediction indicators should meet: (1) they are easy to obtain; (2) they have strong representativeness; (3) they can reflect the characteristics of the squeezing from different aspects. In the early empirical methods, the tunnel depth (H), rock mass quality index (BQ), and strength-stress ratio (SSR) are the most widely used indicators. In addition, support stiffness (K) plays a vital role in controlling the surrounding rock deformation (Dwivedi et al., 2013) and the scale effect of tunnels, namely tunnel equivalent diameter (D0), should be taken into account (Goel et al., 1995). Therefore, five indicators [i.e., H, (BQ), SSR, K, and D0] are finally selected as the prediction variables of squeezing levels. Table 1 gives the acquisition methods of five prediction variables and Table 2 shows the basic statistical description of five prediction variables.
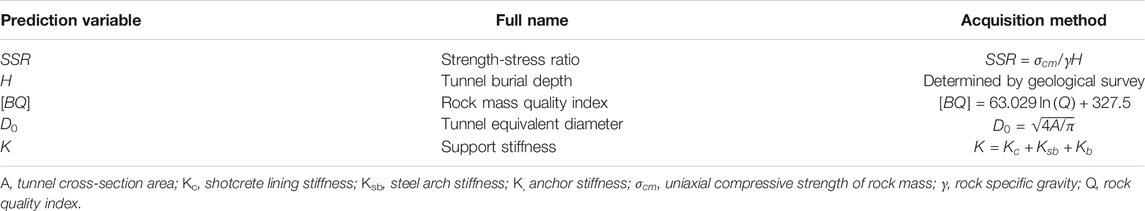
TABLE 1. The acquisition methods of five prediction variables.
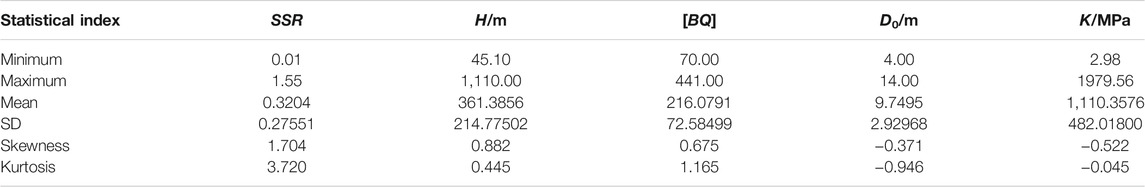
TABLE 2. The basic statistical description of five prediction variables.
Table 3 shows the correlation coefficients among five prediction variables. It can be seen that the correlation coefficient between SSR and (BQ) is over 0.5, indicating that there is a relatively obvious correlation. These redundant information will reduce the operating efficiency of the model, so it is necessary to use principal component analysis to eliminate the correlation between the variables. To avoid the influence of variable dimensions on the dimensionality reduction process, we first use the Z-score method to standardize the original data (Eq. 7). Supplementary Appendix SB demonstrates the standardized data.
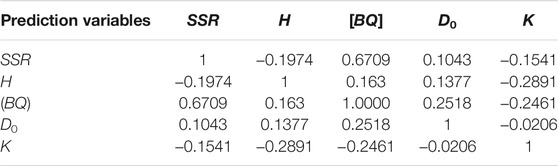
TABLE 3. Correlation coefficients among the original prediction variables.
Table 4 shows the variance contribution rate of each principal component and their cumulative contribution rate. Referring to Table 4, the cumulative contribution rate of the first four principal components reaches 95.24%, indicating that the first four principal components contain 95.24% of the original information, which meets the requirement of principal component selection. Therefore, this paper selects these four principal components as the new prediction variables to replace the five original ones. By analyzing the correlation, it can be found that the new prediction variables (y1, y2, y3, and y4) are totally independent of each other and the correlation coefficients are all 0 (Table 5). Table 6 gives the principal component coefficient matrix, from which the relationship between the new prediction variables and the original ones can be expressed as Eq. 13. Supplementary Appendix SB shows the data after dimensionality reduction.
where:
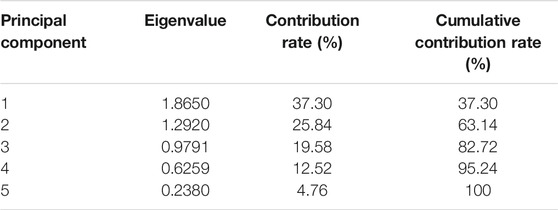
TABLE 4. Calculation results of PCA.
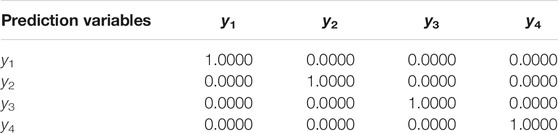
TABLE 5. Correlation coefficients among the new prediction variables.
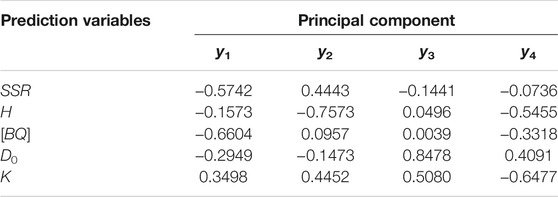
TABLE 6. The coefficient matrix of principal components.
The database after dimensionality reduction is split into three parts by the stratified sampling: the training set (99 samples), the validation set (20 samples), and the test set (20 samples) (Table 7). The training set is used to train the model, the validation set is used to calculate the fitness function and optimize the model hyper-parameter, and the test set is used to evaluate the model performance in engineering practice.
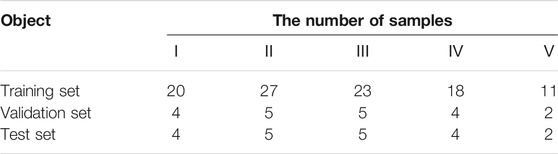
TABLE 7. The number of samples with varying squeezing levels in the training, validation, test sets.
The spread coefficient plays a vital role in the prediction performance of PNN. If the value of the spread coefficient is too small, it is easy to cause the network to overfit; if the value of the spread coefficient is too large, the details cannot be wholly distinguished and the network is close to a linear classifier. This study adopts an improved gray wolf optimization algorithm to optimize the spread coefficient automatically.
The prediction variables (y1, y2, y3, and y4) after dimensionality reduction constitute the input vector of PNN. Moreover, there are 99 sets of training samples and five squeezing levels. Therefore, the number of neurons in the input layer, pattern layer, accumulation layer, and output layer of the PNN are 4, 99, 5, and 5, respectively. In order to select the optimal spread coefficient, 99 sets of training samples are firstly input to train PNN, and then 20 sets of validation samples are input to calculate the fitness function under different spread coefficients.
The optimization range of the spread coefficient is set to (0, 10). The wolf pack size in the improved gray wolf optimization algorithm is set to 30, and the maximum number of iterations is 400. Figure 4 shows the evolution curve of the fitness function with the number of iterations. In the first 20 iterations, the fitness function dropped sharply. Between 20 and 140 iterations, the fitness function was stable, but then there was a decline. The fitness function did not truly converge until 150 iterations. The optimization result of the 400th iteration is used as the optimal spread coefficient. At this time, the spread coefficient is taken as 1.58 and the corresponding fitness function is 1.11.
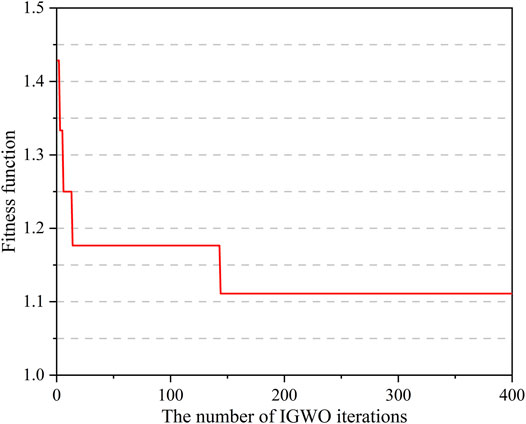
FIGURE 4. The evolution curve of fitness function with the number of IGWO iterations.
The optimized PNN model is applied to the test set, and the prediction results of 20 sets of test samples are shown in Figure 5. Only one of the 20 test samples was misjudged by the PNN, reaching a prediction accuracy of 95%. For this misjudged test sample, its actual squeezing level is medium squeezing, but it is predicted to be a severe squeezing. From the perspective of engineering safety, this phenomenon is acceptable, because it is more advantageous for the predicted level to be higher than the actual level in comparison with the predicted level to be lower than the actual level. In particular, in two types of catastrophic accidents, namely severe squeezing and extremely severe squeezing, the PNN showed 100% prediction accuracy.
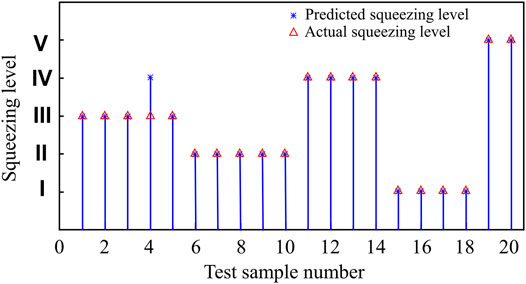
FIGURE 5. PNN prediction results on the test set.
To further illustrate the superiority of the PNN model, its prediction results are compared with that of the artificial neural network (ANN), support vector machine (SVM), and random forest (RF) (Table 8). Among the above four models, the PNN has the highest prediction accuracy with 95%, followed by the ANN (85%), RF (85%), and SVM (80%). In addition, the running times of the four models are separately 5.6350s (PNN), 8.8340s (ANN), 6.2290s (SVM), and 6.9260s (RF). It can be seen that the PNN consumes the shortest running time, achieving the fastest running speed. In terms of both prediction accuracy and running speed, the PNN built in this paper has certain advantages (Table 9).
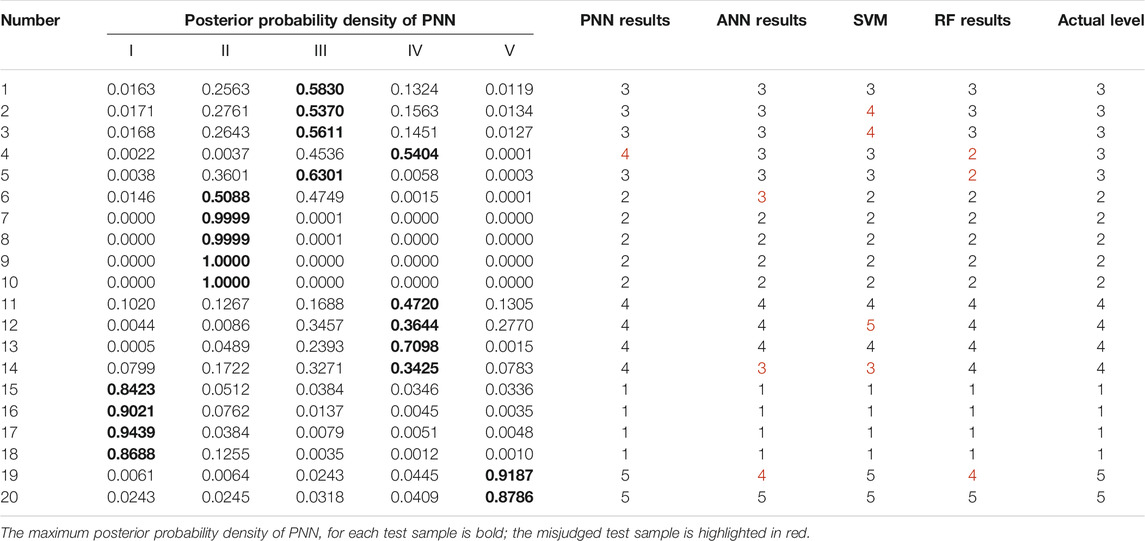
TABLE 8. Comparison analysis of different prediction models.

TABLE 9. Performance evaluation of different prediction models.
Surrounding rock squeezing deformation is a common risk source, which can induce shield jamming disasters in TBM-excavated tunnels. To accurately predict the squeezing levels, this study proposed a hybrid model of PCA-IGWO-PNN. The main conclusions are as follows.
1) The strength-stress ratio, tunnel burial depth, tunnel equivalent diameter, rock mass quality index and support stiffness constitute the evaluation index system for the squeezing level prediction. Considering the index independence requirement of PNN, the PCA is used to preprocess the original data to eliminate the correlations and achieve dimensionality reduction. After that, four independent principal components, which are linearly combined by the original evaluation indexes, are used as the comprehensive evaluation indexes of squeezing levels.
2) The spread coefficient has a significant influence on the PNN performance, and the IGWO optimization results indicate that when the spread coefficient is taken as 1.58, the fitness function converges to the global minimum (1.11). Among the 20 test samples, the built PNN model with the optimal spread coefficient only misjudges 1, achieving the prediction accuracy of 95% in engineering application.
3) Comparison results with the ANN model, SVM model, and RF model show that the PNN model has the highest prediction accuracy, followed by ANN (85%), RF (85%), and SVM (80%). In addition, the PNN model runs fastest in the above four models, only consuming 5.6350s, while the ANN, SVM, and RF separately consume 8.8340, 6.2290, and 6.9260 s. From the aspects of the prediction accuracy and running speed, the PNN model proposed in this paper is the most superior and feasible, which provides an effective method for surrounding rock squeezing classification.
The original contributions presented in the study are included in the article/Supplementary Material, further inquiries can be directed to the corresponding author.
All authors listed have made a substantial, direct, and intellectual contribution to the work and approved it for publication.
This work was financially supported by the National Natural Science Foundation of China (Grant Nos. 52074258, 51874232), and the Natural Science Basic Research Program of Shaanxi Province (Shaanxi Coal and Chemical Industry Group Co., Ltd. Joint Fund Project, Grant No. 2021JLM-06), and Key Research and Development Project of Hubei Province (Grant Nos. 2020BCB073, 2021BCA133). Their support is gratefully acknowledged.
Author XS was employed by Shaanxi Zhengtong Coal Industry Co., Ltd.
The remaining authors declare that the research was conducted in the absence of any commercial or financial relationships that could be construed as a potential conflict of interest.
All claims expressed in this article are solely those of the authors and do not necessarily represent those of their affiliated organizations, or those of the publisher, the editors, and the reviewers. Any product that may be evaluated in this article, or claim that may be made by its manufacturer, is not guaranteed or endorsed by the publisher.
The Supplementary Material for this article can be found online at: https://www.frontiersin.org/articles/10.3389/feart.2022.857463/full#supplementary-material
Aydan, A. T., Akagi, T., and Kawamoto, T. (1996). The Squeezing Potential of Rock Around Tunnels: Theory and Prediction with Examples Taken from Japan. Rock Mech. Rock Engng 29, 125–143. doi:10.1007/bf01032650
Chen, Y., Li, T., Zeng, P., Ma, J., Patelli, E., and Edwards, B. (2020). Dynamic and Probabilistic Multi-Class Prediction of Tunnel Squeezing Intensity. Rock Mech. Rock Eng. 53, 3521–3542. doi:10.1007/s00603-020-02138-8
Dukov, N. T., Ganchev, T. D., and Vrahatis, M. N. (2019). Evaluation of PNN Pattern-Layer Activation Function Approximations in Different Training Setups[J]. Int. J. Speech Tech. 22, 1039–1049. doi:10.1007/s10772-019-09640-7
Dwivedi, R. D., Singh, M., Viladkar, M. N., and Goel, R. K. (2013). Prediction of Tunnel Deformation in Squeezing Grounds. Eng. Geology. 161, 55–64. doi:10.1016/j.enggeo.2013.04.005
Farhadian, H., and Nikvar-Hassani, A. (2020). Development of a New Empirical Method for Tunnel Squeezing Classification (TSC). Q. J. Eng. Geology. Hydrogeology 53, 655–660. doi:10.1144/qjegh2019-108
Feng, X., and Jimenez, R. (2015). Predicting Tunnel Squeezing with Incomplete Data Using Bayesian Networks. Eng. Geology. 195, 214–224. doi:10.1016/j.enggeo.2015.06.017
Ge, Y., Cao, B., and Tang, H. (2022). Rock Discontinuities Identification from 3D Point Clouds Using Artificial Neural Network. Rock Mech. Rock Eng. doi:10.1007/s00603-021-02748-w
Ge, Y., Xie, Z., Tang, H., Du, B., and Cao, B. (2021). Determination of the Shear Failure Areas of Rock Joints Using a Laser Scanning Technique and Artificial Intelligence Algorithms. Eng. Geology. 293, 106320. doi:10.1016/j.enggeo.2021.106320
Goel, R. K., Jethwa, J. L., and Paithankar, A. G. (1995). Tunnelling through the Young Himalayas-A Case History of the Maneri-Uttarkashi Power Tunnel [J]. Eng. Geology. 39 (1), 31–44. doi:10.1016/0013-7952(94)00002-j
Hasanpour, R., Rostami, J., Schmitt, J., ilmaz, O., and Sohrabian, B. (2020b). Prediction of TBM Jamming Risk in Squeezing Grounds Using Bayesian and Artificial Neural Networks[J]. J. Rock Mech. Geotechnical Eng. 12 (01), 21–31. doi:10.1016/j.jrmge.2019.04.006
Hasanpour, R., Rostami, J., Schmitt, J., Ozcelik, Y., and Sohrabian, B. (2020a). Prediction of TBM Jamming Risk in Squeezing Grounds Using Bayesian and Artificial Neural Networks. J. Rock Mech. Geotechnical Eng. 12, 21–31. doi:10.1016/j.jrmge.2019.04.006
Hasanpour, R., Rostami, J., and Ünver, B. (2014). 3D Finite Difference Model for Simulation of Double Shield TBM Tunneling in Squeezing Grounds. Tunnelling Underground Space Tech. 40, 109–126. doi:10.1016/j.tust.2013.09.012
Jethwa, J. L. (1981). Evaluation of Rock Pressures in Tunnels through Squeezing Ground in Lower Himalayas. Roorkee: University of Roorkee.
Jiao, Y. Y., Ou, G., Wang, H., Zhang, G. H., Zou, J. P., Tan, F., et al. (2021). Prediction of Tunnel Squeezing Based on Evidence Theory [J]. J. Appl. Basic Eng. Sci. 29 (05), 1156–1170.doi:10.1155/2018/4543984
Jimenez, R., and Recio, D. (2011). A Linear Classifier for Probabilistic Prediction of Squeezing Conditions in Himalayan Tunnels. Eng. Geology. 121, 101–109. doi:10.1016/j.enggeo.2011.05.006
Liu, Q., Huang, X., Gong, Q., Du, L., Pan, Y., and Liu, J. (2016). Application and Development of Hard Rock TBM and its prospect in China. Tunnelling Underground Space Tech. 57, 33–46. doi:10.1016/j.tust.2016.01.034
Liu, Q., Wang, X., Huang, X., and Yin, X. (2020). Prediction Model of Rock Mass Class Using Classification and Regression Tree Integrated AdaBoost Algorithm Based on TBM Driving Data. Tunnelling Underground Space Tech. 106, 103595. doi:10.1016/j.tust.2020.103595
Mirjalili, S., Mirjalili, S. M., and Lewis, A. (2014a). Grey Wolf Optimizer. Adv. Eng. Softw. 69 (3), 46–61. doi:10.1016/j.advengsoft.2013.12.007
Mirjalili, S., Mirjalili, S. M., and Lewis, A. (2014b). Gray Wolf Optimizer. Adv. Eng. Softw. 69, 46–61. doi:10.1016/j.advengsoft.2013.12.007
Sanal Kumar, K. P., and Bhavani, R. (2019). Human Activity Recognition in Egocentric Video Using PNN, SVM, kNN, and SVM+kNN Classifiers[J]. Cluster Comput. 22, 3–4. doi:10.1007/s10586-017-1131-x
Schimit, P. H. T., and Pereira, F. H. (2018). Disease Spreading in Complex Networks: A Numerical Study with Principal Component Analysis. Expert Syst. Appl. 97, 41–50. doi:10.1016/j.eswa.2017.12.021
Singh, B., Jethwa, J. L., Dube, A. K., and Singh, B. (1992). Correlation between Observed Support Pressure and Rock Mass Quality. Tunnelling Underground Space Tech. 7, 59–74. doi:10.1016/0886-7798(92)90114-w
Sousa, R. L., and Einstein, H. H. (2011). Risk Analysis during Tunnel Construction Using Bayesian Networks: Porto Metro Case Study. Tunnelling Underground Space Tech. incorporating Trenchless Tech. Res. 27 (1), 86–100. doi:10.1016/j.tust.2011.07.003
Sun, Y., Feng, X., and Yang, L. (2018). Predicting Tunnel Squeezing Using Multiclass Support Vector Machines. Adv. Civil Eng. 2018, 1–12. doi:10.1155/2018/4543984
Xu, Z. H., Wang, W. Y., Lin, P., Nie, L. C., Wu, J., and Li, Z. M. (2021). Hard-rock TBM Jamming Subject to Adverse Geological Conditions: Influencing Factor, hazard Model and a Case Study of Gaoligongshan Tunnel. Tunneling Underground Space Tech. 108, 103683.doi:10.1016/j.tust.2020.103683
Yin, X., Liu, Q., Pan, Y., Huang, X., Wu, J., and Wang, X. (2021c). Strength of Stacking Technique of Ensemble Learning in Rockburst Prediction with Imbalanced Data: Comparison of Eight Single and Ensemble Models. Nat. Resour. Res 80, 1795–1815 doi:10.1007/s11053-020-09787-0
Yin, X., Liu, Q., Huang, X., and Pan, Y. (2022). Perception Model of Surrounding Rock Geological Conditions Based on TBM Operational Big Data and Combined Unsupervised-Supervised Learning. Tunnelling Underground Space Tech. 120, 104285. doi:10.1016/j.tust.2021.104285
Yin, X., Liu, Q., Huang, X., and Pan, Y. (2021b). Real-time Prediction of Rockburst Intensity Using an Integrated CNN-Adam-BO Algorithm Based on Microseismic Data and its Engineering Application. Tunnelling Underground Space Tech. 117, 104133. doi:10.1016/j.tust.2021.104133
Yin, X., Liu, Q., and Pan, Y. (2021a). A Novel Tree-Based Algorithm for Real-Time Prediction of Rockburst Risk Using Field Microseismic Monitoring. Environ. Earth Sci. 80, 1–19. doi:10.1007/s12665-021-09802-4
Zhang, J., Li, D., and Wang, Y. (2020a). Predicting Tunnel Squeezing Using a Hybrid Classifier Ensemble with Incomplete Data. Bull. Eng. Geol. Environ. 79, 3245–3256. doi:10.1007/s10064-020-01747-5
Zhang, W. G., and Phoon, K. K. (2022). Editorial for Advances and Applications of Deep Learning and Soft Computing in Geotechnical Underground Engineering. J. Rock Mech. Geotech. Eng doi:10.1016/j.jrmge.2022.01.001
Zhang, W., Li, H., Li, Y., Liu, H., Chen, Y., and Ding, X. (2021a). Application of Deep Learning Algorithms in Geotechnical Engineering: a Short Critical Review. Artif. Intell. Rev. 54, 5633–5673. doi:10.1007/s10462-021-09967-1
Zhang, W., Wu, C., Zhong, H., Li, Y., and Wang, L. (2021b). Prediction of Undrained Shear Strength Using Extreme Gradient Boosting and Random forest Based on Bayesian Optimization. Geosci. Front. 12, 469–477. doi:10.1016/j.gsf.2020.03.007
Zhang, W., Zhang, R., Wu, C., Goh, A. T. C., Lacasse, S., Liu, Z., et al. (2020a). State-of-the-art Review of Soft Computing Applications in Underground Excavations. Geosci. Front. 11, 1095–1106. doi:10.1016/j.gsf.2019.12.003
Zhang, Y., Guo, J., Zhou, Q., and Wang, S. (2021c). Research on Damage Identification of hull Girder Based on Probabilistic Neural Network (PNN). Ocean Eng. 238, 15. doi:10.1016/j.oceaneng.2021.109737
Keywords: tunnel engineering, surrounding rock squeezing deformation, squeezing classification, probabilistic neural network, improved gray wolf optimization
Citation: Huang X, Yin X, Liu B, Ding Z, Zhang C, Jing B and Guo X (2022) A Gray Wolf Optimization-Based Improved Probabilistic Neural Network Algorithm for Surrounding Rock Squeezing Classification in Tunnel Engineering. Front. Earth Sci. 10:857463. doi: 10.3389/feart.2022.857463
Received: 18 January 2022; Accepted: 10 February 2022;
Published: 28 February 2022.
Edited by:
Shibing Huang, Wuhan University of Science and Technology, ChinaCopyright © 2022 Huang, Yin, Liu, Ding, Zhang, Jing and Guo. This is an open-access article distributed under the terms of the Creative Commons Attribution License (CC BY). The use, distribution or reproduction in other forums is permitted, provided the original author(s) and the copyright owner(s) are credited and that the original publication in this journal is cited, in accordance with accepted academic practice. No use, distribution or reproduction is permitted which does not comply with these terms.
*Correspondence: Xin Yin, eWlueGluMDUwNkAxMjYuY29t
Disclaimer: All claims expressed in this article are solely those of the authors and do not necessarily represent those of their affiliated organizations, or those of the publisher, the editors and the reviewers. Any product that may be evaluated in this article or claim that may be made by its manufacturer is not guaranteed or endorsed by the publisher.
Research integrity at Frontiers
Learn more about the work of our research integrity team to safeguard the quality of each article we publish.