- 1School of Resources and Environment, University of Electronic Science and Technology of China, Chengdu, China
- 2Sichuan Geomatics Center of the Ministry of Natural Resources, Chengdu, China
- 3Sichuan Province Soil and Water Conservation and Ecological Environment Monitoring Station, Chengdu, China
China is suffering from serious soil and water loss due to improper land use, leading to flood and drought disasters, and industrial and agricultural reduction. The commonly used monitoring methods of soil and water loss rely on the visual interpretation of remote sensing images, which is time-consuming and laborious. In this study, deep learning semantic segmentation technology was applied to monitoring land use for soil and water conservation. Manual visual interpretation mark samples and land use products collected in recent years were combined to construct training samples for deep learning. Deep convolution neural network model based on ResNet152 and DeeplabV3+ was selected for performing land use classification. Then the soil and water loss were quantified using the Chinese Soil Loss Equation (CSLE) based on the hydrological, geographic, vegetation cover and land use information. The experimental results show that the deep learning model can quickly extract robust edge features from remote sensing images and has high pixel accuracy (83.4%). Although the model accuracy was affected by the land cover types and image quality in different study area, it can still achieve an accuracy higher than 70% in other counties through our experiment. It can further improve the information service level of soil and water conservation product, and provide a useful guideline for automatic land use interpretation and identification of soil and water conservation status based on high resolution remote sensing images.
Introduction
Soil and water conservation refers to the prevention and control measures taken for soil and water loss caused by natural change and human activities, which is an important component of China’s ecological civilization construction (Water and Soil Conservation monitoring Center of the Ministry of Water Resources, 2020). It is necessary to survey annually the intensity and distribution of soil and water loss in the monitored area. Through the accumulation and analysis of multi-source observation data, regional soil and water conservation measures can be formulated and implemented (Li et al., 2009). The commonly used soil and water loss monitoring methods include field investigation, remote sensing visual interpretation and machine learning classification (Jin et al., 2019). With the advancement of China’s economy and society, and the accelerated construction of ecological civilization, the monitoring capacity and informatization level of soil and water conservation must be improved (Luo et al., 2008). Traditional manual interpretation and machine learning methods facing the challenge of monitoring a wide area many times, especially the remote sensing technique encounter bottlenecks such as heavy workload of manual review, difficult ground feature identification and analysis, low efficiency for accurate government supervision, and an urgent need for artificial intelligence support (Jiang et al., 2021; Zhang et al., 2019).
In this study, deep learning was applied to the remote sensing monitoring of land use for soil and water conservation. Field investigation marks and visual interpretation results of multi-year optical satellite images were fully integrated and used as the training sample labels, and a semantic segmentation model was trained and optimized to achieve automatic land use interpretation and soil and water conservation classification. The model will shorten the working time and improve the accuracy. It can provide land use information for the analysis of soil erosion and water loss every year.
Data Acquisition
Data Sources
The study area (104°40′∼105°15′E, 28°55′∼29°28′N) Fushun County is located in the south of Sichuan Basin, under a subtropical humid monsoon climate. The county covers a total area of 1336 km2, and more than 90% of the area is hilly topography region Ground survey was conducted in 2018 to obtain the geographical features of typical land use categories, based on which interpretation marks were established. Visual interpretation of remote sensing images was conducted in 2019 to obtain the land use map. The Chinese GF-2 and ZY-3 optical satellite images were obtained in March and April of 2020 under cloudless conditions for deep learning classification. The image spatial resolution of panchromatic band is 2 m and the RGB bands are 8 m. The main purpose was to select remote sensing images and relative training label data for land use classification, evaluate the area, intensity, and distribution of soil and water loss in each district, and master the annual changes and the causes of soil and water loss. Therefore, the hydrological, geographic, and vegetation cover information was also obtained from the official statistics and remote sensing data preprocessing.
Data Processing
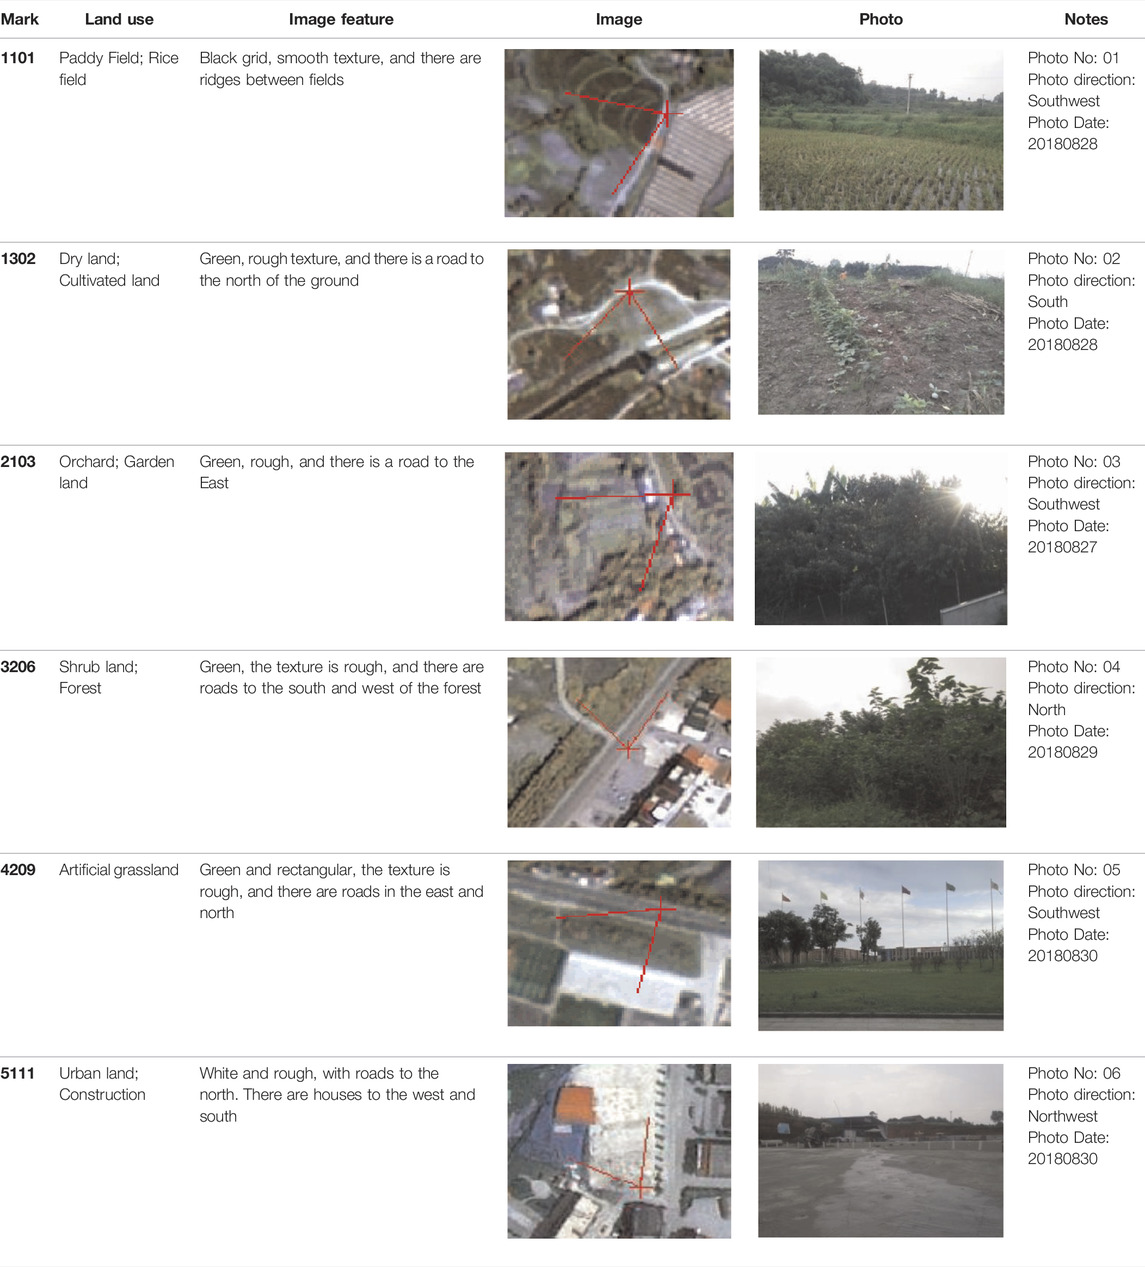
According to the spatial resolution, temporal phase, spectral and geometric characteristics of monitored objects in remote sensing images and the field investigation records, visual interpretation marks are established. The visual interpretation focuses on typical land use types and large changes in the intensity of soil and water loss (Water and Soil Conservation monitoring Center of the Ministry of Water Resources, 2020). The interpretation markers are derived from ground photos and remote sensing images. The two types of observation reflect different morphological characteristics of ground object, which plays a role in mutual confirmation, facilitates the efficient recognition of ground information, and improves the interpretation accuracy. There is at least one set of remote sensing interpretation marks for land use in each monitored district and county. Table 1 shows an example in 2018.
Based on remote sensing images combined with interpretation marks, human-computer interaction was used to draw map patch boundaries and extract land use information. After the interpretation work was completed, a field check of the interpretation results was conducted, and the interpretation results were verified and improved to ensure that the interpretation accuracy requirements were met. According to the Chinese technical standard for land use classification and soil and water conservation monitoring (Water and Soil Conservation monitoring Center of the Ministry of Water Resources, 2020), a vector dataset of 8 categories of remote sensing interpretation for land use was formed for several consecutive years since 2018.The eight categories of land include: cultivated land, garden, wood land, grassland, construction, transportation, water area and water conservancy facilities, and others.
The main contents of remote sensing monitoring include the collection of basic data, establishment of interpretation marks, human-computer interaction, extraction of land use information, field check of interpretation results, modification and improvement of interpretation results, and land use monitoring for soil and water loss. The old workflow is shown in Figure 1.
Research Methods
The automatic interpretation of remote sensing images is similar to that of the semantic segmentation task in machine vision. The technology used was the same, but the application scenarios were different (Wu et al., 2021). Semantic segmentation technology is a type of supervised learning: to obtain the output prediction results, the model learning is supervised and guided using real labels and samples. Based on the achievements of remote sensing dynamic monitoring projects of soil and water conservation over the years, this study realizes automatic land use classification by establishing the interpretation sample labels of various typical land classes and continuously training the optimization algorithm using the deep convolution neural network classification method. Furthermore, the quality and quantity of image interpretation sample labels are continuously optimized to improve the accuracy of the automatic classification of all elements of surface coverage. The DeeplabV3+ (Zhang et al., 2019) adopted in the project was derived from a fully convolutional network.
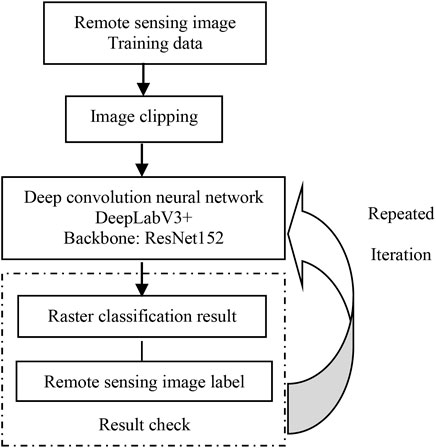
The main technology process includes the following stages: model training, forecast classification, and interpretation optimization. The first stage is the model training stage, which includes model learning and parameter optimization. Semantic segmentation technology was used to realize pixel-level classification. The time consumption of this stage depends on the complexity of the model, the amount of data, and hardware configuration resources. The data used in training included two parts: the results of remote sensing image data over the years and the vector category label corresponding to each remote sensing image. The image was sent to the model, and after a series of operations, such as convolution, pooling, and nonlinear transformation, the final output was the classification result of each pixel. Then, the output of the model was compared with the corresponding pixel-level label, and the difference between them was determined (i.e., the difference between the number output by the model and the pixel value of the actual label). Then, using the optimization method of seeking the maximum value in mathematics, derivative and gradient back propagation, the model parameters were updated, and the process was repeated. The model training process of the whole research method is shown in Figure 2.
The forecast classification is the stage that loads the trained and learned parameter weights into the process of model recognition. In practical applications, it belongs to the second stage. An output pixel consistent with the image size for classification is produced, and a classification result is obtained. In this form, it is expressed as a gray image, and the pixel gray value represents the category code. The stage requires very little time, usually at the second or minute level, which generally depends on the computing resources and the size and complexity of the input image.
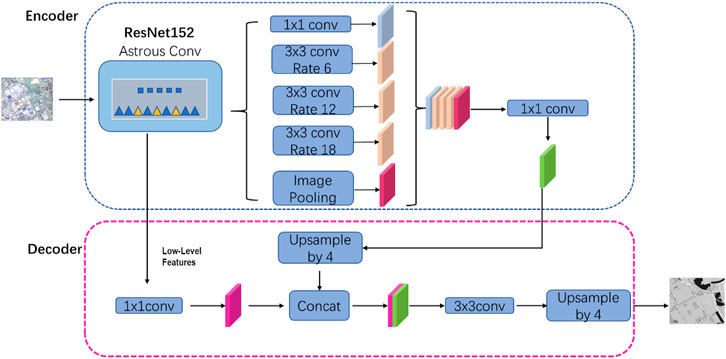
The expansion convolution with different expansion factors is used to fuse the multi-scale information as the encoder, and then the characteristics of different stages of the encoder network are up sampled as the decoder. Atrous convolution spatial pyramid pooling was used to capture the context information of the image in multiple scales, and then semantic segmentation was performed through the encoder–decoder architecture to gradually obtain a clear classification boundary. Using the characteristics of expanded convolution, the large-resolution feature map can be maintained after convolution so that the spatial information is retained.
The input of the model network requires images with fixed dimensions; however, computer hardware memory is limited and cannot process images above a certain size. Therefore, by cutting the image into fixed-size input, the network can process input images of any size and reduce the requirements for hardware resources.
The backbone network uses the residual neural network ResNet152 (Wang et al., 2009) to extract image features and DeeplabV3+ framework structure to realize image segmentation (Figure 3). The output is a grid image, and its pixel value is the classification category.
Finally, it is necessary to convert the predicted grid output into corresponding vector data results through a series of post-processing operations (Figure 4). The entire process from image prediction output to vector is as follows.
1) Grid splicing: Because the output must be divided into administrative regions, this step splits the previously input and cropped image prediction results into an entire grid image in the unit of administrative regions.
2) Adding spatial coordinates: Because the output raster image has no coordinate information, it is necessary to inherit the spatial coordinate information from the input image.
3) Filtering of small spots: Because the network predicts the image pixel-by-pixel, there are some small spots in the output result. According to the requirements of soil and water conservation projects, a spot area threshold of 400 m2 can be set, and the spot whose pixel point is less than this threshold can be filled with the pixel value of the nearest spot.
Result Analysis
Accuracy Evaluation
In this study, two commonly used indexes were adopted to evaluate the performance: pixel accuracy (PA) and Frequency Weighted Intersection over Union (FWIoU) (Helber et al., 2019; Xu et al., 2021). For the entire study area, the larger the PA and FWIoU values, the greater the number of correct predictions, the higher the accuracy, and the better the performance. The remote sensing dynamic monitoring of soil erosion in Fushun County selected in the test was classified according to the eight-class categories, and the accuracy indexes were PA: 0.8304 and FWIoU: 0.7175.
Although the model accuracy was affected by the land cover types and image quality in different study area, it can still achieve an accuracy higher than 70% in other counties through our experiment, meets the accuracy of land use information extraction of soil and water loss.
Field Review
Since the training and validation samples of deep learning model were mostly derived from the interpretation marks in 2018 and 2019, field check was conducted to check the actual classification results in 2020 base on random sampling analysis. The check principle ensures the combination of attribute verification and boundary inspection, and the combination of indoor inspection and field verification. First, the correctness of patch attributes was verified, and then the accuracy of the patch boundary and the rationality of trade-offs was checked. At least three verification units (1 km × 1 km) were randomly selected from each county for on-site check of land use type spots.
The types of features selected for verification are complete to avoid repeated selection of the same land type and ensure the reliability of the sampling survey. In this test, three verification areas were selected in Fushun County, including plain farming area, residential building area, and the junction of plain and mountainous areas, including 815 map spots in total. The field verification results show that the number of correct map spot attributions was 798 and the number of correct map spot location boundaries was 750, which meets the principle of 90% accuracy in the technical regulations for dynamic monitoring of soil and water loss (Water and Soil Conservation monitoring Center of the Ministry of Water Resources, 2020). Finally, Table 2 shows the dynamic change statistics in land use area of soil and water conservation in Fushun County from 2019 to 2020.
From the effect of dynamic evaluation of land use change from 2019 to 2020, this method can meet the requirements of land use classification accuracy, and the evaluation results can accurately reflect the change and development trend of soil and water loss in Fushun County.
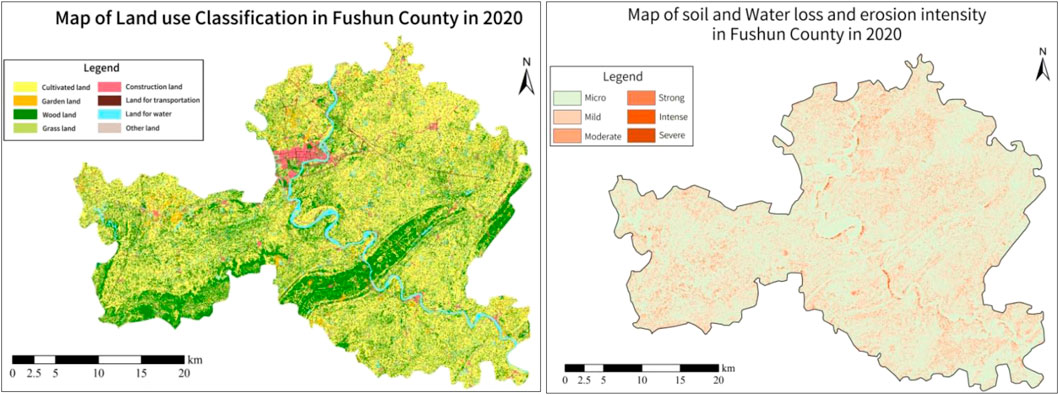
The Chinese Soil Loss Equation (CSLE) were combined with the hydrological geographic, vegetation cover and land use information to calculate the layer product of seven erosion factors, that is, rainfall erosivity, soil erodibility, slope level, slope length, biological measures, construction measures and cultivation measures (Water and Soil Conservation monitoring Center of the Ministry of Water Resources, 2020). On the basis of calculating the soil and water loss modulus, referring to the map of land use classification and the soil erosion grading standard, referring to the map of land use classification and the soil erosion grading standard, the area and proportion of soil erosion intensity were obtained, then the soil erosion distribution and intensity were mapped through spatial interpolation analysis, as shown in Figure 5.

FIGURE 5. Map of Land use Classification and Intensity distribution Map of soil erosion land in Fushun County in 2020.
Conclusion
In summary, deep learning methods can address the problems of traditional remote sensing image interpretation, which is primarily manual and visual the degree of automation is not high, and the interpretation labor and time costs are high thus is easily affected by human subjective judgment. This study is of great significance for the rapid and automatic information extraction of massive remote sensing image data, especially for dynamic monitoring projects with multi-temporal and large area requirement In order to build a stable and reliable model, a large number of sample images and marks with diversity and representativeness need to be established to strengthen the training and application efficiency.
Data Availability Statement
The original contributions presented in the study are included in the article/Supplementary Material, further inquiries can be directed to the corresponding author.
Author Contributions
LW: Manuscript writing and scheme design. SL: Manuscript revises. YC: Data and method audit. ZH: Data processing. YS: Research method test.
Funding
This research was supported by the Science and Technology Open Foundation of Sichuan Geographic Information Society of surveying and Mapping (project number: CCX202107) and the major science and technology application demonstration project of Chengdu Science and Technology Bureau (project number: 2021-YF09-00007-SN).
Conflict of Interest
The authors declare that the research was conducted in the absence of any commercial or financial relationships that could be construed as a potential conflict of interest.
Publisher’s Note
All claims expressed in this article are solely those of the authors and do not necessarily represent those of their affiliated organizations, or those of the publisher, the editors and the reviewers. Any product that may be evaluated in this article, or claim that may be made by its manufacturer, is not guaranteed or endorsed by the publisher.
References
Helber, P., Bischke, B., Dengel, A., and Borth, D. (2019). EuroSAT: A Novel Dataset and Deep Learning Benchmark for Land Use and Land Cover Classification. IEEE J. Sel. Top. Appl. Earth Observations Remote Sensing 12 (7), 2217–2226. doi:10.1109/jstars.2019.2918242
Jiang, D., Jiang, X., and Zhou, Z. (2021). Technical Support of Artificial Intelligence for Informatization Supervision of Soil and Water Conservation. J. Soil Water Conservation 35 (4), 1–6.
Jin, C., Yi, Q., Zhang, Y., Guo, W., and Yao, G. (2019). Application of Geographical Survey Data in Dynamic Monitoring of Regional Soil and Water Loss in Henan Province. China Soil and Water Conservation 12, 26–28, 32.
Li, X., Tian, L., Yu, Z., et al. (2009). Remote Sensing Monitoring of Soil and Water Loss in the Yellow River Basin. Remote Sensing Land Resour. 82 (4), 57–61.
Luo, M., Cao, S., Liu, X., and Yang, K. (2008). Understanding and Exploration of Soil and Water Conservation Monitoring in Sichuan. China Soil and Water Conservation 7, 6–8.
Wang, Z., Zhou, Y., Wang, S., Wang, F., and Xu, Z. (2009). House Building Extraction from High Resolution Remote Sensing Image Based on IEU-Net. J. Remote Sensing 13 (2).
Water and Soil Conservation Monitoring Center of the Ministry of Water Resources (2020). Technical Guide for Dynamic Monitoring of Water and Soil Loss in 2020 Beijing.
Wu, Y., Wu, J., Lin, C., Dou, B., and Li, K. (2021). Photovoltaic Land Extraction from High Resolution Remote Sensing Images Based on Deep Learning. Bulleting Surv. Mapp. 0 (5), 96–101.
Xu, Y., Du, B., and Zhang, L. (2021). Assessing the Threat of Adversarial Examples on Deep Neural Networks for Remote Sensing Scene Classification: Attacks and Defenses. IEEE Trans. Geosci. Remote Sensing 59, 1604–1617. doi:10.1109/tgrs.2020.2999962
Keywords: deep learning, soil erosion, land use classification, dynamic monitoring, semantic segmentation
Citation: Wan L, Li S, Chen Y, He Z and Shi Y (2022) Application of Deep Learning in Land Use Classification for Soil Erosion Using Remote Sensing. Front. Earth Sci. 10:849531. doi: 10.3389/feart.2022.849531
Received: 06 January 2022; Accepted: 14 February 2022;
Published: 25 April 2022.
Edited by:
Shibo Fang, Chinese Academy of Meteorological Sciences, ChinaReviewed by:
Bo Kong, Institute of Mountain Hazards and Environment (CAS), ChinaYaokui Cui, Peking University, China
Copyright © 2022 Wan, Li, Chen, He and Shi. This is an open-access article distributed under the terms of the Creative Commons Attribution License (CC BY). The use, distribution or reproduction in other forums is permitted, provided the original author(s) and the copyright owner(s) are credited and that the original publication in this journal is cited, in accordance with accepted academic practice. No use, distribution or reproduction is permitted which does not comply with these terms.
*Correspondence: Lihong Wan, NDM1MTAyMjdAcXEuY29t
 Lihong Wan
 Shihua Li1


