 Qiang Fu1,2,3
 Maodu Yan1*
 Mark J. Dekkers3
 Chong Guan4
 Rosa A. de Boer3
 Liang Yu1,2
 Wanlong Xu1,2Bingshuai Li5
 Miaomiao Shen1
 Jingyu Zhang3
 Zunbo Xu1,2
- 1State Key Laboratory of Tibetan Plateau Earth System, Resources and Environment (TPESRE), Institute of Tibetan Plateau Research, Chinese Academy of Sciences, Beijing, China
- 2University of Chinese Academy of Sciences, Beijing, China
- 3Department of Earth Sciences, Paleomagnetic Laboratory “Fort Hoofddijk”, Utrecht University, Utrecht, Netherlands
- 4Xi’an Center of Geological Survey (Northwest China Center of Geoscience Innovation), China Geological Survey, Xi’an, China
- 5School of Earth Sciences, East China University of Technology, Nanchang, China
The Eastern Qiangtang Terrane is an orogenic-like belt around the Eastern Himalayan syntaxis (EHS). The deformation history of this terrane must be known to understand how the EHS region responded to the Lhasa-Qiangtang collision and the closure of the Bangong-Nujiang Ocean (BNO). Here, we present a new paleomagnetic investigation on an Early Cretaceous granite (∼126 Ma) in the Zaduo area, Eastern Qiangtang Terrane. Petrographic observations reflect crystallization from primary melts with only limited subsequent alteration (chloritization of biotite). Magnetite appears to be the dominant carrier of the characteristic remanent magnetization (ChRM) based on stepwise demagnetization of the natural remanent magnetization, supplemented by detailed rock magnetic measurements, including magnetization versus temperature, and acquisition curves of the isothermal and anhysteretic remanent magnetization. End-member modeling of those acquisition curves helped to constrain the paleomagnetic analysis. The inconsistent demagnetization behavior between alternating field (AF) demagnetization at high levels and thermal demagnetization was attributed to the development of gyroremanent magnetization in the AF demagnetization generated by fine-grained single domain magnetite. The ChRM directions from 92 granite samples in geographic coordinates yield an average of declination (Dg) of 2.6° and inclination (Ig) of 38.6° (precision parameter k = 51.4, and 95% confidence cone α95 = 2.1°). The amount of tilting of the granite is poorly constrained which makes proper correction rather tedious. We compared the expected bedding attitudes (Strikeexp = 43.1°, Dipexp = 46.1°) derived from published data (Huang et al., 1992; Tong et al., 2015) with the average observed bedding attitudes (Strikeobs = 54°, Dipobs = 32°) of the Middle-Upper Jurassic sandstones of the Yanshiping Group that was intruded by the Early Cretaceous granite. The discrepancy between the expected and measured bedding attitudes implies that the strata of the Yanshiping Group in the Zaduo area were already tilted prior to the intrusion of the ∼126 Ma Zaduo granite, which was attributed to the Lhasa-Qiangtang collision and the closure of the BNO. The collision led to a series of geological events, such as the tilting of the strata, the ophiolite emplacement, the development of a peripheral foreland basin, and the magmatic activity gap. The tilting/folding of the strata was generally delayed by the layer parallel shortening processes during the early stages of the deformation, thus suggesting an older Lhasa-Qiangtang collision (i.e., >126 Ma).
1 Introduction
The present-day Tibetan Plateau is known as the “roof” of the world and the “third pole” of the Earth. It is a complex terrane collage that comprises the Tethyan Himalaya, Lhasa, Qiangtang, Songpan-Ganzi and Qaidam-Qilian terranes from south to north (Figure 1). These continental terranes sequentially accreted to Eurasia and formed the “Proto-Tibet” since the Paleozoic (Yin and Harrison, 2000; Tapponnier et al., 2001; Kapp et al., 2005, 2007; Metcalfe, 2011). The Qiangtang and Lhasa Terranes are two major crustal fragments in the central Tibetan Plateau and play a key role in understanding the formation and evolution of the “Proto-Tibet” region. In general, they are considered to have been separated by the Bangong-Nujiang Ocean (BNO) since the Permian (Dewey et al., 1988; Metcalfe, 2013; Zhu et al., 2013; Zhang et al., 2016; Chen S.-S. et al., 2017; Fan et al., 2018a). The timing of the Lhasa-Qiangtang collision that followed the BNO closure, however, remains controversial, ranging from the Middle or Late Jurassic (Xu et al., 1985; Dewey et al., 1988; Yan et al., 2016; Ma et al., 2017; Li et al., 2019a, 2019b) to the Early Cretaceous (Kapp et al., 2003, 2007; Zhu et al., 2006, 2011, 2013, 2016; Bian et al., 2017; Meng et al., 2018; Chen et al., 2020), or even the Late Cretaceous (Zhang et al., 2012; Fan et al., 2014; Liu et al., 2014; Fan et al., 2015; Fan et al., 2018a; Fan et al., 2018b). Thus, one of the significant targets in the “Proto-Tibet” study is to determine when the Qiangtang Terrane collided with the Lhasa Terrane.
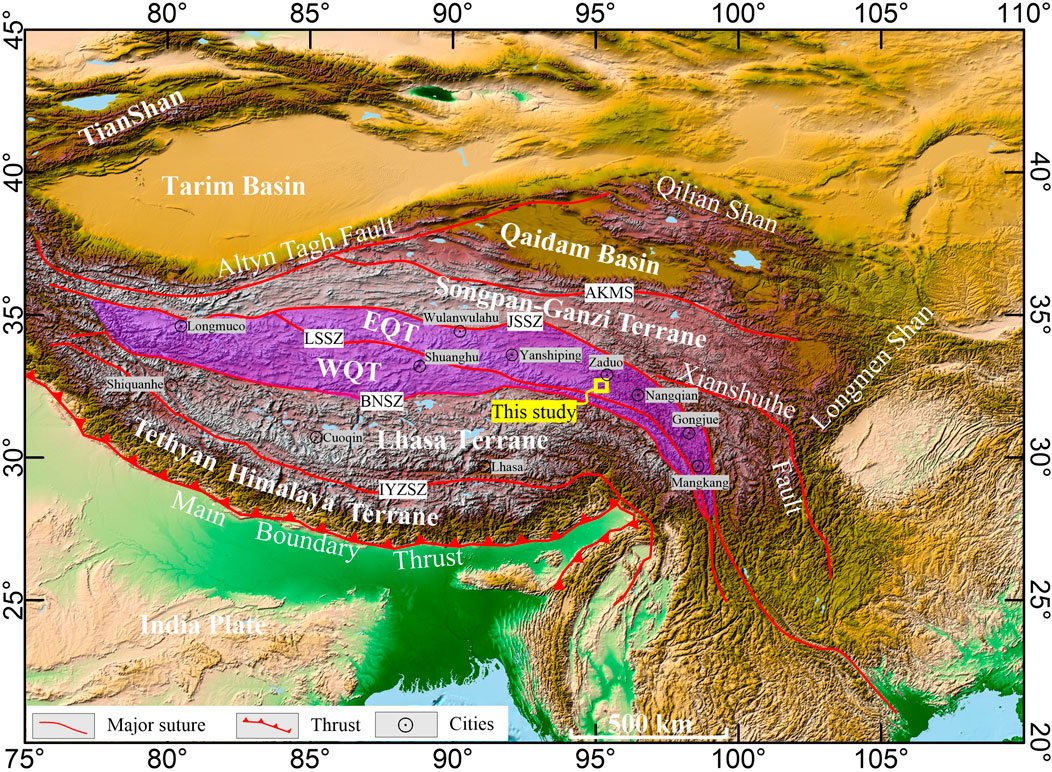
FIGURE 1. Simplified tectonic map of the Tibetan Plateau and its adjacent regions. The abbreviations of the tectonic units are EQT: Eastern Qiangtang Terrane; WQT: Western Qiangtang Terrane; AKMS: Ayimaqing-Kunlun-Muztagh Suture Zone; JSSZ: Jinshajiang Suture Zone; LSSZ: Longmu Tso-Shuanghu Suture Zone; BNSZ: Bangong-Nujiang Suture Zone; IYZSZ: Indus-Yarlung Zangbo Suture Zone.
Paleomagnetism is an effective approach for quantifying terrane drift history. Many studies have been carried out on the Mesozoic paleographic positions of the Qiangtang Terrane (Lin and Watts, 1988; Dong et al., 1990; Otofuji et al., 1990; Dong et al., 1991; Huang et al., 1992; Chen et al., 1993; Cheng et al., 2012; Song et al., 2012; Huang et al., 2013; Ren et al., 2013; Song et al., 2015, 2020; Tong et al., 2015; Yan et al., 2016; Chen W. et al., 2017; Ran et al., 2017; Meng et al., 2018; Cao et al., 2019, 2020; Zhou et al., 2019; Fu et al., 2021; Guan et al., 2021). These studies have provided extensive knowledge on the tectonic evolution of the Qiangtang Terrane. However, most of these data were obtained from the center and western parts of the Qiangtang Terrane. Only three studies (Otofuji et al., 1990; Huang et al., 1992; Tong et al., 2015) were from the eastern part and all concerned Cretaceous rocks. To date, the timing of the Lhasa-Qiangtang collision is still under debate.
The Qiangtang Terrane is divided into the Eastern and Western Qiangtang subterranes (EQT, and WQT, respectively) (also named the Northern and Southern Qiangtang subterranes) (cf. Figure 1; Yin and Harrison, 2000; Pan et al., 2004; Li et al., 2009; QGSI, 2005; Yan et al., 2016). The Zaduo area is the bending (transitional) part of the Eastern Qiangtang Terrane, where the tectonic trend is east–west to its west and north-south to its east and south (Figure 1). Therefore, the tectonic evolution of the Zaduo area during the Late Jurassic to Early Cretaceous likely provides key information to address questions as to when the Lhasa-Qiangtang collision occurred and how the region deformed in response to the India-Asia collision. Investigations on the Middle-Upper Jurassic limestones of the Yanshiping Group in this area indicate that primary natural remanent magnetization (NRM) was overprinted by a chemical remanent magnetization (CRM) during the India–Eurasia collision (Fu et al., 2021). Igneous rocks are less prone to remagnetization than limestones. Thus, it is a very reasonable idea that we target the Cretaceous Zaduo granite to obtain trustworthy paleolatitude constraints to find a solution, which motivated this study.
In this paper, we report new paleomagnetic data of the ∼126 Ma Cretaceous granite (QGSI, 2014) from the Zaduo area. The granite intruded into Middle-Upper Jurassic sandstones of the Yanshiping Group presently outcropping to the southeast of the granite and was overlain by the Paleogene-Neogene Tuotuohe Group (Et) presently outcropping to its northeast (Figure 2, QGSI, 2014). Thermal and alternating field (AF) demagnetization yielded a set of characteristic remanent magnetization (ChRM) directions. Rock magnetic and petrographic studies were carried out to evaluate the reliability of the ChRM. Structural control of the granite and its adjacent formations was assessed as well. Overall, this sheds new light on the timing of the Lhasa-Qiangtang collision, as well as the closure of the BNO.
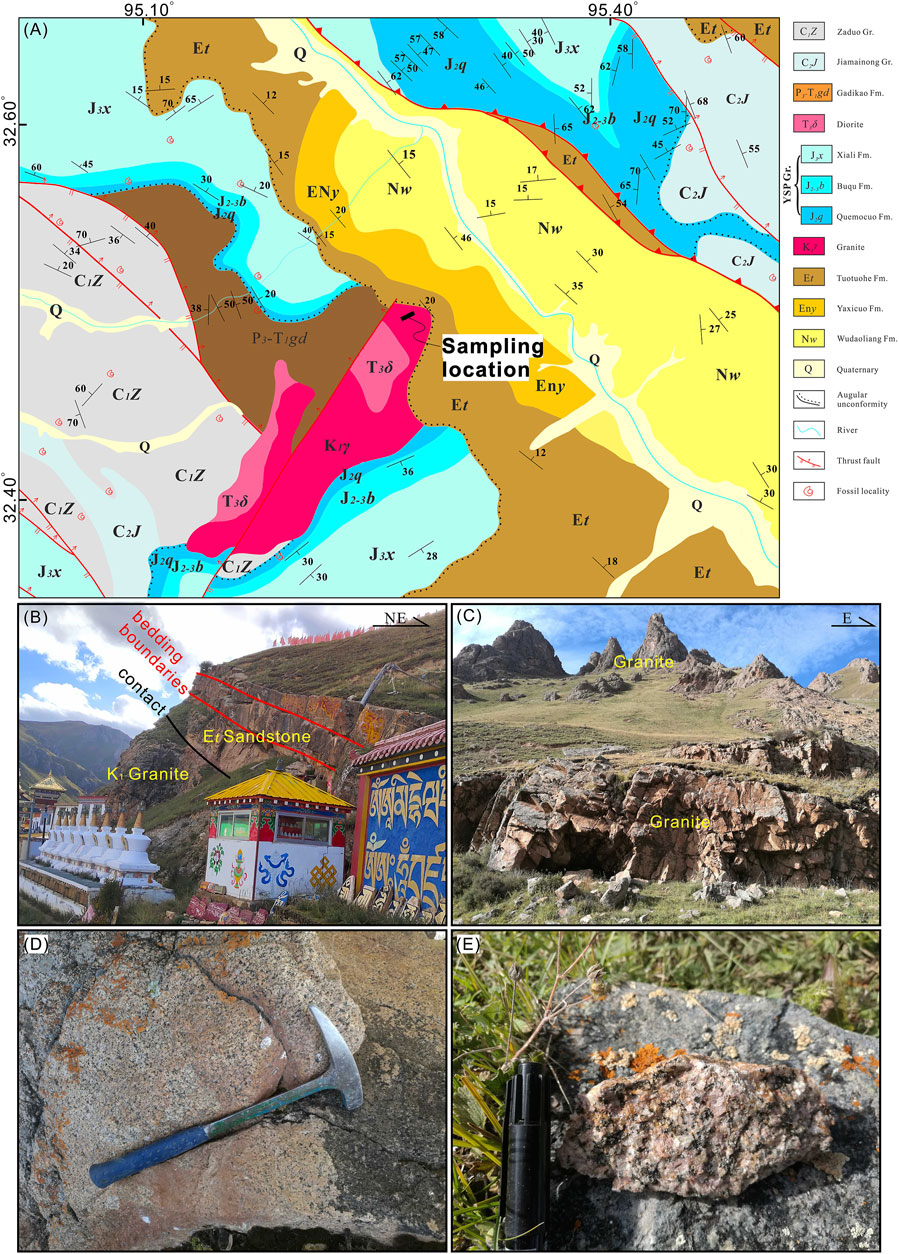
FIGURE 2. (A) Geological map of the Zaduo area [modified from the 1:250 000 Zaduo County regional geological map (I46C004004) by the Qinghai Geological Survey Institute (QGSI) 2005]. YSP: Yanshiping; Gr: Group; Fm: Formation. (B) Field photographs showing the contact between the Cretaceous granite and the sandstone of the Paleogene Tuotuohe Formation (Et). (C–E) Field photographs of representative outcrops and samples, hammer and marker for scale.
2 Geological Setting and Sampling
The Qiangtang Terrane is one of the major units in the central Tibetan Plateau and is situated between the Bangong-Nujiang Suture Zone (BNSZ) to the south and the Jinshajiang Suture Zone (JSSZ) to the north (Figure 1). It is aligned approximately east-west in the western and central parts with a maximum width of 400–500 km, but it is distinctly narrower (<150 km) in the eastern part where a gradual change to a north–south orientation is occurring (Yin and Harrison, 2000) (Figure 1).
Our study transect (32.5°N, 95.3°E) is located in Zaduo County, the eastern part of the EQT (Figure 1). The formations in this area are well exposed and mostly comprise Carboniferous, Jurrasic and Cenozoic sedimentary rocks (Figure 2A). The Cretaceous granite in this region intrudes Permo-Triassic volcanic rocks in the northwest and Middle-Upper Jurassic sandstones of the Yanshiping Group in the southeast. From base to top, the Paleogene to Neogene sedimentary rocks in this area consist of conformable contacts of the Tuotuohe (Et), Yaxicuo (ENy) and Wudaoliang (Ew) Formations, which conformably overlie each other (QGSI, 2005; QGSI, 2014). The Jurassic Yanshiping Group consists of the Quemo Co (J2q), Buqu (J2b), Xiali (J2-3x), Suowa (J3s) and Xueshan (J3x) Formations from base to top (QGSI, 2005; QGSI, 2014; Fang et al., 2016; Yan et al., 2016). The J3s and J3x Formations are absent in the study area (Figure 2A). The granite intrusion is unconformably overlain by the Paleogene-Neogene Tuotuohe Group (Et) to its northeast (Figures 2A,B). The Fenghuoshan Group which would normally be in between, is absent. The granite has an exposed surface of tens of square kilometers with pink to reddish color (Figures 2C–E). The dominant lithologies of the granite intrusion include medium- to fine-grained monzogranite and syenogranite with feldspar phenocrysts ranging from 1 to 5 cm in size (QGSI, 2014). A previous geochemical study shows that the Zaduo granites have a moderately high alumina saturation index (ASI) > 1.1, and a high SiO2 content (>∼70%). Thus, it is a typical peraluminous granite and classified as S-type (QGSI, 2005; QGSI, 2014). Whole-rock and biotite K-Ar ages of ∼126 Ma were reported for both monzogranite and syenogranite (QGSI, 2005; QGSI, 2014). A total of 98 paleomagnetic core samples from nine sites were collected from the Cretaceous granite intrusions; sites 1–4 are about 500 m away from sites 5 to 9. The lithology of the two locations is consistent, and no obvious weathering was observed. These core samples (2.5 cm diameter) were collected using a portable gasoline-powered drill with a water cooling system. Each sample was oriented in the field using a solar and/or magnetic compass.
3 Laboratory Techniques
The cores were cut into specimens of 2.2 cm long and underwent stepwise AF demagnetization at the paleomagnetic laboratory of the Institute of Tibetan Plateau Research, Chinese Academy of Sciences, Beijing, China. In 20 steps, AF demagnetization was performed up to 140 mT with an ASC D2000/T demagnetizer. Six specimens were also progressively thermally demagnetized (TD) for comparison in 23 steps (80, 150, 200, 250, 300, 350, 400, 450, 475, 500, 530, 560, 570, 585, 610, 630, 650, 660, 665, 670, 675, 680, and 685°C) in an ASC TD-48 oven with an internal residual field of less than 10 nT. The remaining NRM after each step was measured on a 2G Enterprises cryogenic magnetometer in a magnetically shielded room, which has an average field intensity of ∼170 nT.
To investigate the mineralogical features of the granite, polished thin sections were prepared for microscopic observations with a polarizing microscope. Micrographs in plane-polarized light (PPL) and reflected light (RL) of the same area were obtained by means of a Leica DM750 optical microscope with a DMC5400 digital camera in the “Fort Hoofddijk” paleomagnetic laboratory of Utrecht University, Netherlands.
Rock magnetic tests, including high-field thermomagnetic runs (magnetization versus temperature), acquisition curves of the isothermal remanent magnetization (IRM) and anhysteretic remanent magnetization (ARM), were conducted at the “Fort Hoofddijk” Palaeomagnetic Laboratory. The high-field thermomagnetic runs were measured in air by an in-house-built horizontal translation type Curie balance with a sensitivity of ∼5 × 10⁻⁹ Am2 (Mullender et al., 1993). Approximately 60–80 mg of four representative samples were crushed to coarse powder (<4 mm) with a conventional agate mortar and pestle, after which they were put into a quartz glass sample holder and held in place by quartz wool. The magnetic measurements were conducted with heating and cooling rates of 6°C min−1 and 10°C min−1, respectively. The samples were first heated to 250°C, cooled back to 150°C, and then heated to 350°C with cooling to 250°C. The procedure was completed after performing several more of these heating-cooling cycles up to 700°C followed by final cooling back to room temperature with an applied magnetic field of 100–300 mT. The successive peak temperatures of subsequent cycles were 250, 150, 350, 250, 450, 350, 520, 420, 620, 500 and 700°C. The ARM acquisition curves of thirty-three representative samples were acquired in 19 steps up to a 150 mT peak AC field superimposed with a 40 μT direct field. Subsequently, IRM acquisition curves (43 field steps) were measured on those samples with a maximum applied field of 700 mT. Both ARMs and IRMs were measured by an in-house-developed robot (Mullender et al., 2016), which allowed the samples to pass through a 2G Enterprises SQUID magnetometer (noise level 10–12 Am2) hosted in a magnetically shielded room (residual field <200 nT) at Utrecht University.
To quantitatively estimate the contributions of different magnetic carriers, IRM component analysis of Kruiver et al. (2001) was applied to the 33 samples of the two granite types. A parameter B1/2 is defined as the field at which half of saturation isothermal remanent magnetization (SIRM) is reached, and another dispersion parameter DP is defined as the width of the distribution. For the paleomagnetic direction statistics, principal component analysis (Kirschvink, 1980) on at least five successive steps was performed to determine ChRMs, and directions with high maximum angular deviation (MAD) values (>15°) were systematically rejected from further analysis. Sample-mean ChRM directions were calculated using the statistical methods described by Fisher (1953). Because gyroremanent magnetization (GRM) occurred in so-called Type 2 granite samples, the directions towards the origin below 24mT were calculated for those samples. End-member modeling was used to illustrate the mechanism of remanence acquisition and to confirm a primary NRM; measurement and data analysis procedures are described in Aben et al. (2014), and the program used in this paper can be found online (http://people.rses.anu.edu.au/heslop_d/).
4 Petrography
Sampled outcrops of the Zaduo granite show a typical homogeneous texture and are barely weathered (Figures 2D,E). Minerals in Type 2 samples are finer and cleaner than those in the Type 1 samples (Figure 3). A classic granitic texture appears in thin section observations consisting of quartz, feldspar and biotite; opaque minerals include magnetite (Figure 3). Quartz is one of the main constituents of the granite. It is in direct contact with other minerals and mostly >1.0 mm in size. In addition, it is invariably clear and unaltered, being characterized by euhedral crystals (Figure 3). Feldspar includes alkali feldspar and plagioclase feldspar, and shows euhedral or subhedral crystals; some feldspar crystals display clear and straight grain boundaries and slight alteration that is characterized by an uneven color (Figures 3A–F). The brown–yellow pleochroic grains in PPL are biotite. In general, biotite is accompanied by magnetite and/or chlorite and has regular and sharp grain boundaries. Chlorite is commonly formed as the product of biotite chloritization, showing greenish-yellow pleochroism and irregular and indistinguishable boundaries with biotite (Figures 3E,F). Magnetite is observed in most samples, frequently occurring as interstitial crystals with irregular shapes. However, Type 2 granite samples show fewer and smaller magnetite crystals than Type 1 granite samples (two types of granite samples were classified, see Section 5.2) (Figure 3).
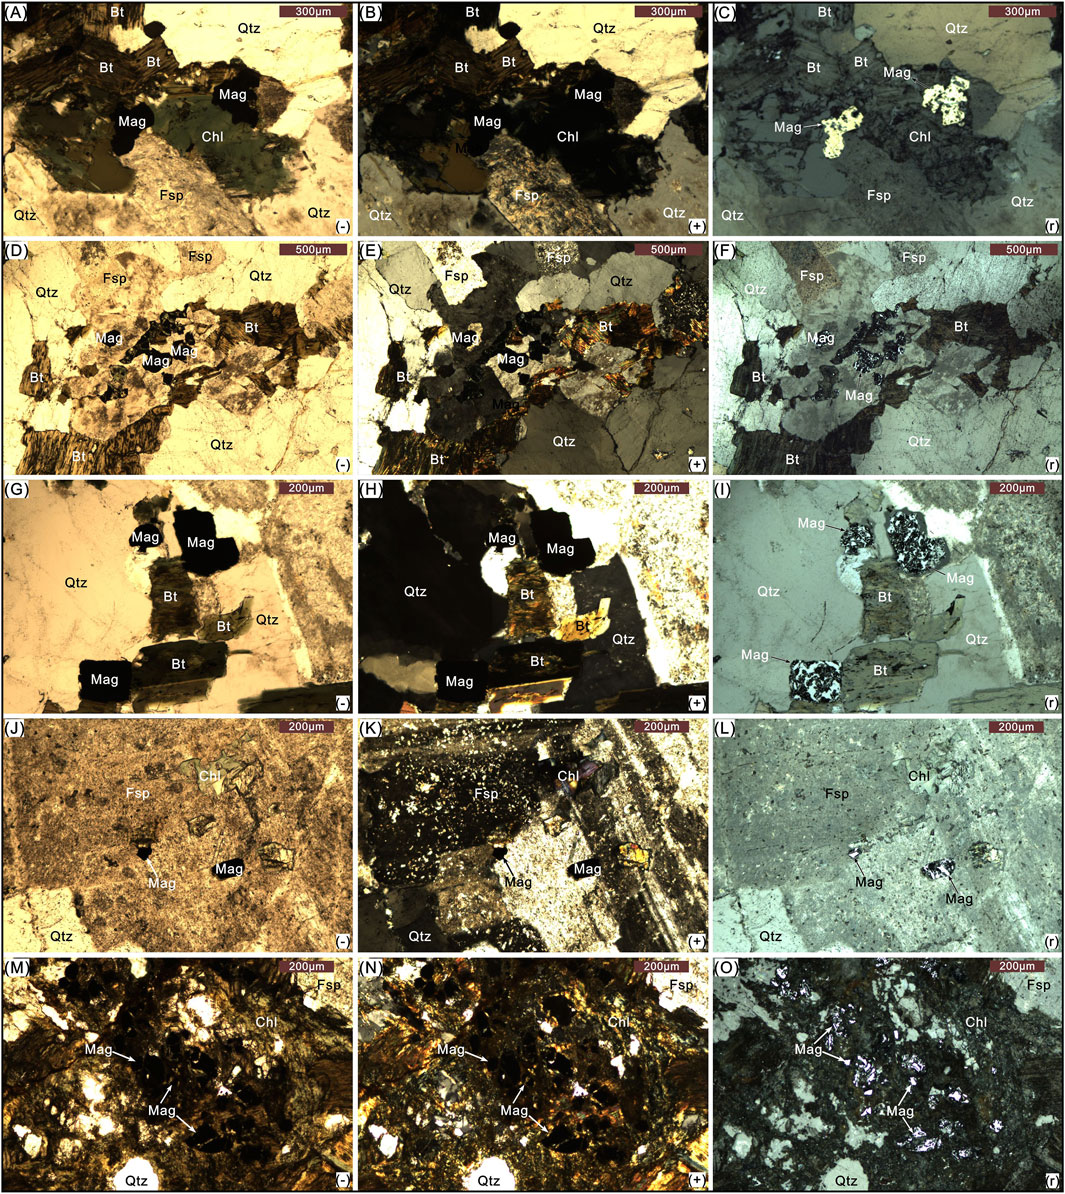
FIGURE 3. Micrographs of Type 1 (A–I) and Type 2 (J–O) samples in plane-polarized light (−), cross-polarized light (+) and reflected light (r). Abbreviations of minerals in the images are Bt: biotite; Mag: magnetite; Fsp: feldspar; Qtz: quartz; Chl: chlorite.
In the field, no massive veining or fluid motion was found in the granite. The outer surface of each sample was removed in the laboratory. Although chlorite is an alteration product, it is probably associated with the cooling of the granite, instead of being associated with later fluid motion due to intrusion of a new generation of granites. In addition, no ore bodies associated with the granite were reported. Magnetite formed during the cooling of the intrusion and the granite suffered minor further hydrothermal alteration (some chloritization of biotite), thus probably reserving primary remanent magnetization.
5 Rock Magnetism
5.1 Magnetization Versus Temperature
Stepwise high-field thermomagnetic runs of magnetization versus temperature were carried out for the Zaduo granite (Figure 4). The initial magnetization intensity of most samples is fairly low (∼5 × 10⁻³–5 × 10⁻² Am2/kg, Figures 4A–C). Only ZD 9-10 has an initial magnetization intensity two orders of magnitude higher (∼1.4 Am2/kg, Figure 4D). The thermomagnetic curves are characterized by a reversible decrease during heating to 700°C and a steeper decrease in magnetization at ∼500°C–580°C, indicating magnetite. The descent of magnetization from ∼580°C–700°C is a very tiny and gradual process, which is thought to be the “tail” of the magnetite or partially oxidized during heating instead of pointing to the presence of hematite. More importantly, we did not observe a distinct drop at ∼680°C, suggesting the absence of hematite. The final cooling curves from 700°C to room temperature are slightly above the corresponding heating curves for most of the samples (Figures 4A–C). These features likely indicate the alteration of a small quantity of Fe-bearing minerals to magnetite during heating (Özdemir and Dunlop, 1997; Li et al., 2016; Huang et al., 2017a; Huang et al., 2017b). Only for the deviating sample ZD 9-10, it is below the heating curves.
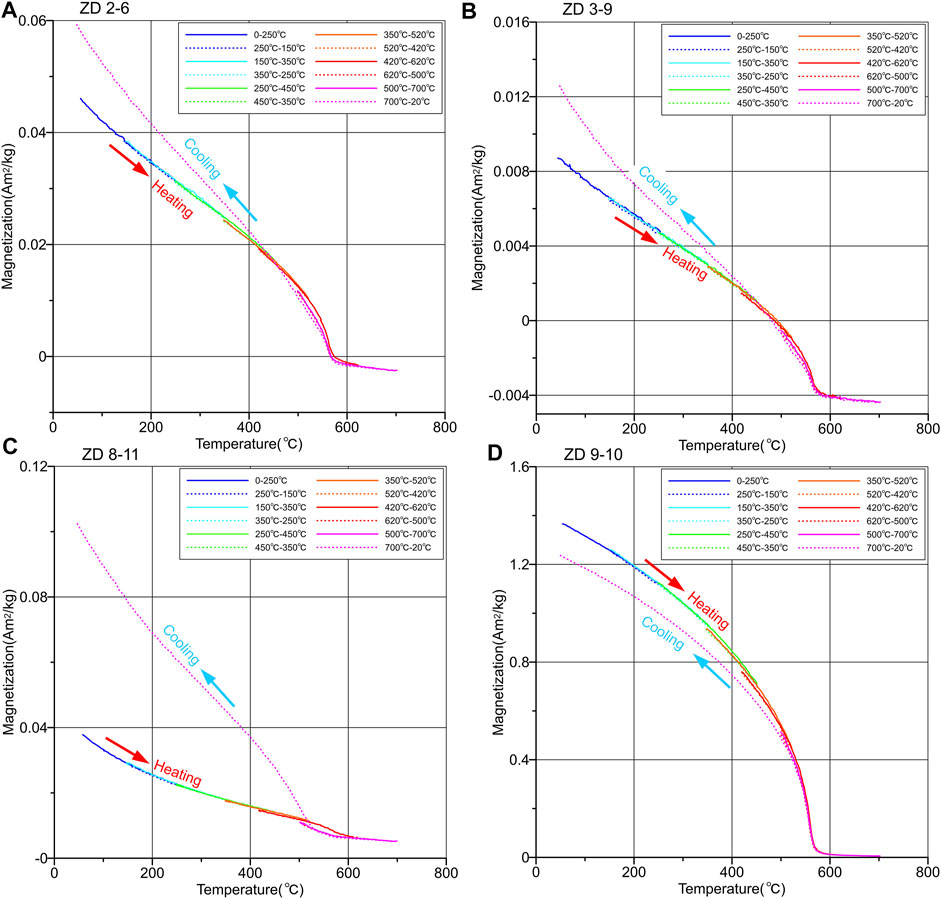
FIGURE 4. (A–D) High-field thermomagnetic runs of representative samples from the Zaduo granite. Solid (dashed) lines indicate the heating (cooling) curves.
5.2 Isothermal Remanent Magnetization Acquisition Curves and IRM Component Analysis
There are two types of granite samples classified by their rock magnetic and demagnetization characteristics. Type 1 comprises sites 1–4, as well as most of the samples of site 5, while Type 2 comprises the remainder. Thirty-three IRM acquisition curves show subtly different behavior between the two types. Type 1 includes seventeen samples and acquires 80%–90% of its maximum IRM at 100 mT and is essentially saturated at 200 mT (Figures 5A,B). These features indicate that low-coercivity magnetic components (e.g., magnetite sensu lato) are dominant. The saturation IRM values (IRM acquired in a field of 700 mT) range from ∼1 × 10⁻³ to 3 × 10⁻³ Am2/kg (Figures 5A,B; Supplementary Table S1). Type 2 (16 samples) behavior is also characterized by ∼80%–90% of the maximum IRM at 100 mT. However, the IRM acquisition curves show a gentle increase after 200 mT and seem to flatten off close to the maximum applied field of 700 mT. Thus, both typical magnetite and very fine-grained magnetite close to the SP threshold size (Gong et al., 2009) could be magnetic carriers in Type 2 granite. The saturation IRMs of Type 2 samples are much lower, below ∼2 × 10⁻⁴ Am2/kg (Figures 5C,D; Supplementary Table S1).
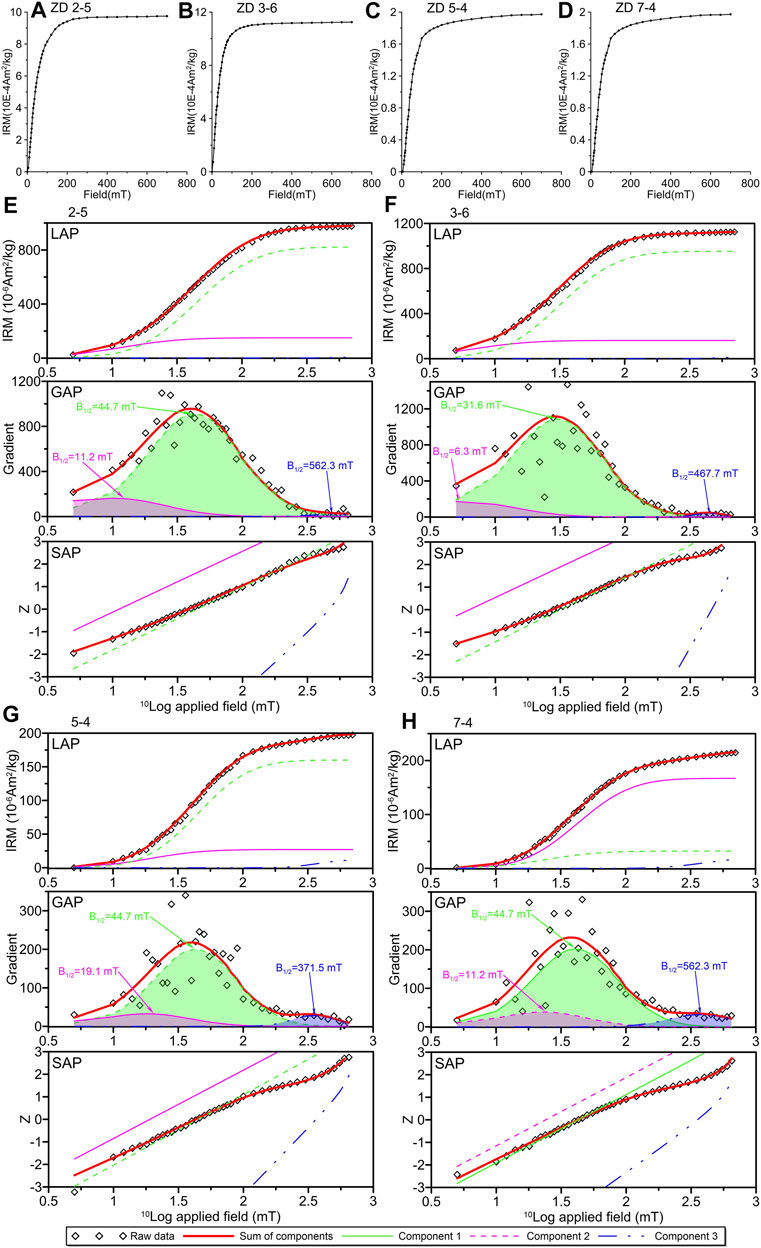
FIGURE 5. (A–D) IRM acquisition curves of representative samples. (E–H) IRM component analysis plots (Kruiver et al., 2001) of representative samples. Squares are measured data points. The components are marked with different colored lines. B1/2 and DP are in log10 mT. LAP: linear acquisition plot, GAP: gradient acquisition plot and SAP: standardised acquisition plot.
All of the IRM acquisition curves appear to be fit by up to three IRM components: component 1 with B1/2 of ∼10–20 mT, component 2 with B1/2 of ∼30–40 mT, and a harder component 3, with B1/2 of ∼400–600 mT (Figures 5E–H, Supplementary Table S2). Component 1 has low coercivity and contributes ∼15% to the SIRM. It is interpreted to be the result of thermally activated component 2 (Egli, 2004; Heslop et al., 2004; Huang et al., 2015; Zhang et al., 2016; Fu et al., 2021), which results in a left-skewed distribution that must be fitted with an extra component in Kruiver et al. (2001) software that only considers symmetric log-Gaussian functions. Component 2 is the dominant magnetic carrier in the granite and contributes >80% to the SIRM; it is typically interpreted to be magnetite (e.g., Kruiver et al., 2001). Component 3 has much higher coercivity and only contributes ∼1–6% to the SIRM (Figures 5E–H; Supplementary Table S2). This component can be interpreted along two lines: 1) hematite that has a typical B1/2 value ranging from 300 to 800 mT (Kruiver and Passier, 2001); or 2) very fine-grained magnetite close to the SP threshold size, which may not be saturated at a fairly high field (Dekkers and Pietersen, 1991; Tauxe et al., 1996; Gong et al., 2009; Huang et al., 2015). Here, we tend to favor the second option because hematite is not detected in the thermomagnetic runs. In addition, marginal oxidation of magnetite may result in a harder coercivity distribution. It is worth noting that Type 2 granite has a higher contribution to component 3 than Type 1 granite. Component 3 of Type 1 granite is only required to fit the “tail” of the IRM acquisition curves (contributions <1–2%). Thus, to some extent it is mineralogically less meaningful.
5.3 Anhysteretic Remanent Magnetization Acquisition Curves Analysis
ARM was imparted in a peak alternating field of 150 mT and a bias field of 40 µT. It is a sensitive probe of small variations in the domain state straddling the SD and pseudosingle domain (PSD) states (Hunt et al., 1995; Geiss et al., 2003). The ratio of ARM to IRM, as well as the shape of the acquisition curves of ARM are used as indicators of the domain state of the particles (Egli and Lowrie, 2002). We used IRM acquired in a field of 100 mT (marked as IRM100mT) and 700 mT (marked as IRM700mT) to display the contribution of high-coercivity grains to the ratio of ARM/IRM. As shown in Figure 6A, the ARM of Type 1 samples (∼20 × 10–6 Am2/kg) is distinctly higher than that of Type 2 samples (below ∼20 × 10–6 Am2/kg); similar characteristics can be observed in the SIRM (i.e., IRM700mT, Figure 6B; Supplementary Table S3). For Type 1 granite, the ratio of ARM/IRM100mT is indistinguishable from the ratio of ARM/IRM700mT (Figure 6C), indicating that there is no obvious influence of high-coercivity grains. In contrast, the ratio of ARM/IRM100mT is higher than the ratio of ARM/IRM700mT for Type 2 granite (Figure 6C), showing the influence of high-coercivity grains. A clear distribution of data points along a single line for Type 1 and 2 samples can be fitted with a linear trendline, whereas Type 1 samples have a larger coefficient of determination of the least-square fit (also reported in the figure) than Type 2 samples (Figure 6D). This testifies a finer but less uniform average magnetite grain size distribution in the Type 2 samples than in the Type 1 samples. These results are in line with the IRM component analyses.
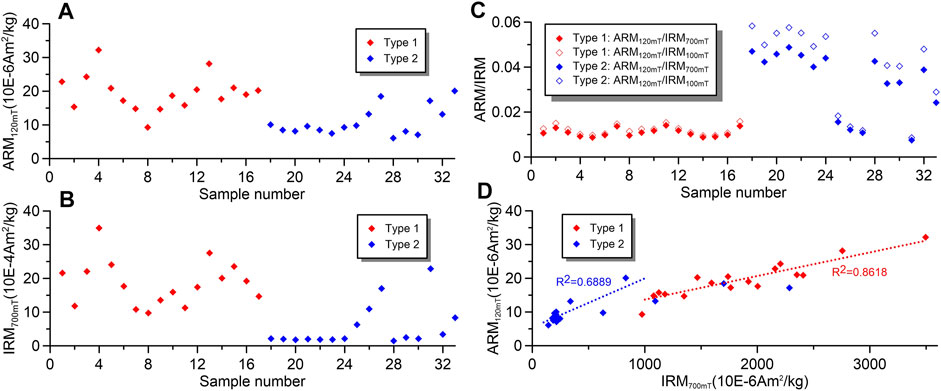
FIGURE 6. (A, B) ARM and IRM acquired at 150 mT in a 40 μT DC bias field and 700 mT respectively. (C) ARM versus IRM at sample level. (D) ARM versus IRM diagram confirming the uniformity in magnetic grain size for Types 1 and 2. The coefficient of determination of the least-square fitting is indicated for each data group.
6 Demagnetization and Characteristic Remanent Magnetization Directional Analyses
6.1 Demagnetization
The demagnetization characteristics are also different between Type 1 and Type 2 samples: 1) Type 1 with robust demagnetization behavior at a high field (temperature) that decays toward the origin, and 2) Type 2 with erratic demagnetization behavior at a high field level during AF demagnetization (>40 mT) but with a relatively stable demagnetization behavior of thermal demagnetization up to ∼580°C. More specifically, most of the Type 1 specimens exhibit a single NRM component, while the remainder shows two NRM components with the soft component removed at a fairly low field level (<15 mT) (Figures 7B,C,E). The NRM decays to the origin down to 10%–20% of the starting intensity at ∼60 mT or 580°C; it is thus considered as ChRM carried by magnetite (Figure 7; Supplementary Table S4). Although the number of thermally demagnetized specimens is limited, the ChRM directions are similar in both types of demagnetization, except for the specimen ZD seven to five that has deviating ChRM directions. In most Type 2 samples, a demagnetization behavior similar to that presented in Type 1 occurred below ∼24–28 mT. However, these specimens tend to bypass the origin after applying AF above 30 mT (Figures 7G–K). A stable demagnetization direction towards the origin can be observed when conducting thermal demagnetization. It is worth noting that this direction is virtually identical to the direction identified below ∼24 mT during AF demagnetization.
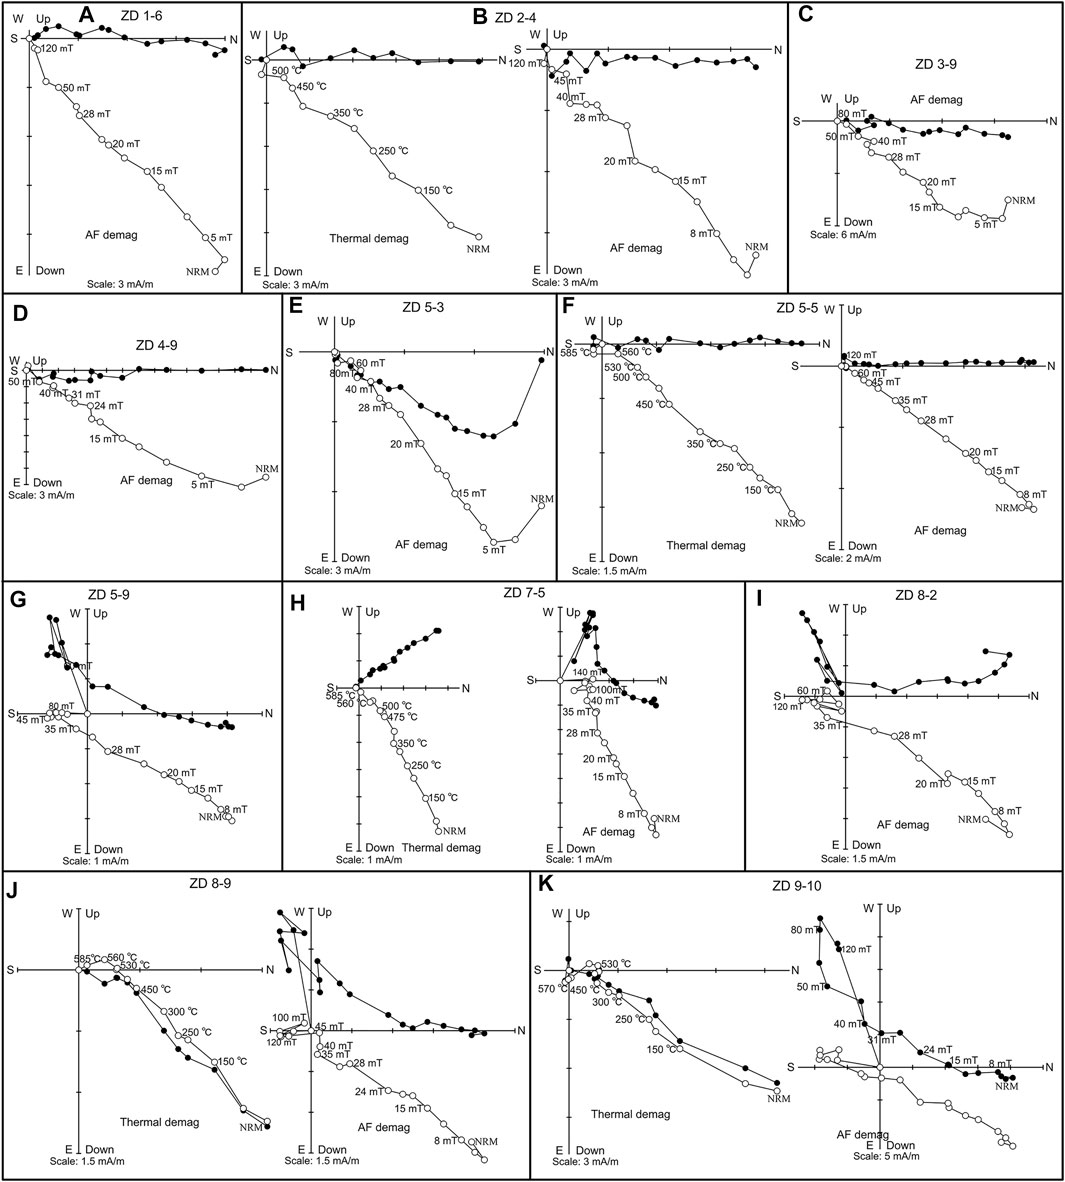
FIGURE 7. (A–K) Zijderveld diagrams (Zijderveld, 1967) of the representative granite samples (in geographic coordinates). Solid (open) symbols represent the projections of vector endpoints on the horizontal (vertical) plane. Numbers along the inclination represent the alternating field and thermal demagnetization steps in mT and °C, respectively. AF demag: alternating field demagnetization; Thermal demag: thermal demagnetization.
6.2 Characteristic Remanent Magnetization Directions
As the AF demagnetization yielded stable directions for Type 1 granite, we therefore calculated the ChRM directions from the AF demagnetization results. For Type 1 granites, 51 directions were obtained from 55 analyzed samples. The sample-mean direction of these 51 samples is Dg = 2.8°, Ig = 38.4°, κ = 46.4, and α95 = 3.0°, n = 51 in geographic coordinates (Figure 9A; Supplementary Table S4).
Gyroremanent magnetization (GRM) is a spurious magnetization that is rather frequently generated by procedures used in static 3-axis AF demagnetization of the NRM (Stephenson, 1980a; Stephenson, 1980b; Dankers and Zijderveld, 1981; Stephenson, 1993). Although greigite often acquires GRM during AF demagnetization (e.g., Snowball, 1997a, Snowball, 1997b; Hu et al., 1998, Hu et al., 2002; Sagnotti and Winkler, 1999; Stephenson and Snowball, 2001; Fu et al., 2008; Duan et al., 2020), fine-grained (titano)magnetite has been reported to be able to acquire it (Roperch and Taylor, 1986; Stephenson, 1993). It seems plausible that GRM can account for the deviating demagnetization behavior at higher field levels during AF demagnetization (>40 mT).
To address this ambiguity, we analyzed the demagnetization directions of the sample collection as a function of AF levels (Figure 8). The sample-mean directions of the Type 1 and 2 samples are basically identical at alternating fields below 24 mT, which agrees well with the demagnetization features shown on the orthogonal demagnetization diagrams (Figures 7, 8). With the alternating field increasing from 28 to 50 mT, the sample-mean direction of the Type 2 samples shifts to the west with an increasingly shallower inclination, while the Type 1 samples maintain a stable direction albeit with a larger uncertainty (Figures 8J–O). From 60 mT upward, Type 2 samples remain stable with a westerly direction while the Type 1 samples keep their original direction but with greater uncertainty (Figures 8P–T). This difference can also be observed on the normalised decay curves (Figure 8U). It is therefore likely that the high AF demagnetization behavior of Type 2 samples represents a GRM. To obtain a geologically meaningful direction we used the low AF steps (mostly <28 mT) for principal component analysis (Kirschvink, 1980), and obtained the sample-mean direction from 41 Type 2 samples as Dg = 2.8°, Ig = 38.8°, κ = 60.9, and α95 = 2.9°, n = 41 in geographic coordinates (Figure 9B).
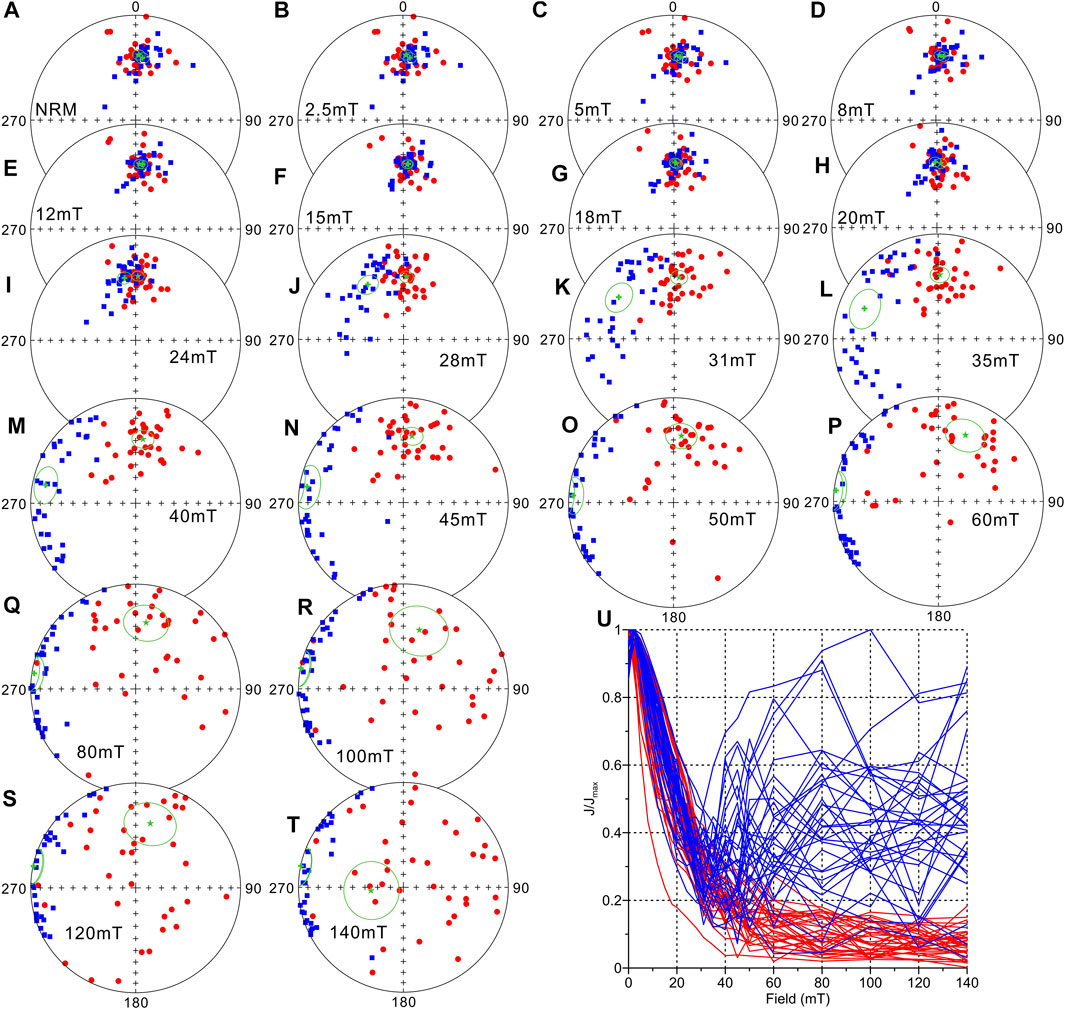
FIGURE 8. (A–T) Equal-area projections of the AF demagnetization directions at each step. Red dots (blue squares) denote the samples of Type 1 and 2 samples. All diagrams are displayed in geographic coordinates. (U) Normalized remanence decay curves. Red (blue) lines denote the samples of Type 1 (Type 2) granite.
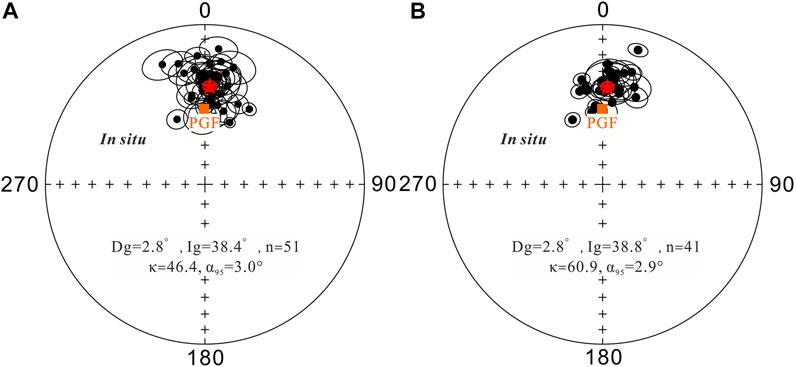
FIGURE 9. Equal-area projections of the sample-mean directions of Type 1 (A) and Type 2 (B) granite based on principal component analysis (Kirschvink, 1980). The brown squares denote the direction of the present-day geomagnetic field (PGF, D = 359.5°, I = 51.1°) of the sampling location.
The ChRM directions calculated from Type 1 samples are paleomagnetically well-behaved; the low field component of Type 2 samples, however, cannot be considered a ChRM without further ado. We note that the directions of the low field AF component are consistent with those of the high temperature segment during thermal demagnetization for Type 2 samples. In addition, the sample-mean direction obtained from 41 Type 2 samples (Dg = 2.8°, Ig = 38.8° and α95 = 2.9°) is statistically indistinguishable from the mean of 51 Type 1 samples (Dg = 2.8°, Ig = 38.4° and α95 = 3.0°). Thus, in the remainder the directions of Type 1 samples and low AF Type 2 samples are combined and yield Dg = 2.6°, Ig = 38.6° and α95 = 2.1°.
7 End-Member Modeling of Magnetic Components
End-member modeling based on rock magnetic research has been a novel approach to detect potential remagnetization without a strong reliance on paleomagnetic field tests (i.e., the fold test, conglomerate test, reversals test, and baked contact test). It is based on the assumption that the measured data can be a linear mixture of a number of invariant constituent components referred to as end members. Several case studies have demonstrated the huge potential of the approach to evaluate the magnetic properties of remagnetized and non-remagnetized rocks (Gong et al., 2009; Van Hinsbergen et al., 2010; Meijers et al., 2011; Aben et al., 2014; Huang et al., 2015). Magnetic particles were added to an existing particle suite in a chemically remagnetized rock, which resulted in distinct IRM acquisition curves and a collection of related end members. This approach was not only applied in sedimentary rock settings (Gong et al., 2009; Van Hinsbergen et al., 2010; Meijers et al., 2011; Aben et al., 2014; Huang et al., 2015), but also used in volcanics (Huang et al., 2015). IRM is considered to be a suitable rock magnetic property to define end-members (Gong et al., 2009; Dekkers, 2012; Aben et al., 2014). Typically, at least 30 IRM acquisition curves should be used as input to make use of the inherent variability within a data set. The only criterion is that the input curve must be monotonic (i.e., the derivatives of the input data should be ≥0) and contain the same number of the data points at the same field steps (e.g., Heslop and Dillon, 2007). The end-modeling algorithm used here is described in Aben et al. (2014). We interpolated the measured IRM acquisition curves onto a common field step grid via spline interpolation.
7.1 End-Member Modeling of Acquisition Curves of IRM
IRM acquisition curves of 33 specimens from the granite were used for the end-member model (Figure 10A; Supplementary Table S1). The unmixing algorithm mathematically suggests four end-members as the optimal number of end-members, based on the break-in-slope in the coefficient of determination (r2, ranging from 0 to 1) versus the number of an end-member graph (Figure 10B). However, the end-member curves (called EM1, EM2, EM3 and EM4) become noisy, and two of them (EM2 and EM3) are essentially duplicating, suggesting overinterpretation of the data set (Figures 10C,D). Thus, models from four end-members onward are not considered further. End-member solutions reveal that the three-end-member model has a convexity of -3.8872 (after 1,000 iterations) and an r2 value of 0.93, while the two-end-member model has a convexity of -3.3819 (after 1,000 iterations) and an r2 value of 0.89. Both of the r2 values are higher than the lower limit of 0.8 and meet the requirements. The end-member curves of both the two and three end-member models show similar characteristics (Figures 10E–I). The end-member curve 1 (EM1) is nearly identical in both models, whereas the end-member curve 2 (EM2) in the two end-member model is decomposed into two other end-member curves (EM2 and EM3) in the three end-member model. Plotted on a ternary plot, the three end-members show that all samples fall within the field with high contributions of EM1 and EM2, or EM2 and EM3, but without high contributions of EM2 and EM3 (Figure 10F). There is no sample with a high contribution of EM1 or EM3 as shown in Figure 10F. This appears to indicate that the three end-member model does not identify more than the two end-member model, but complicates the interpretation needlessly. Therefore, the two end-member model is considered the optimal model for the granite.
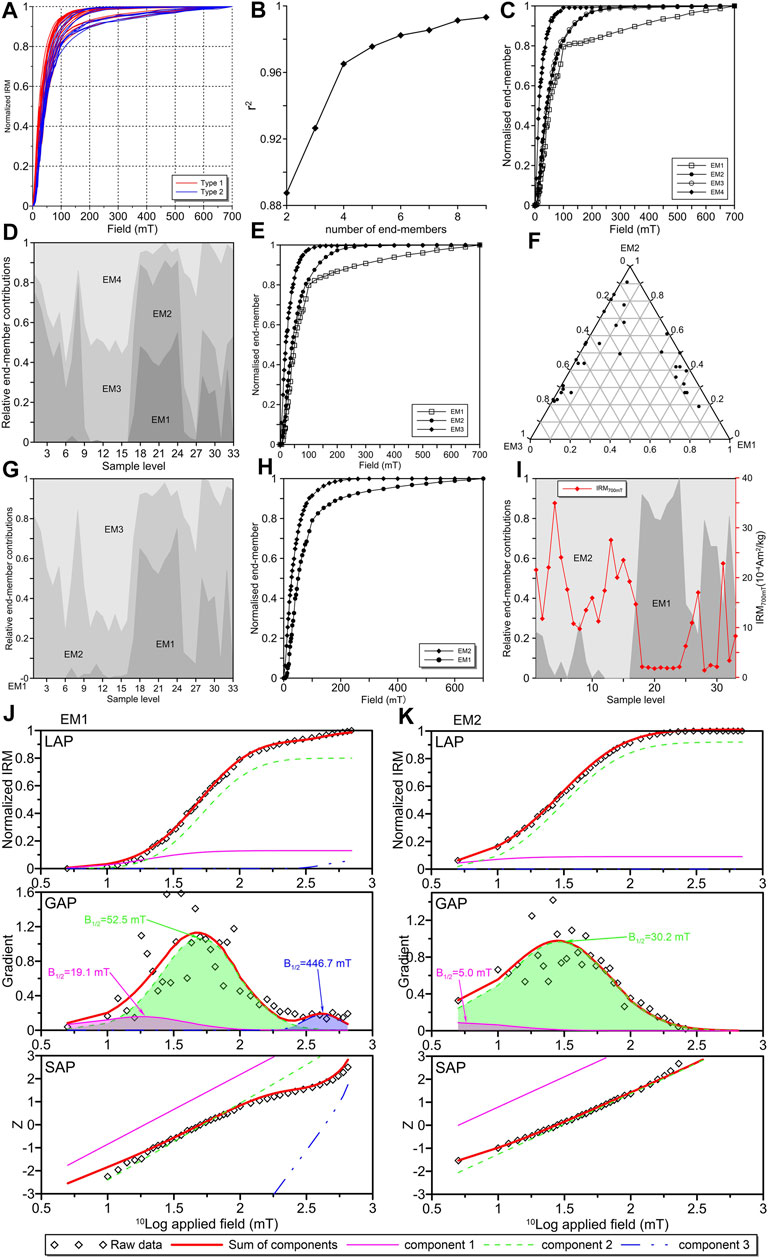
FIGURE 10. IRM end-member modeling for the Cretaceous granite. (A) Normalized IRM acquisition curves for Type 1 and Type 2 samples. (B) Coefficient of determination versus the number of endmembers, there is a clear break-in-slope in the four end-member model. End-member modeling for the normalized IRM-acquisition curves with four (C,D), three (E–G) and two (H,I) end-members. (J,K) IRM component analysis (Kruiver et al., 2001) of the end-members in our favorable two end-member model; colors and symbols are the same as in Panel 5.
As shown in Figure 10H, EM1 consists of ∼80% of a soft component with a coercivity range below 100 mT while the remaining 20% is acquired with a broad coercivity fraction ranging up to 700 mT. EM2 presents a sharp increase in low fields and acquires >90% saturation below 100 mT, and can be considered to be saturated at 200 mT. We also applied IRM component analysis to these two end-members (EM1 and EM2 in the two end-member model) (Kruiver et al., 2001). EM1 can be fitted with three components (components C1, C2, and C3, increasing magnetically from soft to hard), while EM2 requires two components (components C1 and C2). Component C1 with B1/2 < 20 mT is considered as thermally activated component C2 particles for both EM1 and EM2. Its contribution is approximately 10% to the SIRM (13% for EM1 and 9% for EM2) (Figures 10J,K; Supplementary Table S2). Component C2 (with B1/2 ∼30 mT for EM2 and ∼52 mT for EM1) is interpreted to be typical magnetite (Lowrie, 1990). It is the dominant magnetic component, contributing 81 and 91% to their respective SIRMs. Component C3 with a relatively high B1/2 (∼450 mT) contributes 6% to EM1, whereas it appears to be absent in EM2. As interpreted in Section 5.2, we also regard it here as fine-grained magnetite or marginally oxidized magnetite. EM1 is dominant in Type 2 granite samples while EM2 dominates in Type 1 granite samples. IRM700mT (Figure 10I) also relates to the end-member allocation, where the EM2-dominated samples have a high IRM700mT value. Several studies demonstrate that the end-members vary in remagnetized and non-remagnetized rocks (Gong et al., 2009; Van Hinsbergen et al., 2010; Meijers et al., 2011; Aben et al., 2014; Huang et al., 2015).
7.2 End-Member Modeling of Acquisition Curves of ARM
Although ARM is not considered to be the most suitable rock magnetic property to define end-members, due to its bias towards magnetite (Gong et al., 2009; Aben et al., 2014), subtle differences can be expected when comparing end-member models of ARM and IRM data. We follow the end-member modeling procedures of IRM; the optimal end-member number remains obscure as no distinct break-in slope can be observed on the r2 versus the number of end-members diagram. Based on the end-member models of the IRM acquisition curves, three and two end-member models are utilized in an attempt to satisfy the optimal number of end-members (Figures 11A–G).
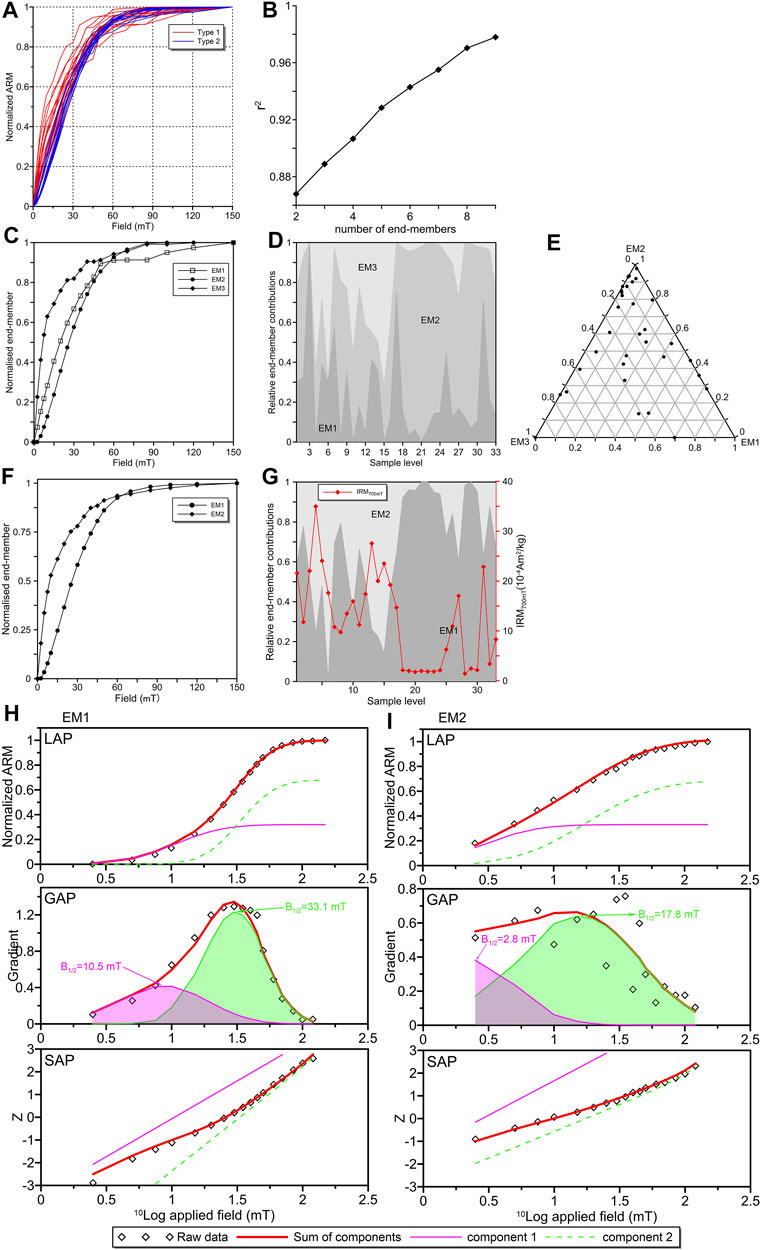
FIGURE 11. ARM end-member modeling for the Cretaceous granite. (A) Normalized ARM acquisition curves for Type 1 and Type 2 granite. (B) Coefficient of determination versus the number of endmembers. End-member modeling for the normalized ARM acquisition curves with three (C–E) and two (F,G) end-members. (H,I) ARM component analysis (with the software of Kruiver et al., 2001) of the end-members in the two end-member model; colors and symbols are the same as in Panel 5.
End-member solutions reveal that the three-end-member model has a convexity of −4.0807 (after 1,000 iterations) and an r2 value of 0.89, while the two-end-member model has a convexity of -6.1728 (after 1,000 iterations) and an r2 value of 0.87. EM1 in the two-end-member model seems to be the combination of EM1 and EM2 in the three-end-member model through the comparison of end-member contributions (Figures 11C,F). In the ternary plot, most samples are mixtures of EM1 and EM2, or EM3 and EM2 (Figure 11E). In addition, the three-end-member model is characterized by rather noisy end members, especially in high fields, which means that the dataset is overinterpreted. The general model selection criteria or rules follow the idea that the minimum number of components should be opted that still fit well to the input data (Burnham and Anderson, 2002; Heslop and Dillon, 2007). We therefore prefer the two-end-member model to interpret our ARM acquisition data.
The shape of the normalized ARM acquisition curve for each of the two end-members is shown in Figure 11F. After being stable in the lowest AF steps, EM1 shows a rapid increase below 50 mT, followed by a gentle further rise. In contrast, EM2 has no stable zone at low AF levels and climbs much quicker than EM1 below 30 mT, followed by a gradual increase; both curves intersect at ∼60 mT. We applied coercivity component analysis to these two end-members (Kruiver and Passier, 2001). Generally, both EM1 and EM2 can be fitted with two components (components C1 and C2, with C1 being the softer of the two). Component C1 has a very low B1/2 and generally results from other thermally activated components (Egli, 2004; Heslop et al., 2004). Component C2 (with B1/2 ∼20–30 mT) represents typical SD magnetite (Lowrie, 1990), accounting for ∼68% of both EM1 and EM2. The high coercivity component is absent in the end-members. For Type 1 granite, most samples are mixtures of EM1 and EM2 (Figure 11F). The contributions of EM1 and EM2 vary considerably, yet an average of 50% for each. A great number of samples of Type 2 have the predominant EM1, indicating the sole contribution from EM1 (Figure 11F). The end-member modeling of ARM acquisition curves resembles that of IRM acquisition curves. However, the EM1 contribution yielded from ARM is higher than that from IRM for all the samples, which coincides with those reported previously (Gong et al., 2009; Aben et al., 2014).
8 Discussion
8.1 Primary Natural Remanent Magnetization in the Early Cretaceous Granites
The granites intruded into the early Carboniferous Zaduo Group, and the Permo-Triassic volcanic rocks outcropping to the northwest. Other rocks that were intruded are the Middle-Upper Jurassic sandstones of the Yanshiping Group outcropping to the southeast (Figures 2A,B). Thus, the age of the granite is post Jurassic. This is confirmed by whole-rock and biotite K-Ar ages of ∼126 Ma (QGSI, 2005; QGSI, 2014). No younger igneous bodies are found near the studied location, and the nearby Permo-Triassic volcanic rocks retain primary magnetizations (Guan et al., 2021). Hence, it is less likely that thermoviscous resetting of existing magnetic minerals has occurred (Kent and Opdyke, 1985). The nearby Middle-Upper Jurassic limestones of the Yanshiping Group were reported to be remagnetized during the India–Eurasia collision process (Fu et al., 2021). However, igneous rocks have a considerably lower porosity that grossly diminished the circulation of fluids. In addition, the absence of organic matter in igneous rocks could not drive oxidation/reduction reactions. Therefore, both the Permo-Triassic and Cretaceous igneous rocks escaped the remagnetization that affected the nearby Middle-Upper Jurassic limestones.
Rock magnetic analyses indicate that magnetite is the dominant magnetic carrier of the granite. The presence of finer-grained magnetite in Type 2 granite samples yielded erratic demagnetization behavior at the highest field levels during AF demagnetization (Figures 7, 8), GRM, a high contribution of EM1 (Figures 10, 11) and deviating ARM/IRM values (Figures 6C,D). Gong et al. (2009) reported that remagnetized limestones have a high percentage of end-member 1 that is close to saturation at approximately 700 mT, whereas non-remagnetized rocks have a high percentage of end-member 2 that saturates at ∼300–400 mT. End-member 1 is interpreted to be very fine-grained magnetite, close to the SP threshold size. This is verified by other studies on both volcanic and sedimentary rocks (Van Hinsbergen et al., 2010; Meijers et al., 2011; Aben et al., 2014; Huang et al., 2015). As shown in Figure 10H, EM2 saturates at 200–300 mT while EM1 does not reach saturation until 700 mT. Most EM2-dominated samples belong to Type 1, indicating a primary remanent magnetization of Type 1 granite samples. Although EM1 that saturates at approximately 700 mT dominates in Type 2 granite samples, it is not considered as a remagnetized end-member because the sample-mean directions of the Type 1 and Type 2 samples are similar. We consider that EM1 is fine-grained magnetite, which can account for the GRM that occurred in Type 2 granite samples.
The granitic composition can be changed through mineral dissolution or recrystallization during post-magmatic hydrothermal/metasomatic alteration. Feldspars are generally vulnerable to alteration, and turbid feldspars are considered as a hint of hydrothermal alteration (e.g., Nédélec et al., 2015). Chlorite is formed after biotite; chloritization indicates medium- to high-temperature conditions (Bailey, 1984). Quartz formed during late crystallization and did not alter. As a whole, the studied granites display primary (magmatic) minerals in thin sections. Magnetite formed merely during the cooling of the igneous intrusion and underwent only slight hydrothermal alteration (some chloritization of biotite), thus probably retaining a primary remanent magnetization.
In summary, although we could not apply paleomagnetic field tests, it is very probable that the studied Cretaceous granite carries a (quasi)primary remanent magnetization acquired during its cooling. Our microscopic and rock magnetic results form the basis for this notion. The A95 of the pole (2.1°) falls within the theoretical range for a pole that has sufficiently averaged PSV (1.97–4.75° for N = 92 samples) (Deenen et al., 2011, Deenen et al., 2014), which is sufficiently long enough to average paleosecular variation.
8.2 Structural Control of the Granite and its Implications for the Lhasa-Qiangtang Collision
Structural control of granites is usually difficult due to poor constraints on the paleohorizontal. Intrusion need not occur in horizontal strata, so standard tilt correction of adjacent sediments with extrapolation to the granite cannot be performed here. The Late Cretaceous to early Cenozoic Fenghuoshan Group is absent in this area, and the Eocene sedimentary rocks (Et) in the northeast unconformably overlie the Cretaceous granite (Figures 2A,B). The bedding attitude of Et has an average strike/dip of 321°/20°. In the southeast, the Middle-Upper Jurassic sandstone of the Yanshiping Group has an average strike/dip of 54°/32°. Below we evaluate these constraints on the ChRM directions of the Zaduo granite.
The ChRM direction obtained from 92 granite specimens is Dg = 2.6°, Ig = 38.6°, κ = 51.4, and α95 = 2.1° in geographic coordinates (Figure 12A; Supplementary Table S4). First, we can assume that the studied granite had not been tilted prior to the deposition of the overlying Tuotuohe Formation, which was proposed to have been tilted during the late Himalayan period (∼25 Ma) (STRGSQ, 1988; QGSI, 2005; QGSI, 2014). In this scenario, it is reasonable to take the same tilting for the granite. After tilt-correction, the sample-mean direction of the 92 samples is Ds = 11.1°, Is = 24.5°, κs = 51.4, α95 = 2.1°, corresponding to a paleopole at 67.1°N, 243.4°E with A95 = 2.1° and a paleolatitude at ∼12.5 ± 2.9°N for the study area (Figure 12B; Supplementary Table S4). This scenario yields an unrealistic paleolatitude as it is much lower than the predicted paleolatitude of over ∼30°N for the Mangkang area in the Eastern Qiangtang Terrane (∼500 km southeast of the Zaduo area) (i.e., paleolatitudes of 30.8° ± 10.9° during the Berriasian-Barremian and 33.3° ± 8.3° during the Aptian-Turonian by Huang et al. (1992); 36.2° ± 6.5° in the Late Cretaceous by Tong et al., 2015); 33.2° ± 2.5° in the Late Cretaceous in the center Qiangtang by (Meng et al., 2018). Therefore, it is improper to perform a granite tilt correction via the attitudes of the overlying sedimentary rocks of the Tuotuohe Formation. Thus, the target granite was (partially) tilted prior to Paleogene sediment deposition.
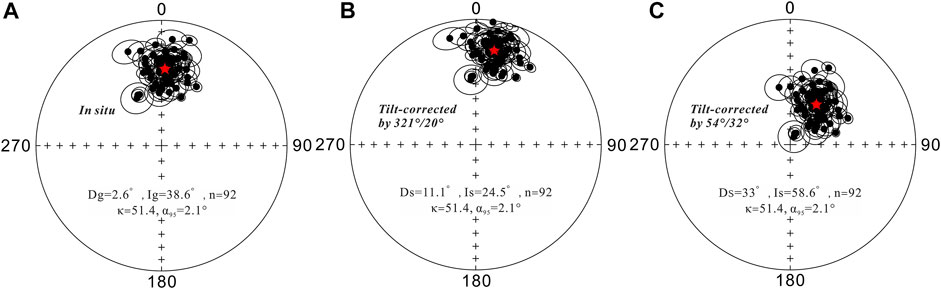
FIGURE 12. Equal-area projections of the sample-mean directions from Type 1 and Type 2 granite before (A) and after bedding corrections with the bedding attitude (strike/dip) of Et (B) and Jq (C) sandstones.
Alternatively, if we assume that the sedimentary rocks of the Late Jurrasic Quemocuo Formation were not tilted prior to the granite intrusion, we can correct the granite tilt with the attitude of the adjacent Quemocuo Formation. The tilt-corrected paleomagnetic direction in this situation is Ds = 33.0°, Is = 58.6°, with κs = 51.4 and α95 = 2.1°, corresponding to a paleopole at 62.4°N, 161.9°E with A95 = 2.1° and a paleolatitude of ∼39.1° ± 3.8°N (Figure 12C; Supplementary Table S4). In this scenario, the deduced paleolatitude remains improper as it is ∼5°–10° higher than previously published paleolatitude estimates (e.g., paleolatitudes of ∼30°–33° during K1 by Huang et al. (1992); ∼36° during K2 by Tong et al. (2015); ∼33° during K2 by Meng et al., 2018). This inconsistency suggests that the Quemocuo Formation was tilted before the intrusion of the granite, that is, ∼126 Ma.
Although robust paleolatitudes cannot be obtained by the above two assumptions, we can estimate the tilt of the Middle-Upper Jurassic sandstones of the Yanshiping Group in the southeast at the time of intrusion. Two paleomagnetic studies on Cretaceous rocks in the Mangkang area provide forty mean paleopoles for the Eastern Qiangtang Terrane (Table 1). To constrain the reference paleopoles as precisely as possible, we calculated the average paleopoles using Fisher statistics: 40.6°N, 170.5°E, A95 = 13° during the Early Cretaceous (Huang et al., 1992); 48.9°N, 168.1°E, A95 = 6.3° during the Late Cretaceous (Huang et al., 1992; Tong et al., 2015); and 46.5°N, 168.9°E, A95 = 5.7° during the Cretaceous (Huang et al., 1992; Tong et al., 2015). Another study from Otofuji et al. (1990) on Cretaceous strata was excluded because the number of samples is deemed insufficient. For completeness, it yields a similar mean paleopole of 48.5°N, 175.8°E, A95 = 9.5° during the Barremian-Albian. The expected declination (Ds-exp = 52.4°) and inclination (Is-exp = 53.0°) in stratigraphic coordinates can be obtained for our study area using the mean Cretaceous paleopoles, thus yielding an expected bedding attitude of Strikeexp = 43.1° and Dipexp = 46.1° for the Middle-Upper Jurassic sandstones in the southeast of the granite. The observed bedding attitude of the Middle-Upper Jurassic sandstones is strike = 54° and dip = 32°. Thus, there is a discrepancy of ∼10° between the expected and observed strike and ∼14° between the expected and observed dip in the overlying Middle-Upper Jurassic sandstones of the Yanshiping Group.
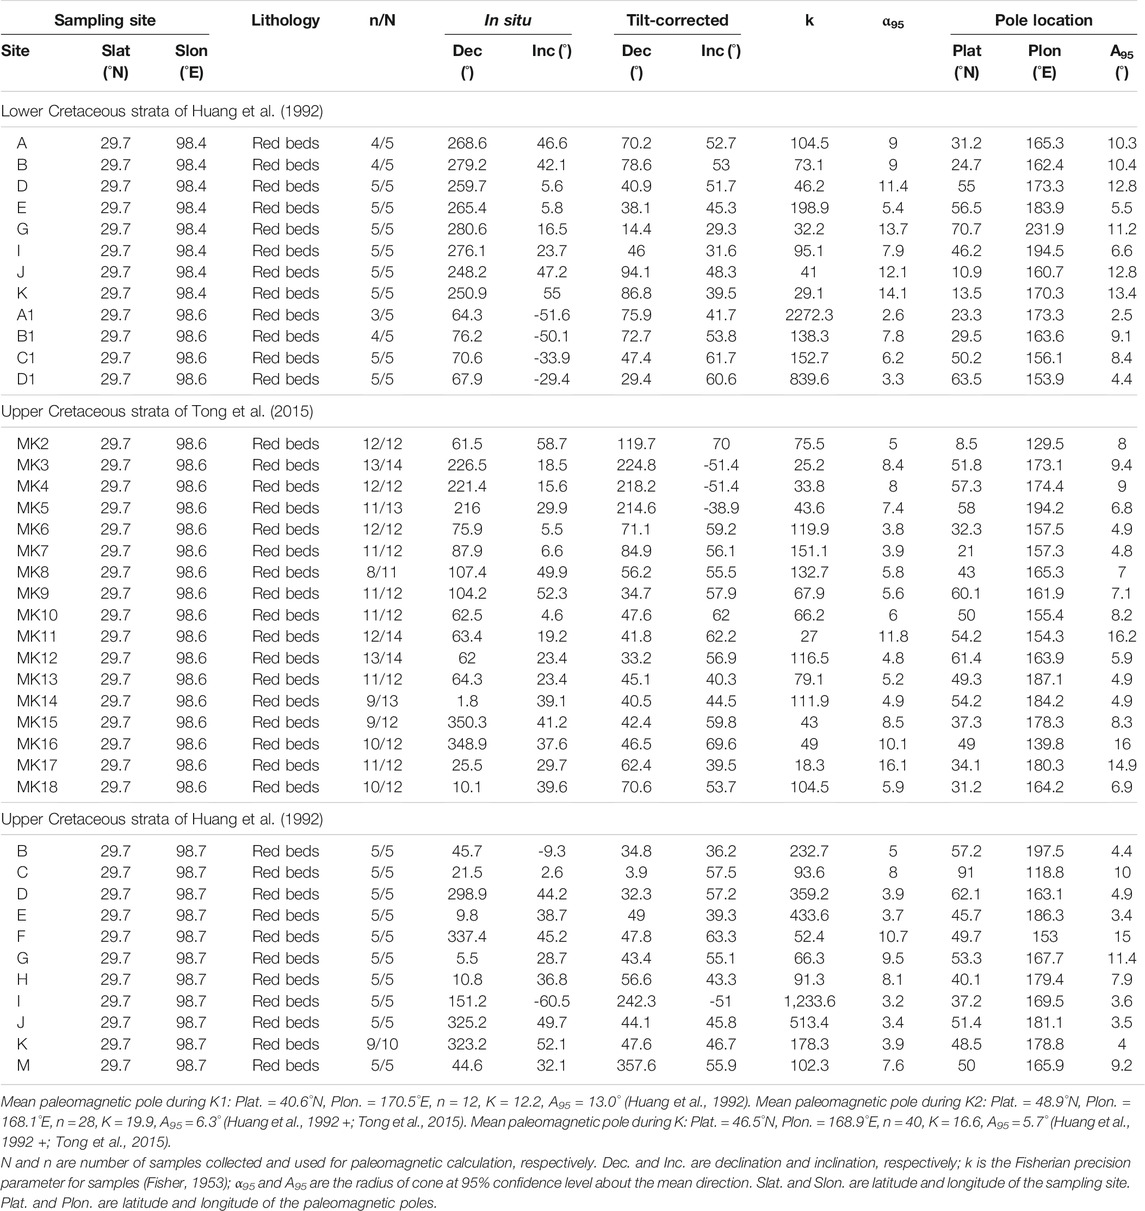
TABLE 1. Paleomagnetic poles for the Eastern Qiangtang Terrane during the Cretaceous.
The difference between the observed and expected bedding attitudes indicates that the strata of the Yanshiping Group in the Eastern Qiangtang (at least in the Zaduo area) were tilted during/prior to the intrusion of the granite. We provide two options here to interpret this discrepancy in attitudes. One is that the granite intrusion lifted the overlying Jurassic sedimentary strata and led to the SE dip. In this case, the S-type granite could be a result of orogenic building processes during the collision of the Lhasa and Qiangtang Terranes. The second option is that the Jurassic sedimentary strata were tilted before the granite intrusion, which was formed in a post-orogenic extensional regime after the Lhasa-Qaingtang collision. We tend to favor the second option, as there is roughly 40 Myr between the overlying Jurassic sedimentary strata and the granite intrusion, during which the tilt could occur. In this case, the tilt of the Jurassic sedimentary strata was likely the response to the Lhasa-Qiangtang collision, as there was no other known significant tectonic activity from the late Jurassic to 126 Ma. Therefore, the age of the granite (∼126 Ma) provides a minimum age constraint for the Lhasa-Qiangtang collision, or the closure of the Bangong-Nujiang Ocean. The NE-trending Jurassic sedimentary strata are distinguished from the SE-trending Cenozoic strata, which may signify a ∼90° clockwise rotation before the Cenozoic. Another clockwise rotation may have occurred after the India-Eurasia collision, which formed the NE-trending Jurassic sedimentary strata. Given that layer parallel shortening (LPS) processes occurred widely during the early stages of deformation, which delayed the folding of the strata (Pueyo-Morer et al., 1997; Larrasoana et al., 2004; Weil and Yonkee, 2009; Rashid et al., 2015), the timing of the Lhasa-Qiangtang collision (the closure of the Bangong-Nujiang Ocean) could be even substantially earlier than ∼126 Ma. Our results are in line with those published in several recent palaeomagnetic studies (Yan et al., 2016; Bian et al., 2017; Ma et al., 2018; Meng et al., 2018; Cao et al., 2019). Moreover, other lines of evidence support this scenario: (a) The Lagongtang Formation (starting at ∼140 Ma) developed in a mature peripheral foreland basin in the Dingqing area. An abrupt transition in provenance and depositional environment is indicative of a response to the initial Lhasa-Qiangtang collision (Chen et al., 2020). (b) Angular unconformities and the accumulation of non-marine successions in the Bangong suture zone during the mid-Cretaceous are attributed to the Lhasa-Qiangtang collision (Zhu et al., 2016). (c) The 140–130 Ma magmatic activity gap in the Eastern Qiangtang Terrane suggests that the Lhasa-Qiangtang collision occurred during this period (Li et al., 2014; Zhu et al., 2016). (d) Studies on ophiolite, metamorphism, magmatism, lithostratigraphy and tectonism reveal that the closure of the Bangong-Nujiang Ocean terminated between the latest Jurassic and the Early Cretaceous (Li et al., 2019a, b). S-type granites are generally considered to have formed in syn-collisional or post-collisional environments after the subduction of the oceanic crust, indicating a continental collision orogenic stage. Thus, the geological evolution in the Zaduo area can be outlined as follows: the Lhasa Terrane collided with the Qiangtang Terrane during the Late Jurassic to Early Cretaceous, followed by the closure of the Bangong-Nujiang Ocean. The strata of the Middle-Upper Jurassic Yanshiping Group tilted during the convergence of the Lhasa and Qiangtang Terranes. In response to the Lhasa-Qiangtang collision, the granite intruded into the Yanshiping Group at ∼126 Ma and recorded a primary (or quasi-primary) magnetization during cooling; later, the region rotated clockwise in response to the India-Asia collision.
9 Conclusion
Granite plutons are widespread in Earth’s upper crust in various geodynamic settings and can acquire a stable remanent magnetization during formation. However, granites are less paleomagnetically investigated due to poor constraints on the paleohorizontal. We studied the Cretaceous granite that is outcropping in the Zaduo area, Eastern Qiangtang Terrane. Petrographic observations show that magnetite formed during the cooling of the intrusion and suffered minor further hydrothermal alteration, thus probably preserving a primary remanent magnetization. Rock magnetic analysis indicates magnetite as the main magnetic carrier. In particular, IRM-acquisition end-member modeling successfully assessed the veracity of the NRM residing in magnetite. EM1 does not reach saturation until 700 mT, which is interpreted as fine-grained magnetite and accounts for the GRM that occurred in some granite samples. EM2 saturates at 200–300 mT and dominates in other samples. The primary magnetization of the granite yields a ChRM direction in geographic coordinates: Dg = 2.6°, Ig = 38.6°, κ = 51.4, α95 = 2.1° (n = 92).
After tilt-correction via the bedding attitude of the Paleogene Tuotuohe Formation (Et), the sample-mean direction of the 92 samples is Ds = 12.1°, Is = 35.6°, κs = 43.7, α95 = 3.7°, corresponding to a paleopole at 67.1°N, 243.4°E with A9 5 = 2.9° and a paleolatitude of ∼12.5 ± 2.9°N. After tilt-correction via the bedding attitude of Middle-Upper Jurassic sandstones (Jq), the sample-mean direction of the 92 samples is Ds = 33.2°, Is = 58.4°, with κs = 46.4 and α95 = 3.0°, corresponding to a paleopole at 62.4°N, 161.9°E with A95 = 3.8° and a paleolatitude of ∼39.1° ± 3.8°N for the study area. Both assumptions appear to yield unrealistic paleolatitudes and are thus deemed improper, indicating that the target granite was tilted prior to the Paleogene deposition and/or the Jq sandstones were tilted to some degree before the intrusion of the granite. The expected declination (Ds-exp = 52.4°) and inclination (Is-exp = 53.0°) in stratigraphic coordinates can be obtained for our study area using the published paleopoles, yielding an expected bedding attitude of Strikeexp = 43.1° and Dipexp = 46.1° for the Jq strata in the southeast of the granite. There is a discrepancy of ∼20° between the expected and observed strike, and ∼10° between the expected and observed dip in the overlying Jq sandstones, which justifies that the Jq sandstones in the study area had been tilted prior to the intrusion of the granite. Given the frequent LSP during the early stages of deformation, we infer that the Lhasa-Qiangtang collision occurred before ∼126 Ma.
Data Availability Statement
The original contributions presented in the study are included in the article/Supplementary Material, further inquiries can be directed to the corresponding author.
Author Contributions
QF: Conceptualization, Methodology, Formal analysis, Writing–Review and Editing, Investigation. MY and MD: Conceptualization, Formal analysis, Investigation, Resources, Supervision. CG, RB, LY, WX, BL, MS, JZ, ZX: Investigation, Discussion, Writing–Review.
Funding
This work was co-supported by the Natural Science Foundation of China (Grant 41974080), the Basic Science Center for Tibetan Plateau Earth System (CTPES, Grant 41988101-01), the Natural Science Foundation of China (Grant 42164005), the Second Tibetan Plateau Scientific Expedition Program (Grant 2019QZKK0707), the Strategic Priority Research Program of Chinese Academy of Sciences (Grant XDA20070201), and the China Scholarship Council.
Conflict of Interest
The authors declare that the research was conducted in the absence of any commercial or financial relationships that could be construed as a potential conflict of interest.
Publisher’s Note
All claims expressed in this article are solely those of the authors and do not necessarily represent those of their affiliated organizations, or those of the publisher, the editors, and the reviewers. Any product that may be evaluated in this article, or claim that may be made by its manufacturer, is not guaranteed or endorsed by the publisher.
Acknowledgments
The authors thank Zhantao Feng, Ziqiang Mao for their assistance in the field and laboratory work. We sincerely thank Handling Editor Junsheng Nie, reviewers Tianshui Yang and Luis Manuel Alva Valdivia for their constructive comments and suggestions.
Supplementary Material
The Supplementary Material for this article can be found online at: https://www.frontiersin.org/articles/10.3389/feart.2022.829593/full#supplementary-material
References
Aben, F. M., Dekkers, M. J., Bakker, R. R., Van Hinsbergen, D. J. J., Zachariasse, W. J., Tate, G. W., et al. (2014). Untangling Inconsistent Magnetic Polarity Records through an Integrated Rock Magnetic Analysis: A Case Study on Neogene Sections in East Timor. Geochem. Geophys. Geosyst. 15, 2531–2554. doi:10.1002/2014gc005294
Bailey, S. W. (1984). “Structures of layer silicates,” in Structures of clay minerals and their X-ray identification. Editors G. W. Brindley, and G. Brown (London: Mineral Society), 1–124.
Bian, W., Yang, T., Ma, Y., Jin, J., Gao, F., Zhang, S., et al. (2017). New Early Cretaceous Palaeomagnetic and Geochronological Results from the Far Western Lhasa Terrane: Contributions to the Lhasa-Qiangtang Collision. Sci. Rep. 7, 16216. doi:10.1038/s41598-017-16482-3
Burnham, K. P., and Anderson, D. R. (2002). A Practical Information-Theoretic Approach. Model. Selection Multimodel Inference 2.
Cao, Y., Sun, Z., Li, H., Pei, J., Liu, D., Zhang, L., et al. (2019). New Paleomagnetic Results from Middle Jurassic Limestones of the Qiangtang Terrane, Tibet: Constraints on the Evolution of the Bangong-Nujiang Ocean. Tectonics 38, 215–232. doi:10.1029/2017tc004842
Cao, Y., Sun, Z., Li, H., Ye, X., Pan, J., Liu, D., et al. (2020). Paleomagnetism and U-Pb Geochronology of Early Cretaceous Volcanic Rocks from the Qiangtang Block, Tibetan Plateau: Implications for the Qiangtang-Lhasa Collision. Tectonophysics 789, 228500. doi:10.1016/j.tecto.2020.228500
Chen, S., Shi, R., Fan, W., Gong, X., and Wu, K. (2017a). Early Permian Mafic Dikes in the Nagqu Area, central Tibet, China, Associated with Embryonic Oceanic Crust of the Meso-Tethys Ocean. J. Geophys. Res. Solid Earth 122, 4172–4190. doi:10.1002/2016jb013693
Chen, W., Zhang, S., Ding, J., Zhang, J., Zhao, X., Zhu, L., et al. (2017b). Combined Paleomagnetic and Geochronological Study on Cretaceous Strata of the Qiangtang Terrane, central Tibet. Gondwana Res. 41, 373–389. doi:10.1016/j.gr.2015.07.004
Chen, Y., Cogné, J.-P., Courtillot, V., Tapponnier, P., and Zhu, X. Y. (1993). Cretaceous Paleomagnetic Results from Western Tibet and Tectonic Implications. J. Geophys. Res. 98, 17981–17999. doi:10.1029/93jb01006
Chen, Y., Ding, L., Li, Z., Laskowski, A. K., Li, J., Baral, U., et al. (2020). Provenance Analysis of Cretaceous Peripheral Foreland basin in central Tibet: Implications to Precise Timing on the Initial Lhasa-Qiangtang Collision. Tectonophysics 775, 228311. doi:10.1016/j.tecto.2019.228311
Cheng, X., Wu, H., Diao, Z., Wang, H., Zhang, X., Ma, L., et al. (2012). New Paleomagnetic Result of the Middle-Late Jurassic Rocks from Northern Qiangtang Block, West China. Chin. J. Geophys. 55, 3399–3409. doi:10.1007/s11430-011-4287-x
Dankers, P. H. M., and Zijderveld, J. D. A. (1981). Alternating Field Demagnetization of Rocks, and the Problem of Gyromagnetic Remanence. Earth Planet. Sci. Lett. 53, 89–92. doi:10.1016/0012-821x(81)90029-7
Deenen, M. H. L., Langereis, C. G., Van Hinsbergen, D. J. J., and Biggin, A. J. (2011). Geomagnetic Secular Variation and the Statistics of Palaeomagnetic Directions. Geophys. J. Int. 186, 509–520. doi:10.1111/j.1365-246x.2011.05050.x
Deenen, M. H. L., Langereis, C. G., Van Hinsbergen, D. J. J., and Biggin, A. J. (2014). Erratum: Geomagnetic Secular Variation and the Statistics of Palaeomagnetic Directions. Geophys. J. Int. 197, 643. doi:10.1093/gji/ggu021
Dekkers, M., and Pietersen, H. (2011). Magnetic Properties of Low-Ca Fly Ash: a Rapid Tool for Fe-Assesment and a Survey for Potentially Hazardous Elements. Mat. Res. Soc. Symp. Proc., 37–47.
Dekkers, M., and Pietersen, H. S. (1991). Magnetic Properties of Low-Ca Fly Ash: a Rapid Tool for Fe-Assessment and a Survey for Potentially Hazardous Elements. MRS Online Proc. Libr. (Opl) 245. doi:10.1557/proc-245-37
Dekkers, M. J. (2012). End-member Modelling as an Aid to Diagnose Remagnetization: A Brief Review. Geol. Soc. Lond. Spec. Publications 371, 253–269. doi:10.1144/sp371.12
Dewey, J. F., Shackleton, R. M., Chengfa, C., and Yiyin, S. (1988). The Tectonic Evolution of the Tibetan Plateau. Philosophical Trans. R. Soc. Lond. Ser. A, Math. Phys. Sci. 327, 379–413.
Dong, X., Wang, Z., Tan, C., Yang, H., Cheng, L., and Zhou, Y. (1990). New paleomagnetic results from Yadong-Golmud geoscience transect and a preliminary study on the model of terranes evolution in Qinghai-Xizang Plateau. Chin. Acad. Geol. Sci. 21, 139–148.
Dong, X., Wang, Z., Tan, C., Yang, H., Cheng, L., and Zhou, Y. (1991). New Results of Paleomagnetic Studies of the Qinghai-Tibetan Plateau. Geol. Rev. 37, 160–164.
Duan, Z., Liu, Q., Qin, H., Zhao, X., and Gao, X. (2020). Behavior of Greigite‐bearing marine Sediments during AF and thermal Demagnetization and its Significance. Geochem. Geophys. Geosystems 21, e2019GC008635. doi:10.1029/2019gc008635
Egli, R. (2004). Characterization of Individual Rock Magnetic Components by Analysis of Remanence Curves, 1. Unmixing Natural Sediments. Studia geophysica et geodaetica 48, 391–446. doi:10.1023/b:sgeg.0000020839.45304.6d
Egli, R., and Lowrie, W. (2002). Anhysteretic Remanent Magnetization of fine Magnetic Particles. J. Geophys. Res. Solid Earth 107, EPM 2-1-EPM 2-21. doi:10.1029/2001jb000671
Fan, J., Li, C., Liu, J., Wang, M., Liu, Y., and Xie, C. (2018a). The Middle Triassic Evolution of the Bangong-Nujiang Tethyan Ocean: Evidence from Analyses of OIB-type Basalts and OIB-Derived Phonolites in Northern Tibet. Int. J. Earth Sci. (Geol Rundsch) 107, 1755–1775. doi:10.1007/s00531-017-1570-x
Fan, J., Li, C., Wang, M., and Xie, C. (2018b). Reconstructing in Space and Time the Closure of the Middle and Western Segments of the Bangong-Nujiang Tethyan Ocean in the Tibetan Plateau. Int. J. Earth Sci. (Geol Rundsch) 107, 231–249. doi:10.1007/s00531-017-1487-4
Fan, J., Li, C., Xie, C., and Wang, M. (2014). Petrology, Geochemistry, and Geochronology of the Zhonggang Ocean Island, Northern Tibet: Implications for the Evolution of the Banggongco-Nujiang Oceanic Arm of the Neo-Tethys. Int. Geology. Rev. 56, 1504–1520. doi:10.1080/00206814.2014.947639
Fan, J., Li, C., Xie, C., Wang, M., and Chen, J. (2015). The Evolution of the Bangong-Nujiang Neo-Tethys Ocean: Evidence from Zircon U-Pb and Lu-Hf Isotopic Analyses of Early Cretaceous Oceanic Islands and Ophiolites. Tectonophysics 655, 27–40. doi:10.1016/j.tecto.2015.04.019
Fang, X., Song, C., Yan, M., Zan, J., Liu, C., Sha, J., et al. (2016). Mesozoic litho-and magneto-stratigraphic evidence from the central Tibetan Plateau for megamonsoon evolution and potential evaporites. Gondwana Res. 37, 110–129.
Fisher, R. (1953). Dispersion on a Sphere. Proc. R. Soc. A: Math. Phys. Eng. Sci. 217, 295–305. doi:10.1098/rspa.1953.0064
Fu, Q., Yan, M., Dekkers, M. J., Guan, C., Yu, L., Xu, W., et al. (2021). Remagnetization of the Jurassic Limestones in the Zaduo Area, Eastern Qiangtang Terrane (Tibetan Plateau, China): Implications for the India-Eurasia Collision. Geophys. J. Int. doi:10.1093/gji/ggab402
Fu, Y., Von Dobeneck, T., Franke, C., Heslop, D., and Kasten, S. (2008). Rock Magnetic Identification and Geochemical Process Models of Greigite Formation in Quaternary marine Sediments from the Gulf of Mexico (IODP Hole U1319A). Earth Planet. Sci. Lett. 275, 233–245. doi:10.1016/j.epsl.2008.07.034
Geiss, C. E., Umbanhowar, C. E., Camill, P., and Banerjee, S. K. (2003). Sediment Magnetic Properties Reveal Holocene Climate Change along the Minnesota Prairie-forest Ecotone. J. Paleolimnology 30, 151–166. doi:10.1023/a:1025574100319
Gong, Z., Dekkers, M. J., Heslop, D., and Mullender, T. A. T. (2009). End-member Modelling of Isothermal Remanent Magnetization (IRM) Acquisition Curves: a Novel Approach to Diagnose Remagnetization. Geophys. J. Int. 178, 693–701. doi:10.1111/j.1365-246x.2009.04220.x
Guan, C., Yan, M., Zhang, W., Zhang, D., Fu, Q., Yu, L., et al. (2021). Paleomagnetic and Chronologic Data Bearing on the Permian/Triassic Boundary Position of Qamdo in the Eastern Qiantang Terrane: Implications for the Closure of the Paleo‐Tethys. Geophys. Res. Lett. 48, e2020GL092059. doi:10.1029/2020gl092059
Heslop, D., and Dillon, M. (2007). Unmixing Magnetic Remanence Curves Withouta Prioriknowledge. Geophys. J. Int. 170, 556–566. doi:10.1111/j.1365-246x.2007.03432.x
Heslop, D., Mcintosh, G., and Dekkers, M. J. (2004). Using Time- and Temperature-dependent Preisach Models to Investigate the Limitations of Modelling Isothermal Remanent Magnetization Acquisition Curves with Cumulative Log Gaussian Functions. Geophys. J. Int. 157, 55–63. doi:10.1111/j.1365-246x.2004.02155.x
Hu, S., Appel, E., Hoffmann, V., Schmahl, W. W., and Wang, S. (1998). Gyromagnetic Remanence Acquired by Greigite (Fe3S4) during Static Three-axis Alternating Field Demagnetization. Geophys. J. Int. 134, 831–842. doi:10.1046/j.1365-246x.1998.00627.x
Hu, S., Stephenson, A., and Appel, E. (2002). A Study of Gyroremanent Magnetisation (GRM) and Rotational Remanent Magnetisation (RRM) Carried by Greigite from lake Sediments. Geophys. J. Int. 151, 469–474. doi:10.1046/j.1365-246x.2002.01793.x
Huang, K., Opdyke, N. D., Li, J., and Peng, X. (1992). Paleomagnetism of Cretaceous Rocks from Eastern Qiangtang Terrane of Tibet. J. Geophys. Res. 97, 1789–1799. doi:10.1029/91jb02747
Huang, W., Dupont-Nivet, G., Lippert, P. C., Van Hinsbergen, D. J. J., and Hallot, E. (2013). Inclination Shallowing in Eocene Linzizong Sedimentary Rocks from Southern Tibet: Correction, Possible Causes and Implications for Reconstructing the India-Asia Collision. Geophys. J. Int. 194, 1390–1411. doi:10.1093/gji/ggt188
Huang, W., Lippert, P. C., Jackson, M. J., Dekkers, M. J., Zhang, Y., Li, J., et al. (2017a). Remagnetization of the Paleogene Tibetan Himalayan Carbonate Rocks in the Gamba Area: Implications for Reconstructing the Lower Plate in the India-Asia Collision. J. Geophys. Res. Solid Earth 122, 808–825. doi:10.1002/2016jb013662
Huang, W., Lippert, P. C., Zhang, Y., Jackson, M. J., Dekkers, M. J., Li, J., et al. (2017b). Remagnetization of Carbonate Rocks in Southern Tibet: Perspectives from Rock Magnetic and Petrographic Investigations. J. Geophys. Res. Solid Earth 122, 2434–2456. doi:10.1002/2017jb013987
Huang, W., Van Hinsbergen, D. J. J., Dekkers, M. J., Garzanti, E., Dupont-Nivet, G., Lippert, P. C., et al. (2015). Paleolatitudes of the Tibetan Himalaya from Primary and Secondary Magnetizations of Jurassic to Lower Cretaceous Sedimentary Rocks. Geochem. Geophys. Geosyst. 16, 77–100. doi:10.1002/2014gc005624
Hunt, C. P., Moskowitz, B. M., and Banerjee, S. K. (1995). Magnetic Properties of Rocks and Minerals. Rock Phys. phase relations: A handbook Phys. constants 3, 189–204.
Kapp, P., Decelles, P. G., Gehrels, G. E., Heizler, M., and Ding, L. (2007). Geological Records of the Lhasa-Qiangtang and Indo-Asian Collisions in the Nima Area of central Tibet. Geol. Soc. America Bull. 119, 917–933. doi:10.1130/b26033.1
Kapp, P., Murphy, M. A., Yin, A., Harrison, T. M., Ding, L., and Guo, J. (2003). Mesozoic and Cenozoic Tectonic Evolution of the Shiquanhe Area of Western Tibet. Tectonics 22. doi:10.1029/2001tc001332
Kapp, P., Yin, A., Harrison, T. M., and Ding, L. (2005). Cretaceous-Tertiary Shortening, basin Development, and Volcanism in central Tibet. Geol. Soc. America Bull. 117, 865–878. doi:10.1130/b25595.1
Kent, D. V., and Opdyke, N. D. (1985). Multicomponent Magnetizations from the Mississippian Mauch Chunk Formation of the central Appalachians and Their Tectonic Implications. J. Geophys. Res. 90, 5371–5383. doi:10.1029/jb090ib07p05371
Kirschvink, J. L. (1980). The Least-Squares Line and Plane and the Analysis of Palaeomagnetic Data. Geophys. J. Int. 62, 699–718. doi:10.1111/j.1365-246x.1980.tb02601.x
Kruiver, P. P., Dekkers, M. J., and Heslop, D. (2001). Quantification of Magnetic Coercivity Components by the Analysis of Acquisition Curves of Isothermal Remanent Magnetisation. Earth Planet. Sci. Lett. 189, 269–276. doi:10.1016/s0012-821x(01)00367-3
Kruiver, P. P., and Passier, H. F. (2001). Coercivity Analysis of Magnetic Phases in Sapropel S1 Related to Variations in Redox Conditions, Including an Investigation of the S Ratio. Geochem. Geophys. Geosystems 2. doi:10.1029/2001gc000181
Larrasoaña, J. C., Pueyo, E. L., and Parés, J. M. (2004). An Integrated AMS, Structural, Palaeo- and Rock-Magnetic Study of Eocene marine Marls from the Jaca-Pamplona basin (Pyrenees, N Spain); New Insights into the Timing of Magnetic Fabric Acquisition in Weakly Deformed Mudrocks. Geol. Soc. Lond. Spec. Publications 238, 127–143. doi:10.1144/gsl.sp.2004.238.01.10
Li, C., Zhai, G., Wang, L., Yin, F., and Mao, X. (2009). An Important Window for Understanding the Qinghai–Tibet Plateau—A Review on Research Progress in Recent Years of Qiangtang Area, Tibet, China. Geol. Bull. China 28, 1169–1177.
Li, J., Qin, K., Li, G., Richards, J. P., Zhao, J.-X., and Cao, M.-J. (2014). Geochronology, Geochemistry, and Zircon Hf Isotopic Compositions of Mesozoic Intermediate-Felsic Intrusions in central Tibet: Petrogenetic and Tectonic Implications. Lithos 198-199, 77–91. doi:10.1016/j.lithos.2014.03.025
Li, S., Guilmette, C., Yin, C., Ding, L., Zhang, J., Wang, H., et al. (2019a). Timing and Mechanism of Bangong-Nujiang Ophiolite Emplacement in the Gerze Area of central Tibet. Gondwana Res. 71, 179–193. doi:10.1016/j.gr.2019.01.019
Li, S., Yin, C., Guilmette, C., Ding, L., and Zhang, J. (2019b). Birth and Demise of the Bangong-Nujiang Tethyan Ocean: A Review from the Gerze Area of central Tibet. Earth-Science Rev. 198, 102907. doi:10.1016/j.earscirev.2019.102907
Li, Z., Ding, L., Lippert, P. C., Song, P., Yue, Y., and Van Hinsbergen, D. J. J. (2016). Paleomagnetic Constraints on the Mesozoic Drift of the Lhasa Terrane (Tibet) from Gondwana to Eurasia. Geology 44, 727–730. doi:10.1130/g38030.1
Lin, J., and Watts, D. (1988). Palaeomagnetic Constraints on Himalayan-Tibetan Tectonic Evolution. Philosophical Trans. R. Soc. Lond. Ser. A, Math. Phys. Sci. 326, 177–188.
Liu, D., Huang, Q., Fan, S., Zhang, L., Shi, R., and Ding, L. (2014). Subduction of the Bangong-Nujiang Ocean: Constraints from Granites in the Bangong Co Area, Tibet. Geol. J. 49, 188–206. doi:10.1002/gj.2510
Lowrie, W. (1990). Identification of Ferromagnetic Minerals in a Rock by Coercivity and Unblocking Temperature Properties. Geophys. Res. Lett. 17, 159–162. doi:10.1029/gl017i002p00159
Ma, A., Hu, X., Garzanti, E., Han, Z., and Lai, W. (2017). Sedimentary and Tectonic Evolution of the Southern Qiangtang basin: Implications for the Lhasa-Qiangtang Collision Timing. J. Geophys. Res. Solid Earth 122, 4790–4813. doi:10.1002/2017jb014211
Ma, Y., Yang, T., Bian, W., Jin, J., Wang, Q., Zhang, S., et al. (2018). A Stable Southern Margin of Asia during the Cretaceous: Paleomagnetic Constraints on the Lhasa-Qiangtang Collision and the Maximum Width of the Neo-Tethys. Tectonics 37, 3853–3876. doi:10.1029/2018tc005143
Meijers, M. J. M., Van Hinsbergen, D. J. J., Dekkers, M. J., Altıner, D., Kaymakcı, N., and Langereis, C. G. (2011). Pervasive Palaeogene Remagnetization of the central Taurides Fold-And-Thrust belt (Southern Turkey) and Implications for Rotations in the Isparta Angle. Geophys. J. Int. 184, 1090–1112. doi:10.1111/j.1365-246x.2010.04919.x
Meng, J., Zhao, X., Wang, C., Liu, H., Li, Y., Han, Z., et al. (2018). Palaeomagnetism and Detrital Zircon U-Pb Geochronology of Cretaceous Redbeds from central Tibet and Tectonic Implications. Geol. J. 53, 2315–2333. doi:10.1002/gj.3070
Metcalfe, I. (2011). Tectonic Framework and Phanerozoic Evolution of Sundaland. Gondwana Res. 19, 3–21. doi:10.1016/j.gr.2010.02.016
Metcalfe, I. (2013). Gondwana Dispersion and Asian Accretion: Tectonic and Palaeogeographic Evolution of Eastern Tethys. J. Asian Earth Sci. 66, 1–33. doi:10.1016/j.jseaes.2012.12.020
Mullender, T. A. T., Velzen, A. J., and Dekkers, M. J. (1993). Continuous Drift Correction and Separate Identification of Ferrimagnetic and Paramagnetic Contributions in Thermomagnetic Runs. Geophys. J. Int. 114, 663–672. doi:10.1111/j.1365-246x.1993.tb06995.x
Mullender, T. A. T., Frederichs, T., Hilgenfeldt, C., De Groot, L. V., Fabian, K., and Dekkers, M. J. (2016). Automated Paleomagnetic and Rock Magnetic Data Acquisition with an In-Line Horizontal "2G" System. Geochem. Geophys. Geosyst. 17, 3546–3559. doi:10.1002/2016gc006436
Nédélec, A., Trindade, R., Peschler, A., Archanjo, C., Macouin, M., Poitrasson, F., et al. (2015). Hydrothermally-induced Changes in Mineralogy and Magnetic Properties of Oxidized A-type Granites. Lithos 212-215, 145–157. doi:10.1016/j.lithos.2014.11.007
Otofuji, Y., Inoue, Y., Funahara, S., Murata, F., and Zheng, X. (1990). Palaeomagnetic Study of Eastern Tibet-Deformation of the Three Rivers Region. Geophys. J. Int. 103, 85–94. doi:10.1111/j.1365-246x.1990.tb01754.x
Özdemir, Ö., and Dunlop, D. J. (1997). Effect of crystal Defects and Internal Stress on the Domain Structure and Magnetic Properties of Magnetite. J. Geophys. Res. 102, 20211–20224. doi:10.1029/97jb01779
Pan, G., Ding, J., Yao, D., and Wang, L. (2004). Guidebook of 1: 1,500,000 geologic map of the Qinghai–Xizang (Tibet) plateau and adjacent areas. Chengdu, China: Chengdu Cartographic Publishing House 48.
Pueyo-Morer, E. L., Millán-Garrido, H., Pocoví-Juan, A., and Parés, J. M. (1997). Determination of the folding mechanism by AMS data. Study of the relation between shortening and magnetic anisotropy in the Pico del Aguila anticline (southern Pyrenees). Phys. Chem. Earth 22, 195–201. doi:10.1016/s0079-1946(97)00102-x
QGSI (2005). Geological Map (1:250000) of the People’s Republic of China-Zaduo County Sheet, China. University of Geosciences Press.
QGSI (2014). 1:250000 Geological Survey Report of the People’s Republic of China-Zaduo County Sheet, China. University of Geosciences Press.
Ran, B., Deng, B., Wang, C., Zhao, X., Li, Y., Zhang, Y., et al. (2017). Kinematics of the Crust Around the Tanggula Shan in North-Central Tibet: Constraints from Paleomagnetic Data. Gondwana Res. 48, 124–133. doi:10.1016/j.gr.2017.04.017
Rashid, H., Cifelli, F., and Mattei, M. (2015). Late Folding-Related Magnetic Foliation in the Active Ferdows (Northeastern Iran) Thrust-fold System. J. Asian Earth Sci. 108, 48–57. doi:10.1016/j.jseaes.2015.04.023
Ren, H., Yan, M., Meng, Q., Song, C., and Fang, X. (2013). E/I" Corrected Paleomagnetic Inclination Indicates 1 000 Km NS Shortening of the Qiangtang Terrane since the Middle Jurassic. Chin. J. Geology. 48, 543–556.
Roperch, P., and Taylor, G. K. (1986). The Importance of Gyromagnetic Remanence in Alternating Field Demagnetization. Some New Data and Experiments on G.R.M. And R.R.M. Geophys. J. Int. 87, 949–965. doi:10.1111/j.1365-246x.1986.tb01978.x
Sagnotti, L., and Winkler, A. (1999). Rock Magnetism and Palaeomagnetism of Greigite-Bearing Mudstones in the Italian peninsula. Earth Planet. Sci. Lett. 165, 67–80. doi:10.1016/s0012-821x(98)00248-9
Snowball, I. F. (1997a). The Detection of Single-Domain Greigite (Fe3S4) Using Rotational Remanent Magnetization (RRM) and the Effective Gyro Field (Bg): mineral Magnetic and Palaeomagnetic Applications. Geophys. J. Int. 130, 704–716. doi:10.1111/j.1365-246x.1997.tb01865.x
Snowball, I. F. (1997b). Gyroremanent Magnetization and the Magnetic Properties of Greigite-Bearing Clays in Southern Sweden. Geophys. J. Int. 129, 624–636. doi:10.1111/j.1365-246x.1997.tb04498.x
Song, C., Wang, J., Fu, X., Feng, X., Chen, M., and He, L. (2012). Late Triassic Paleomagnetic Data from the Qiangtang Terrane of Tibetan Plateau and Their Tectonic Significances. J. Jilin Univ. (Earth Sci. Edition) 42, 241–250.
Song, P., Ding, L., Li, Z., Lippert, P. C., Yang, T., Zhao, X., et al. (2015). Late Triassic Paleolatitude of the Qiangtang Block: Implications for the Closure of the Paleo-Tethys Ocean. Earth Planet. Sci. Lett. 424, 69–83. doi:10.1016/j.epsl.2015.05.020
Song, P., Ding, L., Lippert, P. C., Li, Z., Zhang, L., and Xie, J. (2020). Paleomagnetism of Middle Triassic Lavas from Northern Qiangtang (Tibet): Constraints on the Closure of the Paleo‐Tethys Ocean. J. Geophys. Res. Solid Earth 125, e2019JB017804. doi:10.1029/2019jb017804
Stephenson, A. (1980a). Gyromagnetism and the Remanence Acquired by a Rotating Rock in an Alternating Field. Nature 284, 48–49. doi:10.1038/284048a0
Stephenson, A. (1980b). A Gyroremanent Magnetisation in Anisotropic Magnetic Material. Nature 284, 49–51. doi:10.1038/284049a0
Stephenson, A. (1993). Three-axis Static Alternating Field Demagnetization of Rocks and the Identification of Natural Remanent Magnetization, Gyroremanent Magnetization, and Anisotropy. J. Geophys. Res. Solid Earth 98, 373–381.
Stephenson, A., and Snowball, I. F. (2001). A Large Gyromagnetic Effect in Greigite. Geophys. J. Int. 145, 570–575. doi:10.1046/j.0956-540x.2001.01434.x
STRGSQ (1988). 1:200000 Geological Survey Report of the People’s Republic of China-Zaduo County Sheet, China. China Geological Map Press.
Tapponnier, P., Zhiqin, X., Roger, F., Meyer, B., Arnaud, N., Wittlinger, G., et al. (2001). Oblique Stepwise Rise and Growth of the Tibet Plateau. science 294, 1671–1677. doi:10.1126/science.105978
Tauxe, L., Mullender, T. A. T., and Pick, T. (1996). Potbellies, Wasp-Waists, and Superparamagnetism in Magnetic Hysteresis. J. Geophys. Res. 101, 571–583. doi:10.1029/95jb03041
Tong, Y., Yang, Z., Gao, L., Wang, H., Zhang, X., An, C.-Z., et al. (2015). Paleomagnetism of Upper Cretaceous Red-Beds from the Eastern Qiangtang Block: Clockwise Rotations and Latitudinal Translation during the India-Asia Collision. J. Asian Earth Sci. 114, 732–749. doi:10.1016/j.jseaes.2015.08.016
Van Hinsbergen, D. J. J., Kaymakci, N., Spakman, W., and Torsvik, T. H. (2010). Reconciling the Geological History of Western Turkey with Plate Circuits and Mantle Tomography. Earth Planet. Sci. Lett. 297, 674–686. doi:10.1016/j.epsl.2010.07.024
Weil, A. B., and Yonkee, A. (2009). Anisotropy of Magnetic Susceptibility in Weakly Deformed Red Beds from the Wyoming Salient, Sevier Thrust belt: Relations to Layer-Parallel Shortening and Orogenic Curvature. Lithosphere 1, 235–256. doi:10.1130/l42.1
Xu, R., Schärer, U., and Allègre, C. J. (1985). Magmatism and Metamorphism in the Lhasa Block (Tibet): a Geochronological Study. J. Geology. 93, 41–57. doi:10.1086/628918
Yan, M., Zhang, D., Fang, X., Ren, H., Zhang, W., Zan, J., et al. (2016). Paleomagnetic Data Bearing on the Mesozoic Deformation of the Qiangtang Block: Implications for the Evolution of the Paleo- and Meso-Tethys. Gondwana Res. 39, 292–316. doi:10.1016/j.gr.2016.01.012
Yin, A., and Harrison, T. M. (2000). Geologic Evolution of the Himalayan-Tibetan Orogen. Annu. Rev. Earth Planet. Sci. 28, 211–280. doi:10.1146/annurev.earth.28.1.211
Zhang, K., Zhang, Y., Tang, X., and Xia, B. (2012). Late Mesozoic Tectonic Evolution and Growth of the Tibetan Plateau Prior to the Indo-Asian Collision. Earth-Science Rev. 114, 236–249. doi:10.1016/j.earscirev.2012.06.001
Zhang, Y., Li, Z., Zhu, L., Zhang, K., Yang, W., and Jin, X. (2016). Newly Discovered Eclogites from the Bangong Meso-Tethyan Suture Zone (Gaize, central Tibet, Western China): Mineralogy, Geochemistry, Geochronology, and Tectonic Implications. Int. Geology. Rev. 58, 574–587. doi:10.1080/00206814.2015.1096215
Zhou, Y., Cheng, X., Wu, Y., Kravchinsky, V., Shao, R., Zhang, W., et al. (2019). The Northern Qiangtang Block Rapid Drift during the Triassic Period: Paleomagnetic Evidence. Geosci. Front. 10, 2313–2327. doi:10.1016/j.gsf.2019.05.003
Zhu, D., Li, S., Cawood, P. A., Wang, Q., Zhao, Z., Liu, S., et al. (2016). Assembly of the Lhasa and Qiangtang Terranes in central Tibet by Divergent Double Subduction. Lithos 245, 7–17. doi:10.1016/j.lithos.2015.06.023
Zhu, D., Zhao, Z., Niu, Y., Dilek, Y., Hou, Z., and Mo, X. (2013). The Origin and Pre-cenozoic Evolution of the Tibetan Plateau. Gondwana Res. 23, 1429–1454. doi:10.1016/j.gr.2012.02.002
Zhu, D., Zhao, Z., Niu, Y., Mo, X., Chung, S., Hou, Z., et al. (2011). The Lhasa Terrane: Record of a Microcontinent and its Histories of Drift and Growth. Earth Planet. Sci. Lett. 301, 241–255. doi:10.1016/j.epsl.2010.11.005
Zhu, D., Pan, G., Mo, X., Wang, L., Zhao, Z., Liao, Z., et al. (2006). Identification for the Mesozoic OIB-type Basalts in central Qinghai-Tibetan Plateau: Geochronology, Geochemistry and Their Tectonic Setting. Acta Geologica Sinica 80, 1312–1328.
Keywords: paleomagnetism, Lhasa-Qiangtang collision, cretaceous granite, end-member modeling, Tibeten Plateau
Citation: Fu Q, Yan M, Dekkers MJ, Guan C, de Boer RA, Yu L, Xu W, Li B, Shen M, Zhang J and Xu Z (2022) The Early Cretaceous Zaduo Granite, Eastern Qiangtang Terrane (China)—An Attempt to Constrain its Paleolatitude and Tectonic Implications. Front. Earth Sci. 10:829593. doi: 10.3389/feart.2022.829593
Received: 06 December 2021; Accepted: 14 January 2022;
Published: 10 February 2022.
Edited by:
Junsheng Nie, Lanzhou University, ChinaReviewed by:
Tianshui Yang, China University of Geosciences, ChinaLuis Manuel Alva Valdivia, National Autonomous University of Mexico, Mexico
Copyright © 2022 Fu, Yan, Dekkers, Guan, de Boer, Yu, Xu, Li, Shen, Zhang and Xu. This is an open-access article distributed under the terms of the Creative Commons Attribution License (CC BY). The use, distribution or reproduction in other forums is permitted, provided the original author(s) and the copyright owner(s) are credited and that the original publication in this journal is cited, in accordance with accepted academic practice. No use, distribution or reproduction is permitted which does not comply with these terms.
*Correspondence: Maodu Yan, bWFvZHV5YW5AaXRwY2FzLmFjLmNu