 Ke Cheng1,2
 Qi Wu
Qi Wu
94% of researchers rate our articles as excellent or good
Learn more about the work of our research integrity team to safeguard the quality of each article we publish.
Find out more
ORIGINAL RESEARCH article
Front. Earth Sci., 25 January 2023
Sec. Geohazards and Georisks
Volume 10 - 2022 | https://doi.org/10.3389/feart.2022.1076098
Sand-gravel mixtures are special engineering geological materials between soils and fractured rocks. This study performs a series of bending element tests to systematically investigate the shear wave velocity (Vs) of the sand-gravel mixtures, establish an effective evaluation method, and assess the influence of relative density and effective confining pressure on mixtures with a wide range of gravel contents. The results showed that the shear wave velocity increases and then decreases with the increase in gravel content and increases with the rise in relative density and effective confining pressure. Furthermore, a shear wave velocity prediction model is proposed in this study based on the intergranular contact state theory, including the stress parameter (n) and skeleton void ratio. The stress parameter can be described by a power function considering the uniformity coefficient. The model serves as a reference guide for estimating the shear wave velocity of sand-gravel mixtures with a wide range of gravel contents.
Sand-gravel mixtures are special engineering geological materials between soils and fractured rocks, and the intergranular contact state of sand-gravel mixtures is the intermediate state between that of sand and gravel particles (Evans and Zhou, 1995; Yagiz, 2001; Lin et al., 2004; Hamidi et al., 2009). The sand-gravel mixtures with the advantages of low compressibility, high shear strength, abundant reserves, and convenient and economical extraction are widely used in highway roads, Earth and rock dams, soft ground treatments, artificial island buildings, offshore immersed tunnel mat foundations, etc., (Hara et al., 2004; Araei et al., 2012; Flora et al., 2012; Chang and Phantachang, 2016). The shear wave velocity (Vs) and associated small-strain (or maximum) shear modulus (Gmax) play fundamental roles in soil deformation prediction, seismic liquefaction potential assessment, site response analyses, and the design of geotechnical structures subjected to dynamic or earthquake loadings (Andrus and Stokoe, 2000; Wang et al., 2012; Chen et al., 2019a). Simultaneously, the mechanical response of granular materials during scouring and erosion is an essential property that scholars have widely studied (Kuhnle et al., 2016; Pandey et al., 2019a; 2019b, 2020; de Leeuw et al., 2019). In this paper, the dynamic properties of sand-gravel mixtures are investigated from the view of Vs in laboratory tests aiming to establish a prediction method as a reference guide for geotechnical engineering.
Rollins et al. (1998) found that for a given void ratio (e) and effective confining pressure
Many methods are available for measuring soil Vs, such as the up-hole method, down-hole method, cross-hole method, indoor resonance column test, and bending element test method. (Wichtmann et al., 2015). The bending element test has been widely used in measuring Vs or Gmax of various soils due to its simple principle, convenient operation, and non-destructive detection (Rahman et al., 2014; Yang and Liu, 2016).
This paper performs a series of bender element tests to study the Vs of the sand-gravel mixtures with a wider range of Gc in this study than that in previous studies. Within the study context, the effects of gravel content, relative density, and effective confining pressure are considered. Finally, a Vs prediction model of various mixed soil materials is proposed based on intergranular contact state theory. The applicability of the proposed model is validated using the published data of two types of coarse and fine granular mixtures.
The tested sand-gravel mixture was obtained from Nanjing, China. The gravel grains of the mixture are prismatic. The mixture’s gravel content (Gc) is 0%, 10%, 20%, 30%, 40%, 50%, 60%, 70%, 80%, 90%, and 100%. The particle size distribution curves of various sand-gravel mixtures are shown in Figure 1. The basic properties of the mixtures are listed in Table 1. The mixtures’ particle size distribution curves and basic properties were measured according to the ASTM D4254-14, 2006 and ASTM D4254-16, 2006.
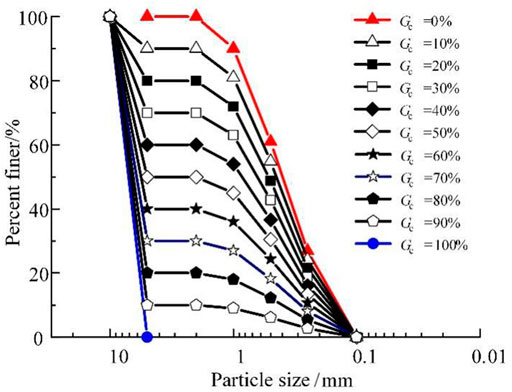
FIGURE 1. Particle size distribution curves of the tested sand-gravel mixtures.
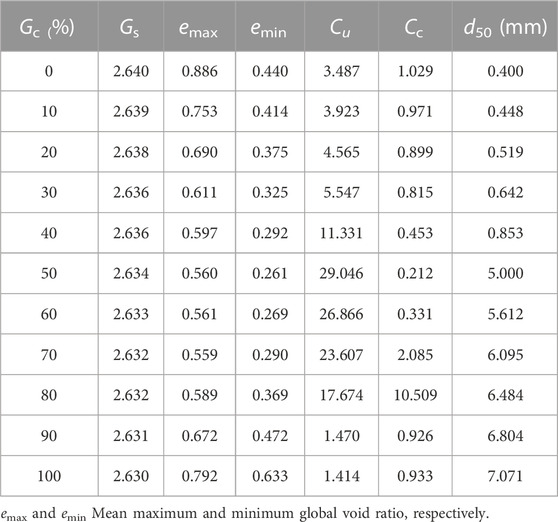
TABLE 1. Basic properties of the tested sand-gravel mixtures.
As shown in Table 1, the emax and emin of the mixtures both decrease and then increase with the rise in Gc, which is consistent with the findings of Evans and Zhou., (1995) and Amini and Chakravrty, 2004. In addition, the emax and emin reach the minimum value at Gc equals 50%.
The measurement of shear wave velocity (Vs) and associated Gmax was implemented using a pair of piezoceramic bender elements installed in the GCTS HCA-300 dynamic hollow cylinder-TSH testing system (Chen et al., 2019b). The test apparatus is shown in Figure 2. The confining and back pressure were measured using the standard pressure/volume controller. The axial static and dynamic force was controlled independently. Moreover, the maximum range of the dynamic force is 10 kN/5 Hz. The axial force and displacement sensors were placed at the top of the sample. Back pressure was applied at the top of the sample, and the excess pore water pressure was measured its bottom. Hardin and Black (1966), Goudarzy et al. (2016) detailed the testing principle of the bender element system.
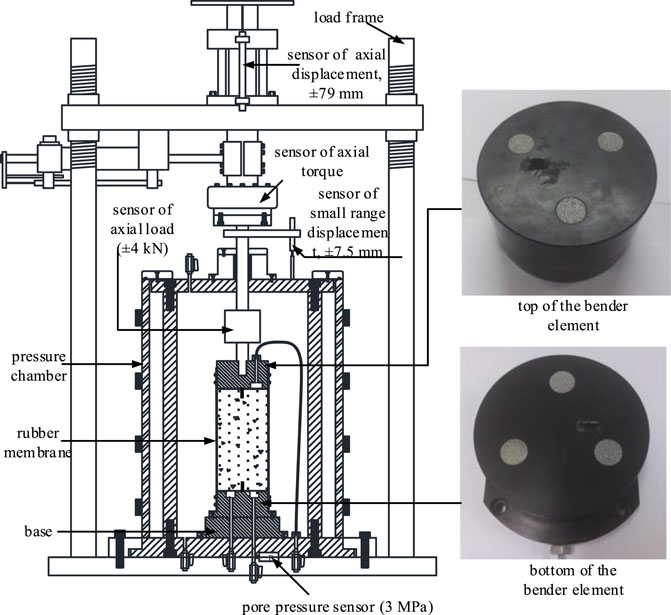
FIGURE 2. Bender element test apparatus.
The Vs is calculated via Eq. 1:
where d is the effective distance of the shear wave propagation, and t is the time of the shear wave propagation.
The time domain method was used to determine t considering the simplicity and accuracy. Figure 3 shows the typical time histories of output signals from bender element tests, revealing that the received signals are always clear and efficient.
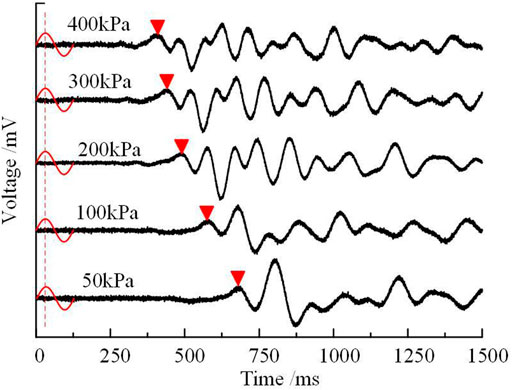
FIGURE 3. Typical time histories of output signals obtained from the bender element tests.
The cylindrical specimen has a diameter of 100 mm and a height of 150 mm. The specimen was prepared using a dry tamping method. This technique was adopted in several research works to test granular material. On the other hand, the well-mixed sand and grains were tamped into a cylindrical specimen creator for four layers in the apparatus using a dry tamping method. The pre-saturation was conducted after the specimen preparation. The pre-saturation consists of three steps: 1) permeating the specimen with CO2 for 30 min; 2) flushing with de-aired water for 60 min; 3) flushing all water lines. After the pre-saturation, the back pressure saturation was initiated. Back pressure was gradually applied, and the Skempton B-value was checked until exceeding 0.95, which guaranteed the saturation of the tested sample. The saturated sample was consolidated under an effective target confining pressure until the strain was stable. After that, the bender element was conducted.
A series of bender element tests was conducted to study the Vs of the sand-gravel mixtures. The influence of relative density (Dr), effective confining pressure (
The relationship between the normalized effective confining pressure
where A is the shear wave velocity value of the mixture when the
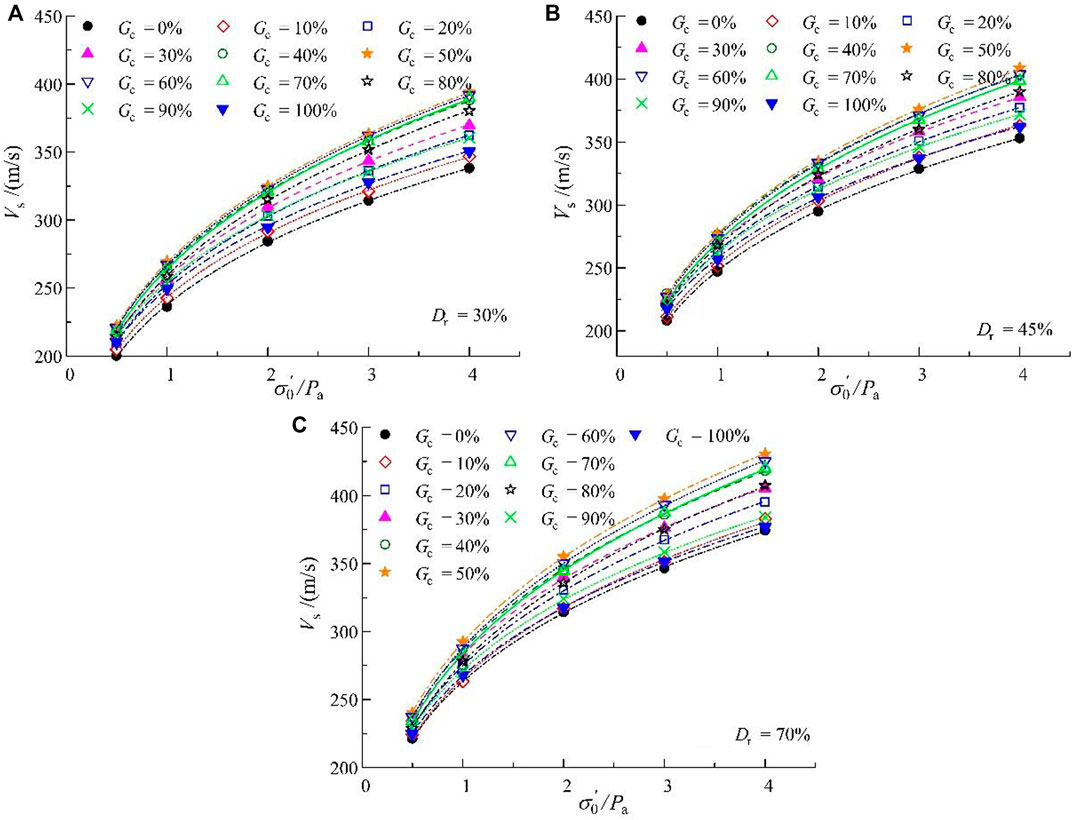
FIGURE 4. Relationship between the normalized effective confining pressure and Vs of the sand-gravel mixtures: (A) Dr = 30% (B) Dr = 45% (C) Dr = 70%.
The relationship between the fit coefficient n and coefficients of uniformity (Cu) for the mixtures is shown in Figure 5. It can be seen that the n increases with the increase in Cu. The relationship between the n and Cu can be described by Eq. 3:
where M and N are the best-fit coefficients, which for the sand-gravel mixture of this test are defined as M is 0.24, and N is 0.04. The goodness of fit (R2) for this equation is 0.95.
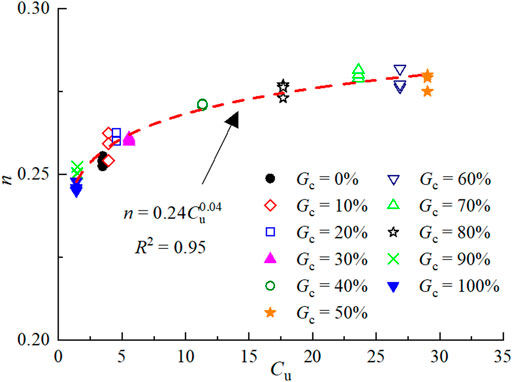
FIGURE 5. Relationship between the fit coefficient n and coefficient of uniformity.
The relationship between the normalized shear wave velocity,
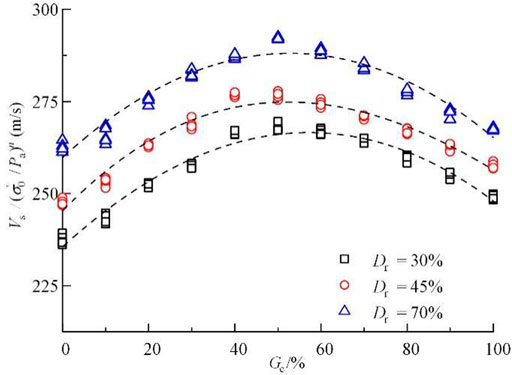
FIGURE 6. Relationship between the normalized shear wave velocity and the Gc of the mixtures.
The relationship between the
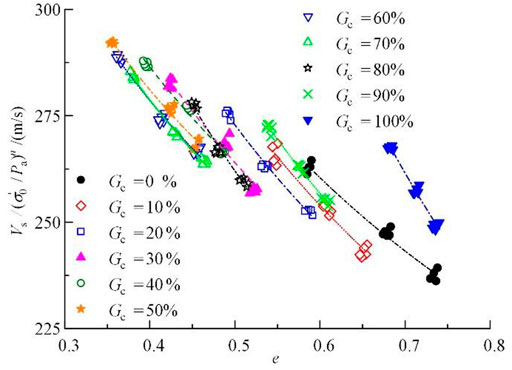
FIGURE 7. Relationship between the normalized shear wave velocity and e of the mixtures.
Sand-gravel mixture is composed of coarse gravel grain and fine sand particles, which is a fine-coarse grained mixture. Microstructural changes can affect the macro mechanical properties (Bai et al., 2019; Bai et al., 2021; Bai et al., 2022). The sand-gravel mixture’s force skeleton depends on the sand and gravel content, and the part that fills the void is invalid for the force skeleton. The force skeleton is composed of coarse gravel grain when the Gc is larger than Gcth. However, the force skeleton is composed of fine sand particles when the Gc is smaller than Gcth. The skeleton void ratio (esk) is defined as the volumetric ratio between the voids formed in the sand-gravel mixture skeleton and the volume of particles that make up the skeleton (Chang et al., 2014). This is used to describe the dense state of the fine-coarse-grained mixture. Thevanayagam (2007a, 2007b) proposed a binary intergranular contact theory of the fine-coarse-grained mixture and believed the particle contact state is divided into two types. The intergranular contact state of the sand-gravel mixture is shown in Figure 8.
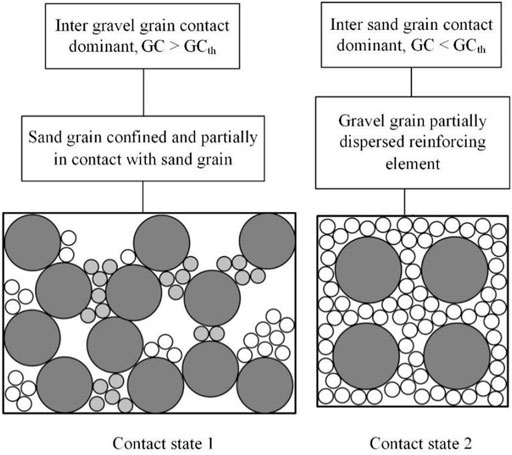
FIGURE 8. Intergranular contact states of the mixtures.
The esk is calculated using Eqs 4, 5 when the intergranular contact state of the sand-gravel mixtures is in contact states 1 and 2, respectively. Rd is the average grain size ratio, which is the ratio of d50-g and d50-s. The d50-g is the average size of the gravel, and d50-s is the average size of the sand. b is the sand’s influence index, which ranges from 0 to 1. The sand particle is invalid for the force skeleton of the sand-gravel mixture when b is 0. Furthermore, the sand particles can be used in the force skeleton when b is 1. m is the gravel’s influence index that ranges from 0 to 1. The b and m can be determined using a back-fitting analysis (Thevanayagam, , ).
The relationship between the
where A2 and B2 are the best-fit parameters determined as A2 is 210.29, B2 is -0.41 when the Gc is smaller than Gcth, and A2 is 216.48, and B2 is -0.53 when the Gc is larger than Gcth.
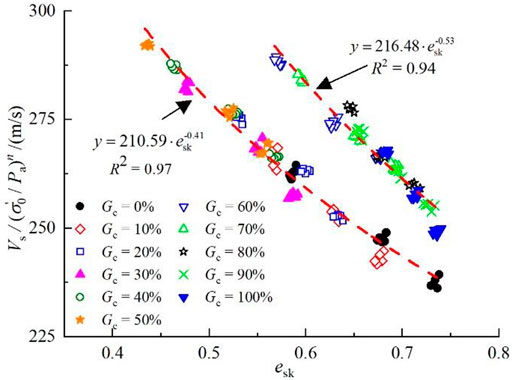
FIGURE 9. Relationship between the normalized shear wave velocity and esk of the mixtures.
A series of bending element tests were conducted by Choo and Burns (2015) and Oka et al. (2018) to investigate the effects of fine granular content (FC) on Vs of coarse and fine granular mixtures. In this section, test data published in the previous literature were used to further verify the applicability of Eq. 6 for two types of coarse and fine granular mixtures. The Vs versus esk curves for two types of coarse and fine granular mixtures are shown in Figure 10. It can be clearly observed that esk can normalize Vs, indicating that it is reasonable for esk to Vs of coarse and fine granular mixtures.
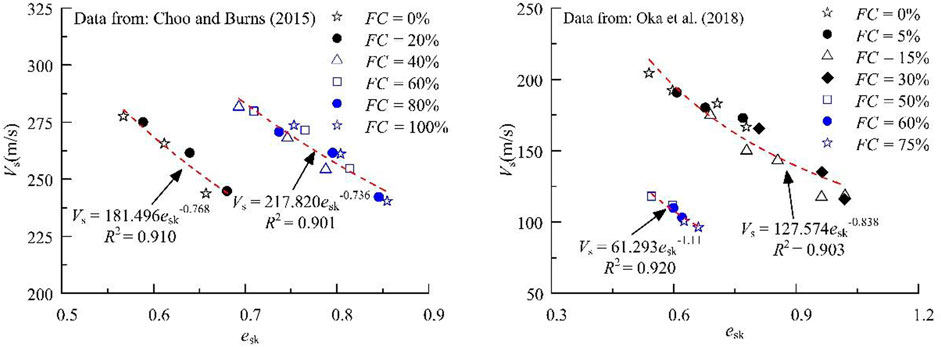
FIGURE 10. Relationship between Vs and esk for two types of coarse and fine granular mixtures obtained from the literature.
In this paper, a series of bending element tests are conducted to investigate the shear wave velocity Vs of the sand-gravel mixtures. Sand as the base soil and different contents of gravel are considered in the testing program. Moreover, bending element tests are performed at three relative densities of 30%, 45%, and 70% under an effective confining pressure of 50, 100, 200, 300, and 400 kPa.
Results of the tests illustrate that for a given Dr and
The e is not a reasonable parameter to describe the dense state of the sand-gravel mixtures. A new Vs prediction model is proposed based on intergranular contact state theory, including the skeleton void ratio esk. The
The original contributions presented in the study are included in the article/supplementary material, further inquiries can be directed to the corresponding author.
KC: Conceptualization, Methodology, Writing—original draft, Funding acquisition. HW: Data curation, Visualization. YF: Conceptualization, Writing—review and editing, Supervision. QW: Writing—review and editing, Funding acquisition.
This work is supported by the Natural Science Foundation of China (Grant No. 52208351), the Scientific and Technological Projects of Henan Province (Grant No. 222102320296), and the Start-Up Foundation of the Nanyang Institute of Technology (Grant No. NGBJ-2020-08).
The authors declare that the research was conducted in the absence of any commercial or financial relationships that could be construed as a potential conflict of interest.
All claims expressed in this article are solely those of the authors and do not necessarily represent those of their affiliated organizations, or those of the publisher, the editors and the reviewers. Any product that may be evaluated in this article, or claim that may be made by its manufacturer, is not guaranteed or endorsed by the publisher.
Amini, F., and Chakravrty, A. (2004). Liquefaction testing of layered sand-gravel composites. Geotechnical Test. J. 27 (1), 36–46.
Andrus, R. D., and Stokoe, K. H. (2000). Liquefaction resistance of soils from shear-wave velocity. J. Geotech. Geoenviron. Eng. 126 (11), 1015–1025. doi:10.1061/(asce)1090-0241(2000)126:11(1015)
Araei, A. A., Soroush, A., Tabatabaei, S. H., and Ghalandarzadeh, A. (2012). Consolidated undrained behavior of gravelly materials. Sci. Iran. 19 (6), 1391–1410. doi:10.1016/j.scient.2012.09.011
ASTM D4253-16 (2006). Standard test methods for maximum index density and unit weight of soils using a vibratory table. Annu. Book ASTM Stand. 19, e782.
ASTM D4254-14 (2006). Standard test methods for minimum index density and unit weight of soils and calculation of relative density. Annu. Book ASTM Stand. 45, 322.
Bai, B., Wang, Y., Rao, D. Y., and Bai, F. (2022). The effective thermal conductivity of unsaturated porous media deduced by pore-scale SPH simulation. Front. Earth Sci. (Lausanne). 10, 943853. doi:10.3389/feart.2022.943853
Bai, B., Yang, G. C., Li, T., and Yang, G. S. (2019). A thermodynamic constitutive model with temperature effect based on particle rearrangement for geomaterials. Mech. Mater. 139, 103180. doi:10.1016/j.mechmat.2019.103180
Bai, B., Zhou, R., Cai, G. P., Hu, W., and Yang, G. C. (2021). Coupled thermo-hydro-mechanical mechanism in view of the soil particle rearrangement of granular thermodynamics. Comput. Geotechnics 137 (8), 104272. doi:10.1016/j.compgeo.2021.104272
Chang, W. J., Chang, C. W., and Zeng, J. K. (2014). Liquefaction characteristics of gap-graded gravelly soils in K0 condition. Soil Dyn. Earthq. Eng. 56, 74–85. doi:10.1016/j.soildyn.2013.10.005
Chang, W. J., and Phantachang, T. (2016). Effects of gravel content on shear resistance of gravelly soils. Eng. Geol. 207, 78–90. doi:10.1016/j.enggeo.2016.04.015
Chen, G. X., Kong, M. Y., Khoshnevisan, S., Chen, W. Y., and Li, X. J. (2019a). Calibration of Vs-based empirical models for assessing soil liquefaction potential using expanded database. Bull. Eng. Geol. Environ. 78 (2), 945–957. doi:10.1007/s10064-017-1146-9
Chen, G. X., Zhao, D. F., Chen, W. Y., and Juang, C. H. (2019b). Excess pore water pressure generation in cyclic undrained testing. J. Geotech. Geoenviron. Eng. 145 (7), 04019022. doi:10.1061/(asce)gt.1943-5606.0002057
Choo, H., and Burns, S. E. (2015). Shear wave velocity of granular mixtures of silica particles as a function of finer fraction, size ratios and void ratios. Granul. Matter 17, 567–578. doi:10.1007/s10035-015-0580-2
De Leeuw, J., Lamb, M. P., Parker, G., Moodie, A., Haught, D., Venditti, J. G., et al. (2019). Entrainment and suspension of sand and gravel. Earth Surf. Dynam. 8 (2), 485–504. doi:10.5194/esurf-8-485-2020
Evans, M. D., and Zhou, S. (1995). Liquefaction behavior of sand-gravel composites. J. Geotech. Engrg. 121 (3), 287–298. doi:10.1061/(asce)0733-9410(1995)121:3(287)
Flora, A., Lirer, S., and Silvestri, F. (2012). Undrained cyclic resistance of undisturbed gravelly soils. Soil Dyn. Earthq. Eng. 43, 366–379. doi:10.1016/j.soildyn.2012.08.003
Goudarzy, M., Rahman, M. M., Konig, D., and Schanz, T. (2016). Influence of non-plastic fines content on maximum shear modulus of granular materials. Soils Found. 56 (6), 973–983. doi:10.1016/j.sandf.2016.11.003
Hamidi, A., Yazdanjou, V., and Salimi, N. (2009). Shear strength characteristics of sand-gravel mixtures. Int. J. Geotechnical Eng. 3 (1), 29–38. doi:10.3328/ijge.2009.03.01.29-38
Hara, T., Kokusho, T., and Hiraoka, R. (2004). “Undrained strength of gravelly soils with different particle gradations,” in Proceedings of the 13 th World Conference on Earthquake Engineering, Vancouver, BC, August 1–6.
Hardin, B. O., and Black, W. L. (1966). Sand stiffness under various triaxial stresses. J. Soil Mech. Found. Div. 92 (SM2), 27–42. doi:10.1061/jsfeaq.0000865
Kuhnle, R. A., Wren, D. G., and Langendoen, E. J. (2016). Erosion of sand from a gravel bed. J. Hydraul. Eng. 142 (2), 04015052. doi:10.1061/(asce)hy.1943-7900.0001071
Lin, P. S., Chang, C. W., and Chang, W. J. (2004). Characterization of liquefaction resistance in gravelly soil: Large hammer penetration test and shear wave velocity approach. Soil Dyn. Earthq. Eng. 24 (9-10), 675–687. doi:10.1016/j.soildyn.2004.06.010
Liu, X. Y., Zou, D. G., Liu, J. M., and Zheng, B. W. (2021). Predicting the small strain shear modulus of coarse-grained soils. Soil Dyn. Earthq. Eng. 141, 106468. doi:10.1016/j.soildyn.2020.106468
Liu, X. Y., Zou, D. G., Liu, J. M., Zhou, C. G., and Zheng, B. W. (2020). Experimental study to evaluate the effect of particle size on the small strain shear modulus of coarse-grained soils. Measurement 163, 107954. doi:10.1016/j.measurement.2020.107954
Menq, F. Y., and Stokoe, K. H. (2003). IS Lyon, e23154.Linear dynamic properties of sandy and gravelly soils from large-scale resonant testsDeformation Charact. geomaterials
Oka, L. G., Dewoolkar, M., and Olson, S. M. (2018). Comparing laboratory-based liquefaction resistance of a sand with non-plastic fines with shear wave velocity-based field case histories. Soil Dyn. Earthq. Eng. 113, 162–173. doi:10.1016/j.soildyn.2018.05.028
Pandey, M., Chen, S. C., Sharma, P. K., Ojha, C. S. P., and Kumar, V. (2019a). Local scour of armor layer processes around the circular pier in non-uniform gravel bed. Water 11 (7), 1421. doi:10.3390/w11071421
Pandey, M., Lam, W. H., Cui, Y. G., Khan, M. A., Singh, U. K., and Ahmad, Z. (2019b). Scour around spur dike in sand–gravel mixture bed. Water 11 (7), 1417. doi:10.3390/w11071417
Pandey, M., Oliveto, G., Pu, J. H., Sharma, P. K., and Ojha, C. S. P. (2020). Pier scour prediction in non-uniform gravel beds. Water 12 (6), 1696. doi:10.3390/w12061696
Rahman, M. M., Lo, S. C. R., and Dafalias, Y. F. (2014). Modelling the static liquefaction of sand with low-plasticity fines. Géotechnique 64 (11), 881–894. doi:10.1680/geot.14.p.079
Rollins, K. M., Evans, M. D., Diehl, N. B., and Daily, W. D. (1998). Shear modulus and damping relationships for gravels. J. Geotech. Geoenviron. Eng. 124 (5), 396–405. doi:10.1061/(asce)1090-0241(1998)124:5(396)
Thevanayagam, S. (2007a). Intergrain contact density indices for granular mixes—I: Framework. Earthq. Engin. Engin. Vib. 6 (2), 123–134. doi:10.1007/s11803-007-0705-7
Thevanayagam, S. (2007b). Intergrain contact density indices for granular mixes—II: Liquefaction resistance. Earthq. Engin. Engin. Vib. 6 (2), 135–146. doi:10.1007/s11803-007-0706-6
Wang, Z. J., Luo, Y. S., Guo, H., and Tian, H. (2012). Effects of initial deviatoric stress ratios on dynamic shear modulus and damping ratio of undisturbed loess in China. Eng. Geol. 143-144, 43–50. doi:10.1016/j.enggeo.2012.06.009
Wichtmann, T., Hernández, M. A. N., and Triantafyllidis, T. (2015). On the influence of a non-cohesive fines content on small strain stiffness, modulus degradation and damping of quartz sand. Soil Dyn. Earthq. Eng. 69, 103–114. doi:10.1016/j.soildyn.2014.10.017
Yagiz, S. (2001). Brief note on the influence of shape and percentage of gravel on the shear strength of sand and gravel mixtures. Bull. Eng. Geol. Environ. 60 (4), 321–323. doi:10.1007/s100640100122
Keywords: sand-gravel mixtures, shear wave velocity (IGCC3/D7/E8), gravel content, skeleton void ratio, geological material
Citation: Cheng K, Wu H, Fang Y and Wu Q (2023) Experimental study on shear wave velocity of sand-gravel mixtures considering the effect of gravel content. Front. Earth Sci. 10:1076098. doi: 10.3389/feart.2022.1076098
Received: 21 October 2022; Accepted: 05 December 2022;
Published: 25 January 2023.
Edited by:
Rui Yong, Ningbo University, ChinaReviewed by:
Manish Pandey, National Institute of Technology Warangal, IndiaCopyright © 2023 Cheng, Wu, Fang and Wu. This is an open-access article distributed under the terms of the Creative Commons Attribution License (CC BY). The use, distribution or reproduction in other forums is permitted, provided the original author(s) and the copyright owner(s) are credited and that the original publication in this journal is cited, in accordance with accepted academic practice. No use, distribution or reproduction is permitted which does not comply with these terms.
*Correspondence: Yi Fang, eWlmYW5nQG5pbmhtLmFjLmNu
Disclaimer: All claims expressed in this article are solely those of the authors and do not necessarily represent those of their affiliated organizations, or those of the publisher, the editors and the reviewers. Any product that may be evaluated in this article or claim that may be made by its manufacturer is not guaranteed or endorsed by the publisher.
Research integrity at Frontiers
Learn more about the work of our research integrity team to safeguard the quality of each article we publish.