 Daxing Zuo
 Chunyi Wu
 Yanhui Zheng
 Xiaohong Chen
 Lina Wang
94% of researchers rate our articles as excellent or good
Learn more about the work of our research integrity team to safeguard the quality of each article we publish.
Find out more
ORIGINAL RESEARCH article
Front. Earth Sci., 12 January 2023
Sec. Hydrosphere
Volume 10 - 2022 | https://doi.org/10.3389/feart.2022.1053829
This article is part of the Research TopicUrban Flooding under a Changing EnvironmentView all 5 articles
In the background of global climate change and rapid urbanization, extreme climate events are frequent, and highly urbanized areas flooding problems are becoming increasingly prominent. It becomes important to develop qualitative scenario storylines to assess future flooding risk in a changing environment over the highly urbanized areas. In this study, the future (2030–2050) flood risk in the Pearl River Delta (PRD) region of China was assessed based on the MaxEnt model. We have developed four future scenarios under different emission conditions based on the representative concentration pathways (RCPs) and the shared socio-economic pathways (SSPs). The MaxEnt model was trained by using flood hazard sample point data and flood risk indicators, meanwhile, food risk prediction with high accuracy was obtained. We analyzed the influencing factors of flood risk and predicted the flood risk of the PRD under four future scenarios. According to the results, there is a significant increase in the size and proportion of high flood risk areas in most scenarios. Flood risk under scenario SSP5-RCP8.5 are expected to be the most serious in the future. Population density (POPD) and Gross domestic product density (GDPD) have the highest explanatory power for flood risk. This study predict the changes of flood risk under the combined influence of climate change and human activities, and hoped to provide a reference for future planning and disaster mitigation construction in PRD cities.
Floods are one of the most significant natural disasters in the world. Tellman et al. (2021) determined a total inundation area of 2.23 million square kilometres, with 255–290 million people directly affected by floods from 2000 to 2018. China is one of the most frequently flooded countries in the world (Zhang et al., 2000; Cheng, 2008) and is severely affected by floods. Floods cause an average annual economic loss of 3.15% of China’s total national economic output (Zou et al., 2012). According to the Intergovernmental Panel on Climate Change (IPCC)’s Sixth Assessment Report (AR6), climate change due to increased greenhouse gas emissions will intensify the water cycle, thereby increasing the likelihood and intensity of extreme precipitation and tropical cyclones, resulting in an increased risk of flooding (IPCC, 2022). In recent years, the Pearl River Delta (PRD) in China have suffered a lot of storm surges and coastal floods impacts. For example, the 2018 super typhoon “Mangkhut” made landfall in Guangdong, with maximum winds of 45 m/s near the center at landfall, causing direct economic losses of 5.2 billion yuan, affecting nearly 3 million people, evacuating and transferring 1,161,000 people. The “5–22” rainstorm in Guangzhou in 2020 caused water to accumulate in 443 places in the city, flooding in many places and the suspension of Metro Line 13. Since flooding has been frequent in recent years, flood risk assessment is very important for proper flood management in an area (Manfreda and Samela, 2019) which provides an important basis for disaster prevention and mitigation.
Many studies have shown that extreme weather due to climate change and human activities such as urbanization can lead to an increased risk of flooding. As one of the fastest growing economic regions in China, the PRD urban agglomeration has undergone significant and ongoing changes in land use (Li S et al., 2020) and socio-economics (Xu et al., 2015) over the past decades. Du et al. (2015) found that the expansion of impervious surfaces and the migration of agricultural land to hilly suburbs due to urbanization can lead to increased flooding. Gu et al. (2014) found an increasing trend in the frequency and intensity of floods in the Pearl River Basin from 1951 to 2010 due to changes in precipitation. Li Z. et al. (2020) developed four scenarios and found that the combined effects of climate change and human activities led to an increase in flood sensitivity. Due to the complex factors influencing flood risk, it becomes important to develop qualitative scenario storylines to assess future flood risk in the ever-changing environment of the PRD (Chen X. et al., 2020).
The development of future scenarios in the current study is usually based on the Representative concentration pathways (RCPs) and the Shared Socioeconomic Pathways (SSPs). RCPs are a comprehensive set of emission scenarios used as input parameters for climate change prediction models under the influence of human activities in the 21st century (Moss et al., 2010) to describe the concentrations of greenhouse gases when future environmental changes occur. SSPs are descriptions based on socioeconomic trends and are used to model changes in demographic, economic, and urbanization factors in 21st century societies (O’Neill et al., 2017). Pan et al. (2020) projected climate data including precipitation for China from 2007 to 2099 based on the RegCM4.6 model (Grell et al., 1994). Chen Y. et al. (2020) estimated the population distribution of China from 2010 to 2,100 under different RCP and SSP pathways.
Flood risk assessment methods can be broadly classified into four main types, including multi-criteria decision analysis (MCDA) (Chen X. et al., 2020), historical disaster mathematical statistics method (HDMS) (Sado-Inamura and Fukushi, 2019), scenario simulation analysis (SSA) (Mohanty et al., 2020; Zhi et al., 2020), and machine learning models (MLMs) (Chen et al., 2021; Chowdhuri et al., 2020). HDMS requires sufficient historical data and are not sufficiently flexible and rapid for risk assessment in urban areas where the natural and social environment is changing. SSA typically relies on two-dimensional (2D) hydraulic/hydrodynamic models to identify areas of high susceptibility, which require large amounts of high-resolution geographic, hydrological and artificial facility data. However, it is typically unwise to build them in extensive study areas such as the PRD due to expensive computational resources (Lyu et al., 2019). MCDA typically uses subjective methods such as expert scoring, the analytic hierarchical analysis (AHP), set-pair analysis and fuzzy comprehensive judgment to assign weights to indicators, which are mostly based on expert experience and knowledge (Danumah et al., 2016), resulting in more subjectivity and uncertainty in the assessment results. MLMs are as flexible as MCDA and MLMs require less high-resolution data and pre-processing than SSA, but they provide more objective assessment results than MCDA (Li S et al., 2020). Many MLMs have been applied to flood risk assessments and have proven to have excellent flood assessment capabilities, such as support vector machine (SVM), random forest (RF), convolutional neural network (CNN), ant colony algorithm, artificial neural networks (ANN) and logistic regression (Lai et al., 2016; Zhao et al., 2019; Chen et al., 2021). However, these MLMs are not perfect. For example, the SVM model usually requires the selection of appropriate hyperparameters and kernel functions, which affect its generalization performance, and there are various problems in their evaluation. Logistic regression methods are more sensitive to multicollinearity data. The accuracy of CNN and ANN tends to increase with the number of dimensions and samples, but the PRD urban agglomeration is very young and lacks sufficient inundation point data, which may lead to poor model training (Liu et al., 2017). Considered from this perspective, the MaxEnt model is well suited. Compared to other models, the MaxEnt model can produce better predictions by using only the “occurrence points” of events without the need for “non-occurrence points” when the event distribution data is incomplete (Elith et al., 2011; Barbosa and Schneck, 2015). It has a high accuracy in cases where the sample size is limited and the relationship between the influencing factors is not clear. In addition, it allows flexible feature selection and naturally solves the parameter smoothing problem in statistical models. Due to these advantages, the MaxEnt model is widely used in the study of climate change and its response, such as habitat suitability assessment under climate change (Xian et al., 2022) and the impacts of climate change on drought (Roy et al., 2022).
In this study, we combine climate change scenarios, socio-economic scenarios and land use changes in the PRD for scenario setting and experiments. We develop four future scenarios based on Representative Concentration Pathways (RCPs) (Moss et al., 2010) and Shared Social Economy Pathways (SSPs) (O’Neill et al., 2017). We use the MaxEnt model, which has very appropriate model characteristics but has rarely been applied to flood risk assessment. We are more objective in predicting and quantifying the impact of climate change and human activities on flood risk in the PRD. The objectives of this study are 1) to analyze the potential geographical distribution of flood risk in the PRD based on the MaxEnt model, 2) to analyze the impact factors of flood risk and the response relationships between flood risk and impact factors, and 3) to investigate the future changes in flood risk in the PRD under different SSP and RCP pathways based on reliable forecast data on extreme precipitation, land use and socio-economics. We expect the results of this study to raise awareness of the impact of human activities and climate change on urban flood risk, and to provide reasonable suggestions for future planning and construction in the PRD cities.
The Pearl River Delta (PRD), located in the south-central part of Guangdong Province, China, covers the nine cities of Guangzhou, Foshan, Zhaoqing, Shenzhen, Dongguan, Huizhou, Zhuhai, Zhongshan and Jiangmen (Figure 1). The region belongs to the subtropical monsoon climate, with an average annual temperature of 21.4–22.4°C and an average annual rainfall of 1,600–2,300 mm. The Pearl River Delta (PRD), which has undergone rapid urban expansion in the past decades, has both a modern manufacturing industry and a high urban population. The nine cities in the PRD have a total area of 55,368.7 km2, accounting for less than 1/3 of the land area of Guangdong Province, gathering 53.35% of the population and 79.67% of the total economic output of the country’s largest economic province. Floods have caused serious economic losses and casualties in the region in recent years (Lai et al., 2016). The PRD is taken as an example in this study.
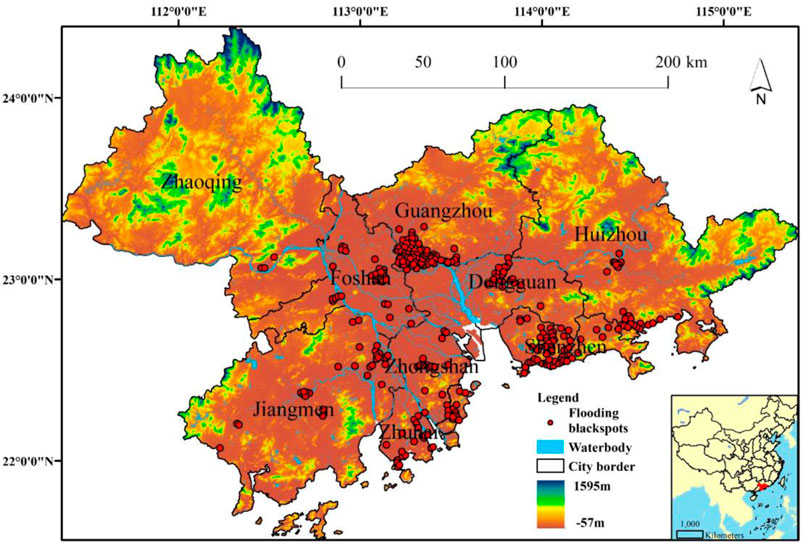
FIGURE 1. Research region and the spatial distribution of the flooding blackspots.
Locations in cities where flooding frequently occurs are typically referred to as flooding blackspots. According to previous research findings (Huang et al., 2017), 292 flooding blackspots within the PRD were extracted as sample points. And MaxEnt took a list of 292 flooding blackspots locations as input in this study. The sample point data was input into Excel cells in flood, longitude and latitude formats in turn and finally saved as csv files supported by the MaxEnt model for subsequent analysis.
The selection of flood risk indices differs from place to place and should be based on the climatic and geographical characteristics of the study area. According to the actual conditions in the PRD region (Yang et al., 2013; Lai et al., 2016), nine indices were selected from three aspects: disaster-inducing factor, disaster-breeding environment and disaster-bearing body. The disaster-inducing factors include two indices: maximum 1-day rainfall amount (Rx1day) and number of heavy rainfall days above 25 mm (R25 mm). Therefore, precipitation from April to September was chosen as the base data for Rx1day and R25 mm in this study. The disaster-breeding environment include five indices: Digital elevation model (DEM), Slope (SL), Runoff coefficient (RC), DTR (Distance to the river) and Topographic wetness index (TWI). The disaster-bearing body contain two indices: population density (POPD) and gross domestic product density (GDPD). Each of these indices is described in detail below.
Maximum 1-day rainfall amount (Rx1day, mm): Annual average of the maximum single-day rainfall in the PRD flood season (April-September) during the study time period.
Number of heavy rainfall days above 25 mm (R25mm, days): Annual average of the number of days with rainfall greater than 25 in the PRD flood season (April-September) during the study time period.
Digital elevation model (DEM, m): this index reflects the terrain’s surface. In general, areas in low elevation are prone to flooding because rainfall easily flows from highlands to lowlands under natural conditions.
Slope (SL, degrees): this index reflects the degree of topographic change. Mountain areas generally have severe slopes that prevent the collection of water, whereas lowlands or flatlands have gentle slopes that reflect a constant threat of flooding.
Runoff coefficient (RC): runoff condition and infiltration capability vary considerably in different land use patterns. In this study, the land use types are divided into 7 categories, including forest land, shrub land, herbaceous land, wetland, cropland, bare land, construction land and water bodies, and the RCs are 0.15, 0.18, 0.20, 0.60, 0.70, 0.90, and 1.00, respectively (Wang et al., 2015).
Distance to the river (DTR, m): the river system is extracted based on DEM. The rivers are then set to 0, but this value grows larger as the distance to the river increases (Viglione et al., 2013). This step is conducted using Euclidean distance in the geographic information system (GIS).
Topographic wetness index (TWI): this index was commonly used to quantify topographic control on hydrological processes (Sørensen et al., 2005). It is a function of both the slope and the upstream contributing area per unit width orthogonal to the flow direction. It can be generated based on DEM using the tool of ‘Raster Calculator’ of ArcGIS.
Population density (POPD, people/km2): this index reflects the population distribution.
Gross domestic product density (GDPD, 10,000 yuan/km2): this index reflects the property distribution.
The data of Rx1day and R25 mm were derived from the Multi-Source Weighted-Ensemble Precipitation product (MSWEP, http://hydrology.princeton.edu/data/hylkeb/MSWEP_V220/), daily value precipitation data in April-September from 1995 to 2004. The SRTM DEM with a spatial resolution of 90 m was obtained from the Geospatial Data Cloudy (http://www.gscloud.cn/). The TWI data and SL data were calculated based on DEM data. The land use data were obtained from GlobeLand30 V2010 dataset (www.globallandcover.com/) (Chen et al., 2014). The river vector data was obtained from the OpenStreetMap website (http://wiki.openstreetmap.org/) and the DTR was calculated based on river data using geographic information system (GIS) techniques. The data of POPD was provided by the WorldPop website (https://www.worldpop.org). The GDPD distribution data were obtained from the Resource and Environmental Science and Data Centre of the Chinese Academy of Sciences (www.resdc.cn/). The detail of the data sources, time, spatial resolution and data types are shown in Table 1.
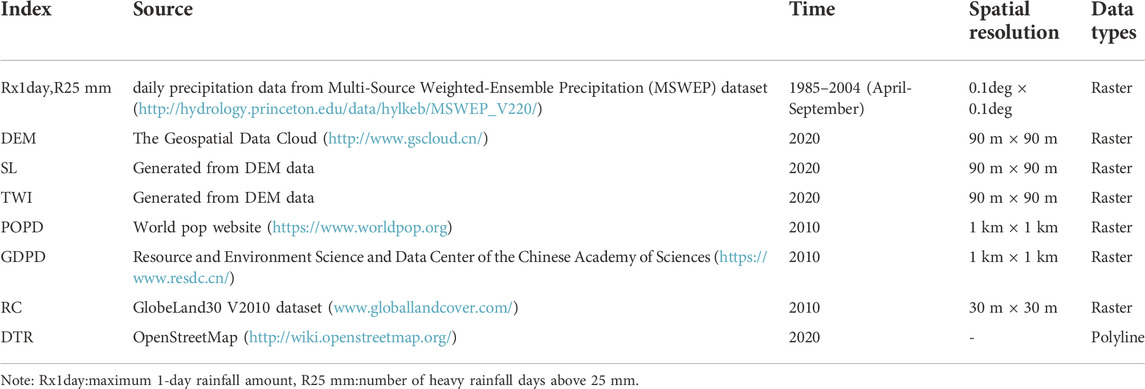
TABLE 1. The database for the historical data.
Under different representative concentration pathways (RCPs), future daily precipitation data of 2030–2050 for the PRD from April to September, were obtained from the National Tibetan Plateau Data Center (http://data.tpdc.ac.cn). The dataset was generated by Pan et al. (2020) based on the RegCM4.6 model for regional dynamical downscaling under different carbon emission concentration scenarios (RCP2.6, RCP4.5, RCP6.0 and RCP8.5) of the GFDL-ESM2M model with a spatial resolution of 0.25°. The future land use data were from the National Earth System Science Data Sharing Infrastructure, National Science and Technology Infrastructure of China (http://www.geodata.cn). Based on the 2010 Chinese land cover data product FROM-GLC, detailed spatial assignments based on a downscaling approach with a meta-cellular automata model were used to generate land use data under different climate change scenarios. The future population data were from the dataset “Provincial and gridded population projection for China under shared socioeconomic pathways from 2010 to 2,100” published by Chen Yidan et al. (2020) at Tsinghua University. The dataset used multidimensional recursive models to estimate the population distribution of China from 2010 to 2,100 under different RCP and SSP pathways based on 2010 population distribution data. The dataset considered the impact of adjustments to national fertility and settlement policies, reducing systematic bias in the results of existing country studies (Chen Y. et al., 2020). The future GDPD data is based on 2010 GDPD data and is projected based on the SSP Scenario Database, which is available at the SSP Public Database (https://tntcat.iiasa.ac.at/SspDb/). The detail of the data sources, time, spatial resolution and data types are shown in Table 2.
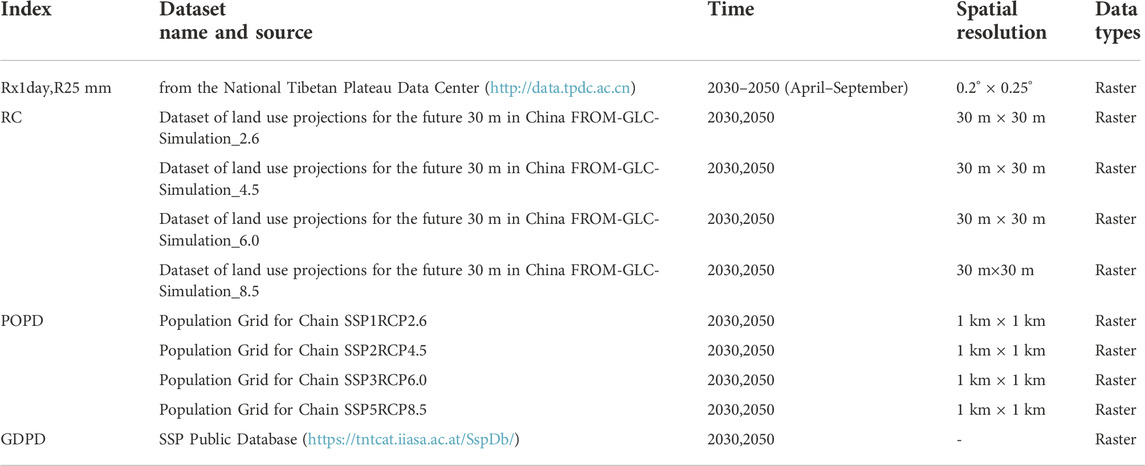
TABLE 2. The database for the future projection data.
The methodology of the present study involves four main steps: 1) scenario setting, 2) flood risk assessment, 3) analysis of environment indices, and 4) projections of the future flood risk. The methodology flowchart is shown in Figure 2, and the details of the four steps are presented in the following subsections:
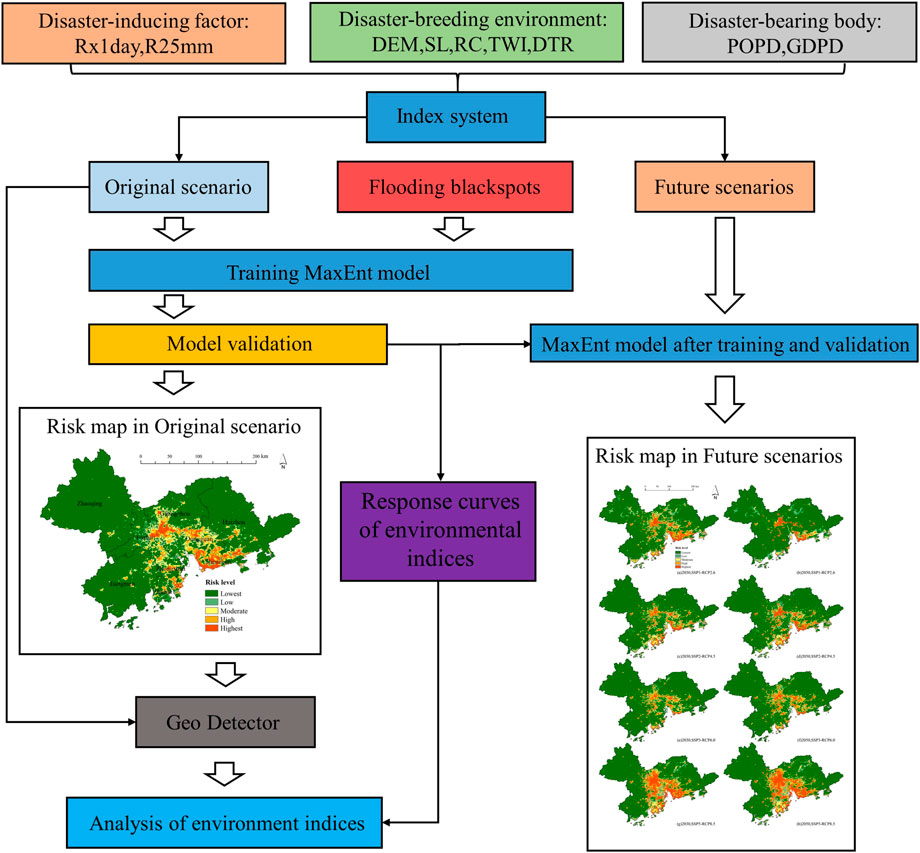
FIGURE 2. The flowchart of flood risk assessment and projections in this study.
In this study, five scenarios were developed to explore flood risk in the PRD, including one original scenario and four future scenarios.
In the original scenario (OS), we used precipitation data from 1985 to 2004, used by Pan and Zhang (2020) as the basis for projecting climate change, as the base data for generating Rx1day and R25 mm. The POPD, GDPD and land use data used to calculate RC are all in 2010, which is consistent with the base year of the projection data. Figure 3 shows all the indices in the original scenario.
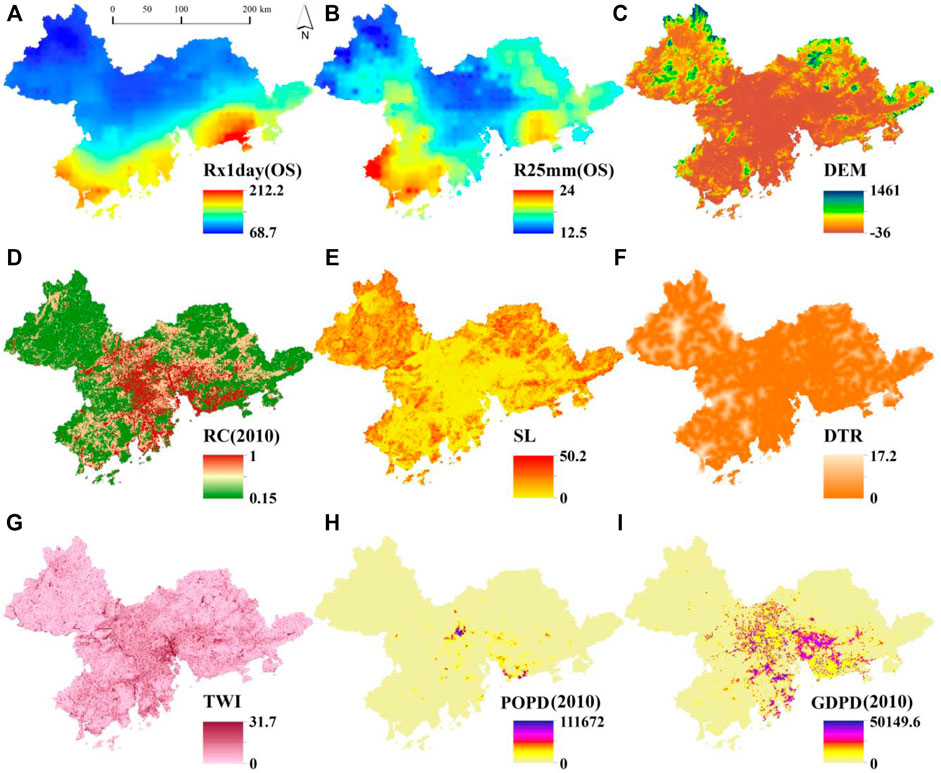
FIGURE 3. Spatial distribution of different indices in 2010 over the PRD. Note:(A) Rx1day in OS, (B) R25 mm in OS, (C) DEM, (D) RC in 2010, (E)SL, (F) DTR, (G) TWI, (H) POPD in 2010, and (I) GDPD in 2010.
The Representative Concentration Pathways (RCPs) are a comprehensive set of emission scenarios that are used as input parameters for climate change projection models under the influence of human activities in the 21st century (Moss et al., 2010). It is used to describe the emissions of greenhouse gases, reactive gases, aerosols, and the concentrations of atmospheric constituents when future changes in population, socio-economics, science and technology, energy consumption and land use occur. The RCPs consist of four scenarios including RCP2.6, RCP4.5, RCP6.0 and RCP8.5.
The Shared Socioeconomic Pathways (SSPs) are based on a description of five socio-economic trends that can describe the future of society. It is used to model changes in socio-economic factors in the 21st century, these factors include population, economic growth, education, urbanization and the rate of technological development (O’Neill et al., 2017). These pathways are designed to cover a variety of possible future worlds. They consist of: a world of sustainable development, with a focus on growth and equality (SSP1); a world of “middle paths”, where trends largely follow their historical patterns of development (SSP2); a “nationalist revival”, regionalized world (SSP3); a more unequal world (SSP4); and a world of rapid and unrestrained growth in both economic output and energy use (SSP5). We refer to O’Neill et al. (2016) for a combination of SSPs and RCPs to generate four future climates as well as socio-economic simulation pathways, each of which is described in detail in Table 3.
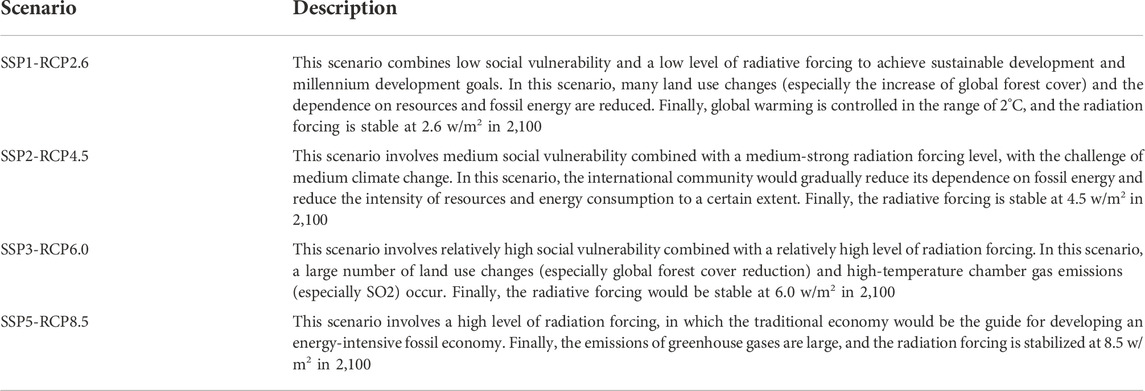
TABLE 3. Presentation of the four scenarios.
We assume that the current DEM, SL, DR and TWI for the study area remain constant over time, while Rx1day, R25 mm, RC, POPD and GDPD change according to the climate change pathways and socio-economic development pathways in the corresponding scenarios. We use changes in geographic environmental indices to project how flood risk will change in the future.
The MaxEnt model is a density estimation and distribution prediction model based on the maximum entropy theory (West et al., 2016). The entropy algorithm to describe the uncertainty or information content of a random event quantitatively is described by Shannon (1948) as
where H is the information entropy,
Based on the principle of maximum entropy and the Lagrange undetermined multiplicator method, the distribution when the entropy is maximum can be obtained (Feng and Hong, 2009). Let random variable x be
The mean value
To discover the distribution when entropy is the maximum value under the constraint condition of Eqs. 2, 3, undetermined multiplicators
Using the inequality
To have
Using Equation 2 and 5 could be written as
To obtain the value of
In Eq. 7, both
We used the MaxEnt model software developed by Phillips et al. (2004). The MaxEnt model with a maximum of 500 iterations and a maximum of 10,000 background points. The regularization multiplier and convergence threshold are defined by the MaxEnt model by default, which can ensure a better simulation effect, and logistic is used as the output format. A jackknife test was used to assess the importance of environmental variables. The threshold was determined by maximum training sensitivity plus specificity (MaxSS), and the flood risk levels were divided. The receiver operating characteristic (ROC) curve is widely used to evaluate the accuracy of species distribution models. ROC curves were drawn with the false positive rate as the abscissa and the true positive rate as the ordinate. Then, the area under the receiver operating characteristic curve (AUC) was used to evaluate the model. The AUC value ranges between 0 and 1. The closer to 1 the value is, the better its prediction ability will be. Specifically, an AUC value greater than 0.5 but less than 0.7 indicates a general prediction ability, an AUC value greater than 0.7 but less than 0.9 indicates a good prediction ability, and an AUC value greater than 0.9 indicates an excellent prediction ability (Swets, 1988; Fielding and John, 1997).
We exported the flood risk indicators as uniform resolution raster data and then converted these raster data to ASCII format in ArcGIS software. The flood risk factor data in ASCII format under the original scenario and the sample point data in csv format were input into the MaxEnt software to obtain the flood risk distribution results under the original scenario. According to the results of the model run, the threshold for determining whether a flood is likely to occur is approximately 0.16 (MaxSS=0.16). Flooding is considered less likely to occur when the probability is 0–0.16 and more likely to occur when 0.16 to 1. This study used the natural breaks classification method to classify areas with risk values greater than 0.16 into four classes. The flood risk has been classified into five classes (Figure 5): lowest risk (0–0.16), low risk (0.16–0.29), medium risk (0.29–0.44), high risk (0.44–0.62) and highest risk (0.62–1). Finally, we inputted the flood risk indicators in ASCII format for the four future scenarios into the MaxEnt software to obtain the results of the flood risk distribution for the four scenarios. The output of the MaxEnt software is in ASCII format, which we converted to raster data for further analyses in ArcGIS software.
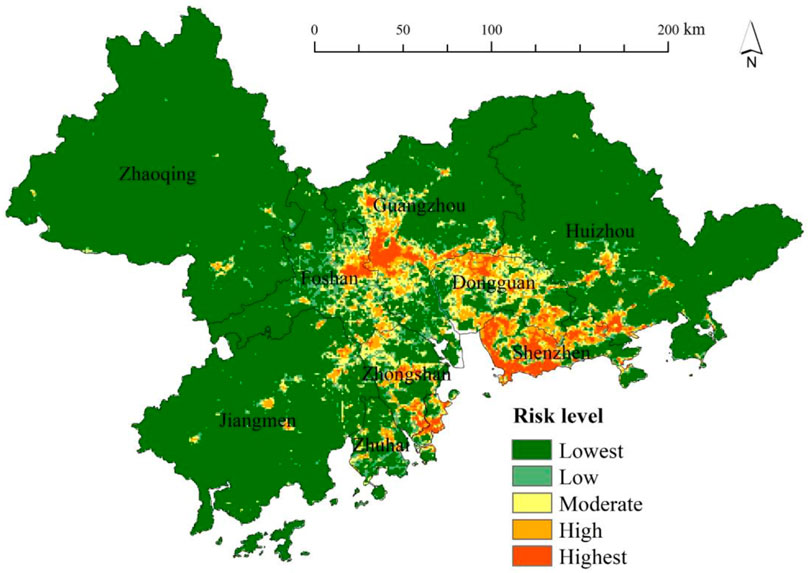
FIGURE 5. Spatial distribution of flood risk in the PRD under the original scenario.
Geographical Detector is a new statistical method for detecting spatial differentiation and for revealing the driving factors behind it. The model has a wide range of applications in ecological, meteorological, hydrological, and socioeconomic fields, so it is well suited for this study. The method is free of linearity assumptions and has an elegant form and clear physical implications. The basic idea is that the study area is assumed to be divided into sub-regions and there is spatial heterogeneity if the sum of the variance of the sub-regions is less than the total variance of the region; if the spatial distribution of the two variables converges, there is statistical correlation between them (Wang and Xu, 2017). Factor detectors are used to detect the spatial heterogeneity of the dependent variable and the explanatory power of the respective variable on the degree of influence of the dependent variable, measured by the q-value.
where:
The AUC curve of the MaxEnt model for the simulation and projection results of flood risk in the PRD is shown in Figure 4. The AUC value of the training set is 0.918 (>0.9), indicating that the accuracy of the prediction results of the MaxEnt model is excellent. Therefore, the model prediction results meet the research requirements.
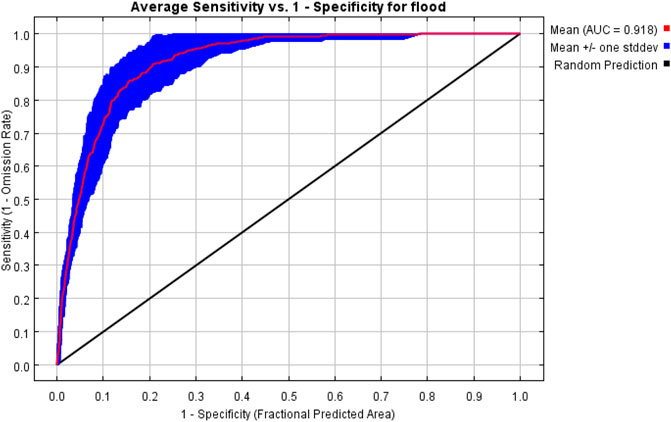
FIGURE 4. Average AUC of the model.
Figure 5 shows the distribution of flood risk in the PRD in the original scenario. The area with the highest flood risk is about 1,475 km2, accounting for about 2.7% of the total PRD area. It is mainly distributed in central Guangzhou, eastern Foshan, central and southern Zhongshan, northern Dongguan, eastern Zhuhai and most of Shenzhen. The high risk area covers an area of about 2,249 km2, accounting for about 4% of the total area of the PRD, mainly in southeastern Foshan, northern Dongguan, most of Shenzhen and the western part of Zhuhai. The medium risk zone covers an area of about 3,049 km2, accounting for about 5.5% of the total area of the PRD, mainly in most of Dongguan, northeastern Jiangmen, northern Zhongshan and central Huizhou. The low-risk area covers an area of about 3,547 km2, accounting for about 6.4% of the total area of the PRD, mainly in western Foshan, southwestern Zhaoqing, northern Guangzhou and central Huizhou. The lowest risk area covers an area of about 45048.9 km2, which is about 81% of the total area of the PRD, mainly in most of Zhaoqing, most of Jiangmen, the western part of Foshan, the northern part of Guangzhou and most of Huizhou. Among the PRD city agglomerations, Shenzhen and Guangzhou are at the most serious risk of flooding, followed by Dongguan, Foshan, Zhongshan and Zhuhai, while Zhaoqing, Jiangmen and Huizhou are at the lowest risk of flooding. The areas with the highest flood risk are generally located in areas with high human activity, high urbanization, and low elevation. These areas, which have disaster breeding environments, are more vulnerable and are priority areas for flood risk management. Low-lying regions are far more likely to experience severe flooding than more elevated areas. Therefore, in the urban planning and construction of the PRD urban agglomeration, it is necessary to avoid choosing the regions with low elevation and to strengthen the construction of flood control and drainage facilities in low-lying areas.
Table 4 shows area and percentage of highest risk zones in each city under the original scenario. The cities with the top five highest flood risk areas are Shenzhen, Guangzhou, Dongguan, Huizhou and Foshan. The top five cities in terms of percentage of area at highest flood risk are Shenzhen, Dongguan, Zhuhai, Zhongshan and Guangzhou. Shenzhen has relatively serious flood risk, with the highest risk area of 595 km2, accounting for 30.7% of the total area of the city. Jiangmen and Zhaoqing are the lowest flood risk cities, their highest risk areas are tiny and account for less than 0.1% of the total city area.
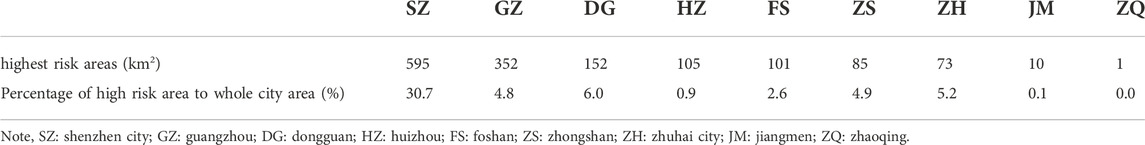
TABLE 4. Area and percentage of highest risk zones in each city under the original scenario.
Of the nine environmental indices, only RC has a classified value, while the other eight environmental indices have continuous values. Therefore, this study reclassified these eight indicators using the natural breaks method in ArcGIS software, and then entered them into the Geographical Detector model. From Table 5, spatial distribution of flooding in the PRD region are related to all these environmental indices. As can be judged from the magnitude of the explanatory power, POPD has the greatest influence on the potential geographical distribution of flood risk in the PRD with an explanatory power of 0.678, followed by GDPD with an explanatory power of 0.646. All environmental indices are ranked in descending order of explanatory power as POPD (0.678) > GDPD (0.646) > RC (0.432) > DEM (0.231) > SL (0.161) > DTR (0.134) > TWI (0.096) > Rx1day (0.049) > R25 mm (0.021).
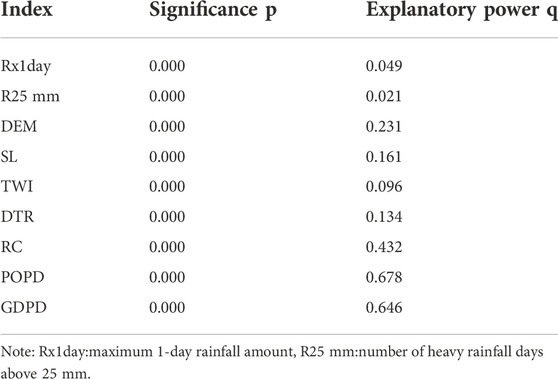
TABLE 5. Explanatory power of environmental indices.
POPD, GDPD and RC, which are directly related to the intensity of human activity and the degree of urbanization, have the highest explanatory power. Human activities can result in an increased risk of flooding by reduced permeability of the ground. The number of casualties and people affected by flood, as well as economic losses are the main indicators of the extent of flood damage. Areas with high POPD and GDPD have a greater risk of damage than areas with relatively low levels of these two indicators. The DEM also has explanatory power for flood risk, and areas at lower elevations tend to be more prone to flooding. The explanatory power of Rx1day and R25 mm are lower. According to relevant studies, torrential rain refers to a heavy rainfall process during which the total precipitation is equal to or greater than 50 mm in 24 h (Kong et al., 2017). All Rx1day values within the PRD are greater than 50 mm, implying that precipitation as the disaster-inducing factor is abundant in all areas of the PRD.
In the MaxEnt model results, the existence is considered less likely when the probability is greater than 0.5, and more likely when the probability is greater than 0.5 (Shipley, 2009). Figure 6 shows the response of key environmental indices to the risk of flooding. In terms of disaster-bearing body, both POPD and GDPD generally show a positive correlation for flood risk. As shown in Figure 6A and Figure 6B, the probability of flooding is greater when the POPD is greater than 7,000 people/km2 and the GDPD is greater than 50 million yuan/km2. In terms of the disaster-breeding environment, DEM is negatively correlated with flood risk while RC is positively correlated with flood risk. As shown in Figure 6C and Figure 6D, flood risk is higher when DEM is less than 30 and RC is greater than 0.8. Figure 6E and Figure 6F shows the response curves from the disaster-inducing factor, the probability of flooding is higher when Rx1day is between 140 and 200 and when R25 mm is greater than 14.5 and less than 15.5.
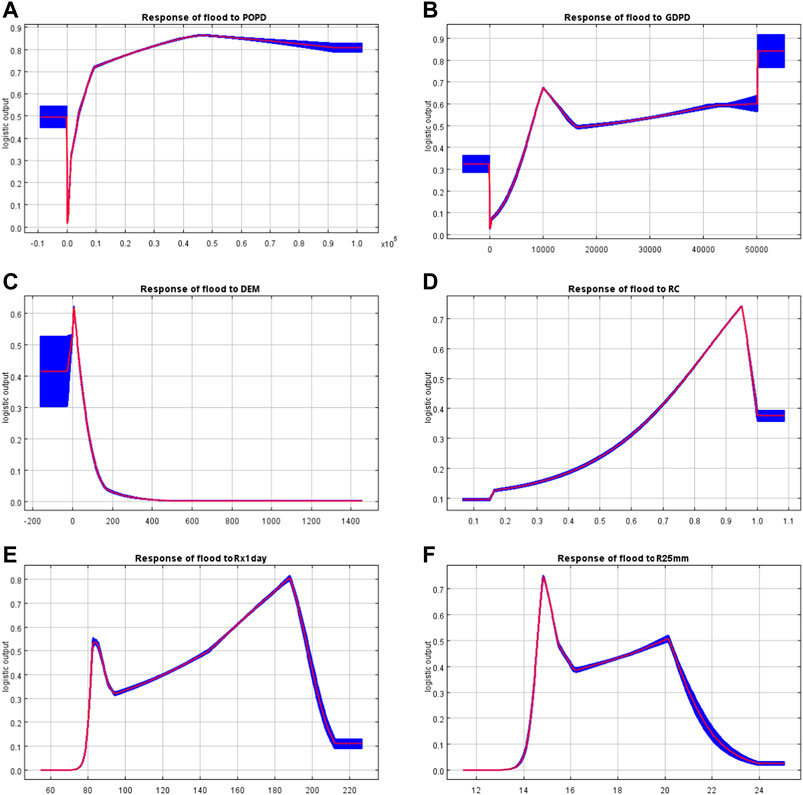
FIGURE 6. Response curves of environmental indices in MaxEnt models. Note:(A) The response curve of POPD, (B) The response curve of GDPD, (C) The response curve of DEM, (D) The response curve of rc, (E) The response curve of Rx1day, (F) The response curve of R25mm.
This study input the flooding blackspots data, the environmental indices data from the original scenario and the environmental indices data from the future scenario into the MaxEnt model. Then obtained the spatial distribution of flood risk in the PRD under scenarios SSP1-RCP2.6, SSP2-RCP4.5, SSP3-RCP6.0 and SSP5-RCP8.5 for 2030 and 2050. The flood risk divided into 5 levels (namely, lowest, low, moderate, high and highest), which has the same number of categories as the original scenario.
As shown in Figure 7 and Table 6, there is an increasing trend in flood risk in 2030 compared with the original scenario due to human activities and climate change. The areas above medium risk of flooding under the SSP1-RCP2.6 scenario (Figure 7A) are approximately 5,283 km2, an increase of approximately 2.8% of the total area. Under the SSP2-RCP4.5 scenario (Figure 7B), the areas above medium risk of flooding are approximately 4,549 km2, an increase of approximately 1.5% of the total area. The areas above medium risk of flooding under the SSP3-RCP6.0 scenario (Figure 7C) are approximately 3525 km2, calculating a reduction in total area of about 0.5% in 2030. The areas above medium risk of flooding under the SSP5-RCP8.5 scenario (Figure 7D) are approximately 8,731 km2, accounting for 15.8% of the total area of the PRD, which represent the largest increase of about 9.1% in total area compared with the original scenario.
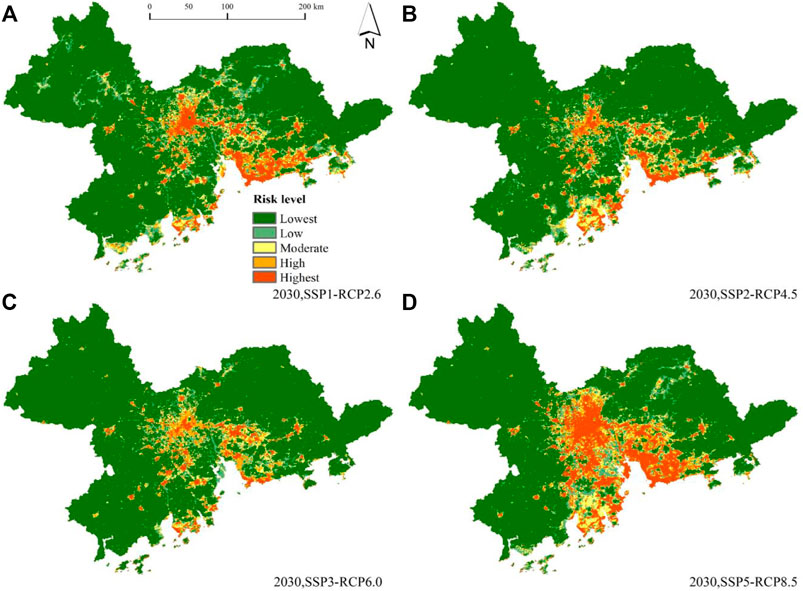
FIGURE 7. Spatial distribution of future flooding risk over the PRD under four scenarios in 2030.
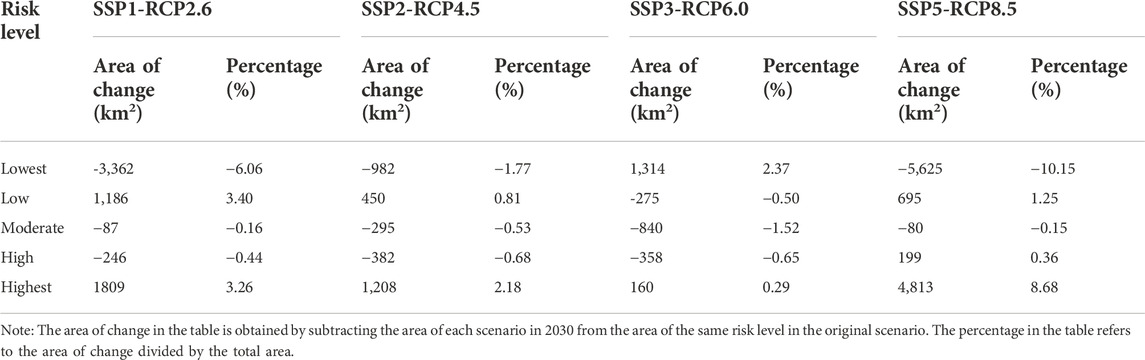
TABLE 6. Projected changes of flooding risk areas under four scenarios in 2030 compared with the original scenario. (Area of risk zones for different scenarios in 2030 minus the area of risk zones corresponding to the original scenario).
This study analysis the changes in the highest flood risk zones in 2030 for the five cities (Guangzhou, Shenzhen, Dongguan, Foshan and Huizhou) with high flood risk in the PRD. Figure 8A shows the area of the highest risk zone in the five cities under the original scenario and the scenarios in 2030. Under scenarios SSP1-RCP2.6 and SSP2-RCP4.5 in 2030, Shenzhen has the largest areas of highest risk zone among the five cities in the PRD. Dongguan and Guangzhou had the largest areas of highest risk zone under the SSP3-RCP6.0 and SSP5-RCP8.5 scenarios respectively. Figure 8B shows the percentage of highest risk zone in the five cities under the original scenario and the scenarios in 2030. Under scenarios SSP1-RCP2.6, SSP2-RCP4.5 and SSP3-RCP6.0 in 2030, Shenzhen has the largest percentage of area in the highest risk zone among the five cities in the PRD. Dongguan has the largest percentage of area in the highest risk zone under the SSP3-RCP6.0 scenario.
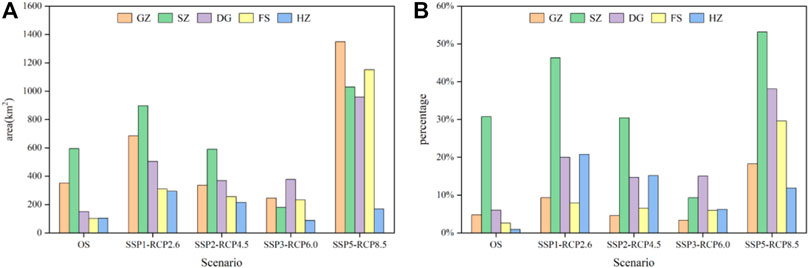
FIGURE 8. Area and percentage of the highest risk zone in cities under the original scenario and the scenarios in 2030. GZ, Guangzhou city; SZ, Shenzhen city; DG, Dongguan city; FS, Foshan city; HZ, Huizhou city. Note:(A) Percentage of the highest risk zone in cities under the original scenario and the scenarios in 2030. (B)Area of the highest risk zone in cities under the original scenario and the scenarios in 2030.
Figure 9 shows the spatial distribution of flood risk in the PRD under the four scenarios in 2050. In 2050, the SSP5-RCP8.5 scenario (Figure 9D) has a relatively high flood risk, while the SSP1-RCP2.6 scenario (Figure 9A), SSP2-RCP4.5 scenario (Figure 9B) and SSP3-RCP6.0 scenario (Figure 9C) have more similar flood risks. As shown in Table 7, the distribution of flood risk in 2050 is closer to the distribution in 2030. Among the four future scenarios, the area above medium risk of flooding in 2050 is smaller than in 2030 only under the SSP1-RCP2.6 scenario. There shows a trend of gradual expansion in the areas above medium risk of flooding over time, accompanied by shrinking areas of medium and low risk in the other three scenarios. The SSP5-RCP8.5 scenario has the most severe increase in the areas above medium risk of flooding, covering 9,240 km2 or 16.7% of the total PRD area. By 2050, the area is increased by 10% (about 2.5 times) for the region above medium risk.
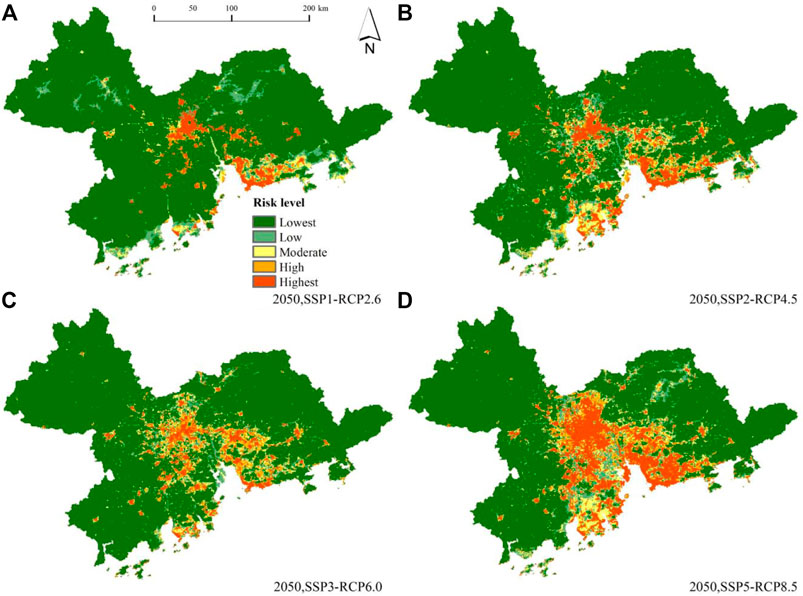
FIGURE 9. Spatial distribution of future flooding risk over the PRD under four scenarios in 2050.
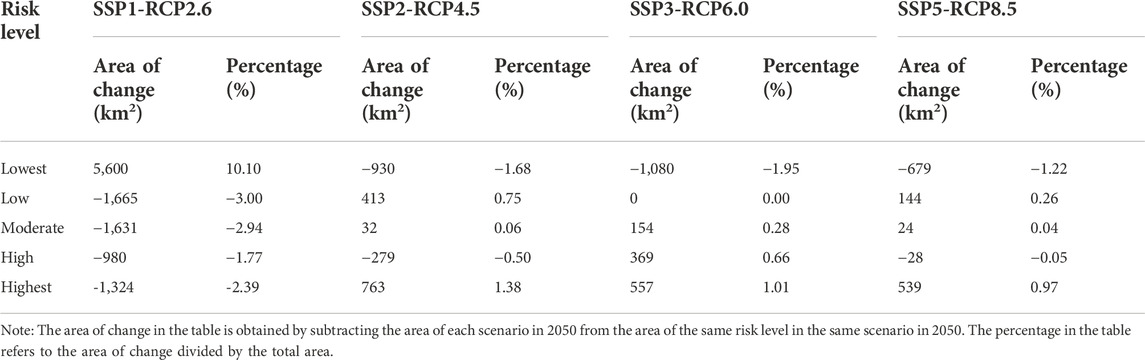
TABLE 7. Projected changes of flooding risk areas under four scenarios in 2050 compared with 2030. (Area of risk zones for different scenarios in 2050 minus the area of the corresponding risk zone for each scenario in 2030).
In general, flood risk under the SSP5—RCP8.5 scenario is the most serious of the four future scenarios, followed by the SSP1—RCP2.6 scenario and the SSP2—RCP4.5 scenario, while future flood risk under the SSP3—RCP6.0 scenario is the lowest. A noticeable increase in flood risk in the PRD can be found in the high-emission SSP5-RCP8.5 scenario with the absence of the climate policy. By comparing the scenarios in the original, 2030, and 2050, it is evident that the area of the PRD at high risk of flooding show a tendency to expand in the future. In terms of the area of highest risk zone, Guangzhou and Shenzhen are at more serious risk of flooding. From the perspective of the percentage of the highest risk zone, Shenzhen and Dongguan are face a more serious risk of flooding.
This study used highly accurate data such as population distribution data (Chen Y. et al., 2020) and land use data, which could improve the accuracy of prediction to some extent. Three scenarios had an increased risk of flooding in 2030 as compared to the original scenario. In 2050, three scenarios had an increase in the area above medium risk of flooding as compared to 2030. It indicated a general upward trend in flood risk in the PRD region under the combined influence of human activities and climate change. Many studies suggested that PRD (Li Z et al., 2020; Chan et al., 2021) and economically developed coastal cities would be at greater risk of flooding with climate change and urbanization. Flood losses in 2050 would be ten times higher than in 2005 in 20 coastal cities around the world, including Guangzhou and Shenzhen (Hallegatte et al., 2013). Due to Hurricane Harvey, which produced the highest rainfall totals of 1,270 mm in some areas of Houston and Texas, the probability of extreme flood events increased on average by about 21 times (Zhang et al., 2018). Flood risk in PRD increased most severely under the highest emission scenario SSP5-RCP8.5, which was consistent with previous studies (Gemmer et al., 2011; Wu et al., 2014a; 2014b; Chen X. et al., 2020). Therefore, the Guangdong-Hong Kong-Macao Greater Bay Area (GBA) urban agglomeration needs to pay more attention to flood prevention and reduce greenhouse gas emissions in its future planning and urban development. Avoiding excessive greenhouse gas emissions is also an effective way of reducing flood risk. Compared with the results of Chen X. et al. (2020), the distribution of high flood risk areas is comparatively consistent, indicating that the MaxEnt model is successful in the simulation and prediction of flood risk.
Previous studies have focused on the fact that extreme precipitation events were more pronounced under high emission conditions, leading to increased flood risk (Ji and Kang, 2015; Robbins, 2016). In this study, in terms of the impact on flood risk, it was the socio-economic and topographic indices, which contribute more to the risk of flooding, rather than the extreme precipitation indices. In contrast, the lower explanatory power of Rx1day and R25 mm as disaster-inducing factors was caused by the higher precipitation intensity in the PRD region (Kong et al., 2017). The spatial distribution of flood risk due to abundant precipitation was more dependent on the disaster-breeding environment and the disaster-bearing bodies. As urbanization accelerates, some natural green land converted to construction land, leading to an increase in impervious surfaces and resulting in an increased risk of flooding. In the analysis of the environmental indicator response curves, flood risk increased with increasing POPD, GDPD and RC and increased with decreasing DEM. The effect of Rx1day on the probability of flooding in this study was concentrated in the 140–200 mm interval. Theoretically, the above results are consistent with the basic laws of probability theory, as the MaxEnt model is an arithmetic model based on the Bayes Formula (Shipley, 2009; He, 2010). In the model, high rainfall is an extreme event with low probability of occurrence at the extremes (Robbins, 2016). Therefore, in this era of rapid social and economic development, people should pay more attention to the prevention of natural disasters such as flooding.
This study used the MaxEnt model to assess changes in flood risk in the PRD region under the influence of climate change and human activities. We used the Geographical Detector to calculate the contribution of each indicator to flood risk. The relationship between flood risk and various environmental indicators was also explored through response curves. We predicted the distribution of flood risk under the RCPs and SSPs scenarios.
The AUC values of the MaxEnt model indicated that the accuracy of the model’s predictions was excellent. Under the original scenario, the areas of high- and highest-risk regions for flooding in the PRD cover an area of about 3,724 km2, accounting for 6.7% of the total area of the PRD. The areas with high risk of flooding were mainly in Guangzhou, Shenzhen, Dongguan and other cities with high population density, high urbanization rate and low terrain. Among the impact indices of flood risk, POPD, GDPD, RC and DEM had a high explanatory power. POPD, GDPD and RC showed a significant positive correlation with flood risk, and DEM showed a negative correlation. In the future (2030–2050), there was a significant increase in the area and percentage of the highest flood risk zone. Flood risk under scenario SSP5—RCP8.5 was the most serious, with the area above medium risk of flooding of 9,240 km2, accounting for 16.7% of the total area of the PRD.
The original contributions presented in the study are included in the article/supplementary material, further inquiries can be directed to the corresponding author.
DZ, LW, and XC conceived and designed the idea. DZ, CW and YZ conducted the experiments and analyses. LW and YZ contributed to the data collection. XC and YZ contribute for result discussions. All authors contributed to manuscript revision, read, and approved the submitted version.
The research is financially supported by National Natural Science Foundation of China (Grant Nos. U1911204, 52209025), the research is financially supported by National Key R&D Program of China (2021YFC3001000).
The institutions and websites that provided data for this study, including “National Earth System Science Data Sharing Infrastructure, National Science and Technology Infrastructure of China. (http://www.geodata.cn)”, “National Tibetan Plateau Data Center (http://data.tpdc.ac.cn)”, World pop website (https://www.worldpop.org), Resource and Environment Science and Data Center of the Chinese Academy of Sciences (https://www.resdc.cn/), SPRINGER NATURE (https://springernature.figshare.com) and OpenStreetMap (http://wiki.openstreetmap.org/). The authors are grateful to the editors and reviewers, who have given deep and careful feedbacks to substantially improve this paper.
YZ was employed by Franzero Water Technology Co. LTD.
The remaining authors declare that the research was conducted in the absence of any commercial or financial relationships that could be construed as a potential conflict of interest.
The reviewer JW declared a past co-authorship with the author XC to the handling editor.
All claims expressed in this article are solely those of the authors and do not necessarily represent those of their affiliated organizations, or those of the publisher, the editors and the reviewers. Any product that may be evaluated in this article, or claim that may be made by its manufacturer, is not guaranteed or endorsed by the publisher.
Barbosa, F. G., and Schneck, F. (2015). Characteristics of the top-cited papers in species distribution predictive models. Ecol. Modell. 313 (5), 77–83. doi:10.1016/j.ecolmodel.2015.06.014
Chan, F., Yang, L. E., Scheffran, J., Mitchell, G., Mcdonald, A., Griffiths, J., et al. (2021). Urban flood risks and emerging challenges in a Chinese delta: The case of the Pearl River Delta. Environ. Sci. Policy 122 (20), 101–115. doi:10.1016/j.envsci.2021.04.009
Chen, Jialei, Huang, Guoru, and Chen, Wenjie (2021). Towards better flood risk management: Assessing flood risk and investigating the potential mechanism based on machine learning models. J. Environ. Manag. 293, 112810. doi:10.1016/j.jenvman.2021.112810
Chen, Jun, Ban, Yifang, and Li, Songnian (2014). Open access to Earth land-cover map. Nature 514 (7523), 434. doi:10.1038/514434c
Chen, X., Zhang, H., Chen, W., and Huang, G. (2020a). Urbanization and climate change impacts on future flood risk in the Pearl River Delta under shared socioeconomic pathways. Sci. Total Environ. 762, 143144. doi:10.1016/j.scitotenv.2020.143144
Chen, Y., Guo, Fang, Wang, Jiachen, Cai, Wenjia, Wang, Can, and Wang, Kaicun (2020b). Provincial and gridded population projection for China under shared socioeconomic pathways from 2010 to 2100. Sci. Data 7 (1), 83. doi:10.1038/s41597-020-0421-y
Chen, Yidan, Guo, Fang, Wang, Jiachen, Cai, Wenjia, Wang, Can, and Wang, Kaicun (2020c). Provincial and gridded population projection for China under shared socioeconomic pathways from 2010 to 2100. Figshare. Collect. doi:10.6084/m9.figshare.c.4605713.v1
Cheng, X. T. (2008). Strategic demand for enhancing flood and drought management and investigation on policies of water governance. J. J. Hydraulic (10), 1197–1203+1212. doi:10.3321/j.issn:0559-9350.2008.10.007
Chowdhuri, I., Pal, S. C., and Chakrabortty, R. (2020). Flood susceptibility mapping by ensemble evidential belief function and binomial logistic regression model on river basin of eastern India. Adv. Space Res. 65, 1466–1489. doi:10.1016/j.asr.2019.12.003
Danumah, J. H., Odai, S. N., Saley, B., Szarzynski, J., Thiel, M., Kwaku, A. A., et al. (2016). Flood risk assessment and mapping in Abidjan district using multi-criteria analysis (AHP) model and geoinformation techniques, (Cote d’Ivoire). Geoenvironmental Disasters 3, 10–13. doi:10.1186/s40677-016-0044-y
Du, S., Van Rompaey, A., Shi, P., and Wang, J. (2015). A dual effect of urban expansion on flood risk in the Pearl River Delta (China) revealed by land-use scenarios and direct runoff simulation. Nat. Hazards (Dordr). 77 (1), 111–128. doi:10.1007/s11069-014-1583-8
Elith, J., Phillips, S. J., Hastie, T. J., Dudík, M., Chee, Y. E., and Yates, C. J. (2011). A statistical explanation of MaxEnt for ecologists. Divers. Distrib. 17, 43–57. doi:10.1111/j.1472-4642.2010.00725.x
Feng, Lihua, and Hong, Weihu (2009). On the principle of maximum entropy and the risk analysis of disaster loss. Appl. Math. Model. 33 (7), 2934–2938. doi:10.1016/j.apm.2008.10.002
Fielding, A. H., and John, F. B. (1997). A review of methods for the assessment of prediction errors in conservation presence/absence models. Environ. Conserv. 24 (1), 38–49. doi:10.1017/S0376892997000088
Gemmer, M., Fischer, T., Jiang, T., Su, B., and Liu, L. L. (2011). Trends in precipitation extremes in the zhujiang River basin, south China. J. Clim. 24, 750–761. doi:10.1175/2010jcli3717.1
Grell, A., Dudhia, J., and Stauffer, D. R. (1994). A description of the fifth-generation penn state/NCAR mesoscale model (MM5). doi:10.5065/D60Z716B
Gu, X., Qiang, Z., Liu, J., and Zhenghao, Z. (2014). Characteristics, causes and impacts of the changes of the flood frequency in the Pearl River drainage basin from 1951 to 2010. J. J. Lake Sci. 26 (5), 661–670. doi:10.18307/2014.0503
Hallegatte, S., Green, C., Nicholls, R. J., and Corfee-Morlot, J. (2013). Future flood losses in major coastal cities. Nat. Clim. Chang. 3 (9), 802–806. doi:10.1038/nclimate1979
He, F. (2010). Maximum entropy, logistic regression, and species abundance. Oikos 119, 578–582. doi:10.1111/j.1600-0706.2009.17113.x
Huang, T., Chen, J., Huang, F., and Su, Z. (2017). A study of urban waterlogging characteristics in Pearl River delta region based on GIS. J. Guangdong Univ. Technol. 34 (1), 24–30. doi:10.12052/gdutxb.160102
Ji, Zhenming, and Kang, Shichang (2015). Evaluation of extreme climate events using a regional climate model for China. Int. J. Climatol. 35 (6), 888–902. doi:10.1002/joc.4024
Kong, F., Liu, F. L. L., Fang, J., Fang, J. Y., Shi, P. J., and Guo, J. P. (2017). Study on the spatial and temporal distribution characteristics of large-scale regional rainstorms in China from 1961 to 2010. Resour. Environ. Yangtze Basin (04), 631–640.
Lai, C., Shao, Q., Chen, X., Wang, Z., Zhou, X., Yang, B., et al. (2016). Flood risk zoning using a rule mining based on ant colony algorithm. J. Hydrology 542, 268–280. doi:10.1016/j.jhydrol.2016.09.003
Li, S., Wang, Zhaoli, Lai, Chengguang, and Lin, Guangsi (2020). Quantitative assessment of the relative impacts of climate change and human activity on flood susceptibility based on a cloud model. J. Hydrology 588, 125051. doi:10.1016/j.jhydrol.2020.125051
Li, Z., Li, M., and Xia, B. (2020). Spatio-temporal dynamics of ecological security pattern of the Pearl River Delta urban agglomeration based on LUCC simulation. Ecol. Indic. 114, 106319. doi:10.1016/j.ecolind.2020.106319
Liu, B., Wei, Y., Zhang, Y., and Yang, Q. (2017). “Deep neural networks for high dimension, low sample size data,” in 26th International Joint Conference on Artificial Intelligence, IJCAI 2017, 2287–2293. doi:10.24963/ijcai.2017/318
Lyu, Hai Min, Shen, Shui Long, Yang, Jun, and Yin, Zhen Yu (2019). Inundation analysis of Metro systems with the storm water management model incorporated into a geographical information system: A case study in shanghai. Hydrol. Earth Syst. Sci. 23 (10), 4293–4307. doi:10.5194/hess-23-4293-2019
Manfreda, S., and Samela, C. (2019). A digital elevation model based method for a rapid estimation of flood inundation depth. J. Flood Risk Manag. 12. doi:10.1111/jfr3.12541
Mohanty, M. P., H, V., Yadav, V., Ghosh, S., Rao, G. S., and Karmakar, S. (2020). A new bivariate risk classifier for flood management considering hazard and socio-economic dimensions. J. Environ. Manage. 255, 109733. doi:10.1016/j.jenvman.2019.109733
Moss, R. H., Edmonds, J. A., Hibbard, K. A., Manning, M. R., Rose, S. K., van Vuuren, D. P., et al. (2010). The next generation of scenarios for climate change research and assessment. Nature 463 (7282), 747–756. doi:10.1038/nature08823
O’Neill, B. C., Kriegler, E., Ebi, K. L., Kemp-Benedict, E., Riahi, K., Rothman, D. S., et al. (2017). The roads ahead: Narratives for shared socioeconomic pathways describing world futures in the 21st century. Glob. Environ. Change 42, 169–180. doi:10.1016/j.gloenvcha.2015.01.004
O’Neill, B. C., Tebaldi, Claudia, Van Vuuren, Detlef P., Eyring, Veronika, Friedlingstein, Pierre, George, Hurtt, et al. (2016). The scenario model intercomparison project (ScenarioMIP) for CMIP6. Geosci. Model. Dev. 9 (9), 3461–3482. doi:10.5194/gmd-9-3461-2016
Pan, X. D., Zhang, L., and Huang, C. L. (2020). Future climate projection in northwest China with RegCM4.6. Earth Space Sci. 7. doi:10.1029/2019EA000819
Pan, X., and Zhang, L. (2020). Future climate projection of China based on regcm4.6 (2007-2099). National Tibetan Plateau Data Center. doi:10.11888/Meteoro.tpdc.270998
Phillips, S. J., Dudík, M., and Schapire, R. E. (2004). A maximum entropy approach to species distribution modeling. Proc. twenty-first Int. Conf. Mach. Learn. doi:10.1145/1015330.1015412
IPCC (2022). in Climate change 2022: Impacts, adaptation, and vulnerability. Contribution of working group II to the Sixth assessment Report of the intergovernmental Panel on climate change. Editors H.-O. Pörtner, D. C. Roberts, M. Tignor, E. S. Poloczanska, K. Mintenbeck, A. Alegríaet al. (United States: Cambridge University PressPress).
Robbins, J. C. (2016). A probabilistic approach for assessing landslide-triggering event rainfall in Papua New Guinea, using TRMM satellite precipitation estimates. J. Hydrology 541, 296–309. doi:10.1016/j.jhydrol.2016.06.052
Roy, P., Pal, S. C., Chakrabortty, R., Chowdhuri, I., Saha, A., and Shit, M. (2022). Climate change and groundwater overdraft impacts on agricultural drought in India: Vulnerability assessment, food security measures and policy recommendation. Sci. Total Environ. 849, 157850. doi:10.1016/j.scitotenv.2022.157850
Sado-Inamura, Yukako, and Fukushi, Kensuke (2019). Empirical analysis of flood risk perception using historical data in tokyo. Land Use Policy 82, 13–29. doi:10.1016/j.landusepol.2018.11.031
Shannon, C. E. (1948). A mathematical theory of communication. Bell Syst. Tech. J. 27 (3), 379–423. doi:10.1002/j.1538-7305.1948.tb01338.x
Shipley, B. (2009). From plant traits to vegetation structure: Chance and selection in the assembly of ecological communities. Unites States: Cambridge University Press. doi:10.1017/CBO9780511806971
Sørensen, R., Zinko, U., and Seibert, J. (2005). On the calculation of the topographic wetness index: Evaluation of different methods based on field observations. Hydrol. Earth Syst. Sci. 10, 101–112. doi:10.5194/hess-10-101-2006
Swets, J. A. (1988). Measuring the accuracy of diagnostic systems. Sci. (New York, N.Y.) 240 (4857), 1285–1293. doi:10.1126/science.3287615
Tellman, B., Sullivan, J. A., Kuhn, C., Kettner, A. J., Doyle, C. S., Brakenridge, G. R., et al. (2021). Satellite imaging reveals increased proportion of population exposed to floods. Nature 596 (7870), 80–86. doi:10.1038/s41586-021-03695-w
Viglione, A., Baldassarre, G. D., Brandimarte, L., Kuil, L., Carr, G., Salinas, J. L., et al. (2013). Insights from socio-hydrology modelling on dealing with flood risk - roles of collective memory, risk-taking attitude and trust. J. Hydrology 518, 71–82. doi:10.1016/j.jhydrol.2014.01.018
Wang, J. F., and Xu, C. D. (2017). Geodetectors: Principles and perspectives. J. Geogr. 72 (1), 19. doi:10.11821/dlxb201701010
Wang, Z., Lai, C., Chen, X., Yang, B., Zhao, S., and Bai, X. (2015). Flood hazard risk assessment model based on random forest. J. Hydrology 527, 1130–1141. doi:10.1016/j.jhydrol.2015.06.008
West, A. M., Kumar, S., Brown, C. S., Stohlgren, T. J., and Bromberg, J. (2016). Field validation of an invasive species Maxent model. Ecol. Inf. 36, 126–134. doi:10.1016/j.ecoinf.2016.11.001
Wu, C., Huang, G., Yu, H., Chen, Z., and Ma, J. (2014a). Impact of climate change on reservoir flood control in the upstream area of the beijiang River basin, south China. J. Hydrometeorol. 15, 2203–2218. doi:10.1175/jhm-d-13-0181.1
Wu, C., Huang, G., and Yu, H. (2014b). Prediction of extreme floods based on CMIP5 climate models: A case study in the beijiang River basin, south China. Hydrol. Earth Syst. Sci. 19, 1385–1399. doi:10.5194/hess-19-1385-2015
Xian, Y., Lu, Y., and Liu, G. (2022). Is climate change threatening or beneficial to the habitat distribution of global pangolin species? Evidence from species distribution modeling. Sci. Total Environ. 811, 151385. doi:10.1016/j.scitotenv.2021.151385
Xu, J., Zhang, Z., Zhao, X., Bin, L., and Ling, Y. (2015). Spatial-Temporal characteristics and driving forces of urban sprawl for major cities of the Pearl River Delta region in recent 40 years. J. acta Sci. Nat. Univ. Pekin. doi:10.13209/j.0479-8023.2015.122
Yang, X. l., Ding, Jie hua, and Hou, Hui (2013). Application of a triangular fuzzy AHP approach for flood risk evaluation and response measures analysis. Nat. Hazards (Dordr). 68 (2), 657–674. doi:10.1007/s11069-013-0642-x
Zhang, W., Villarini, G., Vecchi, G. A., and Smith, J. A. (2018). Urbanization exacerbated the rainfall and flooding caused by hurricane Harvey in Houston. Nature 563 (7731), 384–388. doi:10.1038/s41586-018-0676-z
Zhang, X. N., Luo, J., Chen, L., and Li, H. (2000). Zoning of Chinese flood hazard risk. J. J. Hydraulic (03), 3–9. doi:10.13243/j.cnki.slxb.2000.03.001
Zhao, G., Pang, B., Xu, Z., Peng, D., and Xu, L. (2019). Assessment of urban flood susceptibility using semi-supervised machine learning model. Sci. Total Environ. 659, 940–949. doi:10.1016/j.scitotenv.2018.12.217
Zhi, G., Liao, Z., Tian, W., and Wu, J. (2020). Urban flood risk assessment and analysis with a 3D visualization method coupling the PP-PSO algorithm and building data. J. Environ. Manag. 268, 110521. doi:10.1016/j.jenvman.2020.110521
Keywords: Flood risk, Climate change, MaxEnt model, RCP scenarios, SSP scenarios, The Pearl River Delta
Citation: Zuo D, Wu C, Zheng Y, Chen X and Wang L (2023) Climate change and human activity impacts on future flood risk in the Pearl River Delta based on the MaxEnt model. Front. Earth Sci. 10:1053829. doi: 10.3389/feart.2022.1053829
Received: 26 September 2022; Accepted: 14 November 2022;
Published: 12 January 2023.
Edited by:
Yuliang Zhou, Hefei University of Technology, ChinaReviewed by:
Jiefeng Wu, Nanjing University of Information Science and Technology, ChinaCopyright © 2023 Zuo, Wu, Zheng, Chen and Wang. This is an open-access article distributed under the terms of the Creative Commons Attribution License (CC BY). The use, distribution or reproduction in other forums is permitted, provided the original author(s) and the copyright owner(s) are credited and that the original publication in this journal is cited, in accordance with accepted academic practice. No use, distribution or reproduction is permitted which does not comply with these terms.
*Correspondence: Lina Wang, bGluYXdhbmcyMDA0QDE2My5jb20=
Disclaimer: All claims expressed in this article are solely those of the authors and do not necessarily represent those of their affiliated organizations, or those of the publisher, the editors and the reviewers. Any product that may be evaluated in this article or claim that may be made by its manufacturer is not guaranteed or endorsed by the publisher.
Research integrity at Frontiers
Learn more about the work of our research integrity team to safeguard the quality of each article we publish.