- 1Institute of Construction Engineering, Changzhou Vocational Institute of Engineering, Changzhou, Jiangsu, China
- 2Nanjing Center of China Geological Survey, Changzhou, Jiangsu, China
To investigate the failure mode and strength characteristics of rock-like materials containing two non-coplanar closed discontinues, and the influence of crack attitude on the shear failure of rock mass, a series of direct shear tests are carried out on rock-like materials containing two pre-existing cracks of different attitudes, one of them is horizontal crack, and the other is inclined crack. The specimens containing pre-existing cracks of four inclinations (0°, 45°, 135°, and 180°) and three dip angles (30°, 60°, and 90°) are prepared, and the failure form and stress-displacement curve are recorded during the tests. The results show that the attitude of the crack has a significant effect on the failure form and strength characteristics. In positive shear, the shear stress increases slowly and the crack initiation of the crack occurs relatively late, and in negative shear, the shear stress increases rapidly and the crack initiation stage appears earlier. Under the normal stress of 1 MPa, the fracture surface fluctuates along the pre-existing cracks, and the difference in shear strength of each specimen is less than 1.0 MPa. Under the normal stress of 5 MPa, the fracture surface mostly distributes along the horizontal direction, and the difference in shear strength of each specimen is about 2.0 MPa. Under the same level of normal stress, the crack initiation and peak stress vary with the attitude of pre-existing crack, and the variation trend of peak stress is changed when the normal stress increased due to the difference in failure form. It is calculated that the ratio of crack initiation stress to peak stress ranges from 0.61 to 0.80.
Introduction
In rock engineering, the mechanical behavior of the structural plane has a significant influence on the deformation and failure of rock mass. The mechanism of discontinuity propagation and coalescence determines the failure form and strength characteristics of rock mass. Therefore, scholars began to deepen the study on the failure mechanism of rock mass with multiple cracks from the middle of the 20th century (Goodman et al., 1968; Toshikazu, 1988; Li and Zhu, 1992).
According to the shear failure theory of rock bridge proposed by Lajtai (1969), Shen et al. (1995) proposed two crack propagation modes, namely, wing crack caused by tensile stress and secondary crack caused by shear stress. It is pointed out that the relative position of the crack, that is, the angle between the connecting line of two adjacent ends of cracks and the shear direction, will have a great influence on the internal stress field and the failure mode of the rock mass. Wong et al. (1998, 2014) and Bobet et al. (1998) systematically classified the propagation and convergence modes of two fractures arranged at different positions under uniaxial compression.
A lot of laboratory experiments and numerical simulations have been carried out in the failure mechanism research of rock mass with multiple parallel cracks (Yang, 2013; Xiao, 2015). The results show that the peak strength and the final failure mode of rock mass will be affected by the dip angle, location and length of pre-crack and length of rock bridge, and a long rock bridge results in a complicated failure mode (Wong, 2015; Cao, 2016). Triaxial test results indicated that the initiation and propagation process of wing crack are controlled by confining pressure (Zhou, 2014). With the increase of confining pressure, the failure mode of cracked rock mass will change from tensile brittle failure to ductile failure (Zhou, 2015). Crack initiation mode transforms from shear crack to tensile crack as the brittleness index increases; the coalescence mode transforms from shear crack coalescence to the coalescence of tensile crack and shear crack; the failure mode transforms from shear failure to the mixed tension-shear failure, then to splitting failure as the brittleness index increases (Zhou, 2018). According to the slope of stress-displacement curve and the propagation process of cracks, the shear test can be divided into four or five stages: linear elastic stage, crack initiation stage, peak stage, post-peak stage, and residual stage. A serious compression-shear test research on rock mass with coplanar intermittent cracks are conducted by Hu et al. (2008), and shear strength calculation formulas of rock mass are established by weighted average method, considering the crack connectivity ratio as the weight. It is found that it is easier to form tensile failure when the rock bridge is relatively long, and easier to produce shear failure when it is short.
Direct shear tests of intermittent cracks are carried out, and the weakening laws of rock bridge in the shear process are revealed (Liu, 2010; Xia, 2010; Tang, 2012). Based on the direct shear test, a mechanical weakening model of rock bridge is established by introducing a weakening degree value δ to characterize the weakening degree of mechanical parameters of rock bridge. The calculation results are consistent with Jennings’ internal friction strength criterion and the shear strength of non-cohesive rock bridge. The model not only explains the weakening mechanism of the rock bridge in microscopic view, but also corrects the Jennings shear strength criterion of non-persistent cracks by the parameters of equivalent cohesion and internal friction angle.
The fracture characteristics of anti-dip cracks under compression-shear load are studied in laboratory tests (Zhang et al., 2018). The results show that as the increase of pre-crack dip angle, three failure modes are obtained, and the shear strength first increases and then decreases. Uniaxial compression tests on rock-like materials with non-persistent cracks are carried out and stress-induced damage progression and acoustic emission (AE) are observed (Lee et al., 2011; Zhou, 2019; Cao et al., 2020; Zhou, 2021). The results show that the crack initiation stress and propagation path are affected by the included angle of pre-cracks. At the same time, it is found that multiple failure modes such as splitting, sliding, and mixing type are formed with the crack dip angle and length change. It is found that the process zone nucleation in granite are related to the clustering of grain-scale microcracks, and the clustering of microcracks is insignificant in the brittle failure of sandstone (Zhou, 2021). Triaxial compression tests on sandstone samples with pre-cracks are carried out by Huang et al. (2016). It is obtained that the stress-strain curve of the samples fluctuant clearly; compared with the confining pressure, the distribution of pre-cracks has greater influence on the deformation, strength characteristics and failure mode of rock mass.
Furthermore, 3D cracking has been studied widely by a number of groups. Experimental studies of crack extension from flaws introduced into blocks of single-phase, dense resin materials were conducted by Adams (1978), the result suggest that the extension of secondary cracks may result in more damage. Fracture of rocks containing a multitude of pre-existing cracks is discussed by Germanovich (1994), and it is found that tear or shear type fracture mechanisms is related to the properties of the rock, the system of pre-existing cracks, and the type of loading. 3-D crack growth in compression was qualitatively different from the two-dimensional case. Several tests undertaken on samples with single internal cracks show that there are intrinsic limits on 3-D growth of wing cracks produced by a single pre-existing crack (Dyskin, 2003). Dynamic laboratory tests are performed on normal-strength concrete and 3D-printed artificial rock samples with 3D embedded flaws, the results show that under high strain rate loading, wing cracks generated at 3D flaw tips lead to splitting failure of the sample, while shear cracks formed at 2D flaw tips result predominant shear failure of the sample (Zhou et al., 2020). The tests also show that higher strain rates produce smaller fragments due to specimen crushing (Bi et al., 2020).
A series of uniaxial compression experiments performed on sandstone specimens containing a pre-existing 3-D surface flaw indicate that, The generation of wing cracks, anti-wing cracks, and far-field cracks depend on the geometry of the pre-existing surface flaw, and flaw depth and flaw inclination influence the crack initiation stress (Lu et al., 2015). Four modes of crack initiation and five modes of crack coalescence are observed in PMMA specimens with two 3D pre-existing cross-embedded flaws (Zhou, 2018). Three-dimensional printing (3DP) method was adopted to fabricate artificial rocks containing pre-existing 3D internal flaws, and the result show that the maximum crack propagation velocity in single flawed specimens is higher than that in double flawed samples. The continuous propagation of the secondary cracks developed after the peak stress lead to the failure of the flawed samples (Zhu, 2018; Zhou, 2019). In addition, crack propagation and coalescence behaviors in rock specimens containing pre-existing open flaws under uniaxial compression are investigated using the novel conjugated bond-based peridynamics (BB-PD), the BB-PD model is found to be effective for simulating rock fracture problems under compression, and the numerical results are in good agreement with the experimental observations (Wang, 2017).
The shear failure of rock mass with nonpersistent cracks is simulated with PFC2D and PFC3D by Yue et al. (2017). The discrete element simulations demonstrate that the macro-scale shear zone resulted from the progressive failure of the tension-induced micro-cracks, and the proportion of rock bridge length on the shear plane has a significant effect on the failure mode; when the normal stress changes, different failure characteristics can be obtained in specimens; the generation rate of microcracks is significantly different at different loading stages.
Most of the researches on the shear failure of rock mass with multiple closed cracks focus on the propagation and connection law between multiple parallel cracks, and the influence of crack distribution on the failure mode.
When the rock mass contains multiple cracks of different inclinations and dip angles, the shear failure behavior and the propagation behavior of cracks need to be further studied, and the relationship between crack initiation shear stress and peak shear stress need to be fully discussed. In this study, the failure process of cracked rock mass with two pre-cracks of different attitudes under shear load is studied by laboratory direct shear test, and the influence of attitude on the shear failure mode and shear strength of rock mass is discussed. The ratio of crack initiation stress and peak shear stress in the tests will be obtained.
Laboratory test programs
Specimen design
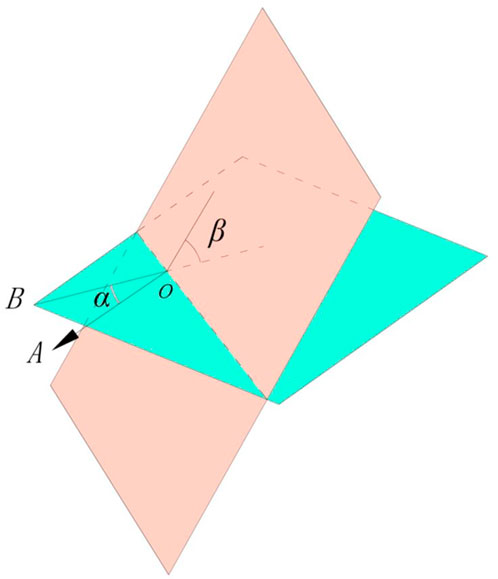
The direct shear test is carried out on the specimen sized 150 mm × 150 mm × 150 mm with two pre-existing cracks. The length of the two pre-existing cracks is 30 mm, and the opening width is less than 1 mm. The first of them is a horizontal crack, the second is an inclined crack, and change the inclination and dip angle of the second crack in different specimens. As shown in Figure 1, O-A represents the loading direction of the upper shear box, as well as the 0° inclinations; O-B represents the inclination of the second crack, recorded as α; the angle between the second crack and the horizontal plane is recorded as the dip angle β. The attitude of the second crack can be controlled by changing the value of α and β. Four angles of α = 0°, 45°, 135°, and 180° and three angles of β = 30°, 60°, and 90° are selected to study the influence of crack attitude on the shear failure process. To study the effect of normal stress on the shear failure process of multiple cracks, two normal loads of 1.0 and 5.0 MPa are applied.
Specimen preparation
The two intermittent cracks are simulated by pre-cracks in specimens which are made of similar materials. By mixing cement, fine sand, and water in the ratio of 1:1:0.4 (Zhao, 2012), rock-like material specimens were made for laboratory test. Meanwhile, the closed pre-cracks of different attitudes can be made by the following two steps: 1) insert a thin metal sheet into the specimen during the initial setting period (as shown in Figure 2A); 2) Pull it out before the end of the initial setting. Then a rock-like specimen with two pre-cracks of different attitudes is accomplished (as shown in Figure 2B).
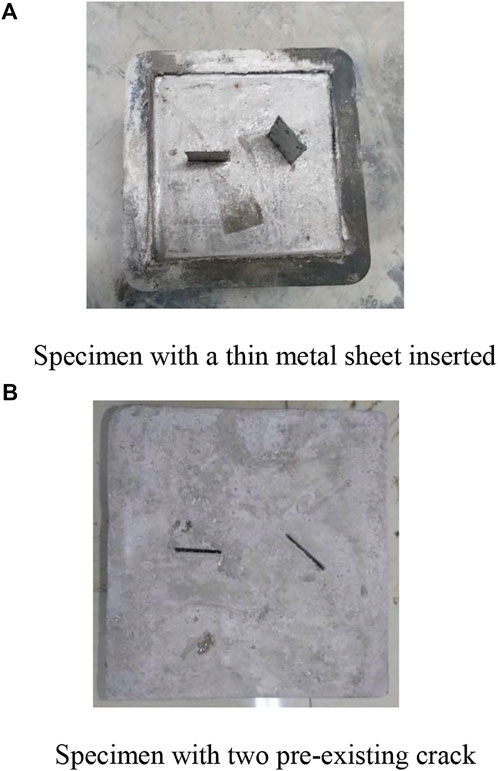
FIGURE 2. Specimen preparation. (A) Specimen with a thin metal sheet inserted, (B) Specimen with two pre-existing crack.
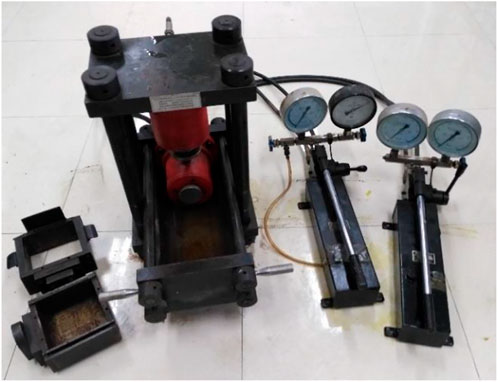
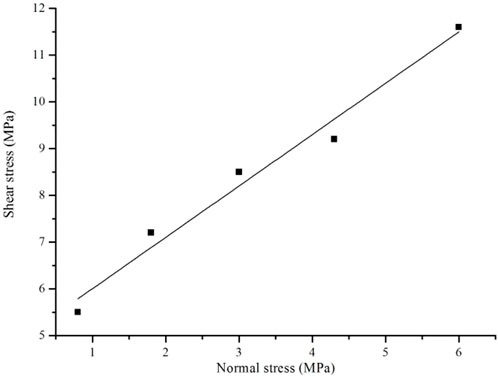
Direct shear tests are carried out on intact specimens under different normal stresses (as shown in Figure 3), and the shear strengths of each specimens are obtained and plotted in Figure 4. The linear equation in Figure 4 is obtained by fitting as follows:
where σ is the normal stress, MPa; τ is the shear strength of specimens, MPa. The results show that the cohesion c is 4.70 MPa, and the internal friction angle φ is 43.2° for the intact specimen. The direct shear test equipment is shown in Figure 3, and shear stress and shear displacement are recorded and curves are drawn during the test.
The results of direct shear test
Direct shear test results under normal stress of 1 MPa
With the normal stress of 1 MPa, shear tests are carried out on specimens with two different attitude pre-cracks. The shear fracture surface and failure character of each specimen are recorded, and the typical failure path sketches are drawn, as shown in Figures 5–8.
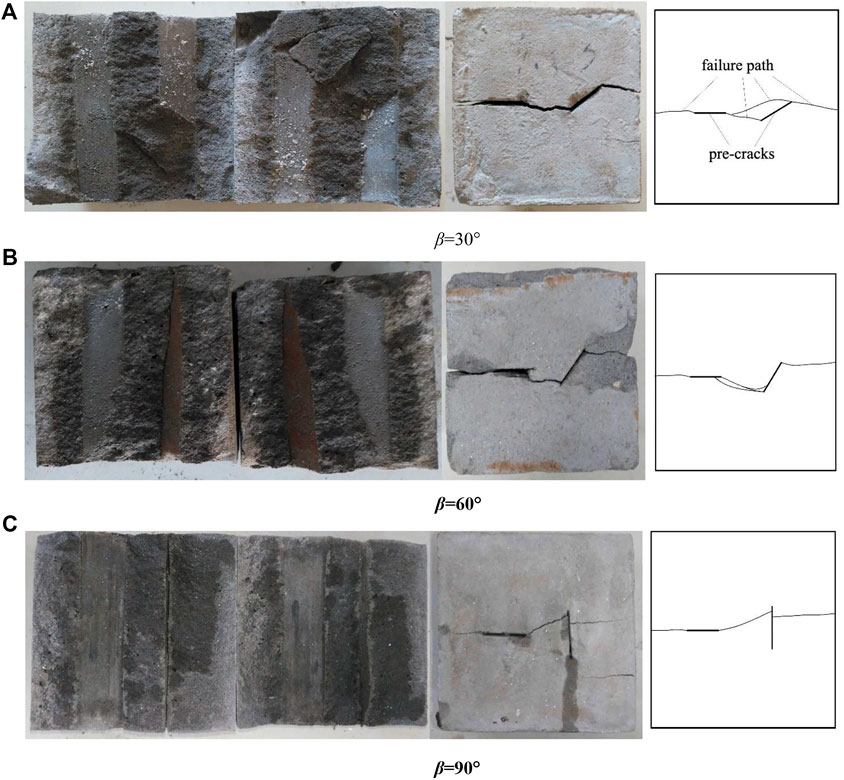
FIGURE 5. Shear failure surface and form of specimens under normal stress of 1 MPa (α = 0°). (A) β = 30°, (B) β = 60°, (C) β = 90°.
As shown in Figure 5, the failure forms of the horizontal crack of each sample are mostly the same, all specimens fractured along the horizontal cracks, and the fracture surface is relatively flat. On the other side, some different phenomena are obtained in the failure form of inclined pre-cracks. The failure modes, shear failure occurs along the two pre-cracks, are both observed in the specimens of α = 0°, β = 30°, and α = 0°, β = 60°. However, the fracture surface cut through the vertical crack in the specimen of α = 0°, β = 90°. The failure surface of the rock bridge is comparatively rough in these specimens, and no obvious scratches and debris are observed, which indicates that the fracture in the rock bridge is mainly tension failure.
The fractured specimens of α = 45° are shown in Figure 6. It can be observed that the specimens of α = 45°, β = 30° and α = 45°, β = 60° fracture along the two cracks, and the fluctuation of the failure surface is consistent with pre-cracks. Part of the rock bridge fracture surface is relatively rough, mainly tensile failure. The specimens of α = 45°, β = 90° fracture along the horizontal crack, and no separation and dislocation occurred in the vertical crack. The failure surface is relatively flat with slight fluctuations.
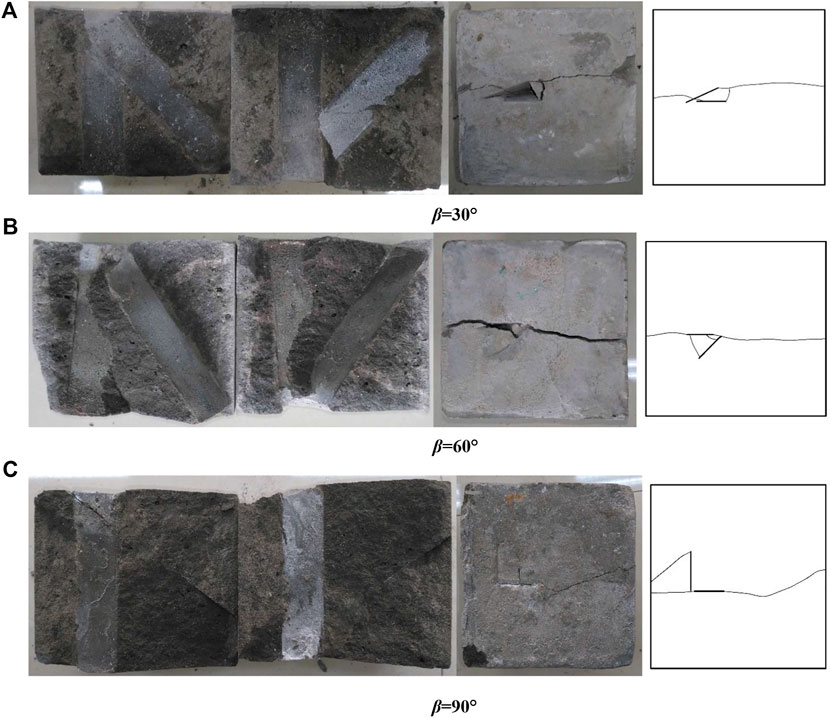
FIGURE 6. Shear failure surface and form of specimens under normal stress of 1 MPa (α = 45°). (A) β = 30°, (B) β = 60°, (C) β = 90°.
The fractured specimens of α = 135° are shown in Figure 7. In the specimens of α = 135°, all fracture occurs along the inclined pre-cracks. Obvious scratches are formed on the fracture surface of the rock bridge. Affected by the inclined crack, the horizontal crack is not separated completely, and the failure surface fluctuation is mainly controlled by the attitude of the inclined crack. For the samples of α = 135°, β = 90°, part of the shear surface is distributed along the horizontal and vertical cracks, while the other part is cut through the rock bridge via the end of the vertical crack, with some undulation on the fracture surface.
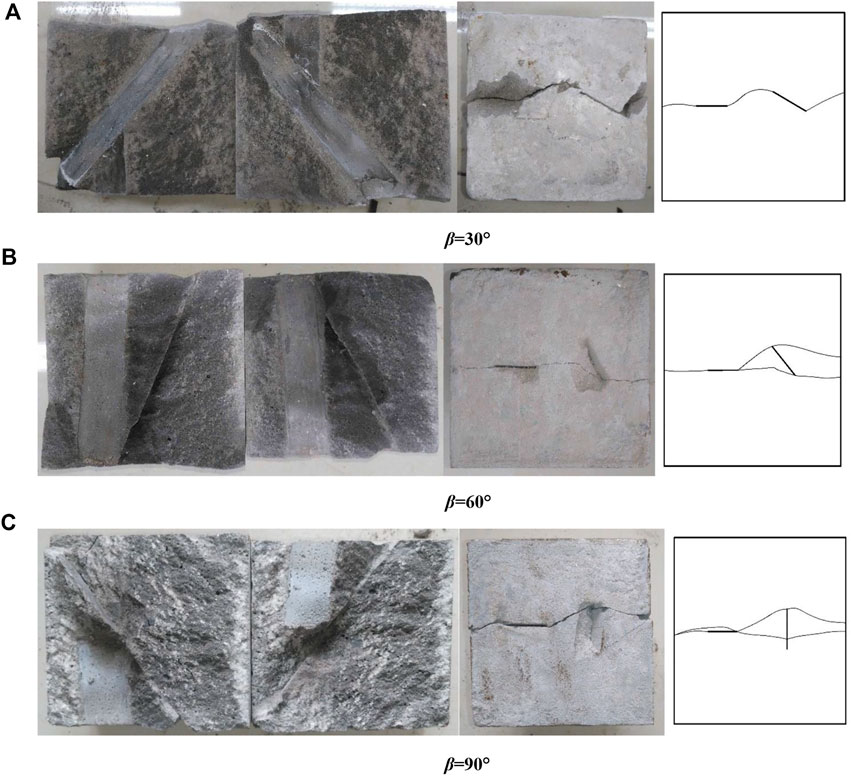
FIGURE 7. Shear failure surface and form of specimens under normal stress of 1 MPa (α = 135°). (A) β = 30°, (B) β = 60°, (C) β = 90°.
The fractured specimens of α = 180° are shown in Figure 8. Shear failure modes of the two specimens are the same when α = 180°. The shear fracture surface distributes along the two pre-cracks, and no crush zone is observed on the surface, but there is an obvious appearance of scratch. The phenomenon of climbing effect occurs during the shear test. The rock bridge fractures along the connecting line of the adjacent ends of two cracks, and the failure surface fluctuates with the attitude of pre-cracks.
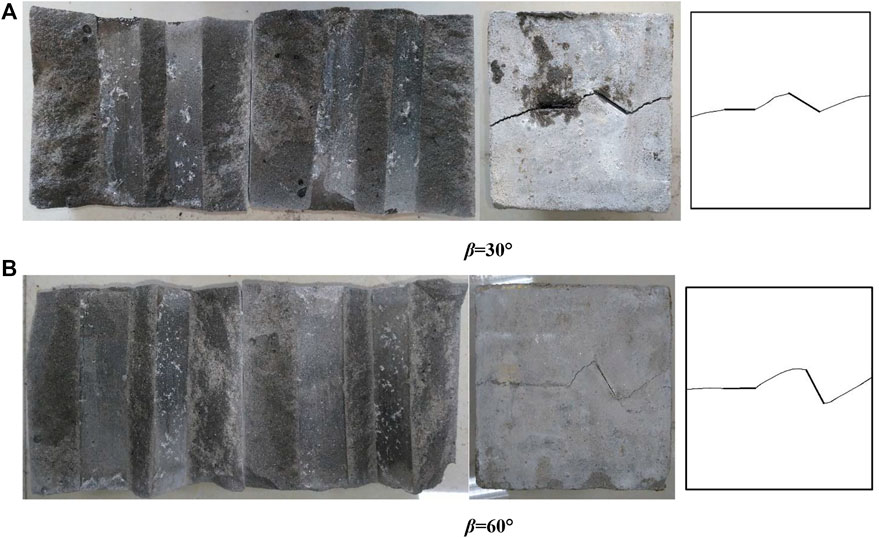
FIGURE 8. Shear failure surface and form of specimens under normal stress of 1 MPa (α = 180°). (A) β = 30°, (B) β = 60°.
It is found that the strike of the inclined crack is perpendicular to the shear direction for the specimens of α = 0° and α = 180°, and the shear failure process is quite different because of the attitude of crack. According to the fracture surface, the failure mode of negative shear is mainly tensile failure, while that of positive shear is mainly shear failure, with climbing and gnawing effect at the same time. According to the view of the failure path, the failure mode of rock bridge is to connect the adjacent ends of two cracks with a straight path, and the failure path of specimens distribute along the two pre-existing cracks; the specimen will fracture along the horizontal direction when the inclined crack is upright.
In the specimens of α = 45° and α = 135°, the propagation and coalescence form of the pre-existing crack is almost the same. According to the fracture surface, shear deformation is observed in both cracks when β = 30°, and the scratch on the surface is obvious. The failure surface morphology is controlled by the attitude of the inclined crack when β = 60°, and the specimen is deformed partially or wholly along the inclined crack. The scratch is less and the fracture mode of rock bridge is mainly tensile failure when β = 60°. More scratches occur on the fracture surface of the specimens of β = 90°, and the grinding effect is obvious. The fracture paths of these samples are relatively complex, and undulation of fracture surface is controlled by the inclined pre-crack. The difference of fracture paths between specimen of α = 45°, β = 90° and α = 135°, β = 90° is caused by the relative positions of loading boundary and structural plane.
With the normal stress of 1 MPa, the shear stress-shear displacement curve obtained from the test is shown in Figure 9. It is indicated that the curve of each specimen can be divided into four stages: elastic stage, crack initiation stage, peak stage, and residual stage. In elastic stage, the shear stress increases linearly with the shear displacement; then the slope of the curve gradually decreases in crack initiation stage, indicating that microcracks are generated in the sample; in the peak stage, the shear stress reaches the maximum, then decreases gradually; finally, shear stress reduced to residual strength, and the specimen is cut through by the fracture surface. When α = 0° and α = 180°, the shear stress-shear displacement curves of the specimen are quietly different, which is mainly reflected in the differences in the appearance of peak strength, and the slope of the curve in elastic stage. During elastic stage, the slope of the shear stress-shear displacement curve is lower when α = 180°, the shear stress increases slightly, and the crack initiation occurs relatively late. On the contrary, the shear stress rises rapidly when α = 0°, and crack initiation occurs earlier. The crack initiation stage of α = 0°, β = 60° specimen is shorter, and the peak shear stress appears earlier. In addition, the crack initiation stage of α = 0°, β = 30° specimen is relatively longer. As shown in Figure 9A, the shear strength of specimens α = 180°, β = 60° and α = 0°, β = 60° is higher, while specimens α = 0°, β = 90° is lower.
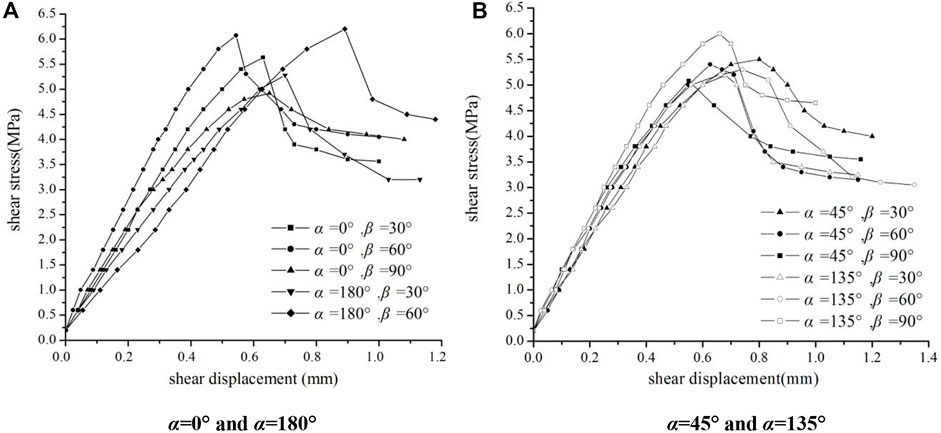
FIGURE 9. Shear stress-shear displacement curve (normal stress is 1 MPa). (A) α = 0° and α = 180°, (B) α = 45° and α = 135°.
The shear stress rises rapidly with the increasement of shear displacement when negative shear, while the slope of the curve in elastic stage is lower when positive shear. It is indicated that the pre-crack is further closed by the compression and shear stress in the case of positive shear, which leads to greater shear displacement in the elastic stage. In negative shear, part of the fracture surface does not cut through the pre-crack, but the inner of the rock-like material, so the slope of curve is larger during the elastic stage.
Compared with Figure 9A, the difference of shear stress-shear displacement curves between the specimens of α = 45° and α = 135° is smaller. The slope of the curve in elastic stage of the specimen β = 90° is smaller, and the peak stress appears earlier, while the peak stress of the specimen β = 30° appears later. In terms of shear strength, the strength of each sample is similar in this group. With the normal stress of 1 MPa, the shear strength is 5.2–6.0 MPa, and the strength is higher when β = 90°. The results show that the peak strength of each sample is almost the same, and the corresponding displacement range of each stage is slightly different. The influence of dip angle of pre-existing crack on the shear strength is weakened, but the influence of inclination is increased.
Direct shear test results with normal stress of 5 MPa
Direct shear tests are carried out on each specimen with the normal stress of 5 MPa, and the failure mode of the specimens obtained is shown in Figures 10–13.
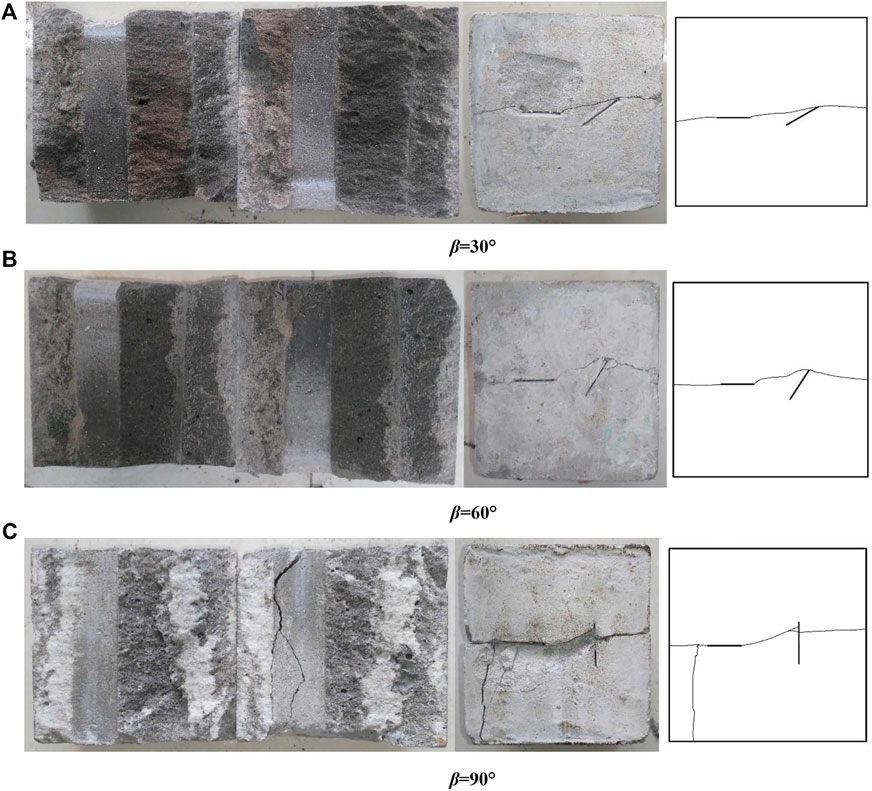
FIGURE 10. Shear failure surface and form of specimens under normal stress of 5 MPa (α = 0°). (A) β = 30°, (B) β = 60°, (C) β = 90°.
The fractured specimens of α = 0° are shown in Figure 10. With the increase of normal stress, the failure mode of the specimens α = 0° is different from Figure 5. No relative displacement occurs along the inclined crack, and the failure path connects the farther end of the inclined crack and the horizontal crack. The fracture surface is nearly horizontal distribution without fluctuation overall. There are obvious scratches on the fracture surface, which are mainly concentrated near the pre-existing crack. Besides, a significant grinding effect is observed in the rock bridge.
The fractured specimens of α = 45° are shown in Figure 11. The fracture surface of the specimen α = 45° is nearly horizontal distribution, and no separation and displacement occur in the inclined crack. The attitude of the crack has little effect on the failure form in this group specimen. There are obvious scratches on the failure surface, and some wedges are formed in the intersection of the two cracks.
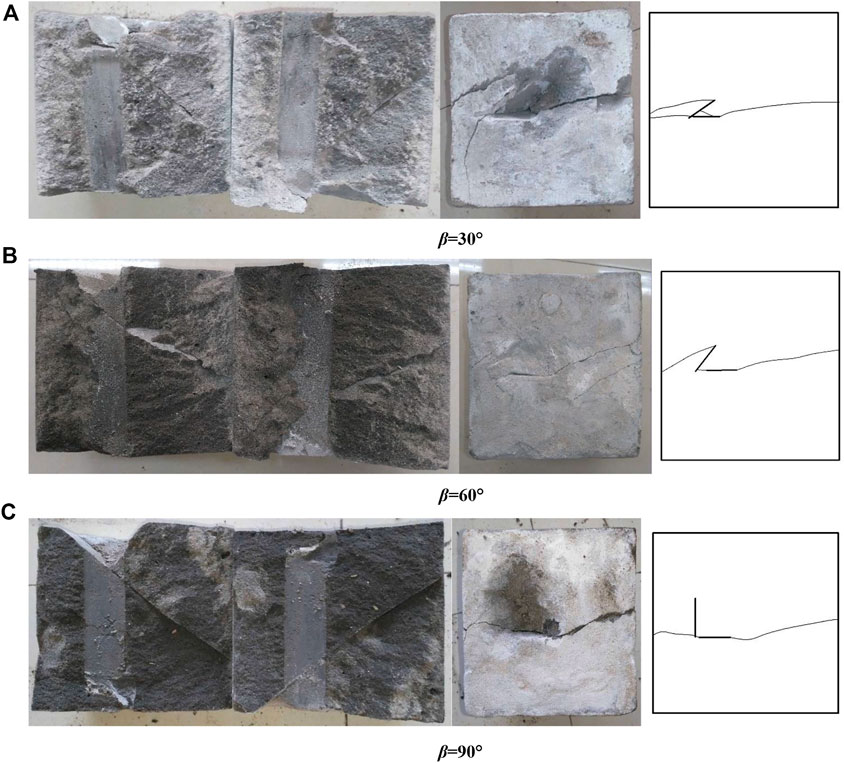
FIGURE 11. Shear failure surface and form of specimens under normal stress of 5 MPa (α = 45°). (A) β = 30°, (B) β = 60°, (C) β = 90°.
The fractured specimens of α = 135° are shown in Figure 12. The fracture surface is significantly affected by the inclined crack. Separation and displacement are both occurring within the two pre-existing crack. The failure surface fluctuates along the attitude of the crack, and the scratches and crush zone are clearly observed on the failure surface.
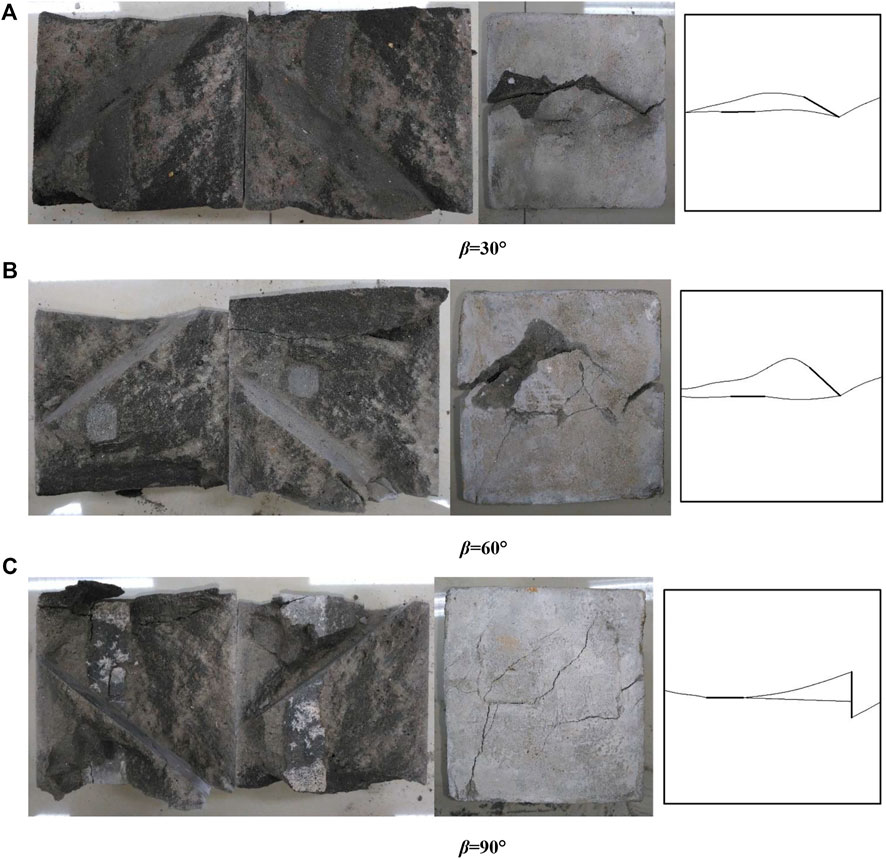
FIGURE 12. Shear failure surface and form of specimens under normal stress of 5 MPa (α = 135°). (A) β = 30°, (B) β = 60°, (C) β = 90°.
The fractured specimens of α = 180° are shown in Figure 13. Under the normal stress of 5 MPa, the failure forms of the two specimens are similar. The failure form of the inclined crack is grinding and crushing rather than relative displacement, with a large number of scratches and obvious dilatancy. The failure path of the rock bridge is initially controlled by the inclined crack, which has some fluctuation, and then gradually changes to the horizontal direction after grinding and crushing.
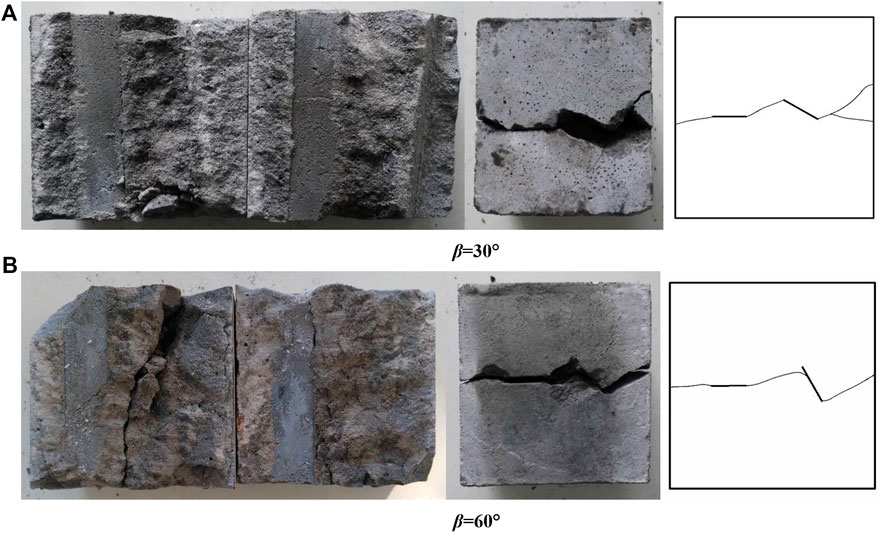
FIGURE 13. Shear failure surface and form of specimens under normal stress of 5 MPa (α = 180°). (A) β = 30°, (B) β = 60°.
The shear stress-shear displacement curves of the specimens are shown in Figure 14 when the normal stress increases to 5 MPa. The curves of the specimens are similar to that of the specimens under normal stress of 1 MPa when α = 0° and 180°, with the increasing in shear strength. The strength of specimens α = 180°, β = 30° and α = 0°, β = 90° is relatively low. As the specimen do not fracture along the inclined crack in negative shear, and the fracture path runs through the inner of specimen, so the shear stress rises rapidly in elastic stage, and the crack initiation stage is relatively short, which result in an earlier appearance of the peak stress and a higher shear strength. In positive shear, the shear stress rises slowly and the peak stress appears relatively later after the displacement and grinding of the inclined crack. The shear strength of the specimens is 9.6–11.4 MPa.
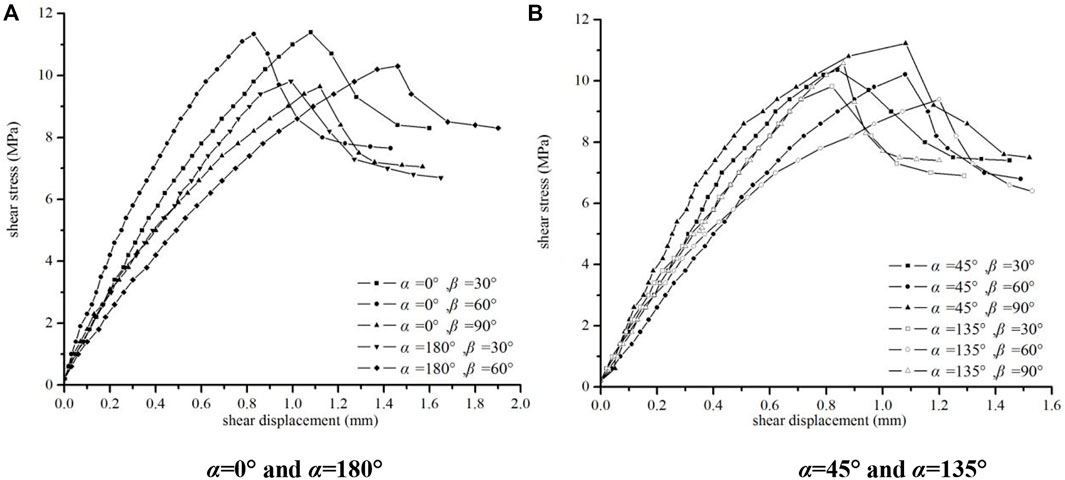
FIGURE 14. Shear stress-shear displacement curve (normal stress is 5 MPa). (A) α = 0° and α = 180°, (B) α = 45° and α = 135°.
The shear stress-shear displacement curves of specimens α = 45° and α = 135° are similar under the normal stress of 5 MPa, and the shear strength of specimens β = 90°is relatively high, which is due to the fact that no relative displacement occurs in the vertical crack, and the specimen fracture along the horizontal crack. From the shear strength curve and the fracture surface, it can be observed that the shear strength of α = 45° specimen is slightly higher than that of α = 135°, it is because that the area of the pre-crack on the fracture surface is larger in α = 135° specimen, and the shear resistance to overcome is smaller, so the shear strength is relatively lower.
Comparison of crack initiation stress and peak strength under different normal stresses
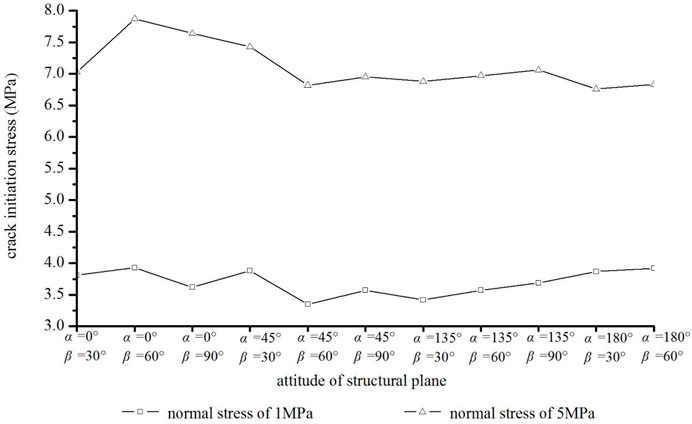
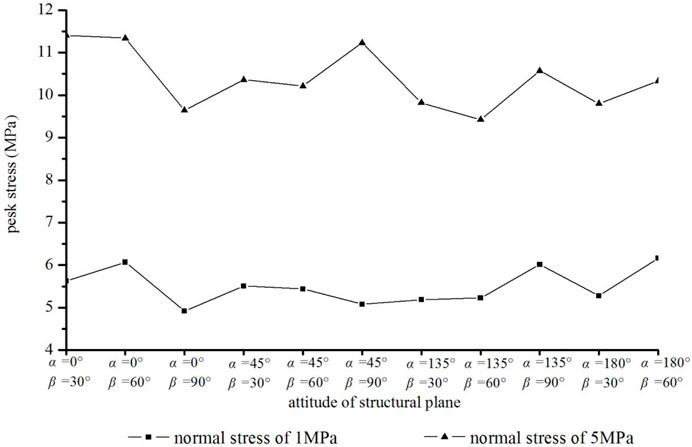
Under the normal stresses of 1 and 5 MPa, the crack initiation and peak shear stress of the specimens are shown in Figures 15, 16. It is indicated that under the same level of normal stress, the crack initiation shear stress of each specimen is relatively close, and the difference is less than 1.0 MPa, while the difference of peak shear stress is 1.0–3.0 MPa. Furthermore, the relationship between the crack initiation stress and the peak stress of each sample varies with the attitude of the crack, that is, the peak stress of the specimen with larger crack initiation stress is not necessarily higher, and the strength relationship of each specimen is different under the two-level normal stress.
Figure 15 shows that under the same normal stress, the crack initiation shear stress of each sample is similar. The stress of α = 45° and α = 135° specimens is lower, while that of the specimen α = 0° and α = 180° is higher. It is because that the pre-crack intersects the shear direction at a small angle when α = 45° and α = 135°, which conducive to shear failure. With the increasement of normal stress, the variation trend of the curve is almost the same, but the fluctuation becomes more severe.
Figure 16 shows that the difference in peak stress of each sample is obvious. When the normal stress is 1 MPa, the strength of specimen α = 0°, β = 30°, and 60° is higher, while the strength of specimen α = 0° and β = 90° is lower, with a difference of about 1.2 MPa. When the normal stress rises to 5 MPa, the peak stress difference increases to 2.0 MPa due to the change in failure mode of some specimens, and the variation trend of peak stress curve is changed. In general, the shear strength of α = 45° and α = 135° specimens is slightly higher.
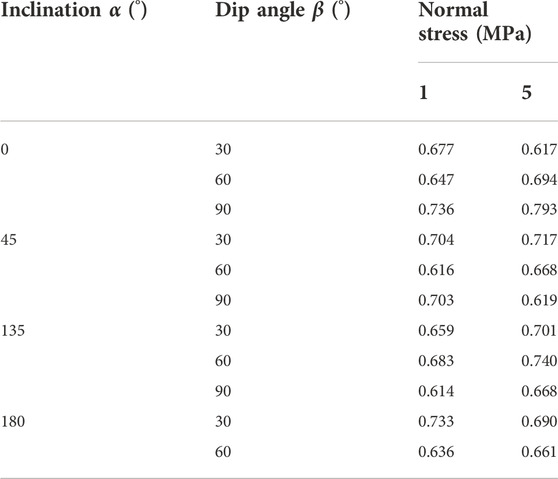
To study the relationship between crack initiation and peak stress of each specimen, the ratio of the above two stress for each specimen is calculated and listed in Table 1.
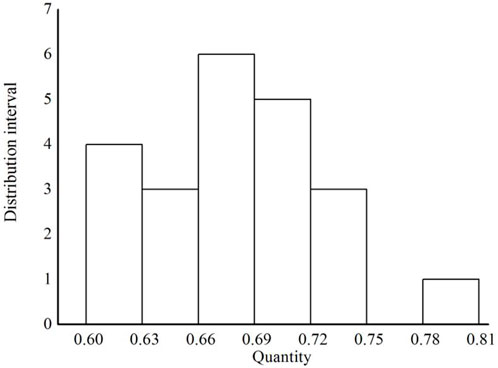
It can be found from the table that the ratio of crack initiation and peak shear stress of each specimen ranges from 0.61 to 0.80, the minimum value is 0.614, which appears in the specimen α = 135°, β = 90°, and the maximum value is 0.793, which appears in the specimen α = 0°, β = 90°. Drawing the above ratios into a columnar statistical chart (as shown in Figure 17), it can be found that the ratio of the initial crack stress to the peak stress is mainly concentrated between 0.60 and 0.75, which has a certain statistical law. According to the crack initiation stress of the rock-like material, the peak shear strength of can be estimated (Bobet and Einstein, 1998, Lajtai, 1969, Yin et al., 2014, Zhou et al., 2013).
Conclusion
Based on the laboratory direct shear test, the crack propagation and strength law of rock-like materials with two closed cracks under shear load are studied, and the failure form and load-displacement curves are recorded and compared. The conclusions of this research are listed as follows:
(1) Under the normal stress of 1 MPa, the attitude of the crack has a significant effect on the shear failure form. In positive shear, with the increasing of shear displacement, the shear stress increases slowly and the crack initiation of the crack occurs relatively late, and the sliding of pre-cracks is the main failure form. Otherwise, in negative shear, the shear stress increases rapidly and the crack initiation stage appears earlier, and the tensile failure is dominant. The difference in shear strength is less than 1.0 MPa.
(2) Under the normal stress of 5 MPa, the specimen α = 135° fractures along the inclined crack, and the fracture surface fluctuates greatly. The rest of the specimens fracture along the horizontal direction. In negative shear, the shear stress rises rapidly and the peak stress appears early, and the crack initiation stage is relatively short. In positive shear, as the sliding and grinding of the crack, the dilatancy is distinct during the shear test. The difference in shear strength is about 2.0 MPa.
(3) Under the same level of normal stress, the difference of crack initiation stress of each specimen is about 1.0 MPa, and the difference of peak stress is about 1.0–3.0 MPa. When the normal stress increases, the variation trend of crack initiation stress with the attitude of the crack is almost the same, but that of the peak strength is different due to the change in the failure form of specimen.
(4) The ratio of crack initiation stress to peak stress ranges from 0.61 to 0.80, and the ratio is slightly different in each specimen under the same normal stress.
Data availability statement
The original contributions presented in the study are included in the article/supplementary material, further inquiries can be directed to the corresponding author.
Author contributions
LY: Drafting the manuscript. JN: laboratory test. QM: data analysis. CZ: laboratory test. MC: laboratory test. BY: Reviewing and editing.
Funding
This work was supported by the Natural Science Foundation of Jiangsu Higher Education Institutions of China (Grant No. 19KJD410001), QingLan Project of Jiangsu Province, Campus-level research projects of Changzhou Vocational Institute of Engineering: 11130300121008.
Conflict of interest
The authors declare that the research was conducted in the absence of any commercial or financial relationships that could be construed as a potential conflict of interest.
Publisher’s note
All claims expressed in this article are solely those of the authors and do not necessarily represent those of their affiliated organizations, or those of the publisher, the editors and the reviewers. Any product that may be evaluated in this article, or claim that may be made by its manufacturer, is not guaranteed or endorsed by the publisher.
References
Adams, M., and Sines, G. (1978). Crack extension from flaws in a brittle material subjected to compression. Tectonophysics 49 (1-2), 97–118. doi:10.1016/0040-1951(78)90099-9
Bi, J., Liu, P. F., and Gan, F. (2020). Effects of the cooling treatment on the dynamic behavior of ordinary concrete exposed to high temperatures. Constr. Build. Mater. 248, 118688. doi:10.1016/j.conbuildmat.2020.118688
Bobet, A., and Einstein, H. H. (1998). Fracture coalescence in rock-type materials under uniaxial and biaxial compression. Int. J. Rock Mech. Min. Sci. (1997). 35 (7), 863–888. doi:10.1016/S0148-9062(98)00005-9
Bobet, A., and Einstein, H. H. (1998). Numerical modeling of fracture coalescence in a model rock material. Int. J. Fract. 92 (3), 221–252. doi:10.1023/A:1007460316400
Cao, R. H., Cao, P., Lin, H., Pu, C. Z., and Ou, K. (2016). Mechanical behavior of brittle rock-like specimens with pre-existing fissures under uniaxial loading: Experimental studies and particle mechanics approach. Rock Mech. Rock Eng. 49, 763–783. doi:10.1007/s00603-015-0779-x
Cao, R. H., Lin, H., Lin, Q., and Meng, J. (2020). Failure mechanism of non-persistent cracked rock-like specimens under uniaxial loading: Laboratory testing. Int. J. Rock Mech. Min. Sci. 132, 104341. doi:10.1016/j.ijrmms.2020.104341
Dyskin, A. V., Sahouryeh, E., Jewell, R. J., Joer, H., and Ustinov, K. B. (2003). Influence of shape and locations of initial 3-D cracks on their growth in uniaxial compression. Eng. Fract. Mech. 70 (15), 2115–2136. doi:10.1016/S0013-7944(02)00240-0
Germanovich, L. N., Salganik, R. L., Dyskin, A. V., and Lee, K. K. (1994). Mechanisms of brittle fracture of rock with pre-existing cracks in compression. Pure Appl. Geophys. 143, 117–149. doi:10.1007/BF00874326
Goodman, R. E., Taylor, R. L., and Brekke, T. L. (1968). Closure to “A model for the mechanics of jointed rock”. J. Soil Mech. Found. Div. 94 (3), 298–659. doi:10.1061/JSFEAQ.0008003
Hu, B., Yang, Z. R., Liu, S. G., Wang, S. J., and Liu, H. N. (2008). Direct shear strength behavior of rock mass containing coplanar close intermittent joints. J. Eng. Geol. 16, 327–331. CNKI:SUN:GCDZ.0.2008-03-007.
Huang, D., Gu, D. M., Yang, C., Huang, R. Q., and Fu, G. Y. (2016). Investigation on mechanical behaviors of sandstone with two preexisting flaws under triaxial compression. Rock Mech. Rock Eng. 49 (2), 375–399. doi:10.1007/s00603-015-0757-3
Lajtai, E. Z. (1969). Shear strength of weakness planes in rock. Int. J. Rock Mech. Min. Sci. Geomechanics Abstr. 6 (5), 499–515. doi:10.1016/0148-9062(69)90016-3
Lajtai, E. Z. (1969). Strength of discontinuous rocks in direct shear. Geotechnique 19 (2), 218–233. doi:10.1680/geot.1969.19.2.218
Lee, H., and Jeon, S. (2011). An experimental and numerical study of fracture coalescence in pre-cracked specimens under uniaxial compression. Int. J. Solids Struct. 48 (6), 979–999. doi:10.1016/j.ijsolstr.2010.12.001
Li, X. P., and Zhu, W. S. (1992). The damage fracture analysis of a jointed rock mass and its application in engineering. Eng. Fract. Mech. 43 (2), 165–170. doi:10.1016/0013-7944(92)90119-Y
Liu, Y. M., and Xia, C. C. (2010). Research on rock mass containing discontinuous cracks by direct shear test based on weakening mechanism of rock bridge mechanical properities. Chin. J. Rock Mech. Eng. 29 (7), 1467–1472. doi:10.3969/j.issn.1000-7598.2010.03.005
Lu, Y. L., Wang, L. G., and Elseorth, D. (2015). Uniaxial strength and failure in sandstone containing a pre-existing 3-D surface flaw. Int. J. Fract. 194 (1), 59–79. doi:10.1007/s10704-015-0032-3
Shen, B., Stephansson, O., Einstein, H. H., and Ghahreman, B. (1995). Coalescence of fractures under shear stresses in experiments. J. Geophys. Res. 100 (B4), 5975–5990. doi:10.1029/95JB00040
Tang, Z. C., Xia, C. C., and Liu, Y. M. (2012). Modified Jennings shear strength criterion based on mechanical weakening model of rock bridges. Chin. J. Geotechnical Eng. 34 (11), 2093–2099.
Kawamoto, T, Ichikawa, Y, and Kyoya, T (1988). Deformation and fracturing behaviour of discontinuous rock mass and damage mechanics theory. Int. J. Numer. Anal. Methods Geomech. 12, 1–30. doi:10.1002/nag.1610120102
Wang, Y. T., Zhou, X. P., and Shou, Y. D. (2017). The modeling of crack propagation and coalescence in rocks under uniaxial compression using the novel conjugated bond-based peridynamics. Int. J. Mech. Sci. 128, 614–643. doi:10.1016/j.ijmecsci.2017.05.019
Wong, R. H. C., and Chau, K. T. (1998). Crack coalescence in a rock-like material containing two cracks. Int. J. Rock Mech. Min. Sci. (1997). 35, 147–164. doi:10.1016/S0148-9062(97)00303-3
Wong, R. H. C., and Lin, P. (2015). Numerical study of stress distribution and crack coalescence mechanisms of a solid containing multiple holes. Int. J. Rock Mech. Min. Sci. (1997). 79, 41–54. doi:10.1016/j.ijrmms.2015.08.003
Xia, C. C., Xiao, W. M., and Liu, Y. M. (2010). Study of mechanical model for weakening process of discontinuous crack rock bridge. Chin. J. Rock Mech. Eng. 29 (8), 1538–1545.
Xiao, T. L., Li, X. P., and Shan, S. P. (2015). Failure characteristics of rock with two pre-existing transfixion cracks under triaxial compression. Chin. J. Rock Mech. Eng. 34 (12), 2455–2462. doi:10.13722/j.cnki.jrme.2014.1443
Yang, S. Q. (2013). Study of strength failure and crack coalescence behavior of sandstone containing three pre-existing fissures. Rock Soil Mech. 34, 47–52. CNKI:SUN:YTLX.0.2013-01-004.
Yin, P., Wong, R. H. C., and Chau, K. T. (2014). Coalescence of two parallel pre-existing surface cracks in granite. Int. J. Rock Mech. Min. Sci. (1997). 68 (6), 66–84. doi:10.1016/j.ijrmms.2014.02.011
Yue, L., Sun, S. S., Liu, J. M., Wei, J. H., and Wu, J. M. (2017). Research on crack initiation mechanism and fracture criterion of rock-type materials under compression-shear stress. Adv. Mech. Eng. 9 (10), 168781401772008–168781401772010. doi:10.1177/1687814017720087
Zhang, K., Chen, Y. L., Cheng, H. M., and Fan, W. C. (2018). Investigation on compression-shear fracture and fragmentation characteristics of rock mass containing counter-inclined flaw. Chin. J. Rock Mech. Eng. 37 (1), 178–186. doi:10.13722/j.cnki.jrme.2017.1319
Zhao, Y. L., Wan, W., Wang, W. J., Zhao, F. J., and Cao, P. (2012). Compressive-shear rheological fracture of rock-like crack and subcritical crack propagation test and fracture mechanism. Chin. J. Geotechnical Eng. 34 (6), 1050–1059.
Zhou, T., Zhu, J. B., Ju, Y., and Xie, H. P. (2019). Volumetric fracturing behavior of 3D printed artificial rocks containing single and double 3D internal flaws under static uniaxial compression. Eng. Fract. Mech. 205, 190–204. doi:10.1016/j.engfracmech.2018.11.030
Zhou, T., Zhu, J. B., and Xie, H. (2020). Mechanical and volumetric fracturing behaviour of three-dimensional printing rock-like samples under dynamic loading. Rock Mech. Rock Eng. 53 (6), 2855–2864. doi:10.1007/s00603-020-02084-5
Zhou, X. P., Bi, J., and Qian, Q. H. (2015). Numerical simulation of crack growth and coalescence in rock-like materials containing multiple pre-existing flaws. Rock Mech. Rock Eng. 48 (3), 1097–1114. doi:10.1007/s00603-014-0627-4
Zhou, X. P., Cheng, H., and Feng, Y. F. (2013). An experimental study of crack coalescence behaviour in rock-like materials containing multiple flaws under uniaxial compression. Rock Mech. Rock Eng. 47 (6), 1961–1986. doi:10.1007/s00603-013-0511-7
Zhou, X. P., Lian, Y. J., Wong, L. N. Y., and Berto, F. (2018). Understanding the fracture behavior of brittle and ductile multi-flawed rocks by uniaxial loading by digital image correlation. Eng. Fract. Mech. 199, 438–460. doi:10.1016/j.engfracmech.2018.06.007
Zhou, X. P., and Zhang, J. Z. (2021). Damage progression and acoustic emission in brittle failure of granite and sandstone. Int. J. Rock Mech. Min. Sci. 143, 104789. doi:10.1016/j.ijrmms.2021.104789
Zhou, X. P., Zhang, J. Z., Qian, Q. H., and Niu, Y. (2019). Experimental investigation of progressive cracking processes in granite under uniaxial loading using digital imaging and AE techniques. J. Struct. Geol. 126, 129–145. doi:10.1016/j.jsg.2019.06.003
Zhou, X. P., Zhang, J. Z., and Wong, L. N. Y. (2018). Experimental study on the growth, coalescence and wrapping behaviors of 3D cross-embedded flaws under uniaxial compression. Rock Mech. Rock Eng. 51 (5), 1379–1400. doi:10.1007/s00603-018-1406-4
Zhu, J. B., Zhou, T., Liao, Z. Y., Sun, L., Li, X., and Chen, R. (2018). Replication of internal defects and investigation of mechanical and fracture behaviour of rock using 3D printing and 3D numerical methods in combination with X-ray computerized tomography. Int. J. Rock Mech. Min. Sci. 106, 198–212. doi:10.1016/j.ijrmms.2018.04.022
Keywords: direct shear test, two closed pre-existing cracks, attitude of crack, shear strength, crack initiation stress
Citation: Yue L, Niu J, Ma Q, Zhao C, Cao M and Yu B (2023) Research on direct shear test of rock-like materials with two closed pre-existing cracks of different attitudes. Front. Earth Sci. 10:1053630. doi: 10.3389/feart.2022.1053630
Received: 26 September 2022; Accepted: 27 October 2022;
Published: 11 January 2023.
Edited by:
Xiaoping Zhou, Chongqing University, ChinaCopyright © 2023 Yue, Niu, Ma, Zhao, Cao and Yu. This is an open-access article distributed under the terms of the Creative Commons Attribution License (CC BY). The use, distribution or reproduction in other forums is permitted, provided the original author(s) and the copyright owner(s) are credited and that the original publication in this journal is cited, in accordance with accepted academic practice. No use, distribution or reproduction is permitted which does not comply with these terms.
*Correspondence: Jie Niu, MzY5Njc5MzQzQHFxLmNvbQ==; Qingshan Ma, c3NxbTIwMDdAMTYzLmNvbQ==
 Ling Yue
 Jie Niu1*