
94% of researchers rate our articles as excellent or good
Learn more about the work of our research integrity team to safeguard the quality of each article we publish.
Find out more
ORIGINAL RESEARCH article
Front. Earth Sci., 10 January 2023
Sec. Geohazards and Georisks
Volume 10 - 2022 | https://doi.org/10.3389/feart.2022.1037756
This article is part of the Research TopicGeological Disasters in Deep Engineering: Mechanism, Warning, and Risk Mitigation, volume IIView all 11 articles
Different air pressures are used to conduct an impact test based on the split Hopkinson pressure bar (SHPB) test system to study the crack evolution process and energy dissipation law of the cemented rock under impact load. The failure mechanism of the specimens is analyzed from the perspective of dynamic failure process and energy dissipation. The spatial distribution of the specimen components visualized by the image reconstruction technology and the LS-DYNA mesoscopic model is established. Results show that the proportion of dissipated energy, the dynamic tensile strength and peak strain of the specimens increase with strain rate increase. The crack evolution process of the model is quantitatively described under an impact load, which is divided into four stages, namely, no crack stage, slow development stage, accelerated propagation stage and penetration stage. Compared with the indoor and simulation test result, the crack evolution process and failure modes are consistent under different strain rates. When the specimens are destroyed, the energy dissipation rate fluctuates from 10% to 13%. The dissipated energy of cement paste accounts for more than 90% of the total dissipated energy. The cement paste damages first and its strength has a great influence on the strength of the grouting specimens. This study provides a reference to evaluate the cemented rock under a dynamic load.
The construction process of underground engineering faces instability problems of rock and Earth mass with the rapid development of the urban underground space (Von et al., 2020; Jong et al., 2021). The sand layer is a common, poor self-stabilization and hazardous harmful geology, and it induces frequent geological disasters, such as sand collapse, landslide, and surface collapse (Wen et al., 2020a; Ye et al., 2022). Grouting reinforcement can effectively enhance the overall mechanical properties and anti-leakage performance of the sand beds (Liang et al., 2020; Ren et al., 2022). The tensile strength of the sand layer is far less than the compressive strength after grouting reinforcement. The sand bears not only bears quasi-static load but also earthquake, mechanical construction, explosion, and other impact loads. The crack initiation, expansion, penetration, and fracture of the grouting specimens must be studied under radial impact load. The split Hopkinson pressure bar (SHPB) system has been commonly used in dynamic compression, splitting, and fracture testing of the materials in a dynamic load test (Dai et al., 2010; Chen et al., 2014; Liao et al., 2016; Zhu et al., 2022). Most previous experimental studies have focused on strain rate effects (Liu et al., 2019; Yu et al., 2021).
During the dynamic splitting experiments, the failure process of several specimens is captured with a high-speed camera, and the crack propagation law and damage process of the concrete, sandstone, and rock materials are analyzed (Ai et al., 2019; Xing et al., 2018; Lai et al., 2022). The variation rules of the transmitted and dissipated energy of basalt and granite are studied through the SHPB test (Li et al., 2019; Liu et al., 2022). The energy utilization rate of the mortar is also studied through experiments (Sun et al., 2022). Xu et al. (2015) measured the expansion toughness and fracture energy of the rock through simulation. The influence of the angle and thickness of the joints and fractures in the rock mass on the law of energy propagation and dissipation is also explored (Huang et al., 2019; Han et al., 2022). The above-mentioned studies have analyzed the dynamic mechanics or energy dissipation characteristics of rock-like materials, while the energy dissipation characteristics of the grouting specimens under SHPB impact are rarely studied. The impact failure of the grouting specimens can be regarded as the result of energy transformation or energy dissipation among different energies. The process of energy variation reflects the evolution of internal micro-defects, and its failure mechanism can be further revealed from the perspective of energy dissipation (Gong et al., 2022).
The crack initiation and propagation in the specimens are difficult to observe due to the opaque nature of concrete materials. The crack propagation process can be observed through CT scanning, 3D printing, acoustic emission detection and other tests, but these experiments greatly increase the cost and do not scan the instantaneous failure process. The grouting specimen is a heterogeneous material with a complex internal structure, and the three-dimensional numerical model can effectively solve the problem of damage and energy dissipation of internal components, but indoor tests results don’t be quantitatively analyzed (Lv et al., 2022; Sun et al., 2022). Previous research results (Li et al., 2012; Ayhan et al., 2022; Dong et al., 2021) have proven that LS-DYNA software can effectively simulate the dynamic impact process and fracture mechanical properties of cement-based materials. Yu et al. (2021) changed the parameters of the HJC constitutive model and studied the influence of the strength of aggregate and mortar on the overall performance. Wang et al. (2021) established a 3D mesoscopic model to study the damage and energy dissipation process of concrete. Ai et al. (2013) simulated the mesoscopic failure mechanism of the concrete materials based on LS-DYNA software. A mesospheric aggregate model is established to study the tensile and compressive properties and failure process of concrete at high strain rates (Zhou et al., 2008; Xu et al., 2012). Few studies have reported the heterogeneous grouting-reinforced rock mass on SHPB numerical simulation.
The radial impact test of the same batch grouting specimens is conducted on the SHPB system. The failure process are recorded with a high-speed camera, which is helpful in analyzing the crack evolution law and failure mode. A 3D micro model of the standard size specimens is established by using the grid mapping method. LS-DYNA is used to simulate fracture process of the specimens under high strain rate. Based on the failure mode and the crack evolution process of the LS-DYNA model, the crack development law and its failure mechanisms are further researched to make up for the experimental deficiency. Moreover, the dynamic characteristics and energy dissipation law of the cemented rock are studied. The research results can provide reference for the grouting-reinforced rock mass of the deep roadway under an impact load.
The grouting specimens are mainly composed of the grouting material and graded gravel. The grouting materials include superfine cement slurry, vinyl acetate–ethylene (VAE), and defoamer. VAE is a type of polymer that serves as the binder. Some holes of the grouting specimens are minimized using the defoamer function. The mixing ratio is determined through indoor orthogonal tests and compared with the grouting injectability and effect and other factors (Avci et al., 2020), as shown in Table 1.
The graded gravel with a controllable particle size are selected as the injected material to simulate the sand layer with a large number of fine cracks. This work aims to minimize the porosity of the poured material and achieve the tightest packing state (Hwang et al., 2007). According to the Fuller gradation curve, the gravel gradation is calculated by using Eq. 1, where P is the total amount of the material less than the particle size Ds. Ds and Dm are the screen size and the maximum particle size of the material, respectively.
The value of h ranges from 1/3 to 1/2. When h = 1/2, the graded gravel theoretically reaches the maximum density. Accordingly, the value of h in the test is 1/2. The particle size range is 0.15–4.75 mm, and the detailed parameters are shown in Table 2. Given that the 2.36–4.75 mm gravel has more impurities and poor quality, this part is replaced with crushed stone of the same particle size.
The specimens are obtained from the indoor grouting experiment. The size of the grouting mould is Φ330 mm × 220 mm, as shown in Figure 1A. The mould is removed after the cement paste is consolidated. The specimens are cored and polished according to the requirement of the disk specimens (Φ50 mm × 25 mm), placed into the curing box, and cured to the specified age, as shown in Figure 1B.
The impact test of the grouting specimens is conducted on the SHPB system, which is composed of a nitrogen pressure system, an elastic pressure bar system, and a data acquisition system. The schematic of the device is shown in Figure 2. The bullet, incident bar, and transmission bar are steel bars of Φ37 mm × 400 mm, Φ50 mm × 2,400 mm, and Φ50 mm × 1,200 mm, respectively. The bar density is 7,800 kg/m3, the bar elastic modulus is 210 GPa, the bar diameter of the contact part between the incident bar and the bullet is 37 mm, and the variable section length is 170 mm. Nitrogen is used as the power source, and the strain rate of the specimen is controlled by changing air pressure. The SHPB test uses five different air pressues which are 0.15, 0.175, 0.20, 0.225, and 0.25 Mpa respectively, and the corresponding strain rates are 24.8, 29.1, 33.2, 39.3, and 45.1 s−1. Considering the randomness of the meso structure of the grouting specimens, the impact test of each group repeates five times, and the average values are taken as the strain rate and dynamic tensile strength of the specimens. A MIRO M310 high-speed camera of PHANTOM is used to capture the crack evolution process of the specimens with a resolution of 512 × 512 pixels and a frame rate of up to 10,800 fps.
Based on the assumption of the 1D stress waves and stress uniformity, the dynamic tensile stress, strain, and strain rate of the specimen are calculated by using Eq. 2 (KHAN et al., 2019), where
where A, E, and C0 are the cross-sectional area, elastic modulus, and elastic wave velocity of the bar, respectively; Ds and Ls are the diameter and thickness of the specimens; and εi, εr, and εt are the strain signals of the incident, reflected, and transmitted waves, respectively.
In the SHPB test, the energy propagates in the form of stress wave. From the perspective analysis of energy composition, the incident energy WI, reflected energy WR, and transmitted energy WT are calculated to study the energy consumption law and failure characteristics of the grouting specimens in the dynamic splitting process, respectively. The calculation formula is shown in Eq. 4 (Li et al., 2020).
The contact surface between the specimen and the bar is small, the interface is coated with vaseline, and the consumed energy by friction can be ignored. According to the energy conservation law, the absorbed energy WS by the specimen can be calculated by using Eq. 5.
where WS is mainly dissipated in crushed dissipation energy WFD, crushed kinetic energy WK, and other dissipation energy WO. WK only accounts for about 5% of the total absorbed energy, and the WO dissipation energy is negligible (Wen et al., 2019; YAO et al., 2019). Thus, WS = WFD.
When the SHPB model was established, the specimen is composed of cement mortar and gravel. This model considers the 1.18–2.36 mm gravel and 2.36–4.75 mm crushed stone because of the limitation of computer performance. A single gravel occupies a few grids due to the small size and large number of gravel inside the model, so it is simplified as a sphere. The pre-divided mesh avoids some problems, such as high magnitude and poor quality of grids, which can meet the roughness of the grit surface. The spherical aggregate can reliably simulate the response of the cement-based materials under impact load and greatly simplify the modeling and calculation time compared with the random shape aggregate model (Zhou et al., 2007; Kim et al., 2011; Xu et al., 2012).
The CT slices of the specimen are imported into AVZIO. The processing process is shown in Figure 3A. Approximately 2.36–4.75 mm crushed stone and 1.18–2.36 mm gravel are selected, and their number and volume of are obtained (Table 3).
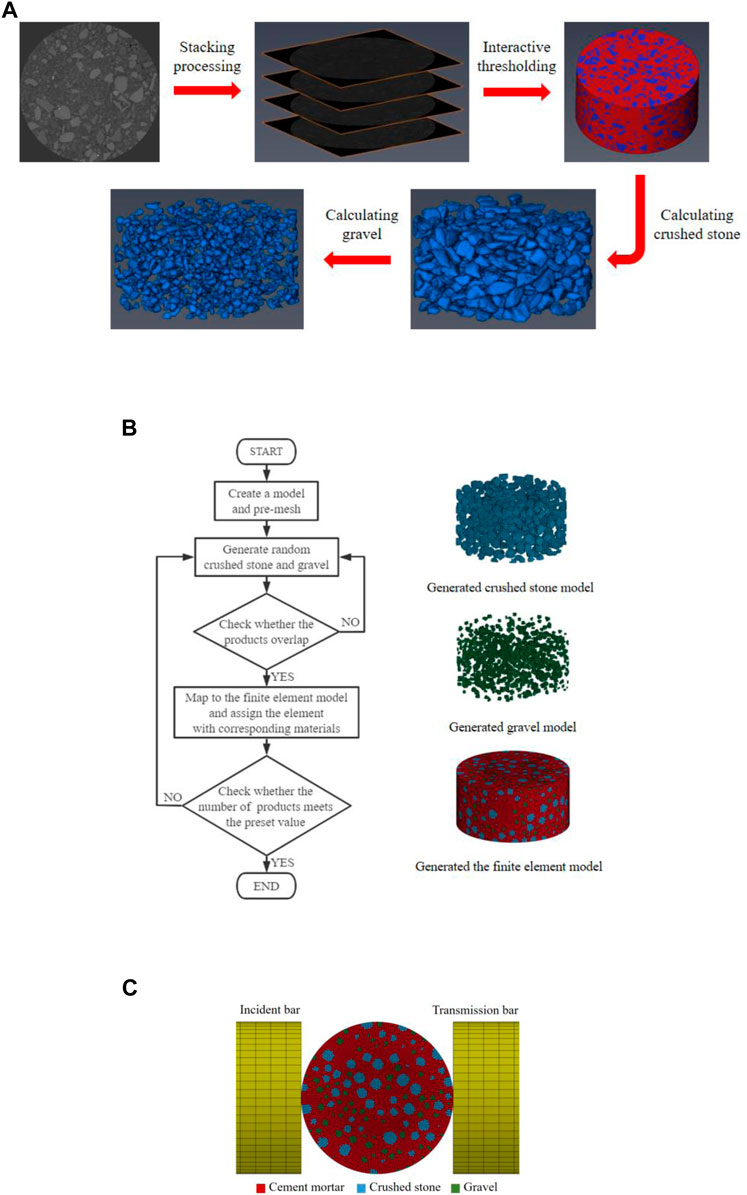
FIGURE 3. The meso-scal FEM model of grouting specimen. (A) AVZIO processing, (B) Flow chart of generating mesoscale finite element model of the grouting specimen, (C) Simplified model of the SHPB simulation test.
According to the material information extracted from the above CT images, large and small gravels are randomly placed by using the Monte Carlo method. Finally, the model places 491 crushed stones, and the number of units is 73,300, accounting for 23.27%. The model places 876 gravels, and the number of units is 16,128, accounting for 5.12%. The placement processes of sand and gravel are shown in Figure 3B.
The established 3D model of the SHPB test and its physical and geometric parameters are consistent with the test. The model placement is shown in Figure 3C. The model adopts a solid164 unit, a mapping grid division, and a set of automatic surface contact between the bars and the erosion contact between bars—the specimen and its each component. The initial velocity of the bullet when loading is consistent with the test.
The HJC model can better describe the dynamic response of the materials at high strain rates. This constitutive model is proposed for the cement-based materials and comprehensively considers the damage evolution, compaction, and crushing effects and hardening characteristics (Xu et al., 2016). The HJC model includes yield surface, state, and damage evolution equations. The yield surface equation takes into account the damage and strain rate, and it is expressed by the dimensionless equivalent stress. The state equation describes the relationship between the hydrostatic pressure and the volumetric strain in a piecewise manner. The damage equation is described by the cumulative plastic strain (equivalent plastic strain
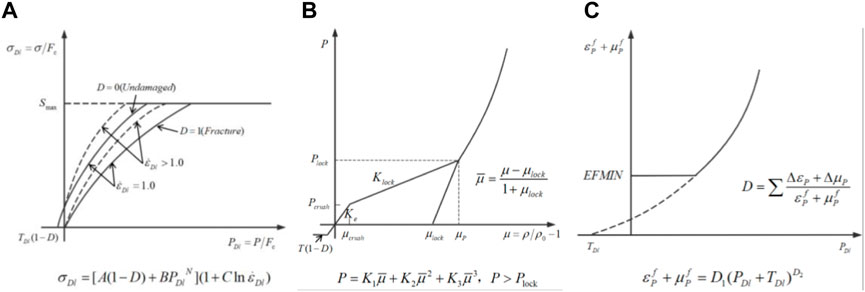
FIGURE 4. HJC constitutive model. (A) Yield surface equation, (B) State equation, (C) Damage equation.
The HJC model has 21 parameters. According to the method illustrated in the literature (Xie et al., 2019), the basic physical parameters of RO, G, FC, T,
The failure mode during calculation is controlled by using the element erosion technology to avoid the negative volume or large deformation of the element. When the element exceeds a certain threshold, it will be deleted because of failure, and the isolated failure element will manifest crack. The inherent failure criterion of the HJC model is the minimum fracture strain and the damage degree, and the maximum principal strain is set as 0.1 (LV et al., 2019). If the given value exceeds the element erosion criterion, the cement mortar, crushed stone, and gravel are considered to the failure.
In the SHPB and simulation tests, the measurement of the point of stress wave is set on the central unit of the incident and transmission bars, and the similarity of waveforms between them can verify the correctness of the model (Lv et al., 2022). The typical waveform of the dynamic tensile test is shown in Figure 5.
The measured waveforms through the laboratory and the simulation tests are in good agreement, and the characteristic errors of the two pulse peaks and durations are within 5%. The bearing loads at both ends of the specimen are basically the same, achieving dynamic balance and eliminating the influence of inertia effect (Dai et al., 2010). The feasibility of impact failure based on LS-DYNA is verified according to the test results.
Figure 6 shows the stress–strain curves of the specimens under three impact rates. A good correspondence can be observed between the test and the simulation curves. The dynamic tensile strength and peak strain of the specimens increase with the increase in the strain rate, and the envelope area of the curve gradually increases, which is a strain rate-dependent material. The high tensile performance of the specimens at a high strain rate has a close connection with the input energy. The input energy increases with the increase in strain rate, and the specimen is unable to release a large amount of energy in a short period of time, resulting in tensile strength increase.
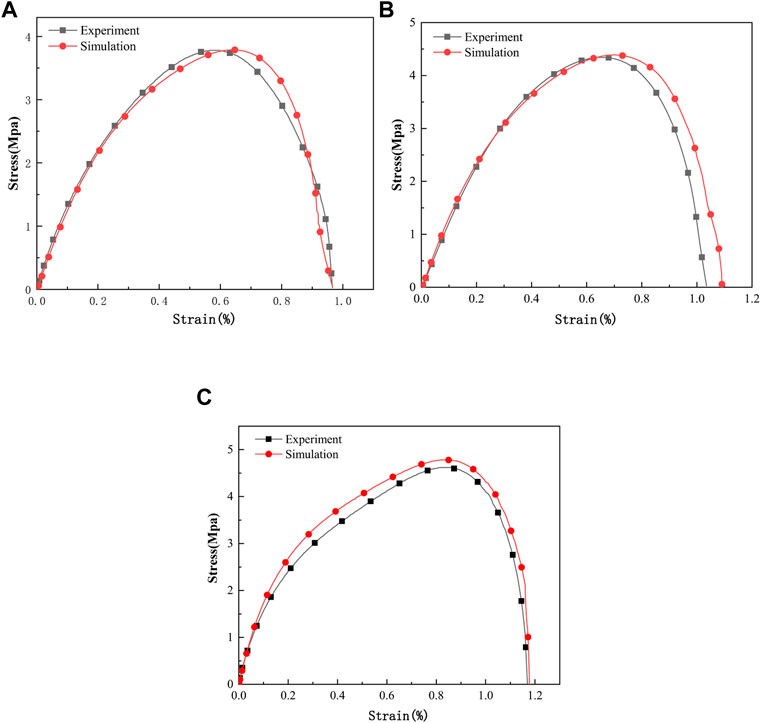
FIGURE 6. Three stress–strain curves of the experiment and simulations. (A)
In addition to the strength characteristics, the crack propagation process on the specimen surface is also the key to the dynamic damage evolution process. Figure 7 shows the whole process of dynamic splitting of the grouting specimens captured with a high-speed camera. The stress wave of the specimen transmitters from the left side and the contact time is defined as zero. The selected pictures are used to analyze the failure process.
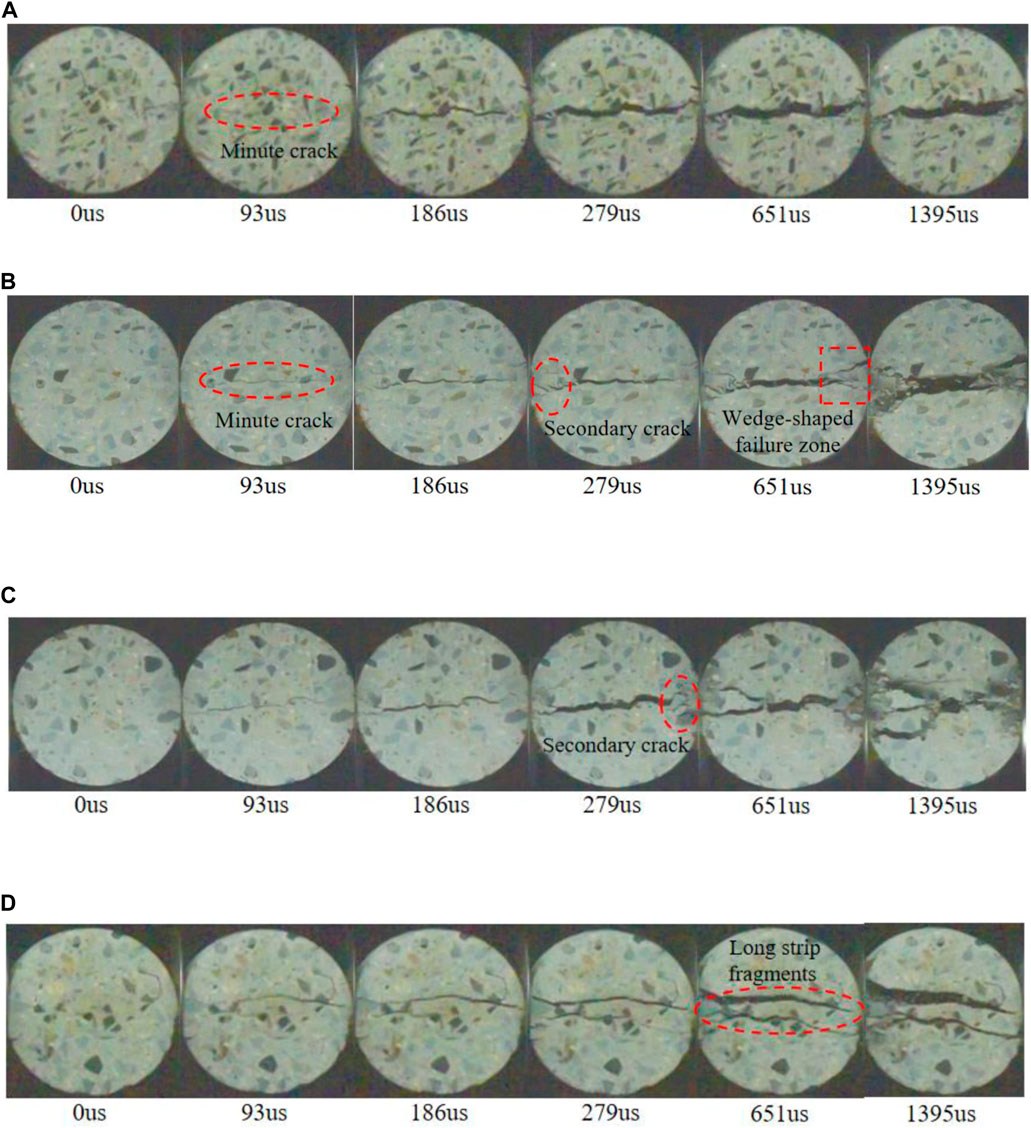
FIGURE 7. Typical failure process of the grouting specimens. (A)
When
In comparison with
In summary, when the grouting specimens are fractured, the cracks initiate from the center to two ends, and tensile stress produced by the pulse wave is perpendicular to the loading direction at the center of the specimens. When the tensile stress exceeds its tensile strength, the crack initiates and then expands to both ends along the loading direction. The width of the main crack also increases. Before the first pulse finishes (279 µs), the main crack did not fully cut-through the specimens, and the wedge failure zone is small at two ends. When the compressive and shear stresses are combined with the specimen’s contact surfaces, two ends of a secondary crack first emerge and form a wedge failure zone, which eventually connected with the main crack and penetrated the whole specimen. The crack initiation time of the high strain rate is earlier than low strain rate in the middle of the specimen. The crack width and the failure zone at two ends increase with the increase in the strain rate. When the strain rate changes from 24.8 to 33.2 s−1, the failure mode of the specimens is similar, namely, the center split and the main crack. When
When the path of crack expansion encounters the crushed stone and gravel, cracks mostly expand along the edge of the gravel, and rarely penetrates the crushed stone and gravel. Because the strength of crushed stone and gravel are higher than cement mortar, also the water film layer of the gravel surface results in higher water cement ratio, and the structure of interfacial transition zone is loose, which results in cracks extension along the edge of gravel.
When the strain rates change from 24.8 to 33.2 s−1, the failure modes of the specimens are roughly similar. The strain rates of 24.8 and 45.1 s−1 are shown in the simulation process due to the paper limitation (Figure 8). The simulation results are in good agreement with the experimental results, which verifies the correctness of the 3D mesoscopic model. When the model is impacted, its central element first failed, and few failure elements can be observed at both ends. The crack rapidly spread from the center to both ends. After 279 µs, the number of failure elements at both ends and the range of wedge failure zone rapidly increased. When
The cracks extend along the cement paste which is in good agreement with the experimental results (such as area A). Spreading through the gravel crack is almost perpendicular to the gravel surface, and the crack width is obviously bigger than that around the gravel. When the extension of crack encounter the gravel, a few cracks which are perpendicular to the gravel coarse gradually (such as area B), According to the theory of stress intensity factors in fracture mechanics (Cai et al., 2018), crack shape, size and the far field stress can affect the stress field intensity of crack tip. When the intensity factor of crack tip reaches the fracture toughness of gravel, the crack continues to expand through the gravel, and release energy in the form of fracture energy.
The 3D cracks inside the specimen have complex a topological structure, making it difficult to extract spatial cracks and quantitatively analyze the crack growth process. However, the numerical model is suitable for quantitative analysis of the crack growth process. The crack growth is show in Figure 9A, the cracks still expands from the center of the specimens to both ends. After the main crack is basically connected, the failure zone also expands at two ends, which is consistent with the cracks growth process on the model surface. This model is divided into 315,000 meshes, and the number of failure elements is counted at each calculation time. The damage degree parameter is introduced to describe the damage degree of the model, namely, DS = NS/NA, where NS is the number of failure elements, and NA is the total number of model elements at given time. The relationship is plotted between stress, strain, and crack volume base on 45.1 s−1, as shown in Figures 9B,C. According to the crack evolution process curves, the damage process of the model can be divided into four stages:
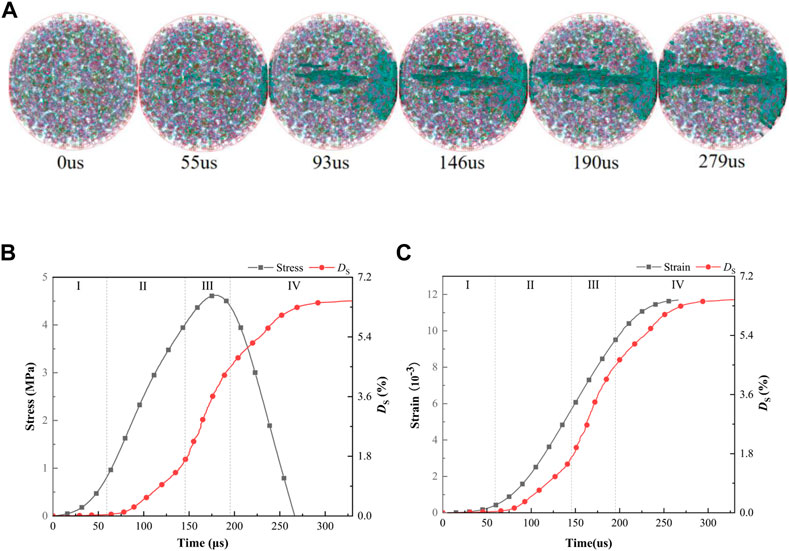
FIGURE 9. Crack extraction and variation trend of damage degree of 45.1 s−1. (A) Extracted crack of the model, (B) Stress and damage degree, (C) Strain and damage degree.
Stage I (no crack stage): 0–53 µs, the stress level of the model is low, and the model does not occur crack. At the moment, the strain of the model is small.
Stage II (slow development stage): 53–146 µs, the model occurs few cracks at first, and it continue to expand with the stress increase. At this time, crack number and strain value are still small. At 146 µs, the number of failure elements and DS reaches 5,374 and 1.7% respectively.
Stage III (accelerated growth stage): 146–190 µs, the stress exceeds 4.03 MPa, the crack rapidly expands, and the growth rate of DS significantly increases. After reaching the peak stress, the stress rapidly declines, but the strain continues to increase. The number of internal failure elements and DS reaches 13,583 and 4.3% at 190 µs, respectively.
Stage IV (crack penetration stage): After 190 µs, the stress reaches the peak and then decreases sharply, the cracks of the specimen continue to expand until failure. The number of internal failure elements gradually slows growth. At 330 µs, the number of failure elements reaches 20,430, and DS reaches 6.5%. The crack evolution process of the model is roughly similar to the strain curve. Thus, the crack volume can approximately reflect the strain value.
Energy is the driving force behind material failure (Wen et al., 2020b; Wei et al., 2022), and energy dissipation causes everything from microscopic damage to macroscopic fragmentation of the model. The energy dissipation rate is defined as λ, namely, λ = WS/WI, to compare the degree of absorbed energy under different strain rates. Approximately 0.175 and 0.225 MPa impact air pressures are applied based on the original tests to comprehensively analyze the impact failure characteristics and energy change law of the model. In order to obtain the incident energy, The test parameters are substituted into Eqs 4, 5, and the absorbed energy and transmitted energy at five strain rates are obtained, as shown in Table 5.
In Table 5, the incident energy value gradually increases with the increase in strain rate. The incident energy, transmitted energy, and absorbed energy at five strain rates in Table 5 are fitted to obtain the energy relationship curves, as shown in Figure 10. The fitting curves of the incident energy and transmitted energy show increasing trends. The growth scope of the transmitted energy slows downs with the increase in incident energy, as shown in Figure 10A. When the incident energy impacts on the model are low, the microcracks are less, and the crack propagation scope is small. The crack number and damage range continuously increase with the increase in incident energy, and the cracks weakens the propagation of transmitted waves, resulting in a slow increase in transmitted energy. The energy dissipated by the crushed specimen linearly grows with the development of the incident energy, as shown in Figure 10B. The energy dissipation rate (λ) is basically constant with the increase in the incident energy. The fluctuation value changes from 10% to 13%, as illustrated in Table 5, which shows the strain rate independence.
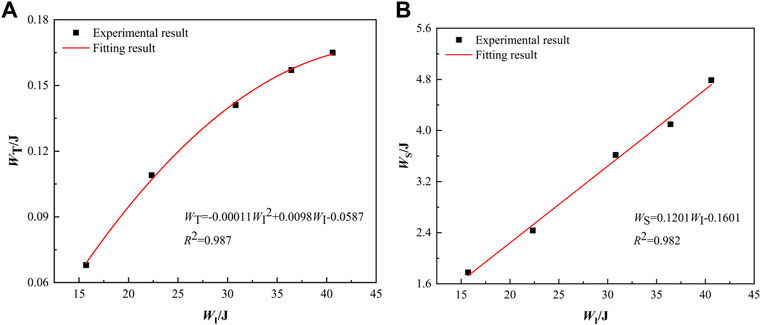
FIGURE 10. Energy relation curve. (A) Relationship between WI and WT, (B) Relationship between WI and WS.
The energy curve of the model is drawn using the strain rate of 45.09 s−1 as an example and the three energies determined utilizing Eqs 4, 5, as shown in Figure 11A. The three energies curves show a slow growth, continuous linear growth and stabilization trend. The incident energy greatly increased. The maximum transmission energy is only 0.165 J, and the growth rate is the smallest due to the low tensile strength of the specimen (4.62 MPa). The failure process of the specimen is analyzed using the stress–strain curve and failure characteristics of the specimen. When time is 0–53 µs, the incident energy slowly increases, and the stress pulse wave enters the rising elastic deformation stage. The dissipated energy of this stage is almost zero, no crack initiated, and the model stores a large amount of elastic energy. From 53 to 190 µs, the incident energy and reflected energy rapidly increase, but the transmitted energy slightly increases. When the stress of the model is greater than the tensile strength, the dissipated energy of the specimen increases due to crack growth. From 190 to 267 µs, the stress of the model decreases after reaching the peak strength, and the original and new cracks in the specimen continued to expand. The release of elastic energy also aggravates the failure of the model, and the dissipation energy slightly increases and then tended to a constant value.
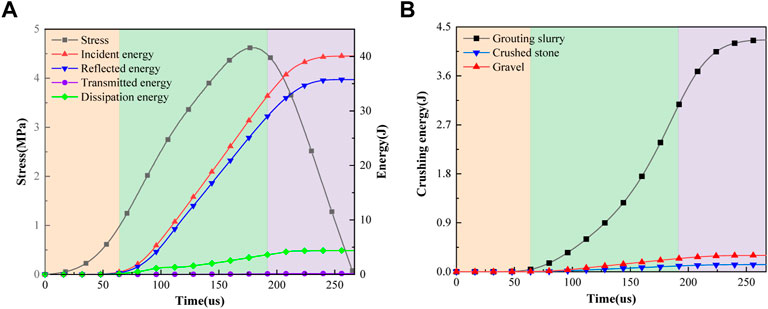
FIGURE 11. Energy curve of the grouting specimen. (A) Energy dissipation curve of the specimen, (B) Breakup energy curves of each component.
The energy evolution process of each material component of the specimen model cannot be measured in a laboratory. However, the dissipated energy of the different components can be described by using a 3D meso-numerical model. Take
When the strain rate is 24.8–45.1 s−1, the proportion of dissipated energy of the cement mortar is above 90%. When the specimen fails, the cement mortar is the first to be significantly damaged. Crushed stone and gravel are bonded by using a cement mortar. Thus, the strength of the cemented specimen is most affected by the strength of the cement mortar.
Different strain rate dynamic splitting tensile tests of the cemented specimens are carried out by using the SHPB test device. The dynamic failure process and energy dissipation law of the cemented specimens are studied. A 3D mesoscopic numerical model is established by using the SHPB, and the accuracy of the numerical simulation is verified by comparing with the SHPB test result. The main conclusions are as follows:
(1) The dynamic tensile strength and peak strain of the cemented specimens increase with the increase in strain rate. It is a strain rate-related material.
(2) When the specimens are destroyed by impact load, the cracks initiated at the center and spread to both ends of the specimen along the load direction. The wedge-shaped failure zone at both ends expands after the first pulse wave completed. When the strain rates changed from 24.8 to 33.2 s−1, the failure morphology of the specimens is similar with the splitting failure and the main crack at the center. When the strain rate is 46.2 s−1, the failure mode of the specimens is a strip fragment with two main cracks at the center.
(3) The crack growth process in the model is quantitatively describe based on LS-DYNA software. The damage of the specimen is divided into four stages: no crack stage, slow crack development stage, accelerated crack growth stage and crack penetration stage. When the specimen broke, the energy dissipation rate fluctuates from 10% to 13%, and the dissipated energy of the cement mortar accounts for more than 90% of the total dissipated energy. The cement mortar is destroyed first and most severely, and its strength has a great influence on the strength of the grouting specimen.
(4) In comparison with the indoor SHPB test result, the 3D meso-model of the grouting specimens established based on the 3D reconstruction technology and LS-DYNA software can better simulate the crack evolution process and failure mode of the specimen, which can quantitatively analyze the energy consumption of the internal components. (XU and WEN, 2016), (LI and XU, 2009).
The raw data supporting the conclusion of this article will be made available by the authors, without undue reservation.
C-XZ proposed the research methods and ideas of this article, J-XS completed the experiment of this article, JG and F-EW completed the writing of this article.
This work was supported by the National Natural Science Foundation of China (51874119), the Department of Education Project of Henan Province (2011A440003) and the Doctorate Fund of Henan Polytechnic University (B2009-96).
The authors declare that the research was conducted in the absence of any commercial or financial relationships that could be construed as a potential conflict of interest.
All claims expressed in this article are solely those of the authors and do not necessarily represent those of their affiliated organizations, or those of the publisher, the editors and the reviewers. Any product that may be evaluated in this article, or claim that may be made by its manufacturer, is not guaranteed or endorsed by the publisher.
Ai, D. H., Zhao, Y. C., Wang, Q. F., and Li, C. W. (2019). Experimental and numerical investigation of crack propagation and dynamic properties of rock in SHPB indirect tension test. Int. J. Impact Eng. 126, 135–146. doi:10.1016/j.ijimpeng.2019.01.001
Ai, S. G., Tang, L. Q., Mao, Y. Q., Liu, Y., and Fang, D. (2013). Numerical analysis on failure behaviour of polyurethane polymer concrete at high strain rates in compression. Comput. Mater. Sci. 69, 389–395. doi:10.1016/j.commatsci.2012.12.018
Avci, E., and Mollamahmutoglu, M. (2020). Strength and permeability characteristics of superfine cement and fine fly ash mixture grouted sand[J]. ACI Mater. J. 117 (6), 293–304.
Ayhan, B., and Lale, E. (2022). Modeling strain rate effect on tensile strength of concrete using damage plasticity model. Int. J. Impact Eng. 162, 104132. doi:10.1016/j.ijimpeng.2021.104132
Cai, X. J., Xia, R., Huo, M. C., and Xu, J. (2018). A threshold formula for fatigue crack growth with mean stress intensity factors. Int. J. Mech. Sci. 135, 639–645. doi:10.1016/j.ijmecsci.2017.12.014
Chen, X. D., Wu, S. X., and Zhou, J. K. (2014). Quantification of dynamic tensile behavior of cement-based materials. Constr. Build. Mater. 51, 15–23. doi:10.1016/j.conbuildmat.2013.10.039
Dai, F., Xia, K. W., and Tang, L. Z. (2010). Rate dependence of the flexural tensile strength of Laurentian granite. Int. J. Rock Mech. Min. Sci. 47 (3), 469–475. doi:10.1016/j.ijrmms.2009.05.001
Dong, C. L., Lu, X. Y., Zhao, G. M., Meng, X., Li, Y., and Cheng, X. (2021). Experiment and applications of dynamic constitutive model of tensile and compression damage of sandstones. Adv. Mater. Sci. Eng. 2021, 1–13. doi:10.1155/2021/2492742
Gong, F. Q., Si, X. F., Li, X. B., and Wang, S. Y. (2019). Dynamic triaxial compression tests on sandstone at high strain rates and low confining pressures with split Hopkinson pressure bar. Int. J. Rock Mech. Min. Sci. 113, 211–219. doi:10.1016/j.ijrmms.2018.12.005
Han, Z. Y., Li, D. Y., Zhou, T., Zhu, Q., and Ranjith, P. (2020). Experimental study of stress wave propagation and energy characteristics across rock specimens containing cemented mortar joint with various thicknesses. Int. J. Rock Mech. Min. Sci. 131, 104352. doi:10.1016/j.ijrmms.2020.104352
Huang, J., Liu, X. L., Song, D. Q., Zhao, J., Wang, E., and Zhang, J. (2022). Laboratory-scale investigation of response characteristics of liquid-filled rock joints with different joint inclinations under dynamic loading. J. Rock Mech. Geotechnical Eng. 14 (2), 396–406. doi:10.1016/j.jrmge.2021.08.014
Hwang, C. L., and Hsieh, S. L. (2007). The effect of fly ash/slag on the property of reactive powder mortar designed by using Fuller's ideal curve and error function. Comput. Concr. 4 (6), 425–436. doi:10.12989/cac.2007.4.6.425
Jong, S. C., Ong, D. E. L., and Oh, E. (2021). State-of-the-art review of geotechnical-driven artificial intelligence techniques in underground soil-structure interaction. Tunn. Undergr. Space Technol. 113, 103946. doi:10.1016/j.tust.2021.103946
Khan, M. Z. N., Hao, Y. F., Hao, H., and Shaikh, F. u. A. (2019). Mechanical properties and behaviour of high-strength plain and hybrid-fiber reinforced geopolymer composites under dynamic splitting tension. Cem. Concr. Compos. 104, 103343. doi:10.1016/j.cemconcomp.2019.103343
Kim, S. M., and Abu Al-Rub, R. K. (2011). Meso-scale computational modeling of the plastic-damage response of cementitious composites. Cem. Concr. Res. 41 (3), 339–358. doi:10.1016/j.cemconres.2010.12.002
Lai, D. D., Demartino, C., and D. D. Y. X., (2022). High-strain rate tension behavior of fiber-reinforced rubberized concrete[J]. Cem. Concr. Compos. 131, 104554.
Li, W. M., and Xu, J. Y. (2009). Mechanical properties of basalt fiber reinforced geopolymeric concrete under impact loading. Mater. Sci. Eng. A 505 (1), 178–186. doi:10.1016/j.msea.2008.11.063
Li, X. J., Zhang, Y. Y., Shi, C., and Chen, X. (2020). Experimental and numerical study on tensile strength and failure pattern of high performance steel fiber reinforced concrete under dynamic splitting tension. Constr. And Build. Mater. 259, 119796. doi:10.1016/j.conbuildmat.2020.119796
Liang, Y., Chen, X. Y., Yang, J. S., Zhang, J., and Huang, L. (2020). Analysis of ground collapse caused by shield tunnelling and the evaluation of the reinforcement effect on a sand stratum. Eng. Fail. Anal. 115, 104616. doi:10.1016/j.engfailanal.2020.104616
Liao, Z. Y., Zhu, J. B., Xia, K. W., and Tang, C. A. (2016). Determination of dynamic compressive and tensile behavior of rocks from numerical tests of split Hopkinson pressure and tension bars. Rock Mech. Rock Eng. 49 (10), 3917–3934. doi:10.1007/s00603-016-0954-8
Liu, L., Wang, Y., and An, H. M. (2022). Fractal characteristics and energy dissipation of granite after high-temperature treatment based on SHPB experiment. Front. Earth Sci. (Lausanne). 10, 861847. doi:10.3389/feart.2022.861847
Liu, P. F., Zhou, X. P., Qian, Q. H., Berto, F., and Zhou, L. (2019). Dynamic splitting tensile properties of concrete and cement mortar. Fatigue Fract. Eng. Mat. Struct. 43 (4), 757–770. doi:10.1111/ffe.13162
Lv, N., Wang, H. B., Rong, K., Chen, Z., and Zong, Q. (2022). The numerical simulation of large diameter split Hopkinson pressure bar and Hopkinson bundle bar of concrete based on mesoscopic model. Constr. Build. Mater. 315, 125728. doi:10.1016/j.conbuildmat.2021.125728
Lv, T. H., Chen, X. W., and Chen, G. (2018). The 3D meso-scale model and numerical tests of split Hopkinson pressure bar of concrete specimen. Constr. Build. Mater. 160, 744–764. doi:10.1016/j.conbuildmat.2017.11.094
Ren, L. W., He, P. F., Zou, Y. F., Dun, Z. L., Zou, Z. s., and Wang, S. r. (2022). A new classification method of mine goaf ground activation considering high-speed railway influence. Front. Earth Sci. (Lausanne). 10, 896459. doi:10.3389/feart.2022.896459
Sun, B., Chen, R., Ping, Y., Zhu, Z., Wu, N., and Shi, Z. (2022). Research on dynamic strength and inertia effect of concrete materials based on large-diameter split Hopkinson pressure bar test. Materials 15 (9), 2995. doi:10.3390/ma15092995
Sun, J. Y., Xie, J. B., Zhou, Y., and Zhou, Y. (2022). A 3D three-phase meso‑scale model for simulation of chloride diffusion in concrete based on ANSYS. Int. J. Mech. Sci. 219, 107127. doi:10.1016/j.ijmecsci.2022.107127
Von Der Tann, L., Sterling, R., Zhou, Y. X., and Metje, N. (2020). Systems approaches to urban underground space planning and management – a review. Undergr. Space 5 (2), 144–166. doi:10.1016/j.undsp.2019.03.003
Wang, S. R., Zhao, J. Q., Wu, X. G., Yang, J. H., and Liu, A. (2021). Meso-Scale simulations of lightweight Aggregate concrete under impact loading. Int. J. Simul. Model. 20 (2), 291–302. doi:10.2507/ijsimm20-2-558
Wei, L. K., Yuan, Q., Ren, Y. W., al, er, Zhang, D., Liu, Y., et al. (2022). Analysis of failure mechanics and energy evolution of sandstone under uniaxial loading based on DIC technology. Front. Earth Sci. (Lausanne). 10, 814292. doi:10.3389/feart.2022.814292
Wen, T., Tang, H. M., Huang, L., Wang, Y., and Ma, J. (2020a). Energy evolution: A new perspective on the failure mechanism of purplish-red mudstones from the three gorges reservoir area, China. Eng. Geol. 264, 105350. doi:10.1016/j.enggeo.2019.105350
Wen, T., Tang, H. M., Ma, J. W., and Liu, Y. (2019). Energy analysis of the deformation and failure process of sandstone and damage constitutive model. KSCE J. Civ. Eng. 23 (2), 513–524. doi:10.1007/s12205-018-0789-9
Wen, T., Tang, H. M., Wang, Y. K., and Ma, J. (2020b). Evaluation of methods for determining rock brittleness under compression. J. Nat. Gas Sci. Eng. 78, 103321. doi:10.1016/j.jngse.2020.103321
Xie, B. J., Yan, Z., Du, Y. J., Zhao, Z., and Zhang, X. (2019). Determination of holmquist–johnson–cook constitutive parameters of coal: Laboratory study and numerical simulation. Processes 7 (6), 386. doi:10.3390/pr7060386
Xing, H. Z., Zhang, Q. B., Ruan, D., Dehkhoda, S., Lu, G., and Zhao, J. (2018). Full-field measurement and fracture characterisations of rocks under dynamic loads using high-speed three-dimensional digital image correlation. Int. J. Impact Eng. 113, 61–72. doi:10.1016/j.ijimpeng.2017.11.011
Xu, H., and Wen, H. M. (2016). A computational constitutive model for concrete subjected to dynamic loadings. Int. J. Impact Eng. 91, 116–125. doi:10.1016/j.ijimpeng.2016.01.003
Xu, Y., Dai, F., Xu, N. W., and Zhao, T. (2015). Numerical investigation of dynamic rock fracture toughness determination using a semi-circular bend specimen in split Hopkinson pressure bar testing. Rock Mech. Rock Eng. 49 (3), 731–745. doi:10.1007/s00603-015-0787-x
Xu, Z., H., H., and Li, H. (2012). Mesoscale modelling of fibre reinforced concrete material under compressive impact loading. Constr. And Build. Mater. 26 (1), 274–288. doi:10.1016/j.conbuildmat.2011.06.022
Yao, W., and Xia, K. W. (2019). Dynamic notched semi-circle bend (NSCB) method for measuring fracture properties of rocks: Fundamentals and applications. J. Rock Mech. Geotechnical Eng. 11 (5), 1066–1093. doi:10.1016/j.jrmge.2019.03.003
Ye, F., Liang, S., Liang, X. M., Zhang, W., Liu, C., and Feng, H. (2022). Grouting technology and construction schemes of a tunnel in aeolian stratum: A case study of shenmu No. 1 tunnel. Sci. Rep. 11 (1), 23552. doi:10.1038/s41598-021-03021-4
Yu, Q., Chen, Z. Y., Yang, J., and Rong, K. (2021). Numerical study of concrete dynamic splitting based on 3D realistic aggregate mesoscopic model. Materials 14 (8), 1948. doi:10.3390/ma14081948
Zhou, X. Q., and Hao, H. (2008). Mesoscale modelling of concrete tensile failure mechanism at high strain rates. Comput. Struct. 86 (21-22), 2013–2026. doi:10.1016/j.compstruc.2008.04.013
Keywords: grouting specimens, SHPB, crack evolution, energy evolution, Ls-Dyna
Citation: Zhu C-X, Sun J-X, Gong J and Wang F-E (2023) Experimental and numerical research of crack propagation process and energy dissipation law of grouting specimens under radial impact load. Front. Earth Sci. 10:1037756. doi: 10.3389/feart.2022.1037756
Received: 06 September 2022; Accepted: 31 October 2022;
Published: 10 January 2023.
Edited by:
Guang-Liang Feng, Institute of Rock and Soil Mechanics (CAS), ChinaCopyright © 2023 Zhu, Sun, Gong and Wang. This is an open-access article distributed under the terms of the Creative Commons Attribution License (CC BY). The use, distribution or reproduction in other forums is permitted, provided the original author(s) and the copyright owner(s) are credited and that the original publication in this journal is cited, in accordance with accepted academic practice. No use, distribution or reproduction is permitted which does not comply with these terms.
*Correspondence: Jia-Xin Sun, c3VuamlheGluQGhvbWUuaHB1LmVkdS5jbg==
Disclaimer: All claims expressed in this article are solely those of the authors and do not necessarily represent those of their affiliated organizations, or those of the publisher, the editors and the reviewers. Any product that may be evaluated in this article or claim that may be made by its manufacturer is not guaranteed or endorsed by the publisher.
Research integrity at Frontiers

Learn more about the work of our research integrity team to safeguard the quality of each article we publish.