
94% of researchers rate our articles as excellent or good
Learn more about the work of our research integrity team to safeguard the quality of each article we publish.
Find out more
ORIGINAL RESEARCH article
Front. Earth Sci., 13 January 2023
Sec. Atmospheric Science
Volume 10 - 2022 | https://doi.org/10.3389/feart.2022.1024979
This article is part of the Research TopicTropical Cyclone Intensity and Structure Changes: Theories, Observations, Numerical Modeling and ForecastingView all 19 articles
Satellite-based remote sensing technology plays a significant role in identifying tropical cyclones (TCs), and most of the current research focuses on intensity estimation. However, analyzing the wind structure of TCs, which is directly related to the danger they bring, remains a challenge. By adding prior knowledge of TCs into the model, we propose a physics-incorporated network based on multi-task learning to estimate wind radii and intensity, whose layers can automatically extract rotation-invariant features related to the TC core from multichannel satellite imageries. In addition, we build a more comprehensive dataset, including global Statistical Hurricane Intensity Prediction Scheme (SHIPS) predictors, to tackle the structure task. We compare our model with existing methods, and it shows that our model gets better results in estimating 50-knot and 64-knot wind radii and achieves a 4.87-knot root-mean-squared error (RMSE) of intensity. By predicting probability density functions, our model quantifies the uncertainty of the result. The experimental results show that the incorporation of rotation equivariance into the layers can enhance TC structure estimation. By considering the feature importance of multi-source predictors, we find that our model pays attention to key predictors related to the TC structure. Specifically, the tangential wind speed at 500 km from the TC center and the radius of the 5-knot wind both greatly reduce the error of the estimated parameters. Finally, two case studies show that the proposed model performs well most of the time during TCs’ rapid intensification. However, when TCs’ system is not well organized, estimating the wind structure is challenging.
TCs combined with high winds and heavy rainfall are considered extreme weather phenomena that cause significant damage to coastal areas around the world, and the potential damage level of a TC is determined by its surface wind field (Maclay et al., 2008). Estimating TC near-surface winds accurately helps operational centers make better forecasts. The radius of maximum winds (RMW) and different maximum radial extents of wind speed thresholds, like 34-, 50-, and 64-kt (R34, R50, and R64), are used by operational centers to represent the wind field. U.S. TC warning centers include these parameters in input files (i.e., “TC vitals” files) for assimilation to improve TC-focused numerical weather prediction (Knaff et al., 2021).
The most direct way to obtain TC winds is using spaceborne active radars such as scatterometers (Figa-Saldaña et al., 2002; Stiles et al., 2014), but it is not possible to get an expected frequency because they are usually located on polar-orbiting satellites that only scan the same TC twice a day. To meet operational needs, we can use geostationary satellites, which typically collect data every 15 minutes. Infrared imageries that observe cloud features from geostationary satellites have been used to locate the TC center and identify cloud band distribution by the conventional Dvorak method (Dvorak, 1975). Knaff et al. (2014b) demonstrated that features extracted from infrared imageries are related to structural parameters such as wind radii. With the advent of higher resolution instruments, infrared imageries are more widely used to estimate the TC structure, especially by statistical methods (Dolling et al., 2016; Reul et al., 2017).
However, traditional statistical methods do not make effective use of data. Following the success of deep learning in the field of computer vision, Pradhan et al. (2018) first applied deep convolutional neural networks (CNN) to estimate the intensity of TCs and obtained better results than the optimal model at that time. The current consensus is that incorporating prior knowledge can efficiently enhance prediction skills. Chen B. et al. (2018) blended multiple TC intensity estimations, thus reducing the variance of results caused by rotation. Chen et al. (2021) also obtained better performance on the TC structure task by using convolutional kernels on polar coordinates compared with Cartesian coordinates. By incorporating the knowledge of meteorology, such as the rotation invariance of TCs, these models achieve better results. In this study, we further incorporate the rotation invariance of TCs into the model structure using rotation-equivariant layers, which can output permuted features with rotated input.
Besides optimizing the model structure, data is a crucial component of deep learning. In addition to satellite imageries, we can infuse auxiliary information to improve the model’s performance (Chen B.-F. et al., 2019). Zhuo and Tan (2021) showed that the inclusion of TC fullness can help the model improve TC structure estimation. There are many available auxiliary variables related to the TC structure. Knaff et al. (2014b) showed that the radius of a 5-kt wind can represent TC size variations. Environmental variables are also critical for analyzing the TC structure since the ocean and the atmosphere exchange a lot of energy when TCs are active. For example, the central pressure deficit increases with increasing intensity, size, and the Coriolis parameter (Chavas et al., 2017). A decrease in the sea surface temperature (SST) under a TC’s eye has a significant impact on the TC intensity (Schade, 2000). To incorporate the previously mentioned and additional variables into the model, we build a dataset by collecting large-scale SHIPS predictors from multiple sources.
As mentioned previously, we propose the physics-incorporated network to tackle the TC structure task by extracting rotation-invariant features and combining multiple sources of auxiliary information. To show the efficacy of our methods, we conduct comparison experiments, the structure ablation study, the predictor sensitivity study, and the case study. First, we evaluate the model’s performance under an operational setting and obtain 39.90, 21.35, 11.80, and 24.86 km mean absolute error (MAE) on R34, R50, R64, and RMW. The RMSE of the model on intensity reaches an error of 4.87 kt. To make more informed predictions, Softmax is used as the activation layer to predict probability density functions. We can select bins with high confidence to further enhance the credibility of the results. Second, we compare models with and without rotation-equivariant layers, which shows that rotation-equivariant layers can further extract rotation-invariant features from infrared imageries on the TC structure task. Third, we conduct experiments about predictors to get more insight from the model. By incorporating these predictors, our model surpasses the baseline in estimating the wind radii of TCs by 18.5%, 18.2%, 18.6%, 20.2%, and 55.7% for R34, R50, R64, RMW, and intensity, respectively. Then, we calculate feature attributions on estimated parameters and find that it takes into account important predictors associated with the TC structure. Among the 120 predictors we use, the model focuses on predictors related to the TC size derived from infrared imageries. Finally, we select two TCs to analyze our model.
This study is organized as follows. Section 2 describes the structure of our model and the composition of the dataset. Section 3 discusses experiments and results, including comparison experiments, the structure ablation study, the predictor sensitivity study, and the case study. Section 4 concludes our study.
We develop the physics-incorporated network, as shown in Figure 1, to estimate wind radii and intensity. The input to our model consists of two parts: satellite imageries and predictors. First, we use a deep residual network as the backbone to extract features from images. Second, the predictors are concatenated as the input of fully connected layers. In computer vision, much work has confirmed the effectiveness of convolutional neural networks with residuals (He et al., 2016; Chen H. et al., 2019; He et al., 2020). Shortcut connections in the residual network help the first few layers get updates efficiently, and the vanishing gradient problem no longer happens. We endeavor to improve model performance by incorporating the physical knowledge of TCs into the model. It is known that a TC can be seen as a tropical mesoscale convective system with rotation invariance. The rotation-invariant feature is important for identifying arbitrary-oriented objects. Feeding a rotated image to a regular CNN is not the same as rotating feature maps of the original image. Group equivariant convolutional neural networks extend the equivariance of convolutional neural networks from translation to rotation (Cohen and Welling, 2016), and more experiments (Worrall et al., 2017) demonstrate the validity. Given a transformation group G and a function Φ: X → Y, equivariance can be expressed as follows:

FIGURE 1. Overview of the physics-incorporated network. Residual neural network with rotation-equivariant (Ro-equ) layers extracts rotation invariance features from satellite imageries. Then, the extracted features and SHIPS predictors are combined in one tensor to be the input of fully connected layers in terms of feature representations. The last layer of the model applies softmax to output probabilistic results. Finally, we calculate the expectation to get the final estimation value.
where Tg indicates a group action in the space. The translation equivariant of CNNs can be expressed as follows:
where Tt denotes an action of the translation group
where G is a semidirect product of the translation group and the rotation group. Our model stacks rotation-equivariant layers with a higher degree of weight sharing. The extracted features and multi-source predictors are concatenated as the input of fully connected layers. At last, the output of the fully connected layers is separated into five parts on average before feeding to the last layer.
The optimization objective of our model contains five components: R34, R50, R64, RMW, and intensity. Manually adjusting the loss coefficient for each task not only wastes computational resources but also makes it difficult to trade off each task. We use dynamic weight averaging (DWA) (Liu et al., 2019) to learn the adaptive weights λk for each task k, where wk represents the relative descending rate between epochs as follows:
where
We choose MAE as the metric for wind radii tasks because of its robustness to anomaly data and MSE as the metric for the intensity task.
Currently, most of the datasets related to TC winds use satellite data. It is worth noting that they do not consider auxiliary information, including environmental variables. Knaff et al. (2017) developed a global statistical–dynamical TC wind radii forecast scheme using a subset of SHIPS predictors. We can further make use of these predictors on the TC structure task. As far as we know, there is no available dataset containing these variables. Therefore, we build the Tropical Cyclone Wind Dataset (TCWD), which includes multi-source variables and satellite imageries, to further explore the TC structure.
TCWD collects Statistical Hurricane Intensity Prediction Scheme (SHIPS) predictors related to climatology, persistence, the atmosphere, and the ocean (DeMaria et al., 2005). These predictors are used to predict the rapid intensification of TCs (Kaplan et al., 2015; Xu et al., 2021). With a large number of variables being added to the predictors, we can use deep neural networks to learn complex nonlinear relationships. Predictors related to brightness temperature (BT) are derived from GOES infrared imageries, which provide information about the structure of the deep convection near the TC center. Several predictors are obtained from the GOES Channel 4 (10.7 μm) imagery. The Channel 4 BT were azimuthally averaged on a 4-km, TC-centered radial grid. The BT standard deviations from the azimuthal average were also calculated at each radius. Storm environment predictors are derived from numerical models such as the global forecasting system (GFS), which include zonal and meridional wind, shear, vorticity, and divergence. The zonal component of motion distinguishes between TCs in easterly and westerly basic currents. The divergence measures synoptic-scale forcing. The climatological SST and the climatological depth of the 20 °C isotherms are derived from the 2005–2010 mean of the Navy Coupled Ocean Data Assimilation analyses. Oceanic predictors along the path of the TCs include oceanic heat content derived from Navy Coupled Ocean Data Assimilation (NCODA) analyses.
The SHIPS development version dataset includes reanalysis data for over 100 predictors, most of which are applicable every 6 hours, but only 20% of which are actually applied to operational forecasts. Unlike the reanalysis data, the operational data are only applicable when National Hurricane Center (NHC) forecasts are available, and the Joint Typhoon Warning Center (JTWC) maintains operational data for other regions. The operational data tend to have larger errors than the reanalysis data. The TCWD contains all available predictors from the operational version of the SHIPS dataset at the time step of 0 h. The data are interpolated every 3 hours.
The satellite imageries consist of four channels, as shown in Figure 2. We collect infrared (IR) imageries, water vapor (WV), and visible (VIS) from GridSat (Knapp et al., 2011), and the passive microwave rain rate (PMW) from CMORPH (Xie et al., 2017). The imageries are externally cut rectangles with the center of the TCs as the center of the circle. For each imagery, there are 161 × 161 pixels, and the resolution is 7/100° lat/lon. The actual distance between two pixels is about 7.7 km. We replace the missing data with zero because it does not affect convolution operations.
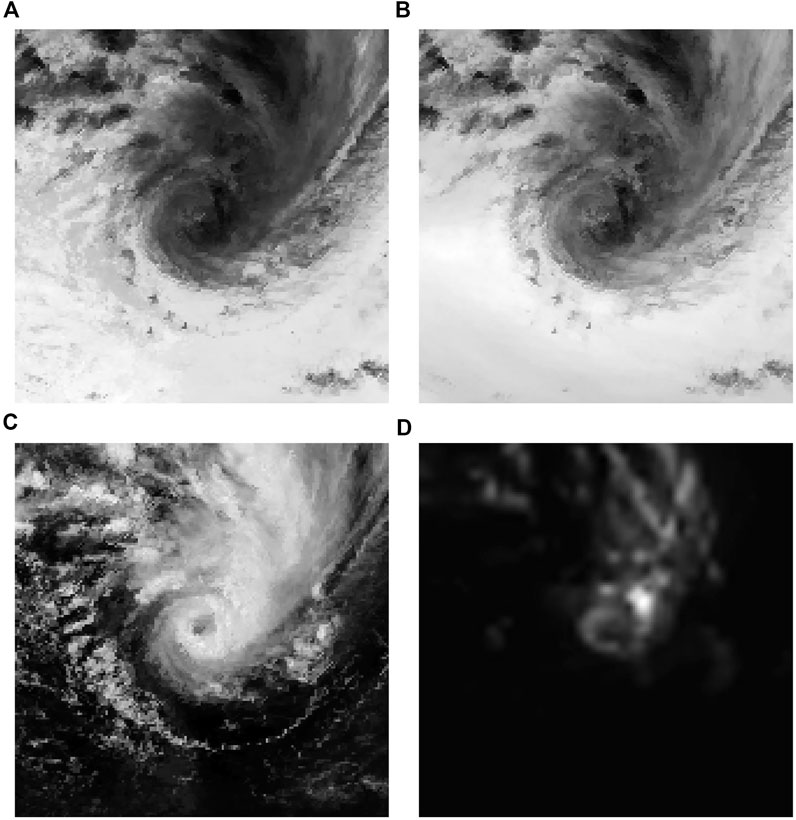
FIGURE 2. Four channels of a TC from TCWD. (A) Infrared. (B) Water vapor. (C) Visible. (D) Passive microwave rain rate.
The wind radii and intensity labels come from JTWC and the Tropical Cyclone Extended Best Track Dataset (EBTRK) (Demuth et al., 2006). We interpolated the labels every 3 h to get more samples and applied a nonzero-azimuthal average to get the wind radii labels since they are recorded for each quadrant (NE, SE, SW, and NW).
TCWD contains 90486 samples from 1614 TCs, of which 55,218 samples contain SHIPS predictors. The training set contains 67,454 samples from 2004 to 2016. A total of 10,824 samples from 2017 to 2019 are selected as the validation set, and 12,198 samples from 2018 to 2020 are selected as the test set. Table 1 shows the sample number of SHIPS predictors that are available. The TCWD is a benchmark dataset for the structure analysis of TCs.
We use the Adam optimizer (Kingma and Ba, 2015) to train the network, and the learning rate is set to 0.001. Every ten epochs, we reduce the learning rate by half. When the model shows no improvement after 20 epochs, we will stop training. To make the experiments consistent, we train and test our models on the data that contains SHIPS predictors. To simulate operational predictions, only IR and WV channels are used because the PMW channel has a delay. We exclude the VIS channel because the VIS channel is unstable at night. The input is filled with zero when the predictors are not available.
In this section, we compare the performance of our model with other TC structure estimate methods. The final model, combined with rotation equivariance and SHIPS predictors, produces MAEs of 39.90, 21.35, 11.80, and 24.86 km for R34, R50, R64, and RMW, respectively, which is better than those of Knaff et al. (2016) and close to the deviation angle variance technique (Dolling et al., 2016). To compare with other deep learning methods, we collect satellite imageries from the same source. However, there are still inconsistencies between datasets, such as the year of the sample. A subjective comparison suggests that the errors of all estimated parameters are lower than those reported by Knaff et al. (2016) and Chen et al. (2021). The RMSE of the model on intensity reaches an error of 4.87 kt, which is currently the best model for estimating the intensity to the best of our knowledge. Compared with DeepTCNet (Zhuo and Tan, 2021), our model yields better results on R50, R64, and intensity. There are some gaps between our model and DeepTCNet in estimating R34 and RMW because the DeepTCNet takes TC fullness calculated from TC vitals (namely, R34 and RMW) as the input. It is difficult for the DeepTCNet to achieve the corresponding performance in a real-time setting. To evaluate the performance of our model for each estimated parameters, a scatter plot and a box diagram are used. The vertical axis represents the estimated values of our model, while the horizontal axis represents the labels from the best track. From Figure 3, it is seen that the estimated TC wind radii are consistent with the best track data. However, the model underestimates TCs with high RMW due to the strongly convecting inner core. On the other hand, since these parameters in the best tracks are not subjected to vigorous post-storm review (Knaff et al., 2021), the result of our model is reasonable. In particular, Figure 4 shows that the estimated intensity is almost in line with the best track data. Although our model tends to underestimate the intensity of TCs, we can conclude that our model is robust and generalizes well. Because we need to estimate multiple variables, we use DWA to calculate the loss. We train a ResNet to estimate wind structure with different loss coefficients in Table 3. Compared with manually setting the loss coefficient, DWA achieves the smallest normalized error. Finally, we evaluate the probabilistic results from the model. Since we use the Softmax layer, we can also get the probability of each interval, which is equally divided by the minimum and maximum values of the label. Figure 5 shows that it is difficult to take the bin with the predicted highest probability, that is, top 1, as the correct bin. But when we take the top five bins, the chances of getting the correct result are greatly increased. Moreover, about 60% of the test samples are correctly classified in the top 10 bins. Given that there are 100 bins, the probabilistic results are valuable in weather forecasting. In terms of probabilistic results, our model excels at estimating R64 and R50.
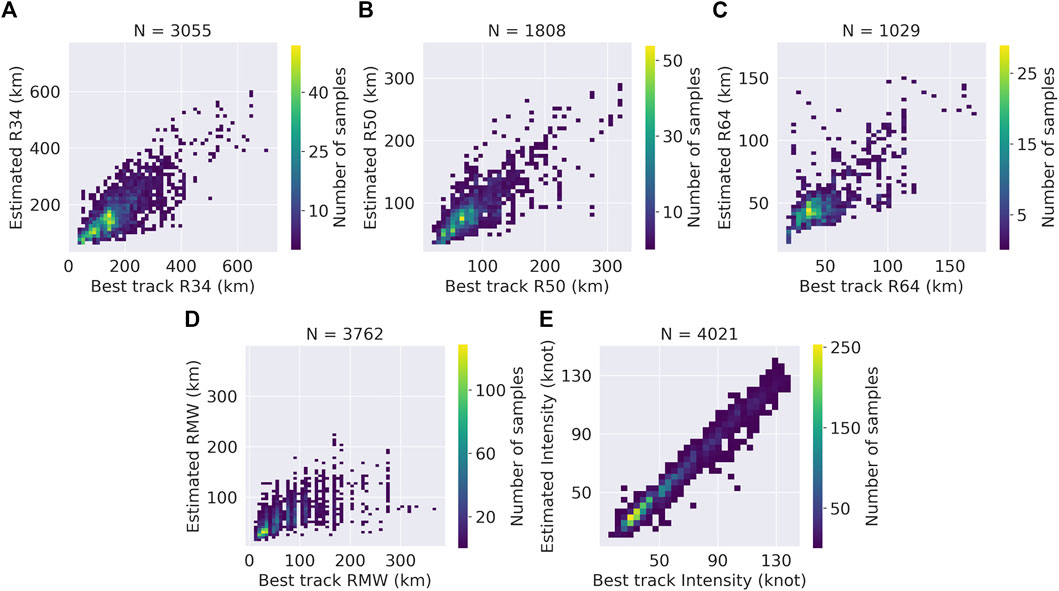
FIGURE 3. Scatter plot of the degree of fit and dispersion for estimated R34 (A), R50 (B), R64 (C), RMW (D), and intensity (E). The model is evaluated on the test set for TCs in 2018 and 2020.
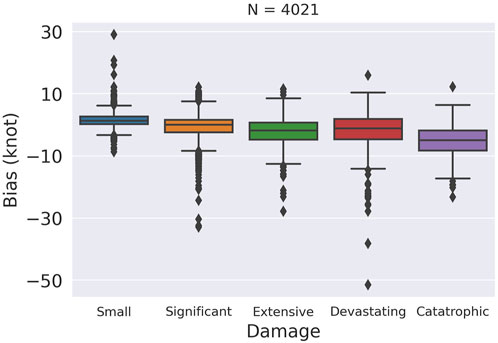
FIGURE 4. Box diagram of the bias plot for TCs by different scales of damage. The model is evaluated on the test set for TCs in 2018 and 2020. Although a small number of anomalous points can be observed, the majority of estimation results are within the 10-knot bias, which is sufficiently accurate.
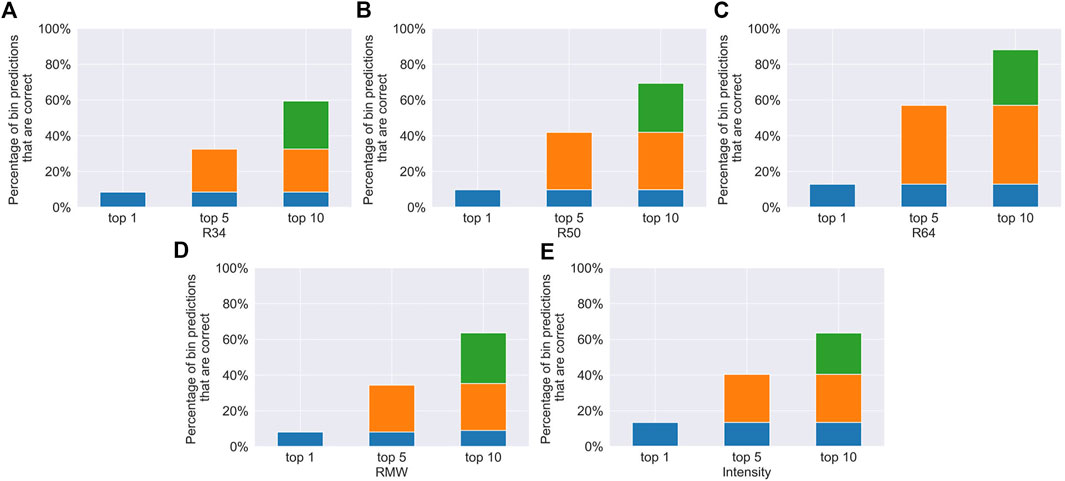
FIGURE 5. Percentage of all samples on the test set for TCs in 2018 and 2020 where one of the top k most likely bins predicted by our model is the observed bin for R34 (A), R50 (B), R64 (C), RMW (D), and intensity (E), respectively. The k is set to 1, 5, and 10. Different colors are used to indicate the gap between columns.
This part performs ablation studies based on satellite data and predictors by adding rotation-equivariant layers to demonstrate the efficacy of the model structure. As shown in Table 2, the incorporation of the rotation equivariance property improves the errors of wind radii and intensity by 3.1% and 3.0%, on average, compared with ResNet without the rotation-equivariant layers (baseline). We also compare models with the inclusion of SHIPS predictors, and the rotation equivariance layers reduce the error of wind radii and intensity by 1.3% and 5.0%, on average. This proves that our model can extract more features independent of rotation by assuming that the TC is fairly axis-symmetric with respect to the center.
However, it should be noted that the errors for best track wind radii could be as high as 40% decades ago, differing by year and observation. The errors in the best track intensity have been estimated to be more than 10% (Landsea and Franklin, 2013). In recent years, TC warning centers have made efforts to reanalyze the estimations. Moreover, as the quality of observations improves, the error will become smaller. To mitigate the TC-related damage, it is necessary to further improve the wind structure estimations.
We find that the model incorporating SHIPS predictors surpasses the baseline in estimating the wind radii of TCs by 18.5%, 18.2%, 18.6%, 20.2%, and 55.7% for R34, R50, R64, RMW, and intensity, respectively. Due to limited knowledge, it is difficult to manually identify the importance of predictors. If a feature is important, then it should be crucial for the output and have a high value. So a baseline approach for computing the contribution degree is to multiply the input with the gradient with respect to the input (Shrikumar et al., 2017). However, this method violates the axiom of sensitivity, which can be solved by approximating the product of the gradient integral and the input xi as follows (Sundararajan et al., 2017):
We get the top 10 most important predictors and contribution degree to each parameter, as shown in Table 4, by normalizing them across all the inputs for each feature (the 120 final predictors used in this study are listed in Supplementary Table S1). Obviously, our model pays attention to IR-related predictors, which are extracted from Geostationary Operational Environmental Satellite (GOES) data. V500, R5, and the scaling factor are TC size estimation variables that rank in top 3. V500 is regressed by the sine of the latitude, and the first three normalized principle components (PCs) are azimuthally averaged radial profiles of IR brightness temperatures. R5 is the radius where the TC wind field is indistinguishable from the background flow in a climatological environment. Knaff et al. (2014b) showed that R5, V500, and intensity can explain the R34 variance in linear regression. The radial scaling factor FR5 is created by dividing the observed R5 by R5c as follows:
where R5c has units of the degree latitude based on the intensity Vm. The scaling factor affects the spatial distribution of brightness temperatures, which is directly related to wind radii (Knaff et al., 2014a).
In addition to these TC size estimation variables, we also list other top five important predictors and contribution degrees in Table 5. In these predictors, PENC, Z000, and PENV are all variables related to pressure. For example, PENC describes the azimuthally averaged surface pressure at the outer edge of the vortex. The relationship between the radial distributions of the pressure and azimuthal wind can be approximated as follows (Chavas et al., 2017):
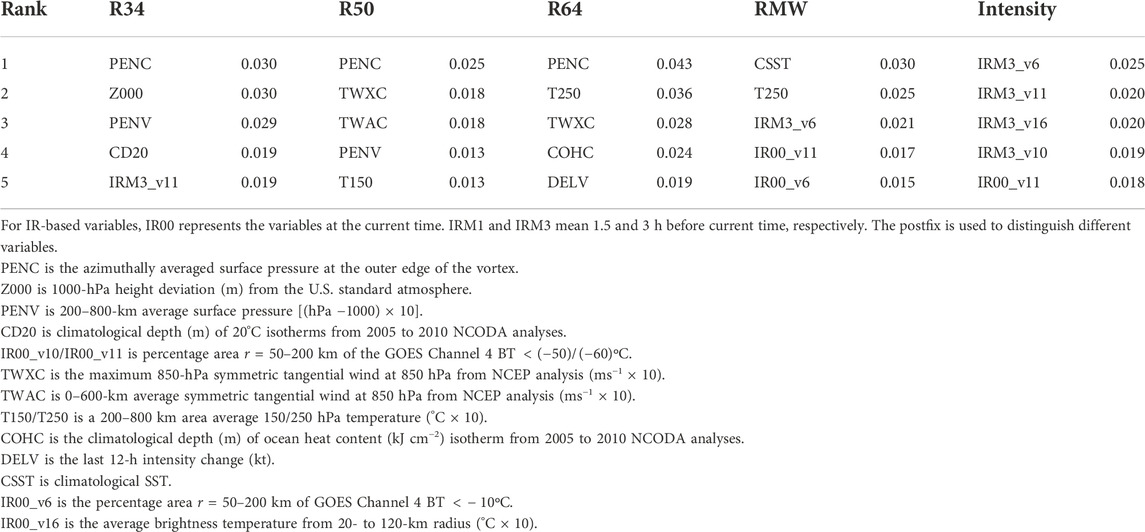
TABLE 5. Top five most important predictors and contribution degree to estimated parameters except TC size estimation variables.
where p is air pressure, r is the radius from the TC center, v is the azimuthal wind, ρ is the air density, and f is the Coriolis parameter evaluated at the latitude of the TC center. CSST is also important to estimate RMW because SST may play a role in increasing the TC wind field (Maclay et al., 2008). TWXC and TWAC are tangential wind-related predictors that describe the quality of the TC cyclonic structure. As ocean heat content controls the energy supply of TCs, CD20 and COHC are both useful predictors (Wada and Usui, 2007). Other important predictors include brightness-related variables from infrared imageries that describe the strength of convection and the cloud structure. These predictors can also improve prediction skills in terms of the degree of contribution.
Additionally, we select two TCs and plot our predictions and labels to show concrete results.
Hurricane Genevieve was one of the most powerful and long-lived hurricanes in 2020, which caused more than $50 million in economic losses in Mexico. Genevieve became a hurricane by August 17, and it started to rapidly intensify the following day. By UTC 12:00 on August 18, Genevieve reached its peak intensity, with maximum sustained winds of 115 kt. As shown in Figure 6, our model gives a closer estimate of the wind structure most of the time. However, it would be challenging to predict the wind structure when the system is disordered.
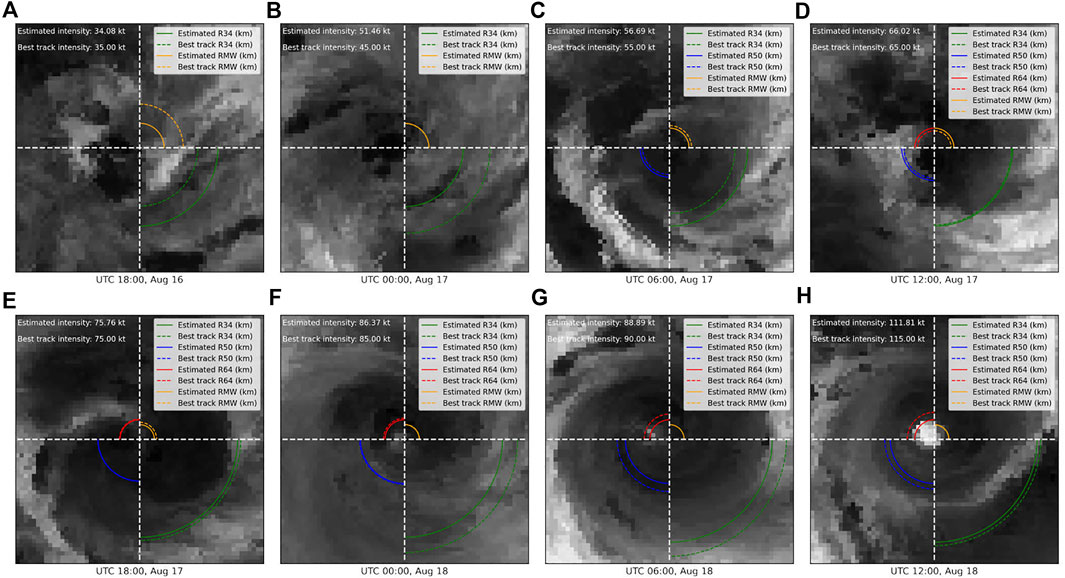
FIGURE 6. Plots of estimated R34, R50, R64, RMW, and intensity of Hurricane Genevieve throughout its intensification.
Another case is Hurricane Willa, which is shown in Figure 7, which killed nine people and caused $825 million in damage after its landfall in Mexico. To begin with, a new low-pressure trough, an elongated region of low atmospheric pressure, developed to the west of the original low on October 19. At UTC 00:00 on October 20, the system developed into a tropical depression while being located approximately 425 km south of Manzanillo, Mexico. Around UTC 12:00, the system’s tight inner core strengthened into a tropical storm. The system was chaotic as we saw on the satellite imageries until this moment, which was hard to be estimated. Willa soon started to rapidly intensify. Environmental conditions allowed Willa to strengthen into a hurricane around UTC 06:00 on October 21. The eye of Willa became well-defined on satellite imageries by UTC 18:00. It can be seen that the estimation results of our model are relatively close to the best track during this process, where the largest error is R34. Continuing to rapidly intensify, Willa reached the peak intensity with maximum sustained winds of 140 kt at approximately UTC 06:00 on October 22. The system weakened and made landfall at UTC 01:20 on October 24. Following the landfall, Willa rapidly weakened, degenerating into a tropical storm by UTC 06:00, which became chaotic on satellite imageries. Six hours later, Willa dissipated over northeastern Mexico. In general, our model has a good performance in the rapid intensification of Hurricane Willa. The estimation of wind radii is a challenge for our model when the eye of TCs is not clear.
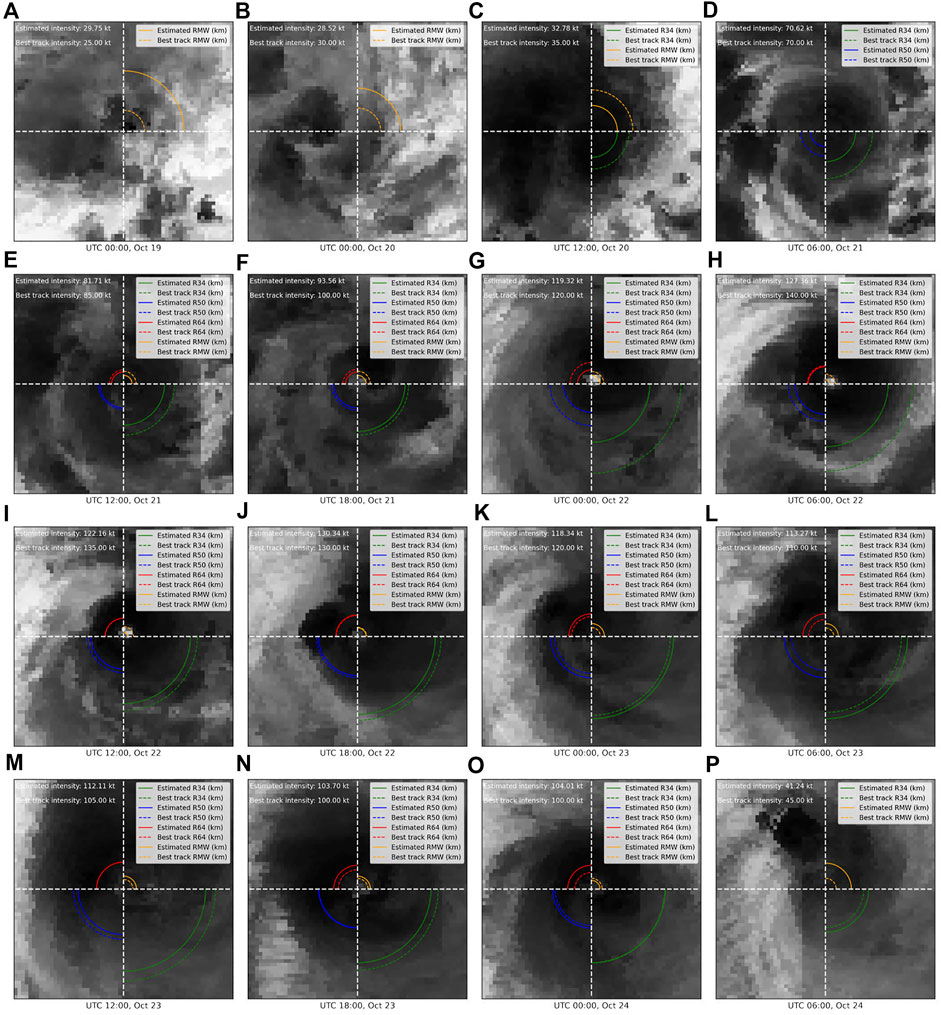
FIGURE 7. Plots of estimated R34, R50, R64, RMW, and intensity of Hurricane Willa throughout its lifespan.
In this study, we develop a physics-incorporated network to estimate the TC wind structure. Our method boosts performance on both the model and data sides. On one hand, rotation-equivariant layers enhance the performance because of the rotation invariance of TCs. On the other hand, multi-source predictors related to the TC structure augment the performance from the perspective of features. We apply dynamic weight averaging to achieve a balance among multi-tasks in a simple way. By splitting the range of labels into 100 bins on an average, we provide more informed estimations to quantify the uncertainty of network outputs. Specifically, the correct bin is one of the top 10 most likely for around 60% of the data points of the estimated parameters. We compare our model with other methods on the TC structure task. The structure ablation study is performed to examine the efficacy of rotation-equivariant layers. We also conduct predictor sensitivity studies to mine the relationship between models and predictors. Hurricane Genevieve and Hurricane Willa are used as examples to show our prediction.
Our model obtains 39.90, 21.35, 11.80, and 24.86 km MAEs on R34, R50, R64, and RMW under an operational setting. It also reaches an error in the intensity of 4.87 kt, which surpasses other models. In the current experimental settings, we find that the incorporation of rotation-equivariant layers reduces wind radii and intensity errors compared with the baseline. In addition, with the incorporation of predictors, we find the results are improved by 18.8% and 55.7% for wind radii and intensity estimation, on average. The predictors are ranked by calculating feature attribution that describes the degree of importance to the output. The result shows that our model focuses on key predictors, including V500, R5, and the scaling factor. We also find environmental variables such as surface pressure and SST to be helpful. Our model gets close results to the wind structure of Hurricane Genevieve and Hurricane Willa during rapid intensification in the case study. However, the performance of the model needs to be improved when the system is unstable. It is worth noting that there are still unavoidable errors in the labels we use, especially in wind radii, which will be improved with more frequent post-season analysis.
In general, the physics-incorporated network is well-designed for estimating the tropical cyclone wind structure and can be applied to operational settings. Although observations like scatterometers can directly detect the TC wind field, our method can play a role in the rapid intensification of TCs at a high frequency because early awareness of these disasters results in saving many lives. With the emergence of more high-quality observations, estimation could be more accurate in the future by incorporating auxiliary information. Currently, although this study only discussed the symmetric wind radii estimation, we provide the dataset with asymmetric features such as wind shear when considering the TC wind field’s asymmetries.
The datasets presented in this study can be found in online repositories. The names of the repository/repositories and accession number(s) can be found at: Tropical Cyclone Wind Dataset Qianhu, 2022.
All authors designed the experiments and carried them out. QY developed the model code and performed the simulations. QY and SY prepared the manuscript with contributions from all co-authors.
This study is supported in part by the Meteorological Joint Funds of the National Natural Science Foundation of China under Grant U2142211, in part by the Key Project Fund of Shanghai 2020 “Science and Technology Innovation Action Plan” for Social Development under Grant 20dz1200702, in part by the National Key Research and Development Program of China under Grant 2020YFA0608000, in part by the National Natural Science Foundation of China under Grant 42075141, 41875057, 41730960, and in part by the first batch of Model Interdisciplinary Joint Research Projects of Tongji University in 2021 under Grant YB-21-202110.
The authors thank Dr. Mark DeMaria for his generous help to the data.
The authors declare that the research was conducted in the absence of any commercial or financial relationships that could be construed as a potential conflict of interest.
All claims expressed in this article are solely those of the authors and do not necessarily represent those of their affiliated organizations, or those of the publisher, the editors, and the reviewers. Any product that may be evaluated in this article, or claim that may be made by its manufacturer, is not guaranteed or endorsed by the publisher.
The Supplementary Material for this article can be found online at: https://www.frontiersin.org/articles/10.3389/feart.2022.1024979/full#supplementary-material
Chavas, D. R., Reed, K. A., and Knaff, J. A. (2017). Physical understanding of the tropical cyclone wind-pressure relationship. Nat. Commun. 8, 1360. doi:10.1038/s41467-017-01546-9
Chen, B.-F., Chen, B., Lin, H.-T., and Elsberry, R. L. (2019a). Estimating tropical cyclone intensity by satellite imagery utilizing convolutional neural networks. Weather Forecast. 34, 447–465. doi:10.1175/WAF-D-18-0136.1
Chen, B., Chen, B.-F., and Hsiao, C. M. (2021). CNN profiler on polar coordinate images for tropical cyclone structure analysis. Proc. AAAI Conf. Artif. Intell. 35, 991–998. doi:10.1609/aaai.v35i2.16183
Chen, B., Chen, B.-F., and Lin, H.-T. (2018a). “Rotation-blended CNNs on a new open dataset for tropical cyclone image-to-intensity regression,” in Proceedings of the 24th ACM SIGKDD international conference on knowledge discovery data mining. (New York, NY: KDD), 18, 90–99. doi:10.1145/3219819.3219926
Chen, H., Mo, Z., Yang, Z., and Wang, X. (2019b). “Theoretical investigation of generalization bound for residual networks,” in Proceedings of the twenty-eighth international Joint conference on artificial intelligence. (Macao, China: International Joint Conferences on Artificial Intelligence Organization), 2081–2087. IJCAI-19. doi:10.24963/ijcai.2019/288
Chen, Z., Badrinarayanan, V., Lee, C.-Y., and Rabinovich, A. (2018b). “GradNorm: Gradient normalization for adaptive loss balancing in deep multitask networks,” in Proceedings of the 35th international conference on machine learning. Editors J. Dy, and A. Krause (Stockholm, Sweden: PMLR), 794–803.
Clare, M. C., Jamil, O., and Morcrette, C. J. (2021). Combining distribution-based neural networks to predict weather forecast probabilities. Q. J. R. Meteorol. Soc. 147, 4337–4357. doi:10.1002/qj.4180
Cohen, T., and Welling, M. (2016). “Group equivariant convolutional networks,” in Proceedings of the 33rd international conference on machine learning. Editors M. F. Balcan, and K. Q. Weinberger (New York, New York, USA: PMLR), 48, 2990–2999.
DeMaria, M., Mainelli, M., Shay, L. K., Knaff, J. A., and Kaplan, J. (2005). Further improvements to the statistical hurricane intensity prediction scheme (SHIPS). Weather Forecast. 20, 531–543. doi:10.1175/WAF862.1
Demuth, J. L., DeMaria, M., and Knaff, J. A. (2006). Improvement of advanced microwave sounding unit tropical cyclone intensity and size estimation algorithms. J. Appl. Meteorol. Climatol. 45, 1573–1581. doi:10.1175/JAM2429.1
Dolling, K., Ritchie, E. A., and Tyo, J. S. (2016). The use of the deviation angle variance technique on geostationary satellite imagery to estimate tropical cyclone size parameters. Weather Forecast. 31, 1625–1642. doi:10.1175/WAF-D-16-0056.1
Dvorak, V. F. (1975). Tropical cyclone intensity analysis and forecasting from satellite imagery. Mon. Weather Rev. 103, 420–430. doi:10.1175/1520-0493(1975)103¡0420:TCIAAF¿2.0.CO;2
Figa-Saldaña, J., Wilson, J. J., Attema, E., Gelsthorpe, R., Drinkwater, M. R., and Stoffelen, A. (2002). The advanced scatterometer (ascat) on the meteorological operational (MetOp) platform: A follow on for European wind scatterometers. Can. J. Remote Sens. 28, 404–412. doi:10.5589/m02-035
He, F., Liu, T., and Tao, D. (2020). Why ResNet works? Residuals generalize. IEEE Trans. Neural Netw. Learn. Syst. 31, 5349–5362. doi:10.1109/TNNLS.2020.2966319
He, K., Zhang, X., Ren, S., and Sun, J. (2016). “Deep residual learning for image recognition,” in 2016 IEEE conference on computer vision and pattern recognition (CVPR), 770–778. doi:10.1109/CVPR.2016.90
Kaplan, J., Rozoff, C. M., DeMaria, M., Sampson, C. R., Kossin, J. P., Velden, C. S., et al. (2015). Evaluating environmental impacts on tropical cyclone rapid intensification predictability utilizing statistical models. Weather Forecast. 30, 1374–1396. doi:10.1175/WAF-D-15-0032.1
Kingma, D. P., and Ba, J. (2015). “Adam: A method for stochastic optimization,” in 3rd international conference on learning representations. ICLR 2015.
Knaff, J. A., DeMaria, M., Longmore, S. P., and DeMaria, R. T. (2014a). Improving tropical cyclone guidance tools by accounting for variations in size. San Diego, CA: Environmental Science.
Knaff, J. A., Longmore, S. P., and Molenar, D. A. (2014b). An objective satellite-based tropical cyclone size climatology. J. Clim. 27, 455–476. doi:10.1175/JCLI-D-13-00096.1
Knaff, J. A., Sampson, C. R., and Chirokova, G. (2017). A global statistical–dynamical tropical cyclone wind radii forecast scheme. Weather Forecast. 32, 629–644. doi:10.1175/WAF-D-16-0168.1
Knaff, J. A., Sampson, C. R., Kucas, M. E., Slocum, C. J., Brennan, M. J., Meissner, T., et al. (2021). Estimating tropical cyclone surface winds: Current status, emerging technologies, historical evolution, and a look to the future. Trop. Cyclone Res. Rev. 10, 125–150. doi:10.1016/j.tcrr.2021.09.002
Knaff, J. A., Slocum, C. J., Musgrave, K. D., Sampson, C. R., and Strahl, B. R. (2016). Using routinely available information to estimate tropical cyclone wind structure. Mon. Weather Rev. 144, 1233–1247. doi:10.1175/MWR-D-15-0267.1
Knapp, K. R., Ansari, S., Bain, C. L., Bourassa, M. A., Dickinson, M. J., Funk, C., et al. (2011). Globally gridded satellite observations for climate studies. Bull. Am. Meteorol. Soc. 92, 893–907. doi:10.1175/2011BAMS3039.1
Landsea, C. W., and Franklin, J. L. (2013). Atlantic hurricane database uncertainty and presentation of a new database format. Mon. Weather Rev. 141, 3576–3592. doi:10.1175/MWR-D-12-00254.1
Liu, S., Johns, E., and Davison, A. J. (2019). “End-to-end multi-task learning with attention,” in 2019 IEEE/CVF conference on computer vision and pattern recognition (Long Beach, CA: CVPR), 1871–1880. doi:10.1109/CVPR.2019.00197
Maclay, K. S., DeMaria, M., and Haar, T. H. V. (2008). Tropical cyclone inner-core kinetic energy evolution. Mon. Weather Rev. 136, 4882–4898. doi:10.1175/2008MWR2268.1
Pradhan, R., Aygun, R. S., Maskey, M., Ramachandran, R., and Cecil, D. J. (2018). Tropical cyclone intensity estimation using a deep convolutional neural network. IEEE Trans. Image Process. 27, 692–702. doi:10.1109/TIP.2017.2766358
Qianhu, Y. (2022). Tropical Cyclone Wind Dataset. Estimating Tropical Cyclone Wind Structure Using Physics Incorporated Network. doi:10.5281/zenodo.6992187
Reul, N., Chapron, B., Zabolotskikh, E., Donlon, C., Mouche, A., Tenerelli, J., et al. (2017). A new generation of tropical cyclone size measurements from space. Bull. Am. Meteorol. Soc. 98, 2367–2385. doi:10.1175/BAMS-D-15-00291.1
Schade, L. R. (2000). Tropical cyclone intensity and sea surface temperature. J. Atmos. Sci. 57, 3122–3130. doi:10.1175/1520-0469(2000)057¡3122:TCIASS¿2.0.CO;2
Shrikumar, A., Greenside, P., and Kundaje, A. (2017). “Learning important features through propagating activation differences,” in Proceedings of the 34th international conference on machine learning. Editors D. Precup, and Y. W. Teh (PMLR. (Sydney, Australia: Proceedings of Machine Learning Research), 70, 3145–3153.
Stiles, B. W., Danielson, R. E., Poulsen, W. L., Brennan, M. J., Hristova-Veleva, S., Shen, T.-P., et al. (2014). Optimized tropical cyclone winds from QuikSCAT: A neural network approach. IEEE Trans. Geosci. Remote Sens. 52, 7418–7434. doi:10.1109/TGRS.2014.2312333
Sundararajan, M., Taly, A., and Yan, Q. (2017). “Axiomatic attribution for deep networks,” in Proc. 34th Int. Conf. Mach. Learn. Editors D. Precup, and Y. W. Teh (Sydney, Australia: Proceedings of Machine Learning Research), 70, 3319–3328.
Wada, A., and Usui, N. (2007). Importance of tropical cyclone heat potential for tropical cyclone intensity and intensification in the Western North Pacific. J. Oceanogr. 63, 427–447. doi:10.1007/s10872-007-0039-0
Worrall, D. E., Garbin, S. J., Turmukhambetov, D., and Brostow, G. J. (2017). “Harmonic networks: Deep translation and rotation equivariance,” in 2017 IEEE conference on computer vision and pattern recognition (CVPR), 7168–7177. doi:10.1109/CVPR.2017.758
Xie, P., Joyce, R., Wu, S., Yoo, S.-H., Yarosh, Y., Sun, F., et al. (2017). Reprocessed, bias-corrected CMORPH global high-resolution precipitation estimates from 1998. J. Hydrometeorol. 18, 1617–1641. doi:10.1175/JHM-D-16-0168.1
Xu, W., Balaguru, K., August, A., Lalo, N., Hodas, N., DeMaria, M., et al. (2021). Deep learning experiments for tropical cyclone intensity forecasts. Weather Forecast. 36, 1453–1470. doi:10.1175/WAF-D-20-0104.1
Keywords: tropical cyclone wind structure, physics-incorporated network, multi-task learning, rotation-invariant features, multi-source predictors
Citation: Yuan S, You Q, Mu B, Qin B and Xu J (2023) Estimating the tropical cyclone wind structure using physics-incorporated networks. Front. Earth Sci. 10:1024979. doi: 10.3389/feart.2022.1024979
Received: 22 August 2022; Accepted: 10 November 2022;
Published: 13 January 2023.
Edited by:
Liguang Wu, Fudan University, ChinaReviewed by:
Qinglan Li, Shenzhen Institutes of Advanced Technology (CAS), ChinaCopyright © 2023 Yuan, You, Mu, Qin and Xu. This is an open-access article distributed under the terms of the Creative Commons Attribution License (CC BY). The use, distribution or reproduction in other forums is permitted, provided the original author(s) and the copyright owner(s) are credited and that the original publication in this journal is cited, in accordance with accepted academic practice. No use, distribution or reproduction is permitted which does not comply with these terms.
*Correspondence: Bin Mu, YmlubXVAdG9uZ2ppLmVkdS5jbg==
Disclaimer: All claims expressed in this article are solely those of the authors and do not necessarily represent those of their affiliated organizations, or those of the publisher, the editors and the reviewers. Any product that may be evaluated in this article or claim that may be made by its manufacturer is not guaranteed or endorsed by the publisher.
Research integrity at Frontiers

Learn more about the work of our research integrity team to safeguard the quality of each article we publish.