- 1Department of Forest Environment and Conservation, National Institute of Forest Science, Seoul, South Korea
- 2Department of Forest Resources, College of Natural Resources, Yeungnam University, Gyeongsan-si, South Korea
- 3Department of Geography, Faculty of Social and Management Sciences, University of Buea, Buea, Cameroon
- 4Faculty of Life and Environmental Sciences, University of Tsukuba, Tsukuba, Japan
Check dams are one of representative structural measures to reduce sediment disaster at a forest watershed. Therefore, it is essential to assess the structural vulnerability and functionality of check dams in the management of sediment disaster risk at watersheds. This study examined the main types of damages and deterioration characteristics in concrete and stone check dams, which comprise more than 80.0% of Korea’s check dam stock. This was based on the 4-step condition assessment, which is the modified version of condition assessment methodology for embankment dams to meet the characteristics of check dams. As a result, the damages and deterioration of concrete check dams were classified into ten representative types. And representative damage types of stone check dams were classified into nine types. The condition assessment results demonstrated that the spillway part frequently contacted with water and debris flows was deteriorated approximately 1.2 times faster than the wing parts for both concrete and stone check dams, and the maintenance demands of both types of check dams increased 15–20 years after construction. Thus, these deterioration characteristics of concrete and stone check dams should be considered in decision-making to determine maintenance priorities among the check dams stock. Furturemore, we analyzed the relationship between condition index and service time in the examined concrete and stone check dams. The degree of deterioration in concrete and stone check dams increased significantly as the service time increased. Based on the relationship between condition index and service time, we classified deterioration characteristics of check dams into two groups: 1) those that follow the average deterioration trends of their facility group (Group II) and 2) those that undergo an unexpected end-of-service life because of exceptional incidents or severe defects (Group I). We hope that our work will form a useful resource for engineers and decision-makers involved in planning, designing, constructing, and maintaining check dams.
Introduction
Mountain streams and rivers (hereinafter “Mountain Stream”) are main passages of sediments generated from slopes and floodplains. This sediment transport process from a forest watershed sometimes causes debris flows and large-scale fluvial transport, resulting in great damage to developed areas on a downstream alluvial fans and flood plains (Rickenmann and Koschi, 2010). In particular, in countries of mountainous terrain with small land surface areas like South Korea, residential areas and agricultural land are developed up to upstream mountainous areas that are vulnerable to flooding and sediment disasters. As a result, there is a tendency that damages at relevant spheres of life continues to occur due to flood water and sediment yield caused by typhoons and an intensive rainfall. Therefore, river managers have constructed protective structures of various types on mountain streams over the past decades in order to protect vulnerable areas downstreams by controlling flood water, channel erosion, and reducing the magnitude of sediment yield (Hueble and Fiebiger, 2005; Mizuyama, 2010; Piton et al., 2016).
A check dam is a transverse structure constructed across a mountain stream to stabilize the riverbed and control sediment yield and is one of representative structural measures to reduce sediment disaster at a forest watershed (Mizuyama et al., 1988; Armanini et al., 1991; Matsumura, 2000; Suda et al., 2009; Piton et al., 2016). Check dams, however, continues to get damaged during its life cycle due to the purpose of its design. Its superannuation due to the deterioration of structure and the reduction of debris storage capacity sometimes causes the phenomenon of large sediment yield that results in great damage to downstream areas (Hueble and Fiebiger, 2005; Suda et al., 2009; Dell’Agnese et al., 2013; Mazzorana et al., 2014). Therefore, it is important in the management of sediment disaster risk at forest watersheds to assess the durability, performance, and sustainability of check dams constructed on mountain streams to inform management and maintenance decision-making and policy. In particular, the assessment of check dam deterioration involves assessing the degree of change in the condition inside and outside the check dam by investigating and analyzing structural deterioration caused by localized environment factors and the properties of construction materials, or damages to the structure caused by debris flow and flooding events that exceeds the structure’s permissible limits, as applied to studies on maintenance practices (Dell’Agnese et al., 2013; Cortes Arevalo et al., 2016; Lee et al., 2018; Mazzorana et al., 2018).
In South Korea, it is estimated that approximately 12,000 check dams were constructed from 1986 to 2020 (Korea Forest Service; https://kfss.forest.go.kr/stat/ptl/fyb/frstyYrBookList.do?curMenu=9854). In particular, with increase in the frequency, intensity, and magnitude of typhoon events in the early 2000s and affecting watersheds drainage systems in the South Korea, check dam construction projects increased greatly; about 3,400 check dams were constructed from 2001–2010, and about 7,300 from 2011–2020. In other words, about 90.0% of South Korea’s check dam inventory was constructed intensively in 20 years, that is, from 2001 to 2020. The Korea Forest Service (KFS) classifies 20-year old check dams as deteriorated facilities and manages them with more conservative standards than recently-built check dams (Korea Forest Service, 2018; Korea Forest Service, 2020). Therefore, it is expected that the cumulative number of deteriorated check dams will increase rapidly in the future, and accordingly, the burden of maintaining them will be aggravated. However, studies on standard systems and advanced methodological guidelines for investigating and assessing the causes of check dam damage and deterioration and decision-making on their maintenance and sustainability are still insufficient. Check dams in South Korea can be broadly divided into non-permeable and permeable structures (Hueble and Fiebiger, 2005). The former prevents water and sediment from passing, and they are most often built on Korea’s mountain streams. The latter structures allow untargeted water and fine particles (but not, for example, debris flows or driftwood) to flow downstream through a part of the check dam body. We studied non-permeable concrete and stone check dams (hereinafter “Concrete and Stone Check Dams), which comprise more than 80% of the check dam inventory in South Korea, thus, priority must be given to managing this type of check dams because of the maintenance demand (Lee et al., 2018). Only few studies have conducted a comprehensive and detailed condition assessment of check dams in South Korea or develop new condition assessment indicators that modify the existing guidelines to achieve more robust results and generate more reliable generalizations (Lee, 2017; Lee et al., 2018; Lee et al., 2021).
Therefore, the main objective of this study is to examine the different types of damage and deterioration characteristics of the check dams in relation to service times, structural features, and construction environments. We specifically evaluated the degree of deterioration of existing check dams in relation to their service time and localized environmental condition factors. Lastly, we developed new indicators and modified the existing guidelines to fit the observed detailed and specific damage and deterioration characteristics of check dams. This was based on the condition assessment methodology, which is commonly applied to quantify the structural conditions of facilities.
Background: Check Dam Condition Assessment
Current river managers design check-dam maintenance plans (e.g., investments in repairs and new dams) by considering two potential factors: functional effect and cost-efficient (Piton et al., 2016). This needs to take reliable inspection data on the current conditions of single or multiple cases of check dams. In previous studies, the structural vulnerability and functionality of check dams have been evaluated using methods that examine physical condition via visual inspections and non-destructive testing (Mizuyama, 1979; Dell’Agnese et al., 2013; Lee et al., 2021; Cortes Arevalo et al., 2016; Lee et al., 2018; Mazzorana et al., 2018), as well as methods that examine the structure’s effectiveness, including bed stabilization, slope reduction, and sediment retention (Makita et al., 1987; Lenzi et al., 2003; Comiti et al., 2010; Chahrour et al., 2021). However, the damages and deterioration of existing check dams are generally evaluated by qualitative methods (condition rating) in maintenance practice. The condition rating system provides a direct, descriptive indicator of the check dam condition rather than using a numeric scale. Thus, the method is helpful to identify objects to need repair, but its application is limited in the analysis that requires differentiation within the individual structures (e.g., service life analysis and prioritizing maintenance work orders).
This study evaluated check dams for the degree of their deterioration, using a condition assessment system that is widely used by the facility management system to determine priorities among objects of repair or re-construction. The condition assessment evaluates the deterioration of facilities with standardized methods and provides information that is essential for making decisions on maintenance (Andersen and Torrey, 1995; Jeong et al., 2018). In particular, it can quantify the structural and functional condition of an object by computational approach (condition index), and thus it is used to determine priorities among various facilities such as dams, roads and bridges (Japanese Ministry of Land, Infrastructure, Transportation, and Tourism, 2014; Federal Highway Administration [FHWA], 2016; Korean Ministry of Land, Infrastructure, and Transport [MOLIT], 2020). Methods for calculating the condition index in the condition assessment vary according to users (the state or responsible agencies) and the objects of maintenance; basically, however, it is determined on the basis of information on the deteriorated condition of the lowest component of a facility (type, size, severity) (Andersen and Torrey, 1995; Miyamoto et al., 2000; Gattulli and Chiaramonte, 2005). Particularly, in the case of calculating the condition index by computational approach, “weighted average approaches, hereinafter WAA”, in which members of universally high importance are weighted to determine the condition index of the entire facility, and “worst-conditioned component approaches, hereinafter WCA” in which the deteriorated condition of an assessment object is estimated by using the condition information of its worst-damaged member (FHWA, 2016).
Furthermore, this study conducted the condition assessment of check dams by applying mutatis mutandis the Korea Infrastructure Safety and Technology Corporation’s “Standards and Methods for Assessing the Condition of Dam Facilities”. The condition assessment of dam facilities determines the condition index for an object of maintenance by conducting stepwise evaluation with WAA and WCA on the basis of information on the condition of various dam members such as the upstream face, the downstream face, floodgates, and electric facilities (Korea Infrastructure Safety and Technology Corporation [KISTEC], 2019a). In the condition assessment of check dams, the deterioration condition of components classified according to functional characteristics was evaluated by the standards and methods of KISTEC, and the results thereof were synthesized to determine the condition index of an object of research. Here, the assessment system and detailed review items (deterioration and damage evaluation items) were applied to the object of research after being adjusted so that the characteristics of check dam may be reflected in the results of assessment.
In South Korea, the safety inspection of existing check dams can be defined by three types of enforcement: routine inspection (every year), emergency, and in-depth inspection. Based on the information of structural conditions from these activities, a maintenance manager determines whether it is necessary to adopt repair or a more detailed examination for the inspected check dam (i.e., precise safety diagnosis). The precise safety diagnosis of existing check dams is prescribed to be performed by an agency specializing in safety examinations of facilities (Korea Forest Service, 2018). However, in maintenance practice, since there are no independent methods for diagnosing the damage and deterioration of check dams, engineers commonly use safety inspection guidelines for the embankment dam developed for flood control, water storage, and hydropower (Korean Ministry of Land, Infrastructure, and Transport [MOLIT], 2020). This limitation is also the case in the condition assessment of check dams, which is the basis of safety diagnosis. We used the condition assessment procedure to evaluate the structural statuses of check dams within a specific mountainous region. In addition, we classified the described the damage and deterioration characteristics of check dams to indicate their physical condition.
Materials and Methods
Study Area
The field study was performed in the Gyeongsangbuk-do region, which features the largest number of non-permeable check dams in South Korea (Figure 1A). The studied check dams were located in small/medium streams flowing through a mountainous area with an elevation of 25.2–575.6 m above sea level (Figure 1B). The catchment area upstream of the check dam varied from 3.9 to 2,464.1 ha. In the study area, the streambed width varied from 3.5 to 22.0 m, and the slope gradient varied from 4.8 to 24.9%. The annual average temperatures of the study sites varied from 10.8 to 14.4°C, and the average temperature during winter (December to February) was 1.3°C (Figure 1C). The average annual rainfall of the study sites ranged from 1,017.7 to 1,445.2 mm (Figure 1D), and approximately 70% of the accumulated rainfall was concentrated in the summer rainy season (June to September) [as calculated by collecting observation data for the years 1997–2016 from the Korea Meteorological Administration (automated) weather observation stations located closest to the study sites]. The check dams at the study site were built in mountainous areas featuring highly variable weather conditions and high amounts of rainfall. During the period of the check dam construction from 1986 to 2014, the streams at the construction sites underwent freezing and thawing in the winter, respectively. Check dams found in mountain environmental conditions are more vulnerable to damages and deterioration than hydraulic structures on low-altitude rivers (Adamo et al., 2020).
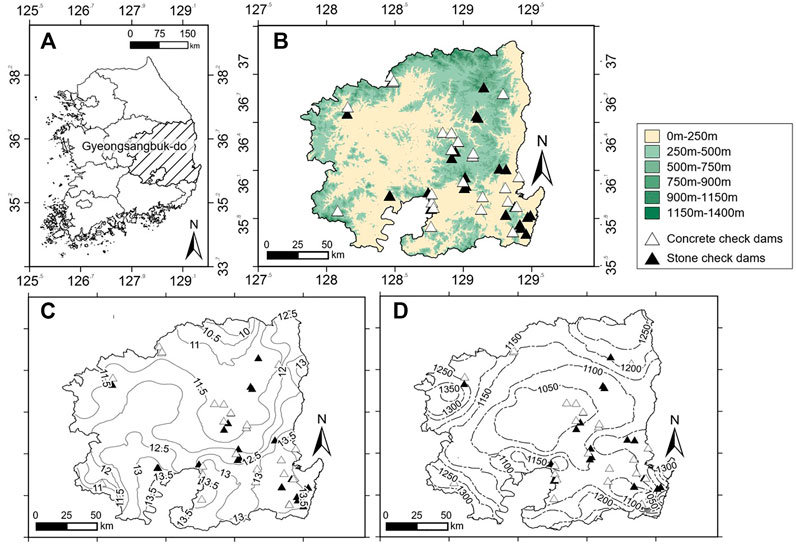
FIGURE 1. (A) Map of the study area and check dam locations. The figure shows the study sites’ (B) elevation above sea level (m), (C) average annual temperature (°C), and (D) average annual rainfall distribution (mm).
Characteristics of Inspected Check Dams
The examination targets included 30 concrete check dams built between 1986 and 2013, as well as 23 stone check dams built between 1988 and 2014 (see Supplementary Material A1). The average service times were found to be 18.8 and 16.9 years for the concrete and stone check dams, respectively, as calculated in 2016, when the field study was completed (Lee 2017). The concrete check dams’ lengths range from 10.1 to 33.3 m, and their heights range from 2.2 to 7.5 m, while the stone check dams’ lengths range from as 12.0–31.7 m, and their heights range from 3.1 to 6.4 m. These values were determined by measuring the lengths and heights of the structures protruding from the ground surface. All examination targets were designed as gravity structures that maintain stability using their own weight; however, stone check dams feature composite bodies composed of stone and concrete, making them structurally distinct from concrete check dams, which consist of a single concrete element (Figure 2A and Figure 2B).
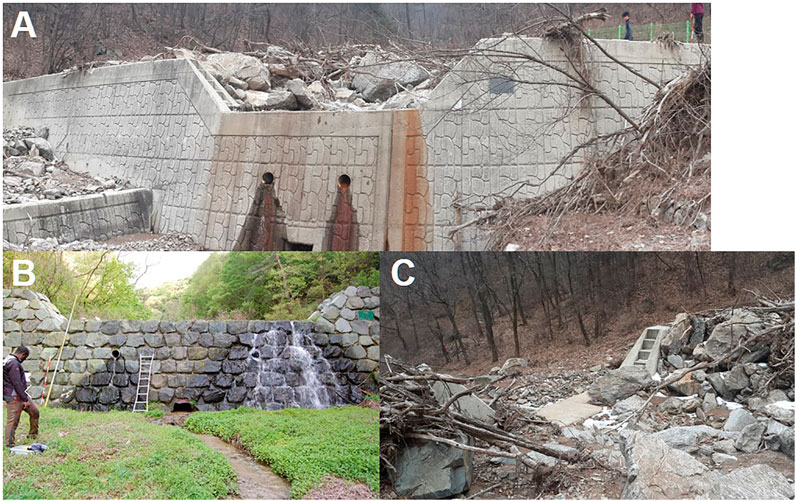
FIGURE 2. Front views of (A) concrete, (B) stone check dams, and (C) The debris and driftwood laden check dam. The check dams in figures (2a) and (2c) effectively captured the rivers’ debris and driftwood.
Detailed Visual Inspection
To inspect the damage and deterioration of the check dams, we first divided the check dam structure into three components: dam crest (DC), downstream face (DS), and upstream face (Figure 3). Inspections of the upstream faces were omitted because of the retention deposits and water (Figure 2C). We then divided each component into spillway and wing elements (DC1, DC2, DC3, DS1, DS2, and DS3) based on the functional features. Finally, visual inspections were performed on the six individual elements.
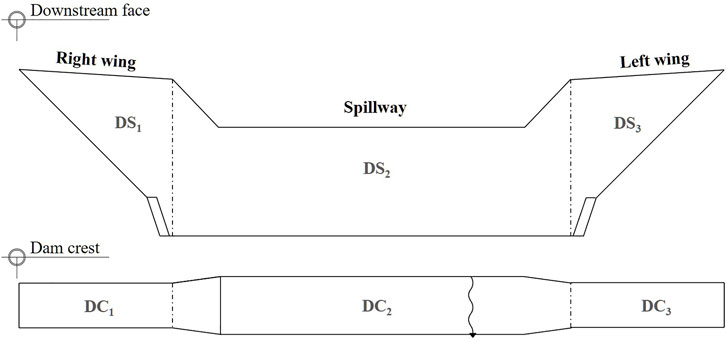
FIGURE 3. Subdivision of the check dam to inspect damages and deterioration. The two major zones include the dam crest (DC) and downstream face (DS). The six specific elements are classified between those located on the spillway and those on the wings. The spillway consists of DC2 and DS2. The right wing consists of DC1 and DS1, and the left wing consists of DC3 and DS3. Inspections of the upstream faces were omitted because of the retention deposits and water.
For each element, we recorded the location, sizes, and shapes of damage using a crack ruler (measurement range: 0.05–7.0 mm), crack scope (× 10magnification), measurement poles (2.0 and 5.0 m), tape measures (20.0 and 50.0 m), a ladder (5.07 m), and a digital camera, as appropriate (Figure 4). For instance, cracks were classified into surface-level cracks, featuring a depth limited to the surface layer of the structure, and through cracks that extended from the upstream face to the downstream face. We measured the width, length, and direction of damaged areas in the visual inspection of both types of cracks. Abrasion/erosion is generally manifested as erosion of the concrete surface; this exposes the aggregate or deeply dents the damaged surface (Portland Cement Association, 2002; Adamo et al., 2020). An inspection of abrasion/erosion was examined the depth of the damaged structure surfaces. The uncontrolled vegetation was one of the most frequently observed damage types in stone check dams. This could be because the surfaces of stone check dams, which feature many weak joints and irregularities, provide favourable conditions for seeds to infiltrate and take root. Where stream vegetation covered the dam’s, the types of invasive species (grasses, shrubs, and trees) and the areas of coverage were recorded.
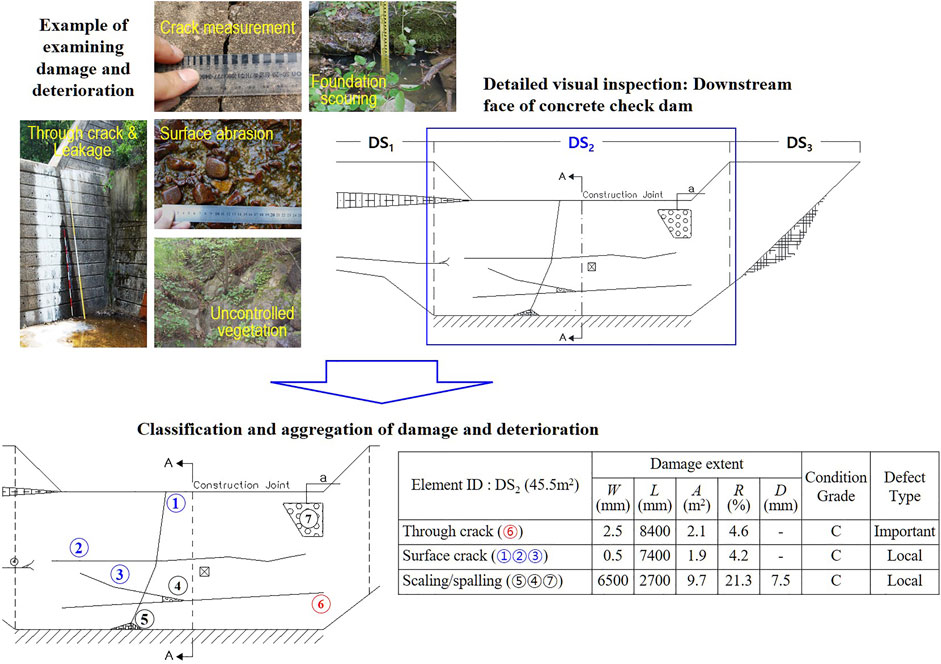
FIGURE 4. An example of a detailed visual inspection of a concrete check dam, including examples of measuring damage and deterioration and diagrammed visual inspection results. The inspection results are aggregated to representative damage types: W, width (mm); L, length (mm); A, damaged area (m2); R, damaged area ratio (%); D, depth (mm).
The field examination results were analyzed using AutoCAD 2010 and the diagrammed visual inspection results and aggregated results on damage and deterioration in a specific element (DS2) are presented in Figure 4. Then, the damage in individual elements of each specific element was classified by type, and its attributes (e.g., width, depth, length, and area) were combined and used as assessment elements for the damage and deterioration analysis in the next section. Each check dam was visually inspected only ones, and the field inspection period lasted from March to May 2016.
Condition Assessment
In general, a system for assessing the structural condition of embankment dams carries out (1) a detailed inspection of a structure for its deterioration damage, thereby analyzing the condition of (2) individual elements, which are the lowest components; and by using results of the analysis, it evaluates successively the condition of (3) composite members (upstream face n, downstream face n, approach channel n, etc., n = 1,. . ., i), which are upper components, (4) individual facilities (non-overflow part j, overflow part j, machinery and electric facilities, etc., j = 1,. . . ., k), (5) composite facilities (dam body, spillway, and other facilities), and (6) integrated facilities (dam facilities) (Korea Infrastructure Safety and Technology Corporation [KISTEC], 2019a). In terms of structure, check dams of mountain streams show the characteristics of small facilities, compared with river dam facilities consisting of various structures and ancillary facilities like above (Lee et al., 2021). In particular, because this study conducted the condition assessment of check dam body, with omitting the assessment of ancillary facilities such as side wall and apron, it was needed to adjust the assessment procedure. Thus, in this study, the above condition assessment system for embankment dam was applied to objects of research after being adjusted into four steps of (1) the condition assessment of damages and deterioration, (2) the condition assessment of individual elements (DC1∼3 and DS1∼3), (3) the condition assessment of composite members (spillway and left/right wings), and (4) comprehensive assessment (dam body) (Figure 5).
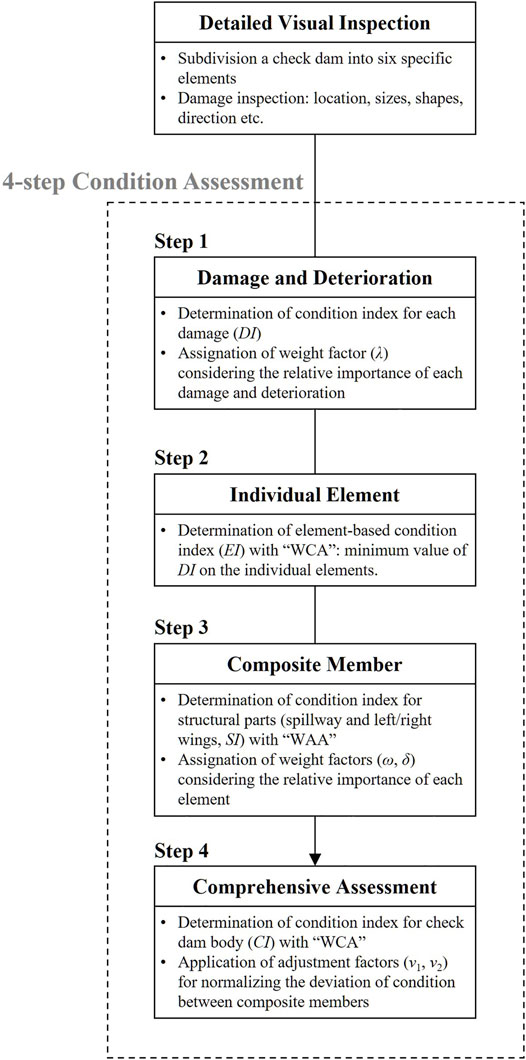
FIGURE 5. Process of calculating the check dam’s condition index (CI) using the “4-step condition assessment system.”
On the other hand, in the detailed visual inspection, various damages and deterioration observed in objects of research was classified in terms of morphological characteristics, and then the representative damage types of concrete and stone check dams were selected. As a result, the deterioration of concrete check dam was classified into ten damage types including surface crack, through crack, joint deterioration, and abrasion/erosion. And representative damage types of stone check dam were classified into nine types including uncontrolled vegetation, joint mortar deterioration, and falling out (see 4.1 and 4.2). The representative deterioration types of concrete and stone check dams were used as items for assessing deterioration damage, which serves as basic data for condition assessment. Further, among the representative deterioration types of concrete and stone check dams, structural defects such as foundation erosion, vertical/horizontal displacement, and breakage, which have direct effects on the stability conditions of gravity-type check dam (overturning, sliding, failure, bearing capacity), were re-classified as “critical defects”; and differential assessment weights were applied to the “critical defects” so that decrease in the stability of research objects caused by the occurrence of “critical defects” might be reflected in the assessment results (see 5.1).
Damage and Deterioration Assessment
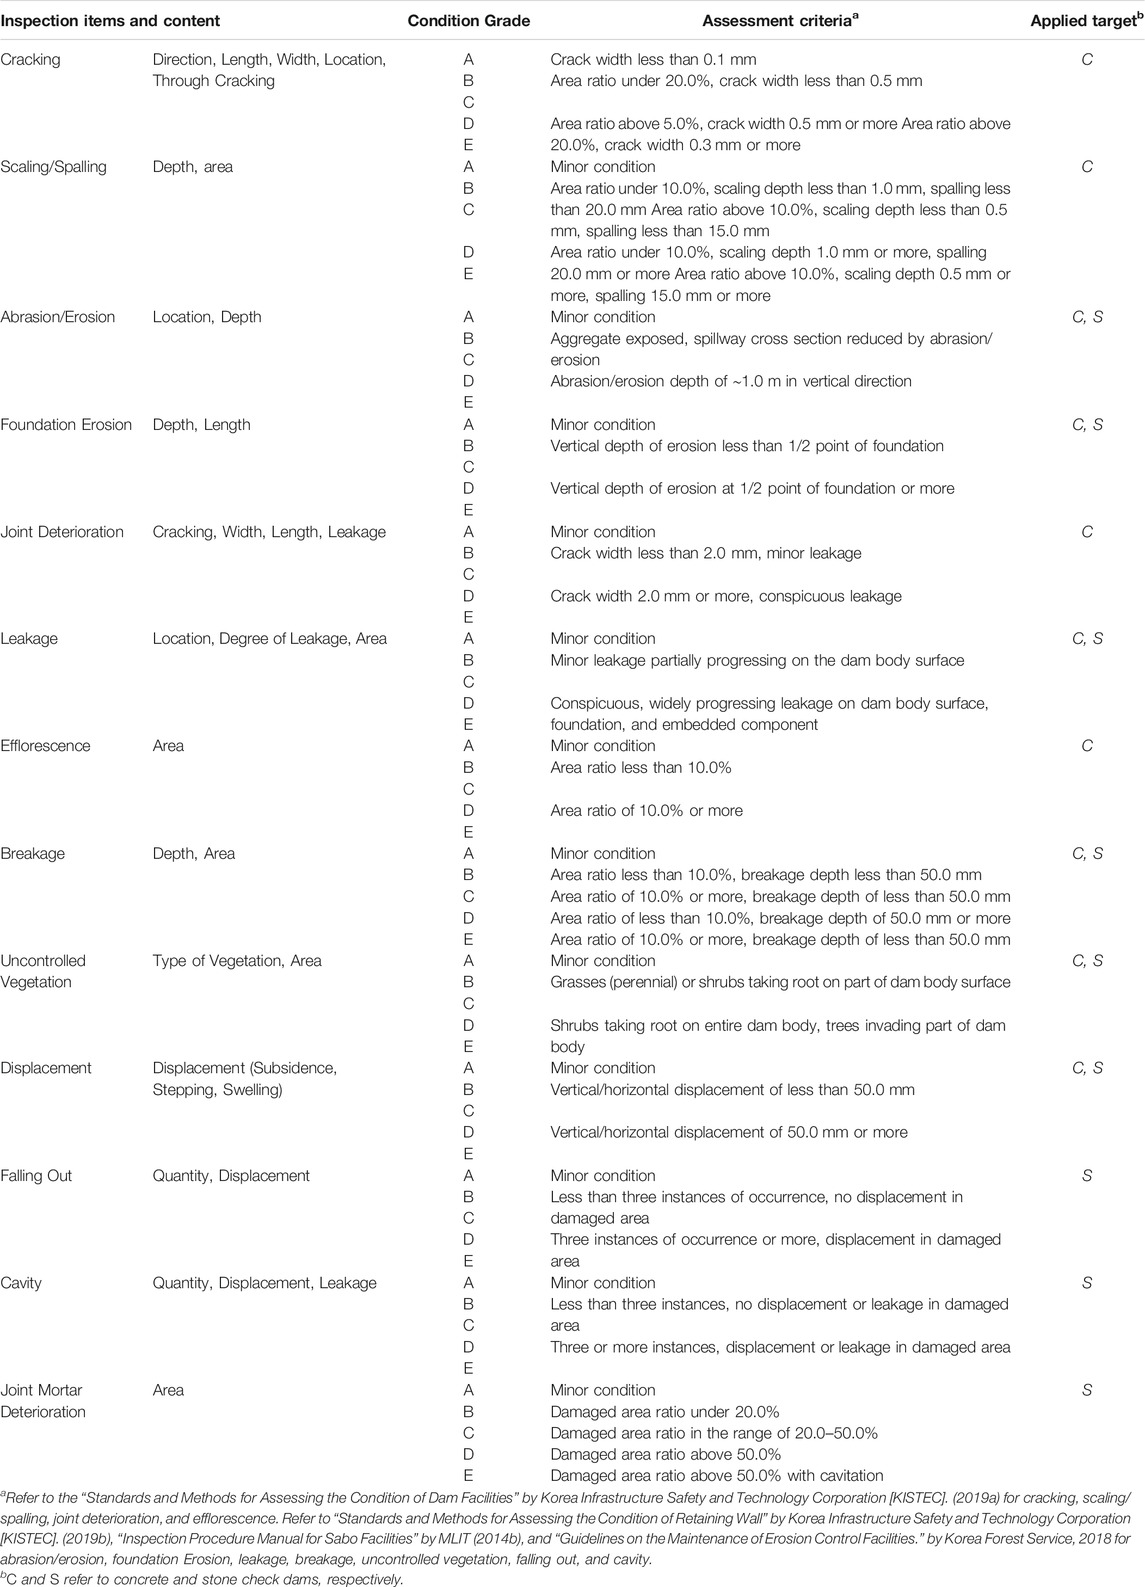
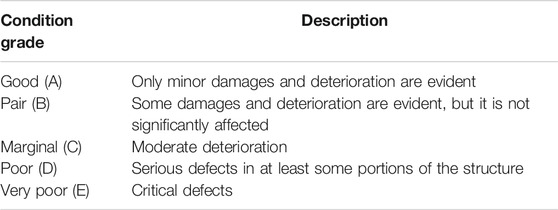
The assessment of damage and deterioration was carried out by applying (Korea Infrastructure Safety and Technology Corporation [KISTEC]. (2019a); Korea Infrastructure Safety and Technology Corporation [KISTEC]. (2019b)Standards and Methods for Assessing the Condition of Facilities (Dam & Retaining Wall)”, Japanese Ministry of Land, Infrastructure, Transportation, and Tourism, 2014b) “Inspection Procedure Manual for Sabo Facilities”, and “Assessment Criteria by Condition Assessment Item” based on Korea Forest Service (2018) “Guidelines on the Maintenance of Erosion Control Facilities” (Table 1). The condition assessment items comprised the representative damage types of concrete and stone check dams, and results of assessment were expressed as condition grades (A-E) based on assessment criteria that reflected the type, size, and location of damage (Table 2). The condition index was calculated by converting a condition grade into a simple score (1.0–5.0), which was then multiplied by the weight of relevant deterioration, as follows:
where DIi, Si, and λi are the condition index, a score based on a condition grade, and a weight based on relative importance for each ith damage, respectively. λ was classified into three types, i.e., “critical defect”, “local defect”, and “ordinary damage” (Table 3). In particular, the weights of “local defect” and “ordinary damage”, which have relatively small effects on structure compared with “critical defect”, were adjusted upward so that their effects on the entire structure might be devaluated (Korea Infrastructure Safety and Technology Corporation [KISTEC]. 2019a). For example, in Figure 4, the DI value for the surface and through cracks was calculated by assigning the λ values corresponding to “local defect” and “important defect”, respectively. Therefore, the DI value for C-grade through crack (s = 3.0) is 3.0 because the weight for “critical defect (λ = 1.0)” is applied to it.
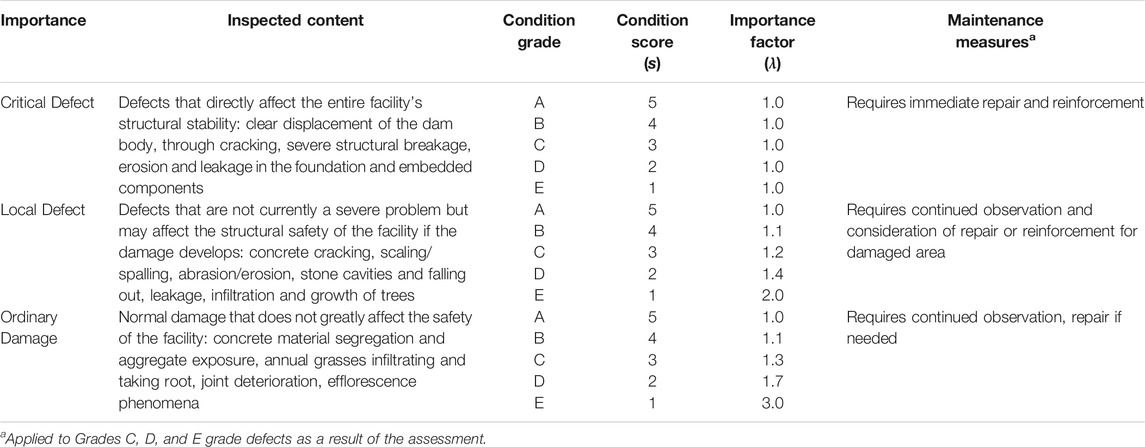
TABLE 3. Use of the damage score (s) and the importance factor (λ), according to the KISC-based (2019a) damage assessment system.
Individual Element and Structural Component
The condition index of an individual member was calculated with the results of evaluating the damage and deterioration of the lowest condition index among its i damages, as follows:
where EIj is the condition index of jth individual element determined by the minimum value of Di.
For the assessment of composite members, the check dam was divided into spillway part (DC2 and DS2), which controls the thalweg and regulated peak flood (or debris flow), and dam wing part (DC1, DC3, DS1, and DS3), which prevents damage to the body caused by overflow (Hueble and Fiebiger, 2005). The condition index of composite member was calculated with condition indices of individual members comprising each structural part, as follows:
where SIk is the condition index of kth composite member (the spillway part and wing parts), and ωj and δj are the weight factors determined by considering the condition index of jth individual element and its importance-based weight, respectively (Table 4). ω was defined by referencing the “adjustment factor based on Korea Infrastructure Safety and Technology Corporation [KISTEC]. (2019a) condition index of individual element.” δ is a weight reflecting the size of an individual element, and may be applied differentially to the extent that the sum does not exceed 1.0, according to an engineer’s judgment (Korea Infrastructure Safety and Technology Corporation [KISTEC]. 2019a). In this study, the δ values of 0.4 and 0.6 were applied to the spillway and the wing parts, respectively, by referring to the results of condition assessment in Lee, (2017), Lee et al. (2018), and Lee et al. (2021).

TABLE 4. Use of the adjustment factor (ω), according to the KISC-based (2019a) element condition index (EI).
Comprehensive Assessment
As for the condition index (CI) of check dam in the comprehensive assessment, the condition index of a structural part whose deterioration was worst among composite members was calculated in priority, as follows:
where v1 and v2 are adjustment factors for the normalization of assessment results, and were calculated as follows:
Where v1 is a factor to adjust the deviation of condition between composite members, and a value equivalent to 30.0% of the SIk range (if v1 ≠ 0.0) was applied to it; and v2 is the rate of condition deterioration for an assessment object compared with its best condition (SIk = 5.0), and was determined by reflecting the size of composite member (Ak) in the condition index (Korea Infrastructure Safety and Technology Corporation [KISTEC]. 2019a).
Finally, the condition of the check dam was expressed as a condition index within the range of 1.0–5.0, and consequent conditions were classified into five grades of Excellent (A), Good (B), Average (C), Poor (D), and Very Poor (E) (Table 5).

TABLE 5. Use of the check-dam condition grade and the maintenance measures, which are based on KISC’s (2019a) condition index (CI).
Results
Calssification of Dmagage and Deterioration Characteristics of Concrete Check Dams
A total of 235 instances of deterioration (dam crest: 79 instances; downstream face: 156 instances) were observed on the 30 reviewed concrete check dams (Figure 6 and Figure 7). These were classified into ten representative types (according to their morphological features): through crack (TC), surface crack (SC), joint deterioration (JD), abrasion/erosion (AE), leakage (L), uncontrolled vegetation (V), efflorescence (EF), scaling/spalling (SS), horizontal displacement (HD), and vertical displacement (VD).
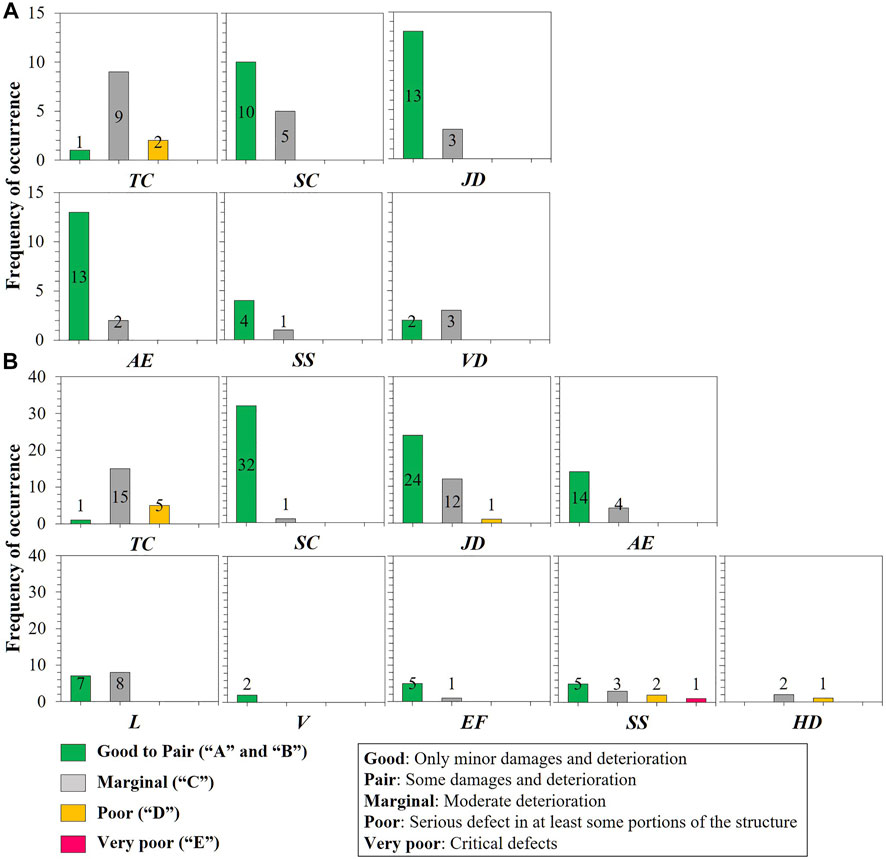
FIGURE 6. Typical damage and deterioration of the (A) dam crest and (B) downstream face of a concrete check dam: TC, through crack; SC, surface crack; JD, joint deterioration; AE, abrasion and erosion; L, leakage; V, uncontrolled vegetation; EF, efflorescence; SS, scaling and spalling; VD, vertical displacement; HD, horizontal displacement.
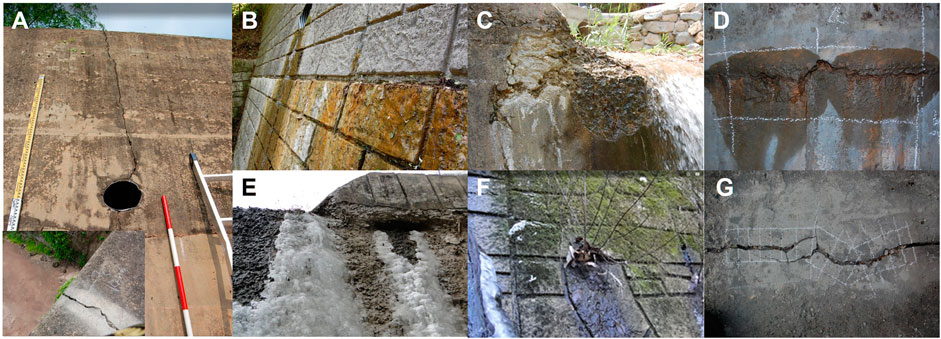
FIGURE 7. Various deterioration types observed on concrete check dams. (A) vertical through crack and displacement caused by drying shrinkage cracking; (B) water leakage from a gap in a horizontal construction joint; (C) exposed aggregate and spalling, respectively, due to erosion at the spillway; (D) leakage and efflorescence at a horizontal construction joint; scaling and spalling of the downstream face due to freezing and thawing; (E) (F) uncontrolled vegetation around a drainage channel; (G) through crack and dam crest stepping.
In the case of TC cracks with a width of 0.4–15.0 mm and an area ratio of 0.7–15.0%, which were found on 16 check dams, 31 of the 33 found instances (dam crest: 12 instances; downstream face: 21 instances) were Grades C and D damages; that is, repair/reinforcement was considered and recommended (Figure 7A). In contrast, 48 instances of SC (dam crest: 15 instances; downstream face: 33 instances) with widths of 0.2–9.9 mm and area ratios of 0.1–23.7% were found on 23 check dams, but no more than six of these were Grade C defect. Cracking was the most frequent damage type on all the dam crests and downstream faces but not necessarily a problem that directly leads to severe defects in concrete check dams (Korea Concrete Institute, 2014).
JD refers to damage (e.g., cracks and leakages) that occurs at shrinkage and construction joints (Figure 7B) and was observed on 19 concrete check dams. Sixteen instances were found on dam crests, and three of these were Grade C damage (with a width of 3.5–7 mm), which occurred at the shrinkage joints and extended to the downstream face. Of the 37 instances of damage on the downstream face, 12 were determined to be of Grades C and one of D damage. In addition, in two of these instances, water continued to leak at the crack surface of the construction joint during the field inspection.
AE was found in 20 inspection targets, including 15 instances at the dam crest and 18 instances at the downstream face (Figure 7C). The depths of the damaged surfaces at the dam crests and downstream faces were below 10 mm. Foundation erosion scoured the riverbed directly below the spillway to depths of 0.04–0.7 m. Specifically, there is a tendency that AE is concentrated in the spillway (which is directly affected by water flow and debris flow) and its underground foundation (Mizuyama, 1979; Comiti et al., 2010; Piton and Recking, 2014; Ogasawara and Kambara, 2015).
L, V, EF, and HD are deterioration phenomena that specifically occur on the downstream face. Fifteen instances of L were found on ten concrete check dams, and six of these were accompanied by EF (Figure 7D). Of the eight leakages of Grade C, two instances occurred at the cracks, and two and four instances were found at the construction joints and foundations, respectively. The freezing and thawing of leaking areas in winter and summer, respectively, leads to secondary damages, including cracks and scaling/spalling. In the case of concrete check dams (which are unreinforced concrete structures), the damage was concentrated around the leakage areas that were damaged by frost, as well as in the drainage channel (Figure 7E). Of the 16 instances of SS found in eight inspection targets, two instances were determined to be of Grade D and one of Grade E. These were observed throughout the entire inspection area at depths of 7.2–11.2 cm. Single instances of V were identified in the gap between the shrinkage and drainage channels (Figure 7F). HD was observed along with VD of the dam crest in three inspection targets. Of the three instances of HD, two instances were Grade C and one of Grade D. This is believed to be caused by structural deformation produced by growth of the drying shrinkage cracks; as a result, steps with depths of 3.0–7.0 mm were created on the dam crest surface (Figure 7A and Figure 7G).
Classification of Damage and Deterioration Characteristics of Stone Check Dams
In the case of stone check dams, 87 instances (dam crest: 29 instances; downstream face: 58 instances) of damage were found in 17 inspection targets (Figure 8 and Figure 9). The damage was classified into nine representative types: V, mortar joint deterioration (MJD), falling out (F), erosion (ER), internal erosion and cavities (IC), L, HD, VD, and breakage (B).
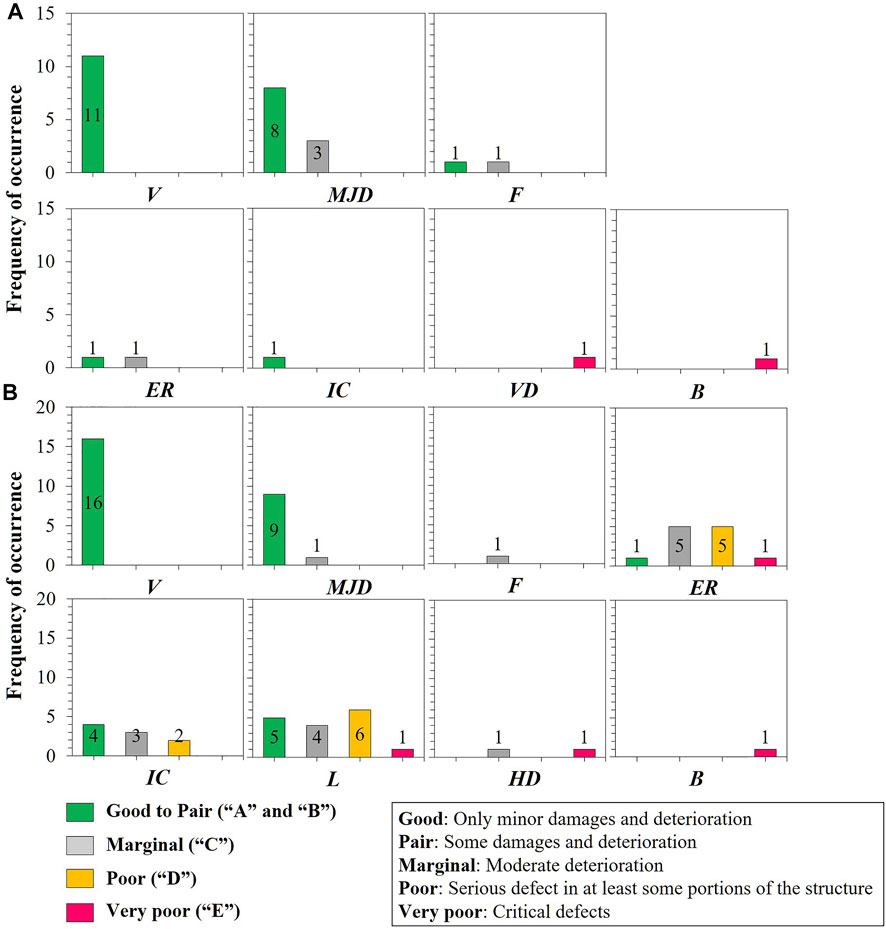
FIGURE 8. Typical damage and deterioration on the (A) dam crest and (B) downstream face of stone check dams: V, uncontrolled vegetation; MJD, mortar joints deterioration; F, falling out; ER, erosion; IC: internal erosion and cavity; L, leakage; VD, vertical displacement; HD, horizontal displacement; B, Breakage.
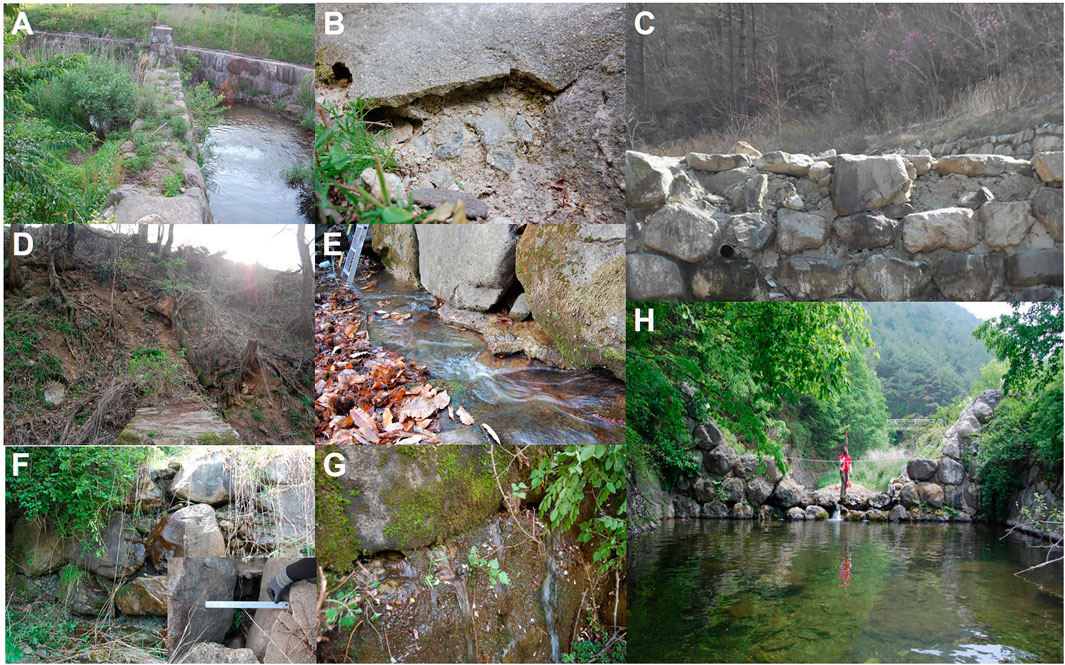
FIGURE 9. Various deterioration types observed on stone check dams: (A) grasses and shrubs infiltrating the dam crest, (B) exposure of internal concrete due to joint spalling, (C) falling out caused by impact of bedload transport, (D) and (E) erosion of abutment slope and foundation; (F) vertical subsidence due to internal concrete outflow; (G) clear leakage and horizontal displacement of downstream face; (H) damage to the dam body due to the hydraulic force of flooding.
The patterns of V were classified into instances where grasses infiltrated and took root by themselves, where grasses and shrubs were found mixed together, and where trees infiltrated and grew by themselves (Figure 9A). Twenty-seven instances (dam crest: 11 instances; downstream face: 16 instances) of V occurred in 13 stone check dams. Of these observed instances, one was that of a tree and the remainder were that of combined grasses and shrubs growing together.
Twenty-one instances of MJD (dam crest: 11 instances; downstream face: 10 instances) were found in 11 inspection targets, and they were classified as typical stone check dam deterioration (Figure 9B). The MJD damage area accounted for 3.6–67.7% of the inspection area, but the majority of it was Grade A or B defects. MJD is considered to be a condition change that requires further observation because it not only allows vegetation to infiltrate the damaged area but can also lead to various kinds of deterioration through the exposure of internal material to environmental conditions.
Three instances of F were observed on two stone check dams. Two instances were attributed to impacts from debris flows at the spillway of the dam crest (Figure 9C), which produced cavities with depths of approximately 0.45 m in the damaged area. One instance displayed continuous concrete leakage in a cracked area, attributable to earth pressure, where vertical subsidence proceeded in the damaged area and developed into a Grade E horizontal displacement defect.
The stone check dam inspection results showed a progression of ER, IC, and L. ER is the greatest repair priority among the stone check dam damage types. ER was identified in 11 stone check dams, with two instances occurring at the dam crest and 12 instances occurring at the downstream face (Figures 9D,E). In the ER instances identified in the downstream face, the foundation was scoured to a depth of 0.15–0.65 m in 11 instances of Grades C, D, and E defects. IC indicates an empty cavity that occurs when the flow in leaking areas continually carries away the internal material and discharges it downstream. IC is a significant defect that reduces the durability and stability of a check dam body, by increasing the dam’s internal porosity (Kasahara et al., 2010) (Figure 9F). IC inspection was performed on ten stone check dams (dam crest: 1 instance; downstream face: 9 instances). In the three instances of C and the two instances of D damages, multiple (2–4) defects with depths of 0.19–0.45 m were observed in a single inspection target.
L denotes the continuous flow of water through gaps inside the check dam (Figure 9G). Stone check dams are composed of heterogeneous materials, and they are structurally less watertight than their concrete counterparts. Sixteen instances of L were found in the 12 stone check dams, and of these, 12 instances of leakages were observed together with foundation erosion, and a section of the damaged area had been washed downstream. In the seven instances of L that were Grade C or above, the filling concrete had flowed out and the internal porosity had increased, compromising the structural stability of the dam. Three instances of VD and HD were found in two inspection targets, and they were accompanied by L and IC, regardless of direction. One instance of B damage was confirmed, where the dam could not withstand the hydraulic force of flooding, and more than 70% of the structure had been washed away (Figure 9H).
Concrete and Stone Check Dams Condition Assessment
The concrete check dam condition index values (CIconcrete) ranged from 1.5 to 4.9 (n = 30). The data mean (
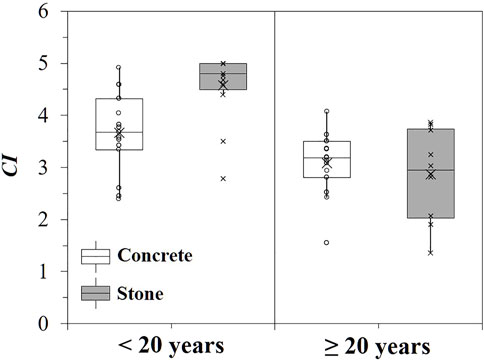
FIGURE 10. Comparison of condition index (CI) for check dams less than 20 years and 20 + years after construction.
Since 2009, Korea Association of Soil and Water Conservation (KASWC) has been regularly conducting visual inspections on the existing check dams through an expert group composed of engineers with abundant practical experience. The maintenance judgments derived from the condition assessments were consistent with the KASWC visual inspection results in 43 cases (repair/reinforcement: 16 cases; follow-up observation: 27 cases). Even though an existing process was adopted, the assessment employed produced consistent results with inspections conducted by the expert group of the KASWC (Korea Association of Soil and Water Conservation, 2014; Korea Association of Soil and Water Conservation, 2015; Korea Association of Soil and Water Conservation, 2016). However, condition assessment results are somewhat more conservative in the field, where interpretation may vary according to the inspector. For example, the condition indices for stone check dams exhibited a wider distribution than those of concrete ones (Mazzorana et al., 2018). In practice, the construction of stone check dams depends heavily upon the engineers’ skill level. As such, there are more variations in quality between specimens in stone check dams than concrete check dams (Lee et al., 2018), and the variations in CI for stone check dams are attributable to field factors.
The conditions of the inspection targets were found to be relatively poor for check dams of 20 years and older. The condition indices for concrete check dams of 20 + years of age (CI ≥ 20, concrete) ranged from 1.5 to 4.1 (
Similar findings have been made in the other mountain streams. Dell’Agnese et al. (2013) reported that the damage factors of check dams of 20 + years of age tended to be greater than those of more recently constructed ones, following an evaluation of the physical vulnerabilities of 362 check dams constructed on Mountain Rivers in northern Italy before and after large-scale events. Field inspections by Fujita et al. (2020) showed that the occurrence of abrasion/erosion in check dams increased 20–30 years after construction. Considering that previous studies were based on visual inspections, the deterioration characteristics of check dams could be apparent in the check dams of 20 + years of age, although its conditions varied depending on such factors as climate, geology, and construction materials.
Condition Assessment of Spillway and Wings of Check Dams
The condition indices for the spillways of concrete check dams (SIspillway) ranged from 1.5 to 4.9, and the condition indices for the wings (SIwings) ranged from 2.3 to 5.0 (Figure 11A). The average condition index for the spillways (
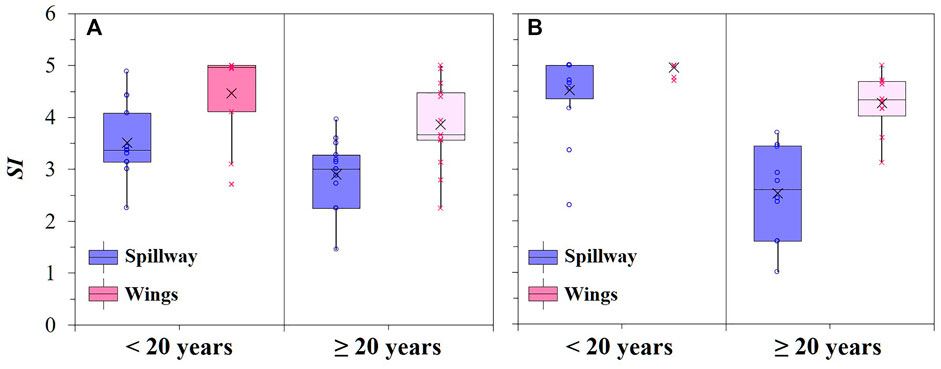
FIGURE 11. Comparison of condition indices for the spillways (SIspillway) and wings (SIwings) of check dams of less than 20 years old and 20 + years old: (A) concrete check dam and (B) stone check dams.
We compared the condition factors of the spillways and wings of check dams less than 20 years after construction and check dams of 20 + years of age. For concrete check dams of 20 + years of age, the values of
In concrete and stone check dams, the conditions of the spillways were poorer than those of the wings. Consistent with this result, Lee et al. (2018) and Mazzorana et al. (2018) reported spillway damage factors that were approximately 1.2–4.0 times higher than those of the wings. The spillways of the check dams tended to deteriorate faster than the wings. We conclude that the design standards for spillways must be strengthened with regard to preventative maintenance, through measures such as the implementation of high-strength concrete or reinforcement structures.
Discussion
Critical Defect Classification of Concrete and Stone Check Dams
Stability conditions for a check dam in a mountain stream are greatly affected by factors of its surrounding environment (external factors) and damages and defects occurring in its structure (internal factors) (Suda et al., 2009). In most cases, serious defects or deformations of check dams occurs due to the complex and combined actions of internal and external factors. The stability conditions of gravity-type check dam are examined in terms of four items: overturning, sliding, dam body failure, and the bearing capacity of foundation ground (Suda et al., 2009). In this regard, streambed erosion at the downstream of a check dam is judged to be a critical factor that causes the body failure of a check dam by decreasing the capacity of dam body to resist fluid force (water pressure and earth pressure) or impulsive force (debris flow) (Mizuyama, 1979; Hueble and Fiebiger, 2005; Suda and Huebl, 2007; Rudolf-Miklau and Suda, 2011). It is caused by restricted upstream sediment supply or the hydraulic behavior of fluid falling from the channel part (Lenzi et al., 2003; Comiti et al., 2010; Recking, 2012; Chahrour et al., 2021), and it appeared in this study as local scour around the foundation of a check dam and the exposure of foundation. In addition, leakage was one of important factors that hinder the durability and structural stability of the check dams. In particular, leakage occurring at the root part of a check dam (e.g., abutment and foundation) and its base is a critical defect that lowers the resistance force (frictional force) of the body to horizontal external force. In the case of a stone check dam, leakage increased the internal porosity and caused subsidence of the dam, which is a critical defect (Lee et al., 2018).
In the case of concrete check dams, through crack that occurs and grows in the dam body is an important factor in lowering the load-carrying capacity of the structure and is the cause of leakage. Although through crack in concrete check dams mostly occurs due to internal factors such as drying shrinkage and joint deterioration, it may also be triggered by the action of silt pressure that exceeds the carrying capacity. Therefore, through crack is one of the critical defects that should be examined carefully in the condition assessment of concrete check dam.
In this study, “foundation erosion”, “vertical/horizontal displacement”, “leakage from foundation and root part”, and “serious breakage” were classified as the “critical defects” of concrete and stone check dams, and were classified as damage types that should be repaired urgently to secure the stability of structure. These “critical defects” as damage types were distinguished in the assessment from other deterioration damage types, such as surface crack, wear, scaling/spalling and falling out that have effects on the durability and functions of check dams. In addition, defects that are probable to develop into critical defects, such as leakage, crack, and cavity, were classified as “local defects,” and the rest were classified as “ordinary damage” in the quantification of the degree of damage and deterioration types.
Comparison of Deterioration Characteristics in Concrete and Stone Check Dams
The condition index assumes its initial value when the inspection target is constructed, and it decreases over time as the target’s condition deteriorates due to structural characteristics (e.g., material properties, section dimensions, and loads) and external effects (environmental conditions and extreme events). Therefore, the check dam’s degree of deterioration can be expressed as a ratio of the current condition (CIcurrent) to the initial construction condition (CIinitial). We term this ratio as degree of deterioration (DE), that is deterioration rate and we used CI to express it as:
The DE value in concrete check dams (DEconcrete) increased from 0.02 to 0.5 at a T of 4–31 years (r2 = 0.209, p < 0.05) (Figure 12A). The degree of deterioration in stone check dams (DEstone) increased from 0.00 to 0.62 at a T of 3–28 years (r2 = 0.670, p < 0.001) (Figure 12B). This result clearly shows that the inspection targets’ conditions worsen as their service time increases, consistent with the results of other studies (Dell’Agnese et al., 2013; Ogasawara and Kambara, 2015; Lee et al., 2018; Mazzorana et al., 2018).
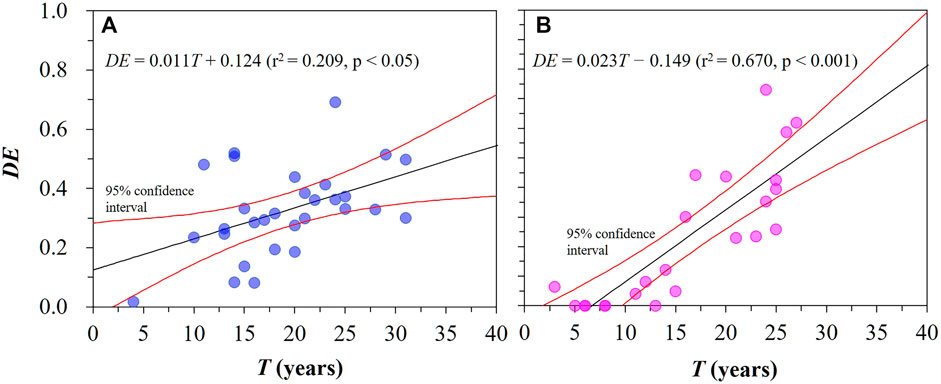
FIGURE 12. Temporal changes in the check dams’ degree of deterioration (DE) with respect to the increase in service time (T) for (A) concrete and (B) stone check dams.
In concrete check dams of 16–30 years of age, the average DEconcrete for T (i.e., the estimated value of the regression equation) increased by a factor of approximately 1.5. The data for this period’s concrete check dams appear to exceed DE = 0.30 (CI < 3.5), at which point repair/reinforcement is needed once T exceeds 20 years. In the case of stone check dams, the estimated value of DEstone at a T of 16–30 years is increased by a factor of approximately 2.6. Apart from three instances, the data for this period’s stone check dams indicate that repair/reinforcement is needed once T exceeds 15 years. The deterioration of concrete and stone check dams was expected to proceed at different rates. In particular, the average trend in the DE values of stone check dams was higher than that of concrete stone check dams when T exceeded 23 years Lee et al. (2018) proposed a relationship between a check dam’s condition index and service times. In this relationship, the deterioration of stone check dams proceeds more rapidly than that of concrete check dams 20 years after construction. This is consistent with studies by Dell’Agnese et al. (2013) and Mazzorana et al. (2014; 2018), which showed that the condition of stone check dams was poorer than that of concrete ones in visual inspections of both types. Although information regarding the construction environment of the analysis targets was insufficient, it is concluded that deterioration progresses relatively quickly in stone than concrete check dams.
Using the 95% confidence interval of the estimated regression line, the distribution of DE in concrete might be and stone check dams can be classified into the following three groups:
1) Group I: The data were distributed in the area above the 95% confidence interval. Deterioration occurred more quickly than other check dams constructed during a similar period.
2) Group II: Data were distributed within the 95% confidence interval. The data can be estimated to follow the average deterioration trends of the examined check dams.
3) Group III: Data were distributed in the area below the 95% confidence interval. Deterioration occurred more slowly than in other check dams constructed during a similar period.
Five instances of concrete check dams appeared in Group I. In the Group I data, DE varied from 0.44 to 0.69, showing a degree of deterioration 1.6–3.3 times higher (on average) than that of Groups II and III. The examined check dams’ average service time was 16.6 years in Group I, 23.5 years in Group II, and 26.5 years in Group III, showing a 7 years difference. Expressed otherwise, the degree of deterioration in the dam bodies was highest in Group I, which contained relatively recently constructed check dams. Although there is a paucity of field information to demonstrate it, this difference in Group I and Groups II and II would seem to be relevant to the environmental factors (e.g., climate, catchment area, bed slope, sediment retention, etc.) and construction qualities (e.g., construction materials, concrete hardening time, concrete forming work, etc.).
In the case of stone check dams, the DE values of the seven instances in Group I varied from 0.06 to 0.73, showing a degree of deterioration three times higher (on average) than that of Groups II and III. The average service time for Group I was 13.6 years, which did not significantly differ from the age of 11.2 and 12.7 years observed for Groups II and III, respectively. The visual inspection method is highly reliant on human perception. Therefore, the irregular shapes of the stone check dams are not conducive to evaluating changes on the structure exterior (Hughes, 2007). The data in Figure 12B show that the degree of deterioration in stone check dams significantly increased at T exceeding 15 years. Considering the difficulties of visual inspections in stone check dams, this allows us to infer that the severity of damages and deterioration in stone check dams may become apparent 15 years after construction. Therefore, the stone check dams in Group I, which are older than those of Groups II and III, may have been favorable for evaluating the changes on the structure exterior; in the Group I data, the erosion depth varied as 0.10–0.65 m, 1.5 times higher (on average) than Groups II and III (0.01–0.57 m). Thus, further information on the inspection practice and methodology seems to be required to demonstrate the deterioration characteristics of stone check dams.
The effects of catchment and structure features on the check dam deterioration were investigated to find the causes of the high deterioration rate in Group I data (Figure 13). In both concrete and stone check dams, the variables for the elevation level (EL) and channel bed width (CW) in Group I were on average higher than those of Groups II and III (Figure 13A and Figure 13B). There was also a notable difference in catchment areas (A) between the three groups, except for two highest values of the stone check dams (>2,000ha) (Figure 13C). However, low variabilities in the channel bed slopes (S) were observed in both types of check dams in comparing the variables for each data group (Figure 13D). For the variables related to the structure features, the structure length and height (DW and DH) measured in concrete check dams revealed higher levels in Group I than in Groups II and III on average (Figure 13E and Figure 13F). However, there were no significant differences in the structural features between the three groups for the stone check dams.
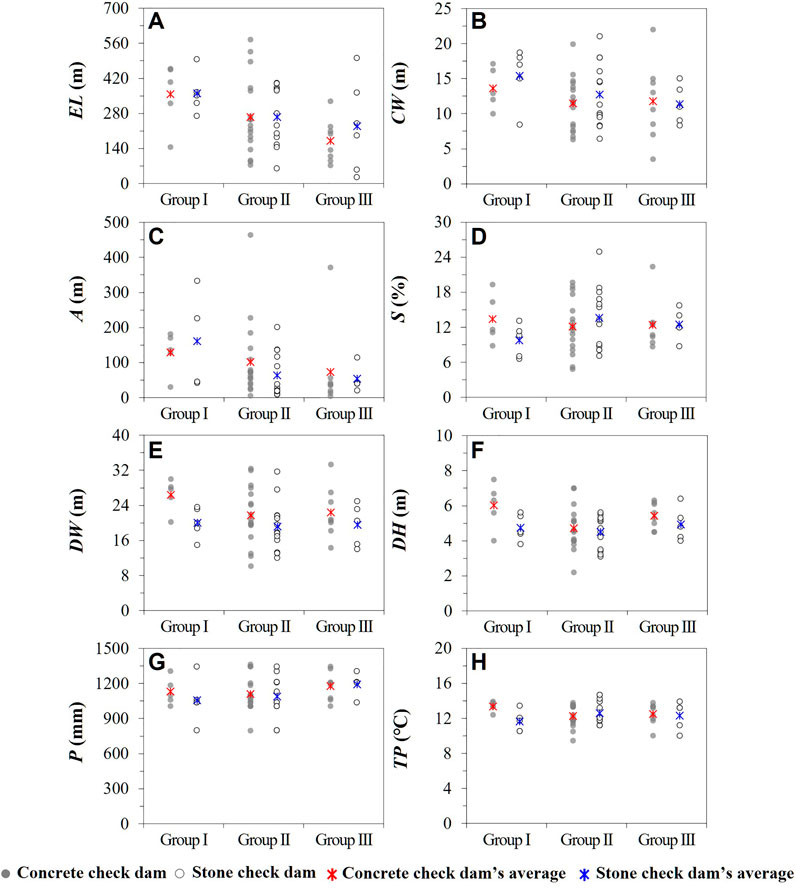
FIGURE 13. Effects of catchment and structure features on the check dam’s degree of deterioration: (A) A, catchment area (m2); (B) EL, elevation level (m); (C) CW, channel bed width (m); (D) S, channel bed slope (%); (E) DW and (F) DH, structure width and height (m); (G) P, average annual precipitation (mm); (H) TP, average annual temperature (°C).
Weather conditions such as precipitation, temperature, and humidity are closely related to extreme events and material deterioration of structures. However, there was no significant difference in the average annual precipitation (P) and annual temperature (TP) variables between Groups I, II, and III (Figure 13G and Figure 13H). Our meteorological data were acquired from a weather observation station located at 1.5–13.5 km from each study site. This would not have provided sufficient data resolution to analyze the weather conditions of the stream where the check dam was built, considering the climate characteristics of mountainous areas with high temporal and spatial variability. Therefore, it is considered that more localized data is required to evaluate the contribution of climatic factors on the check dam damages and deterioration. Although it is insufficient evidence to fully explain the effect of catchment and structure features on the check dam conditions, we can discover a difference in the deterioration rate of the check dams under conditions such as high elevation levels, broad catchment areas, and geometric properties (Dell’Agnese et al., 2013). Therefore, these variables are desirable to be considered for establishing maintenance strategies.
Conclusion
Check dams are one of representative structural measures to reduce sediment disaster at a forest watershed. Therefore, it is essential to assess the structural vulnerability and functionality of check dams in the management of sediment disaster risk at watersheds. This study examined the main types of damages and deterioration characteristics in concrete and stone check dams, which comprise more than 80.0% of Korea’s check dam stock. This was based on the 4-step condition assessment, which is the modified version of condition assessment methodology for embankment dams to meet the characteristics of check dams.
As a result, the damages and deterioration of concrete check dams were classified into ten representative types including cracking, joint deterioration, and abrasion/erosion. And representative damage types of stone check dams were classified into nine types including uncontrolled vegetation, joint mortar deterioration, and falling out. The representative damage types of concrete and stone check dams were used as basis data for condition assessment.
The 4-step condition assessment consisted of the condition assessment of damages and deterioration, the condition assessment of individual elements, the condition assessment of composite members, and the comprehensive assessment. We evaluated the structural conditions of concrete and stone check dams, which was expressed as a numerical index. The assessment results demonstrated that the spillway part frequently contacted with water and debris flows was deteriorated approximately 1.2 times faster than the wing parts for both concrete and stone check dams, and the maintenance demands of both types of check dams increased 20 years after construction. Thus, these deterioration characteristics of concrete and stone check dams should be considered in decision-making to determine maintenance priorities among the check dams stock.
We analyzed the relationship between condition index and service time in the examined concrete and stone check dams. The degree of deterioration in concrete and stone check dams increased significantly as the service time increased. In particular, the average trend in stone check dams’ deterioration was higher than that of concrete check dams when the service time increased as 23–30 years. This suggested that the maintenance priority for the deteriorated check dams (i.e., 20 years after construction) should be given to the stone check dams rather than concrete check dams.
Based on the relationship between condition index and service time, we classified deterioration characteristics of check dams into two groups: 1) those that follow the average deterioration trends of their facility group (Group II) and 2) those that undergo an unexpected end-of-service life because of exceptional incidents or severe defects (Group I). For both groups, the service environment and construction quality are determinant factors; however, the maintenance of Group II is considered to be an issue that engineers can, to some extent, predict and respond to, by using established case data. However, Group I is associated with unpredictable events and hidden problems, thus, it is not a suitable target for a generalized maintenance plan. Considering maintenance conditions and disaster-prediction difficulties produced by the Earth’s increasingly changing climate, we believe that fundamental measures (e.g., strengthening design standards and quality control) will need to be implemented with reference to the cases in Group I.
This work will form a useful resource for engineers and decision-makers involved in planning, designing, constructing, and maintaining check dams. However, this study is limited by the lack of information on the quantitative methodology for evaluating the deterioration of different types of check dams. In addition, the sample size was insufficient to allow for a generalizable conclusion in the other mountain streams, which have diverse environmental conditions. Therefore, further studies need to be carried out in order to develop scientific standards for condition assessment by utilizing the field information obtained from the routine inspections.
Data Availability Statement
The original contributions presented in the study are included in the article/Supplementary files, further inquiries can be directed to the corresponding author.
Author Contributions
KHL, EBE, and TU. contributed to conception and design of the study. KHL, EBE, and CSW organized the database and KHL and EBE. performed the statistical analysis. KHL, EBE, and TU wrote sections of the manuscript. KHL wrote and complied the first draft of the manuscript. All authors contributed to the manuscript revision, and read and approved the submitted version.
Funding
This study was financially supported by Gyeongsanbuk-do Forest Environment Research Institute Grant No. 20150401.
Conflict of Interest
The authors declare that the research was conducted in the absence of any commercial or financial relationships that could be construed as a potential conflict of interest.
Publisher’s Note
All claims expressed in this article are solely those of the authors and do not necessarily represent those of their affiliated organizations, or those of the publisher, the editors and the reviewers. Any product that may be evaluated in this article, or claim that may be made by its manufacturer, is not guaranteed or endorsed by the publisher.
Supplementary Material
The Supplementary Material for this article can be found online at: https://www.frontiersin.org/articles/10.3389/feart.2021.788029/full#supplementary-material
References
Adamo, N., Al-Ansari, N., Sissakian, V., Laue, J., and Knutsson, S. (2020). Dams Safety: Inspections, Safety Reviews, and Legislations. J. Earth Sci. Geotech. Eng., 109–143. doi:10.47260/jesge/1114
Andersen, G. R., and Torrey III, V. H. (1995). Function-based Condition Indexing for Embankment Dams. J. Geotechnical Eng. 121, 579–588. doi:10.1061/(asce)0733-9410(1995)121:8(579)
Armanini, A., Dellagiacoma, F., and Ferrari, L. (1991). From the Check Dam to the Development of Functional Check Dams. Fluv. Hydraul. Mt. Reg. 37, 331–344. doi:10.1007/bfb0011200
Chahrour, N., Nasr, M., Tacnet, J.-M., and Bérenguer, C. (2021). Deterioration Modeling and Maintenance Assessment Using Physics-Informed Stochastic Petri Nets: Application to Torrent protection Structures. Reliability Eng. Syst. Saf. 210, 107524. doi:10.1016/j.ress.2021.107524
Comiti, F., Lenzi, M. A., and Mao, L. (2010). “Local Scouring at Check-Dams in Mountain Rivers,” in Check Dams, Morphological Adjustments and Erosion Control in Torrential Streams. Editors M. Conesa-Garcia, and M. A. Lenzi ((NY, USA: Nova Science Publ), 263–282.
Cortes Arevalo, V. J., Sterlacchini, S., Bogaard, T. A., Junier, S., and van de Giesen, N. (2016). Decision Support Method to Systematically Evaluate First-Level Inspections of the Functional Status of Check Dams. Struct. Infrastructure Eng. 12, 1–18. doi:10.1080/15732479.2016.1144619
Dell'Agnese, A., Mazzorana, B., Comiti, F., Von Maravic, P., and D’agostino, V. (2013). Assessing the Physical Vulnerability of Check Dams through an Empirical Damage index. J. Agricult Engineer 43, 2–16. doi:10.4081/jae.2013.e2
Federal Highway Administration (2016). Synthesis of National and International Methodologies Used for Bridge Health Indices. Washington, D.C: Synthesis of National and International Methodologies Used for Bridge Health Indices.
Fujita, M., Mizuyama, T., Honda, N., Ikeda, A., Nagayama, T., Mike, C., et al. (2020). Effect of Chatchment Characteristics on Sabo Dam Deterioration. in” Proceedings of the 68th Annual Meeting of the Japan Society of Erosion Control Engineering. Iwate, Japan, 109–110.
Gattulli, V., and Chiaramonte, L. (2005). Condition Assessment by Visual Inspection for a Bridge Management System. Comp-aided Civil Eng. 20, 95–107. doi:10.1111/j.1467-8667.2005.00379.x
Hueble, J., and Fiebiger, G. (2005). “Debris-flow Mitigation Measures,” in Debris Flow Hazards and Related Phenomena. Editors M. Jakob, and O. Hunger (Berlin: Springer), 445–448.
Hughes, A. (2007). Training Aids for Dam Safety Module: Inspection of concrete and Masonry Dams. Washington, D.C.: Bureau of Reclamation.
Japanese Ministiry of Land, Infrastructure, Transportation, and Tourism (2014b). Inspection Procedure Manual for Sabo Facilities. Tokyo: Japanese Ministry of Land, Infrastructure, Transport and Tourism.
Japanese Ministiry of Land, Infrastructure, Transportation, and Tourism (2014a). Manual for Road and Bridge Periodic Inspection. Tokyo: Japanese Ministiry of Land, Infrastructure, Transportation, and Tourism.
Jeong, Y., Kim, W., Lee, I., and Lee, J. (2018). Bridge Inspection Practices and Bridge Management Programs in China, Japan, Korea, and U.S. J. Struct. Integrity Maintenance 3, 126–135. doi:10.1080/24705314.2018.1461548
Kasahara, Y., Otsubo, S., Ogawauchi, Y., Nihei, A., Yamakage, S., and Yamanaka, R. (2010). A Study on the Soundness Evaluation Method of the Existing Sabo Dams. in” Proceedings of the 59th Annual Meeting of the Japan Society of Erosion Control Engineering. Nagano, Japan, May 26–28, 2010, 392–393.
Korea Association of Soil and Water Conservation (2014). Annual Check Dam Inspection Report: Gyeongsangbuk-Do. Gyeongsangbuk-do, 2015.
Korea Association of Soil and Water Conservation (2015). Annual Check Dam Inspection Report: Gyeongsangbuk-Do. Gyeongsangbuk-do.
Korea Association of Soil and Water Conservation (2016). Annual Check Dam Inspection Report: Gyeongsangbuk-Do. Gyeongsangbuk-do.
Korea Concrete Institute (2014). Guidelines for Inspection and Maintenance of Underwater Structures. Gujarun: K. C. Institute Seoul.
Korea Forest Service (2020). Development of a Safety Assurance Guidance for Sediment-Related Disaster Prevention Measures and a Watershed Management Framework for Risk Reduction in forest Watersheds. Sejong: Japanese Ministry of Land, Infrastructure, Transport and Tourism.
Korea Forest Service (2018). Guidelines for Maintenance of Erosion Control Facilities. Sejong: Japanese Ministry of Land, Infrastructure, Transport and Tourism.
Korea Infrastructures Safety and Technology Coporation (2019a). Giudeline and Commentary of Safety Inspection and In-Depth Safety Inspection for Structures-Dam. Sejong: Korean Ministry of Land, Infrastructure, and Transport.
Korea Infrastructures Safety and Technology Coporation (2019b). Giudeline and Commentary of Safety Inspection and In-Depth Safety Inspection for Structures-Retaning Wall. Sejong: Korean Ministry of Land, Infrastructure, and Transport.
Korean Ministry of Land Infrastructure and Transport (2020). Guideline of Safety Inspection and In-Depth Safety Inspection for Facilities. Sejong: Korean Ministry of Land Infrastructure and Transport.
Lee, J. H. (2015). Analysis of Condition Assessment and Damage Patterns of concrete Check Dam. Ph. D. dissertation. South Korea: Kangwon National University.
Lee, J. H., Kim, S. W., Lee, K. Y., Bae, H. S., and Chun, K. W. (2021). Analysis of Factors Affecting Damage of the concrete Check Dams Based on the Exterior Condition Assessment. Crisisonomy 17, 59–72.
Lee, K. H. (2017). A Study on the Determination of Maintenance Priority Order Among Debris Barriers on the Basis of Exterior Condition Evaluation. Ph. D. dissertation. South Korea: Yeungnam University.
Lee, K. H., Lee, H. H., Ewane, B. E., Uchida, T., and Sakurai, W. (2018). Analysis of Damage Characteristics and Aging Trend of Debris Barriers Using Exterior Condition Assessment. in” Proceedings of the International Symposium Interpraevent. Toyama, Japan, October 1–4, 2018.
Lenzi, M. A., Marion, A., and Comiti, F. (2003). Local Scouring at Grade-Control Structures in Alluvial Mountain Rivers. Water Resour. Res. 39, 1176. doi:10.1029/2002WR001815
Makita, K., Ohkubo, S., Mizuyama, T., and Ido, K. (1987). Analysis of an Example of Disaster Prevention with a Sabo Dam. J. Jpn. Soc. Eros. Control. Eng. 40, 3–10.
Matsumura, K. (2000). Recent Developement in Sabo Plan and Sabo Facilities Functions. J. Jpn. Soc. Eros. Control. Eng. 52, 76–80.
Mazzorana, B., Trenkwalder-Platzer, H., Heiser, M., and Hübl, J. (2018). Quantifying the Damage Susceptibility to Extreme Events of Mountain Stream Check Dams Using Rough Set Analysis. J. Flood Risk Manage. 11, e12333. doi:10.1111/jfr3.12333
Mazzorana, B., Trenkwalder-Platzer, H. J., Fuchs, S., and Hübl, J. (2014). The Susceptibility of Consolidation Check Dams as a Key Factor for Maintenance Planning. Österr Wasser- und Abfallw 66, 214–216. doi:10.1007/s00506-014-0160-4
Miyamoto, A., Kawamura, K., and Nakamura, H. (2000). Bridge Management System and Maintenance Optimization for Existing Bridges. Comp-aided Civil Eng. 15, 45–55. doi:10.1111/0885-9507.00170
Mizuyama, T., Habara, S., and Furukawa, M. (1988). Sabo Dam Converting Debris Flow to Bedload. J. Jpn. Soc. Eros. Control. Eng. 40, 20–23. doi:10.11475/sabo1973.40.6_20
Mizuyama, T. (2010). Recent Developments in Sabo Technology in Japan. Ijece 3, 1–3. doi:10.13101/ijece.3.1
Mizuyama, T. (1979). Survey of Disaster of Check Dam. J. Jpn. Soc. Eros. Control. Eng. 4, 26–30. doi:10.11475/sabo1973.31.4_26
Ogasawara, K., and Kambara, J. (2015). Efforts in Maintenance of Sabo Facilities in Nagano Prefecture. J. Jpn. Soc. Eros. Control. Eng. 68, 47–51. doi:10.11475/sabo.68.4_47
Piton, G., Carladous, S., Recking, A., Tacnet, J. M., Liébault, F., Kuss, D., et al. (2016). Why Do We Build Check Dams in Alpine Streams? an Historical Perspective from the French Experience. Earth Surf. Process. Landforms 42, 91–108. doi:10.1002/esp.3967
Piton, G., and Recking, A. (2014). “River Flow 2014,” Proceedings of the International Conference on Fluvial Hydraulics, Lausanne, Switzerland, September 3–5, 2014, 1437–1445. doi:10.1201/b17133-192
Portland Cement Association (2002). Types and Causes of concrete Deterioration. Available at: https://www.cement.org/docs/default-source/fc_concrete_technology/durability/is536-types-and-causes-of-concrete-deterioration.pdf?sfvrsn=4&sfvrsn=4.
Recking, A. (2012). Influence of Sediment Supply on Mountain Streams Bedload Transport. Geomorphology 175, 139–150.
Rickenmann, D., and Koschni, A. (2010). Sediment Loads Due to Fluvial Transport and Debris Flows during the 2005 Flood Events in Switzerland. Hydrol. Process. 24, 993–1007. doi:10.1002/hyp.7536
Rudolf-Miklau, F., and Suda, J. (2011).Technical Standards for Debris Flow Barriers and Breakers. in” Proceedings of the 5th International Conference on Debris-Flow Hazards Mitigation: Mechanics. Padua, Italy, June 14–17, 2011: Prediction and Assessment, 1083–1091. doi:10.4408/IJEGE.2011-03.B-117
Suda, J., and Huebl, J. (2007). Schäden und schadmechanismen an schutzbauwerken der wildbachverbauung. Wildbach-und Lawinenverbau 155, 56–83.
Keywords: condition assessment, non-permeable check dams, stream management, check dam deterioration, visual inspection
Citation: Lee K-H, Ewane EB, Uchida T and Woo C-S (2022) Damage Types and Deterioration Characteristics of Check Dams Built on Mountain Streams in Southeast Korea. Front. Earth Sci. 9:788029. doi: 10.3389/feart.2021.788029
Received: 01 October 2021; Accepted: 16 December 2021;
Published: 31 January 2022.
Edited by:
Norifumi Hotta, The University of Tokyo, JapanReviewed by:
Shusuke Miyata, Kyoto University, JapanNour Chahrour, Université Grenoble Alpes, France
Copyright © 2022 Lee, Ewane, Uchida and Woo. This is an open-access article distributed under the terms of the Creative Commons Attribution License (CC BY). The use, distribution or reproduction in other forums is permitted, provided the original author(s) and the copyright owner(s) are credited and that the original publication in this journal is cited, in accordance with accepted academic practice. No use, distribution or reproduction is permitted which does not comply with these terms.
*Correspondence: Ewane Basil Ewane, ZXdhbmUuYmFzaWxAdWJ1ZWEuY20=
 Ki-Hwan Lee
 Ewane Basil Ewane3,2*
 Taro Uchida