- School of Petroleum Engineering, China University of Petroleum (East China), Qingdao, China
The hydraulic transport of solid materials is widely used in various industrial fields owing to its high efficiency, low cost, and environmental friendliness, and it has received extensive attention. However, the violent interaction between the liquid and solid phases during transportation makes the slurry flow strongly unsteady and heterogeneous, and it is difficult to use the existing mathematical models describing the motion characteristics in the hydraulic transport of slurry because of the limitations of a single theory or experimental data basis. In this study, considering the randomness and uncertainty in the transportation of solids, a spatio-temporal evolution model of the hydraulic transport characteristics of particulate solids was established. This model is suitable for hydraulic transport in pressure pipelines and open channels, and it can be used to analyze the influence of changes in the motion and property parameters of the liquid–solid phase on the characteristics of the temporal-spatial evolution of the slurry velocity and concentration distributions. The rationality of the model was verified through laboratory experiments. Through an interaction analysis of slurry components, this work explores the influence of the transport of solids on the slurry motion and property parameters, fills the gap in the evolution mechanism of the slurry velocity and concentration distributions in existing models, and overcomes the limitation that layer-based models can only be used in pressure pipelines. Therefore, it has important guiding significance for the engineering design of particulate solid hydraulic transport.
Introduction
The hydraulic transport of solid materials has become the fourth largest transportation method, after road, railway, and water transportation, because of its high efficiency, low cost, and environmental friendliness (Ravelet et al., 2013; Pati et al., 2017). This transportation mode is flexible, and it includes transport of materials in pressure pipelines (Orell, 2007; Ihle et al., 2014) and, under favorable terrain conditions, in open channels (Kempe et al., 2014). The conveyed materials are various, including fuels (natural gas hydrate, coal, etc.) (You and Liu, 2002), raw materials (metal or non-metallic minerals, building materials, etc.) (Stanić et al., 2017), waste (power plant fly ash, metallurgical or chemical mine tailings, etc.) (Patterson and Maloney, 2016; Pullum et al., 2018), and siltation removed from rivers or reservoirs (Cuisinier et al., 2011; Muddle and Briggs, 2019). This mode is widely applied in various industries and has broad prospects for development. During hydraulic transport, solid particles are activated under the action of a lateral flow, and the flow is gradually transformed from a single-phase liquid to multiphase slurry (Kaushal et al., 2002). This process is accompanied by mass, momentum, and energy exchange between the liquid and solid phases, and the slurry velocity and concentration distributions also evolve gradually with transportation. This leads to strong unsteadiness and heterogeneity of the slurry flow, and significantly increases the difficulty of hydraulic transportation engineering design. As for the transportation in a pressure pipeline, under the influence of the non-uniformity of the slurry concentration distribution, the momentum exchange between the solid particles and the pipe wall is concentrated at the bottom of the pipe, where the pipeline will be worn more seriously (Xie et al., 2015). Thus, the pipeline should be rotated regularly to improve its safety and economic performance. For transportation in an open channel, under the influence of the unsteady velocity distribution, the erosion intensity of the slurry on the trough bed evolves gradually, and the slurry concentration and velocity distributions should be closely monitored to ensure the safety and reliability of the construction (Zhang et al., 2013). Therefore, the temporal and spatial evolution of the characteristics of particulate solid transportation affects the stress state of particles (Yu et al., 2015), the ability of the fluid to transport particles, and the variation in the hydraulic gradient (Kaushal and Tomita, 2003). This is of great significance for the optimal design of hydraulic transport systems.
To describe the characteristics of the slurry velocity and concentration distributions in hydraulic transport, scholars have carried out relevant laboratory/field experiments and theoretical research. Mathematical models describing the hydraulic transport characteristics of particulate solids have been established, which can be divided into layer-based theoretical models and empirical models (Hunt, 1954; Karabelas, 1977; Roco and Balakrishnam, 1985; Wilson, 1987; Pope, 2001; Matousek, 2002). The layered theoretical model can be further divided into two- and three-layer models.
(1) Empirical Model
Based on the characterization model of a two-dimensional slurry flow in an open channel of Hunt (1954), Karabelas (1977). proposed a method to determine the slurry velocity and solid concentration distributions in a horizontal pipeline by using the dimensionless particle diffusion coefficient Kj. Empirical expressions of Kj for different pipe diameters and material particle diameters were established in combination with laboratory experiments. Roco and Balakrishnam (1985) established a constitutive equation for slurry motion through laboratory experiments and applied the N–S equation to describe the motion law of a high-concentration slurry during pipeline transportation. The effects of liquid–liquid, solid–solid, and liquid–solid interactions on the velocity and concentration distributions of the slurry were analyzed, and the rationality of the method was verified by laboratory experiments. Based on the Prandtle mixing length theory (Pope, 2001), Wilson (1987) developed a prediction model for the velocity and solid concentration distributions of a slurry flow in an open channel by analyzing the characteristics of the shear stress distribution of a homogeneous slurry flow and modified the model by combining it with laboratory tests to expand its application scope. Matousek (2002) conducted laboratory experiments to study the slurry flow in pipelines under different fluid and material particle characteristics. By combining the experimental data of constant-temperature flows of sand, shimmering, and coarse coal slurry in industrial-scale pipelines, an empirical model of the slurry motion and property parameters was obtained. On this basis, a fixed-bed thickness prediction model for the formation of particle transport in a pipeline was proposed.
(2) Two-Layer Model
Based on the liquid–solid pipe flow theory of Wilson (1987), Levy and Mason (2000) divided the slurry drainage area in a pressure pipeline into two parallel layers: a sedimentary bed with a high solid concentration and a suspension layer with a low solid concentration. By analyzing the conservation of mass between layers and the conservation of momentum in each layer, the distributions of bed thickness, solid concentration, and average velocity along the pipeline under the condition of a uniform particle size distribution were obtained. Kaushal and Tomita (2002) carried out a simulation experiment of hydraulic transportation of zinc tailing slurry in a horizontal pipe and measured the slurry solid concentration distribution under different particle sizes and flow velocities on the vertical plane. Combined with the experimental data, the empirical model of Karabelas (1977). for prediction of the particle concentration distribution was modified, but this model is suitable for relatively low-concentration slurry and can only calculate the velocity distribution when the slurry is homogeneous, which limits its application. Gillies et al. (2004) expanded the application scope of the two-layer model through laboratory experiments and studied the distribution of the motion parameters of high-concentration slurry transport in a horizontal pipeline. Capecelatro, J. (Capecelatro and Desjardins, 2013). considered the effects of particle collision and liquid viscous shear force on the distribution of the motion and property parameters in the suspension layer, and established an Eulerian–Lagrangian model to simulate the unsteady flow characteristics of a slurry in a horizontal pipeline. The simulation results were verified by the laboratory data of Roco and Balakrishnam (1985).
(3) Three-Layer Model
Based on the previous two-layer theoretical model, Doron and Barnea (1993) proposed that the actual slurry flow should include a transition zone, which is placed between the sedimentary bed formed by the continuous deposition of particles at the bottom of the pipeline and the suspension layer formed by the turbulent diffusion of fluid. In the transition zone, the interaction between the phases was intense, and the internal slurry had a large velocity gradient and solid-phase concentration gradient. Nguyen and Rahman (1996) established the mass and momentum conservation equations corresponding to each layer and pointed out that the velocity gradient and solid concentration distribution of the transition layer slurry follow the Wilson (1987) distribution law. The model does not consider the changes in the slurry properties and motion parameters with time and is a steady-state flow model. Assuming that the velocity distribution of the transition layer conforms to the logarithmic distribution law, and the solid phase concentration obeys the basic equation of convection and diffusion, Cho et al. (2002) considered the influence of slurry rheology, material size/sphericity, pipeline geometry, and other factors and established a three-layer steady-state model of slurry flow in an annular space. The simulation results are in good agreement with the experimental data of Nguyen and Rahman (1996). Based on a three-layer steady-state model and two-layer unsteady-state model, Guo et al. (2010) established a three-layer unsteady-state model of slurry flow in an annular space, which simplified the dynamic analysis process of slurry motion parameters.
In summary, the empirical model is based on experiments to determine key parameters such as the dimensionless particle diffusion coefficient and slurry motion constitutive relationship, and it establishes a semi-empirical equation describing the slurry motion or uses experimental data to perform a statistical regression on the velocity and concentration distributions of the slurry transportation. Therefore, the application range of the empirical model is limited by the data coverage of the experimental measurements. Thus, it can complete accurate calculations when the engineering parameters meet the data coverage and high measurement accuracy. The layer-based model is based on a unified theoretical basis, and the research has good continuity. It has gradually developed from a two-layer steady-state model to a three-layer unsteady-state model, which can accurately predict the solid hydraulic transport characteristics under different working conditions. Among them, the steady-state model focuses on describing the distribution state of the slurry motion after full development of each layer of fluid, whereas the unsteady-state model focuses on the dynamic development process of each parameter. Therefore, the layer-based model can describe the transport characteristics of each layer, but in essence, each layer of fluid is artificially homogenized; that is, each layer of fluid in the same section contains a liquid phase and solid phase with uniform velocity. In that model, the mechanism of the gradual evolution of slurry velocity and concentration distributions caused by liquid–solid interaction is not described, and the concentration distribution of each layer is determined only based on the basic equation of convection diffusion, without considering the influence of particle size distribution. For that reason, its application is limited to transportation in a pipeline, and there is relatively less research on transportation in open channels, where the randomness and uncertainty of particle movement in the slurry will be more significant owing to the lack of pipe wall constraints. The layered model should consider the influence of multiple factors and be more inclusive and uniform.
In transportation engineering, the slurry contains a variety of particle size gradations, and the transport characteristics are significantly affected by the velocity and concentration distributions of particles of different sizes. It is important to explore the changes in the parameters of slurry motion and physical properties in different positions during hydraulic transportation to further understand the micro field of the slurry motion and property characteristics (such as pipeline wear-erosion intensity, energy loss, and particle motion morphology). In this study, considering the randomness and uncertainty of solid transportation, a spatio-temporal evolution model for the hydraulic transport characteristics of particulate solids was established. This model is suitable for hydraulic transport in pressure pipelines and open channels, and it can be used to analyze the influence of changes in the motion and property parameters of the liquid–solid phase on the characteristics of the temporal-spatial evolution of slurry velocity and concentration distributions. The rationality of the model was verified through laboratory experiments. Through an interaction analysis of the slurry components, this work explores the influence of solid transport on the slurry motion and property parameters, fills the gap in the evolution mechanism of the distributions of slurry velocity and concentration in existing models, and overcomes the limitation that layer-based models can only be used in pressure pipelines. This has important guiding significance for the engineering design of particulate solid hydraulic transport.
Disturbance Effect of Particle Transport on the Transition Layer Flow Field
In hydraulic transport, particles on the sedimentary bed flow under the action of the liquid phase when the flow velocity is sufficiently high, and they eventually settle in the sedimentary bed under gravity. Such liquid–solid interactions lead to continuous activation, sedimentation, and re-activation of the particle swarm so that a transition layer is formed above the sedimentary bed (Syamlal and O’Brien, 1987), which has an intense exchange of mass and momentum between the liquid and solid phases. In the upper part of the transition layer, the velocity approaches that of the incoming flow and the concentration approaches zero, whereas in the lower part, the velocity approaches zero and the concentration approaches that of the sedimentary bed. Under a constant inflow velocity, the variations in the distribution of velocity and concentration in the transition layer are due to the invasion of solid particles, and they together lead to a variation in fluid mass flow in the transition layer. Therefore, the variation in the thickness of the sedimentary bed is related to the inhomogeneity of the mass flow distribution of the fluid in the transition layer.
When the shear force in the transition layer is sufficient to overcome the resistance of particles in the sedimentary bed, the particles invade the transition layer and begin to migrate. At the same time, the fluid clusters surrounding the particles in the transition layer will also receive a reaction force from the solids, which has a tendency to hinder the fluid movement. The reaction force can only be balanced by the shear force and therefore, as the solid particles in the transition layer continue to invade, the internal flow shear force gradually splits into two parts (Anderson and Haff, 1991):
where τ is the flow shear force of the transition layer, τs is the solid–phase shear force, which is used to overcome the reaction force from the material particles, and τl is the liquid phase shear force, which is derived from the velocity gradient of the transition layer fluid and is used to overcome the resistance to movement of particles in the sedimentary bed. Equation 1 shows that particle intrusion causes a continuous change in τs and τl. With continuous intrusion, the solid concentration in the transition layer increases holistically, resulting in an increase in the reaction force acting on the internal fluid, and then τs increases accordingly. Therefore, under the condition of constant τ, τl decreases accordingly, indicating that with an increase in solid concentration in the transition layer, the power to activate particles on the bed surface decreases, and the collision frequency between the moving and stationary particles increases. The momentum exchange caused by collision has a significant influence on the motion state of the moving particles themselves, but it is not sufficient to overcome the motion resistance of the stationary particles on the bed surface (Owen, 1964). It can be concluded that the intrusion of particles in the transition layer increases the solid concentration and reduces the velocity gradient of the slurry, and the activation efficiency of the stationary particles decreases accordingly. Such a negative feedback mechanism causes the concentration and velocity fields in the transition layer to converge to a steady state. Therefore, the evolution of the slurry motion and property parameters in the transition layer is related to the particle motion state, and the characteristics of the spatio-temporal evolution of particles can be obtained based on the analysis of the particle transport characteristics.
The motion of particles in the transition layer conforms to the parabolic trajectory (Syamlal and O’Brien, 1987), that is, the particles decelerate first and then accelerate under the action of viscous resistance and gravity in the vertical direction after activation. Eventually, particles sink to the sedimentary bed and collide with the stationary particles at the corresponding position, and then embed in the sedimentary bed or rebound and enter the transition layer again to start a new transportation. In this section, the particle transport is divided into collision motion between moving and static particles and parabolic motion in the transition layer. By analyzing the stress state of a single particle and the trend of distribution of the particle swarm momentum in the two stages, the evolution laws of the slurry motion and property parameters in the transition layer are finally obtained.
Collision Model
The model assumes that particles in the sedimentary bed and transition layer are completely elastic spheres, so the energy loss caused by the impact and collision between particles due to plastic deformation can be ignored, the particle transport is limited in a two-dimensional plane composed of gravity direction and flow direction, and the influence of random disturbance is not considered.
Based on the assumptions above, as shown in Figure 1, the collision motion can be simplified as particle A in the transition layer colliding with the stationary particle B on the sedimentary bed at the collision angle α (the angle between the particle movement direction and flow direction), and the contact angle between A and B is β (the angle between the particle center line and the flow direction). Mt0 is the momentum when particle A collides with B. It can be decomposed into Mt0h and Mt0v along the flow and gravity directions, where Mt0v is the momentum accumulation of particle A along the gravity direction before collision. Without considering the influence of parabolic motion in the transition layer on the change of particle momentum, if the transportation of particle A maintains continuity, the momentum of A in the gravity direction after collision should be greater than Mt0v. Further, Mt0 can be decomposed into MtL and Mt1 along the line of the particle center line and its vertical direction, where MtL is the momentum component that will be transferred to particle B after collision, and Mt1 is the initial momentum of particle A after collision. Therefore, when the component Mt1v of Mt1 along the gravity direction is greater than Mt0v, the continuity of particle transport can be maintained. Although the two decompositions above have the same dynamic significance, they express the momentum distribution state before and after particle collision with different emphases. Based on the above analysis, it can be concluded that the essence of particle collision lies in the momentum exchange and redistribution between particles. The key to maintaining the continuity of particle motion lies in the relative sizes of Mt1v and Mt0v. Based on the geometric relationships between the components,
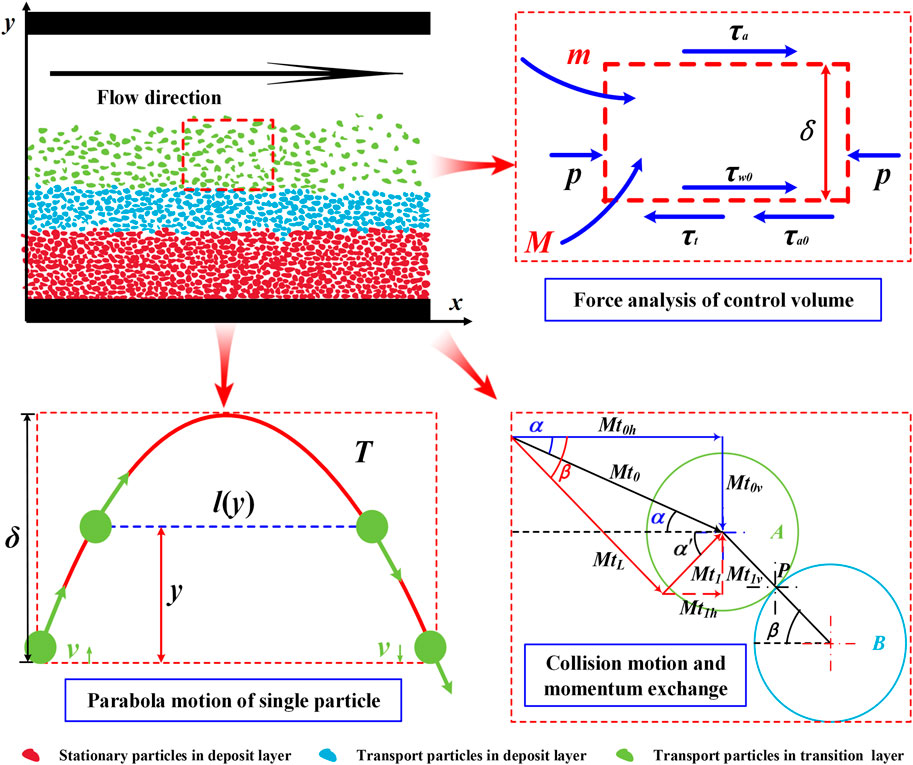
FIGURE 1. Momentum distribution of transported particles and static particles on the sedimentary bed.
According to Eq. 2, under a given collision angle α, the relative sizes of Mt0v and Mt1v are only related to the contact angle β, but the value of β is constrained by the arrangement of particles on the sedimentary bed. When there is no gap between particles on the bed surface, the minimum contact angle βmin is obtained when the particles are tangent to the adjacent particles C along the direction of transport velocity. The maximum contact angle βmax is obtained when the particle is tangent to the static particle B along the velocity direction. According to the geometric relationship between the particles, it can be concluded that
When there is a gap between particles, βmin decreases with an increase in the gap distance. Under the condition that the moving and static particles are spheres of the same size and the collision angle α is given, the probability of the contact angle β between the moving particles and the static particles on the bed will vary with the size of the impact area. When β = α, the impact area of the moving particles is the largest, and it corresponds to the large circle of the static particles. According to the geometric relationship, the collision area and β, α satisfy the following relationship:
where C is the collision area, and R is the radius of the particle circle. Correspondingly, under the condition of a given collision angle α, the larger the value of β is, the lower the probability of its occurrence.
It can be observed from Figure 1 that when the moving particle A collides with the stationary particle B on the bed surface, momentum exchange MtL is generated along the direction of the line connecting the A and B centers. The size of the residual momentum Mt1 determines whether the particles can move sustainably, and its direction determines the direction of transport speed. According to the geometric relations, the direction α′ of Mt1 satisfies
Eq. 6 shows that α′ depends on contact angle β. When β is less than 90°, the component Mt1v of Mt1 is opposite to gravity, and particles can jump again after collision when Mt1v is sufficient to overcome Mt0v. When β is greater than 90°, Mt1v is in the same direction as gravity, which means that the transported particle A will continue to collide with the stationary particle D after contacting the stationary particle B. As the initial momentum Mt0 causes momentum loss MtL along the direction of the central line of A and B, the initial momentum of the secondary collision is Mt1. According to the geometric relationship, the collision and contact angles corresponding to the second collision can be obtained as follows:
where α′ and β′ are the collision and contact angles of the second collision, respectively; whether the particles can jump again depends on the relative size of Mt2V and Mt3V. According to Eq. 2, the following can be concluded:
Momentum Gain of Transported Particles During Collision
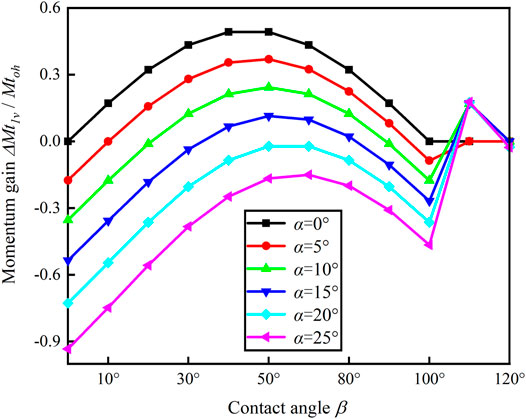
According to Eqs 2, 9 (β > 90°), when the collision angle α varies from ∼0° to 25°, the momentum gain of particles with different contact angles β can be calculated as shown in Figure 2. Under the condition of a given collision angle α, the momentum gain of the transported particles increases initially and then decreases as the contact angle β increases, partly because the given α determines the value of Mt0v, and the trends of the momentum gain of transported particles only depend on Mt1v, which is the vector difference between Mt1 and Mt1h. With an increase in β, both Mt1 and Mt1h increase. It can be concluded from the calculations shown in Figure 2 that when β < 50°, with the increase in β, the increase in amplitude of Mt1 is greater than that of Mt1h, and thus the momentum gain of particles increases with the increase in contact angle β; when β > 50°, with the increase in β, the increase in amplitude of Mt1 is less than that of Mt1h. Therefore, the momentum gain of the particles decreases with an increase in the contact angle β. When the contact angle β is approximately 50°, the momentum gain of the transported particles reaches a maximum. Further, under the given contact angle β, the momentum gain of the transported particles decreases with an increase in the collision angle α, and the momentum gain is negative when α > 20°. This occurs because the increase in α leads to an increase in Mt0v and a decrease in Mt1v under the given condition of β, and finally to a decreased momentum gain of the transported particles.
According to Figure 2, the momentum gain of single particles with different contact angles β can be obtained when the collision angle is α to determine the initial momentum and corresponding collision angle at the next jump. However, the initial momentum and contact angle of the transported particles contained in the particle swarm vary, which means that the initial momentum and the corresponding collision angle of particles at the next jump are in accordance with a certain probability distribution for the particle swarm. From Eq. 5, when the impact angle α is given, |β−α| determines the size of the collision area. Therefore, with an increase in contact angle β, the probability of its occurrence decreases. Based on the weighted average method, the momentum gain expectation of the particle swarm corresponding to different impact angles α can be obtained as follows:
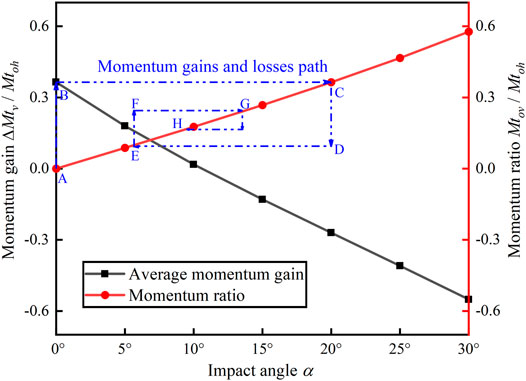
The calculation results are shown in Figure 3. The average momentum gain of the particles decreases with an increase in the collision angle α, which is consistent with the trend of the single-particle momentum gain in Figure 2. In addition, it can be concluded that the momentum change in the particle collision process tends to converge to a fixed value. For example, when particles collide with particles on a sedimentary bed with an impact angle of 0°, as shown at point A in Figure 3, the momentum gain generated during the collision process can be obtained through the gain curve (marked by the black line). Finally, the momentum obtained can reach the position of point B, where the momentum will remain until it collides with the particles on the bed. The collision angle corresponding to the next collision can be obtained by the momentum ratio curve (marked by the red line) to lead particles to reach point C if the momentum loss due to fluid resistance is not taken into account in the transport process. By analogy, the collision motion is actually the convergence process of the particle momentum. When the momentum of particles along the direction of gravity, Mt0v, is large, the impact angle is large, and the corresponding negative momentum gain leads to a decreasing trend. When Mt0v is small, the collision angle is small, and the corresponding positive momentum gain leads to an increasing trend. It can be concluded from Figure 3 that the variation in the average momentum gain between positive and negative α makes the particle transport not only persistent but also tends to converge to the zero position of the ordinate of the average momentum gain curve, and this trend is independent of the initial momentum of the particles.
Asymptotic Behavior of the Momentum Probability Distribution of Particle Swarm Before and After Collision
Figure 2 shows the trend of the momentum gain of a single particle under different collision angles α and corresponding contact angles β. Combined with Figure 3, it can be observed that the particle momentum tends to converge to a fixed value under the condition that the momentum loss caused by fluid resistance is not considered, and this trend is independent of the initial momentum of the particles. However, different particles contained in the particle swarm correspond to different initial momentums, that is, the initial momentum should follow a certain probability distribution. Referring to the trend of momentum of a single particle during the collision motion, the momentum distribution of the particle swarm should also converge with the transport process. In this section, the asymptotic behavior of the momentum distribution of the particle swarm in a collision motion is discussed.
From the average momentum gain curve in Figure 3, when the particle momentum before collision is large, it tends to decrease owing to the negative momentum gain during the collision motion. Otherwise, it tends to increase, which ensures that when the sample space of the particle swarm momentum is given, the particle momentum does not jump out of the sample space because the particle momentum is excessively large or excessively small. Then, the sample space of the particle swarm momentum can be assumed as follows:
The momentum probability distribution corresponding to the particle swarm is
where k is the number of collisions, the probability distribution Xk represents the instantaneous state that the particle swarm reaches after k times of collision from the initial state, and (xk)i is the proportion of particles with momentum
During the collision motion of the particle swarm, owing to the difference in momentum and contact angle β between particles, the corresponding momentum gain is also different. For example, any particle with momentum
The momentum of the particles still traverses the entire sample space after collision, but the corresponding probability distribution is transferred to Xk+1, where the element (xk+1)j can be obtained using the full probability formula:
The proportion of particles with momentum
Equation 15 shows that the state of the particle swarm after any collision depends only on the initial state X0 and the transfer probability matrix P. Therefore, whether the momentum distribution of the particle swarm converges with the transport process depends on the asymptotic quality of Pk when the collision number k approaches infinity.
According to Eq. 13, the i-th row element of the transfer probability matrix P represents the probability of the given particle momentum
For any
Therefore, for any
Therefore, when m tends to infinity, if |λ| > 1, there must be elements in λmVλ that tend to infinity, whereas
For the n-dimensional matrix PT, the eigenvalues are assumed to be λ1, λ2, … , λn, and the corresponding eigenvectors are Vλ1, Vλ2, … , Vλn, then
Therefore, according to the linear correlation or independence of such eigenvectors, the convergence conditions of the momentum distribution of the particle swarm are discussed in the following two cases:
① If the eigenvectors are linearly independent, then for any initial state X0, there are constants c1, c2, … cn, satisfying
Combined with Eq. 20, it can be obtained
From Eq. 16, the row sum of the P matrix is 1. Hence, λ = 1 must be one of its eigenvalues, assuming λ1 = 1, and then
If and only if there is an eigenvalue λ = −1, the limit of the above equation does not exist, and the present period changes. When the eigenvalue of P does not contain λ = −1, then
From Eq. 12, when m tends to infinity, the limit state of the particle swarm momentum probability distribution must satisfy the condition that the sum of each element is equal to 1, and thus c1 in Eq. 23 is also uniquely determined.
② If the eigenvectors are linearly related, then P must contain the eigenvalue λ = 0, and P is not full rank, assuming its rank is r; then,
where
Substituting Eq. 25 with Eq. 26, we Obtain
For any initial state X0 transferred to state X1 after collision, the following conditions are satisfied:
Substituting Eq. 25 with Eq. 28, we obtain
where
Because the largest linearly independent group of eigenvectors contains only r elements, that is, it can only linearly represent any r-dimensional vector, let
then there are constants b1, b2, … bn, such that
combining Eqs 27, 29, it can be obtained
Equation 33 shows that when any r-dimensional vector can be expressed linearly by the largest linearly independent group of eigenvectors, state X1 can also be linearly described by the largest linearly independent group.
From Eq. 19, the absolute value of any eigenvalue of P is not greater than 1, so if and only if there is an eigenvalue λ = −1, the limit of the above equation does not exist and the present period changes. When the eigenvalue does not contain −1, the above equation converges to
In summary, a sufficient condition for the momentum distribution of the particle swarm to converge with the progress of transport is that −1 is not an eigenvalue of the transfer probability matrix P.
Stationary Probability Distribution of Particle Swarm Momentum
Based on the above analysis, a sufficient condition is obtained that the momentum distribution of the particle swarm converges with the process of transport, but the stationary probability distribution of the particle swarm where it eventually converges to is unclear. Equation 23 provides a method to solve the stationary probability distribution, which involves the power calculation of the transfer probability matrix. Once the sample space of the particle swarm momentum is large, the calculation becomes very complicated. Moreover, compared with the stationary probability distribution, which is a stable state, the particle swarm state obtained by each matrix operation of Eq. 23 is in an instantaneous state, and the transfer of momentum distribution of the particle swarm has greater randomness and unpredictability at this time. This means not only that the method is cumbersome, but also that the intermediate calculation results have no significance for the final stationary probability distribution. Therefore, a more concise method is required to solve the stationary probability distribution of the particle swarm momentum.
If the momentum distribution of the particle swarm is convergent and the stationary probability distribution is Xs then, from Eq. 23, it can be concluded that
From Eq. 36, the initial state X0 and the stationary probability distribution Xs are both definite quantities; therefore, the transfer probability matrix Pm also converges as the number of transitions increases. If it converges to Q, then Q should satisfy for any initial state X0 multiplied by it to obtain only the stationary probability distribution Xs, so Q satisfies
Equation 37 shows that the elements in each column of Q have the same value, and the stationary probability distribution X is obtained as follows:
Therefore, only matrix Q is required, and the stationary probability distribution Xs can be uniquely determined. It can be obtained from Eq. 38
The stationary probability distribution Xs can be obtained by solving Eq. 39.
① Existence of solutions to Eq. 39
It can Be obtained from Eq. 16 that
Therefore, the equation
As the coefficient matrix (PT-I) is not full rank, it can be known that Eq. 39 must have a non-zero solution.
② Probability meaning of the solution of Eq. 39
At each moment in the collision motion, the momentum distribution of the particle swarm is transferred to the given sample space. The proportion (xk+1)j of particles with momentum
Equation 42 shows that the component (xk+1)j in state Xk+1 represents the expectation that the momentum of the particle swarm at the last moment transfers to
where x1 is the momentum reached by the particle after a collision. The particle may reach
Both sides of the equation are multiplied by (xs)i at the same time, and summed with i as the independent variable; then,
By combining Eqs 42, 12, the following can be obtained:
Therefore, the probability meaning of the solution of Eq. 39 is the reciprocal of the average number of collisions required for the particle momentum
Parabola Model
After completing the collision motion between particles and momentum exchange, the parabolic motion in the transition layer begins. As shown in Figure 1, the parabolic motion of the particles is divided into two stages: upward and downward. In the upward stage, the particles decelerate along the gravity direction under the action of gravity G and fluid resistance FDy. When they reach the highest point P, the corresponding vertical velocity v↑ = 0; in the downward stage, the directions of G and FDy are opposite, and the maximum vertical velocity is reached when the particles are about to collide with the static particles in the sedimentary bed. It can be observed that the parabolic motion also contains frequent stress interactions and momentum exchange between the liquid and solid. In this section, we analyze the stress state of the particles in the transition layer, the dynamic model of the particle parabolic motion, and the corresponding transfer probability matrix. On this basis, the trend and convergence of momentum in the parabolic motion of particle swarms are discussed.
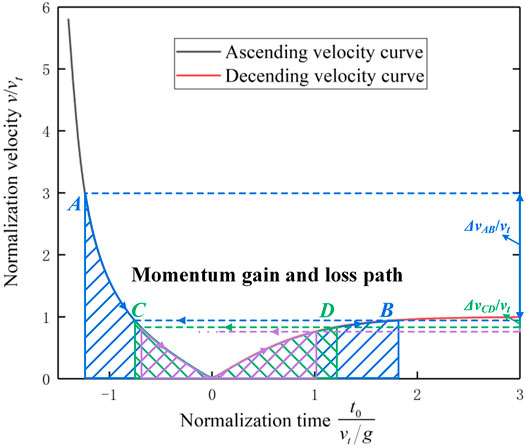
As shown in Figure 5, during the upward stage of the particles, the changes in velocity satisfy
where ρf is the density of seawater, A is the particle cross-sectional area, v is the particle movement speed, and CD is the drag coefficient with dimension 1, which is a function of the Reynolds number, Re, of the particle movement.
The momentum of the particle swarm gradually converges to a stable state as the collision progresses, and the corresponding Re should also converge under the given conditions of flow velocity and particle diameter. As shown in Figure 4, the Re probability distribution of the particle swarm at the steady state can be obtained according to Figure 4, and combined with the change curve of the drag coefficient CD with Re (Syamlal and O’Brien, 1987). As shown in Figure 4, when Re is small, the transport medium is in laminar flow state. At this time, the particle settlement resistance is mainly viscous force, and CD has a linear relationship with Re; With the increase of Re value, the movement of transport medium is gradually transformed into turbulence. At this time, the viscous force and turbulent resistance received by particle settlement can not be ignored, and CD has a curve relationship with Re; When the value of Re increases to a certain extent, the transport medium is in the turbulent region. At this time, the viscous resistance of particle settlement can be ignored, and CD remains constant with the change of Re. The fluctuation range of the value of the particle swarm CD is negligible. Therefore, it can be considered that CD remains constant during the parabolic motion, and its size can be measured by the terminal velocity of the particle settling:
where vt is the terminal velocity. Substituting Eq. 48 into Eq. 47, we obtain
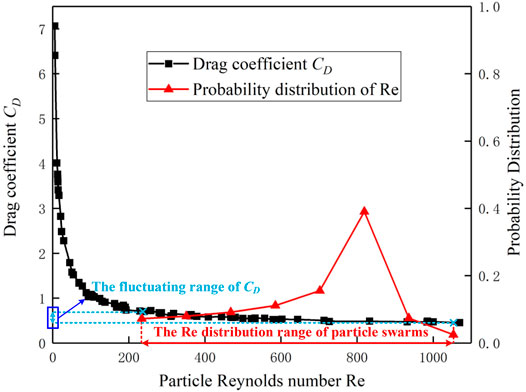
FIGURE 4. Fluctuation range of CD and probability distribution of Re during particle parabolic motion.
Integrating both sides of Eq. 49, and taking the particle motion state at the highest point P as the boundary condition, that is, t = 0 and v↑ = 0 are satisfied, the motion equation of the particle upward stage can be obtained:
The motion equation of particles in the downward stage is as follows:
Equations 50, 51 indicate that when the particle motion velocity v and the corresponding time t are normalized by the end-settlement velocity vt, the change in the dimensionless velocity
Equation 52 is substituted into Eq. 51 to obtain the velocity
Disturbance of Particles Transport on Transition Layer Flow Field
In this section, the particle swarm velocity distribution profile is obtained by analyzing the change law of the momentum of the particles during the transport process. Moreover, we considered the interaction between the fluid in the transition layer and the particles on the bed, and the mass of the particles flowing into the transition layer per unit time was obtained. Finally, on this basis, the disturbance law of particle transport in the flow field of the transition layer is discussed.
The transport of particles essentially alternates between the collision motion and the parabolic motion, that is, the particles begin the parabolic motion in the transition layer after the collision motion with the bed surface, and the change law of particle swarm momentum should satisfy
where P and R are the transfer probability matrix of the momentum change in the collision motion and the parabolic motion of the particle swarm, and the matrix S = PR obtained by the multiplication of the two is also the transfer probability matrix according to Eq. 16, which corresponds to the change in momentum of the particle swarm in the transport process.
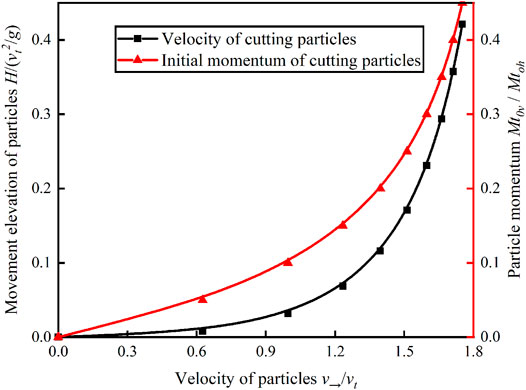
When the particle moves to the highest point during the parabolic motion, the velocity along the gravity direction reaches the minimum value, which indicates that the particles stay at this position for the longest time. The velocity v→ of particles in the flow direction at this position can then be taken as the value of the velocity profile in the transport process of the particle swarm, which can be obtained by traversing the particle swarm momentum sample space, as shown in Figure 6. The particle swarm velocity increases with increasing elevation, but the increasing speed gradually slows down. This is because with an increase in v→ the fluid resistance of particles along the flow direction decreases gradually, that is, the velocity of particles remains constant until v→ increases to the flow velocity. When the transition layer fluid accelerates the particles, it will also be subject to the reaction of particles, which causes the original flow field to evolve with the transport process. According to the conservation of the fluid mass in the transition layer, the following can be obtained:
where
Evolution of Property and Motion Characteristics of Slurry During Hydraulic Transportation
The transportation of particles leads to the continuous evolution of the property and motion characteristics of the slurry, and the convergence of the momentum distribution with the transportation process indicates that the evolution of the velocity distribution, solid concentration distribution, mass flow distribution, and bed thickness of the transition layer should also be stable during hydraulic transport. In this section, according to the analysis of the mass and momentum exchange between the transition layer and the sedimentary bed in the transportation, the trend of velocity and solid concentration distributions in the transition layer is obtained, and on this basis, the characteristics of the evolution of the sedimentary bed geometry are explored.
Continuity Equation of Slurry in Transition Layer
Particles in the sedimentary bed begin to move under the action of the transition layer fluid, and the mass of the activated particles is related to the mass flow rate of the transition layer fluid. The activation probability function can be expressed as follows (Syamlal and O’Brien, 1987):
where T is the movement period of particles, M is the mass of particles invading the transition layer during T, and IPF is the activation probability function of the particle, which can be expressed as (Sauermann et al., 2001)
where τl0 is the liquid-phase shear force at the junction of the sedimentary bed and the transition layer. τt is the critical starting stress of material particles, and its calculation method can be referred to (Ahmed, 2001). When τl0 > τt, then n > 1, and when τl0 < τt, then n = 1. Equation 56 shows that when and only when τl0 > τt, particles will be activated in the sedimentary bed, and the activation efficiency of these particles depends on the trend of n. Based on the Taylor expansion and Eq. 55, the following equation can be obtained:
where
Taking the micro-element control volume in the transition layer as the research object, based on the law of conservation of mass, it can be concluded that
where ρ is the fluid density of the transition layer, v is the fluid velocity, l is the average transport distance of the particles, and δ is the thickness of the transition layer. According to the stress state of the micro-element control volume, the expression of τl0 can be obtained using the momentum theorem as follows:
The equation is based on the assumption that the flow velocity is uniform and time-invariant, where
where μ is the viscosity of the slurry in the transition layer, which is affected by the concentration of solid particles (Einstein, 1906):
where μ0 is the viscosity of the slurry without solid particles, and Cv is the volume concentration of the solid phase in the transition layer. Equation 58 shows that the change in fluid mass in the micro-element control body depends on the mass flow gradient in the flow direction and the invasion rate of particles in the sedimentary bed, and its trend is related to the distribution of the velocity field and solid concentration in the transition layer during transportation. Therefore, the characteristics of the evolution of the slurry properties and motion parameters depend on these two important parameters.
Characteristics of the Evolution of Flow Field and Solid Concentration Distributions in the Transition Layer
Based on the boundary conditions above, the velocity distribution in the transition layer can be assumed to be a polynomial distribution with five unknowns:
The concentration distribution of the solid phase can be expressed as follows:
The flow field and solid concentration distributions in the transition layer gradually evolve with the transportation process. Based on the principle of mass conservation, the evolution of the solid concentration can be expressed as follows:
The evolution of the flow field distribution is expressed as follows:
where MR(y) is the mass proportion of particles at the y position in the transition layer to the total mass of activated particles in Δt, as shown in Figure 14. In conclusion, on the basis of solving Eqs. 64, 65 to obtain the slurry movement law in the transition layer, the variation law of fluid mass flow can be analyzed using the continuous Eq. 58.
Model Solving Process
The solution of the mass conservation equation of the transition layer fluid is directly related to the characteristics of the evolution of the property parameters and motion parameters of the slurry; therefore, the solution of Eq. 58 must be accompanied by the real-time solution of the flow field and solid concentration distributions of the transition layer. Equation 58 contains three unknowns: slurry density ρ, velocity v, and liquid phase shear force τl0, and Eq. 59 describes the decisive factors of τl0:
where Qs is the saturated mass flow rate:
TVP,
Equation 66 shows that the trend of the fluid mass flow rate in the transition layer is consistent with the trend of the solid-phase shear stress τs. The inflow of particles in the transition layer increases the mass flow rate, and the momentum exchange between the liquid and solid phases is more intense. However, it also leads to a decrease in the mass source term on the right side of Eq. 66 and a decrease in the liquid phase shear force τl, thus weakening the growth rate of the mass flow rate and the solid phase shear force τs. QS corresponds to the flow shear force τ, which describes the carrying capacity of solid particles of the transition layer from the perspective of mass exchange and momentum exchange, respectively, and the evolution of Q and τs describes the negative feedback mechanism of the mass change in the transition layer from the qualitative and quantitative perspectives, respectively.
Definite Conditions for Solution of Slurry Motion Parameters in the Transition Layer
① Slurry mass flow.
At the initial time of transportation, there are no particles in the transition layer; therefore, analogous to the velocity distribution of the boundary layer (White and Corfield, 2006), the initial conditions of mass flow in the transition layer are satisfied:
The change in the mass flow rate of the transition layer fluid at the inlet is equal to the mass of the particles flowing in time step Δt:
② Momentum distribution of particles.
The stress of the static particles in the sedimentary bed at the initial time satisfies the following requirements:
where G is the floating weight of the particles, mp is the weight of the particles, A is the cross-sectional area of the particles, CL is the lifting force coefficient, and CD is the drag force coefficient. The simultaneous Eqs 71, 72 show that the momentum of the particle swarm at the initial time satisfies the following equation:
Equation 73 shows that the momentum distribution of the particle swarm at the activating moment depends on the particle size distribution:
The momentum evolution of the particle swarm in the transportation is consistent with the following:
Definite Conditions of Slurry Physical Parameters
After injection, the particles move along the flow direction for a certain distance and then deposit to the bottom of the pipeline or open channel. The transport distances of particles with different particle sizes along the flow direction are different, and thus they deposit at different positions. It is assumed that the particle size distribution of the material can be ranked from large to small as
where Δi is the thickness of the sedimentary unit, xi and xi+1 are the horizontal transport distances of particles with adjacent particle sizes, wi is the width of the sedimentary unit, hi is the height of the sedimentary unit, Vi is the proportion of the volume of material particles with particle size (dp)i to the total volume of material, and θ is the accumulation angle, which is determined by laboratory experiments.
Laboratory Experiment of Hydraulic Transport
Laboratory experiments on slurry motion and changes in physical parameters during hydraulic transport were carried out. Based on the similarity criterion, a consistent relationship between the experimental parameters and engineering conditions was ensured, and the evolution law of the transition layer motion parameters and the change law of the sedimentary bed physical parameters were explored. Combined with the experimental measurement results and model calculation results, the rationality of this model was verified.
Experimental Device
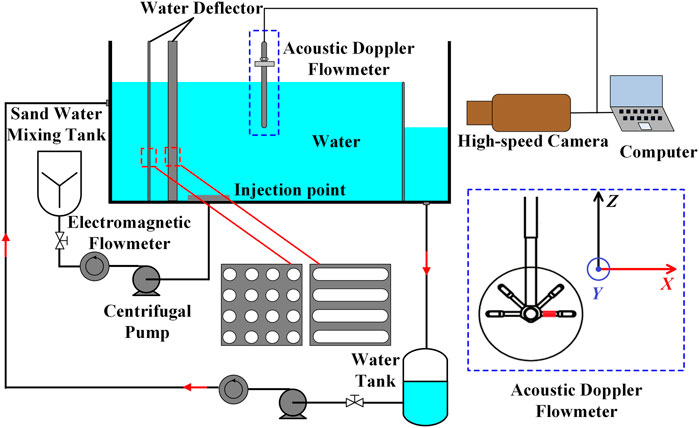
As shown in Figure 7, in this experiment, a centrifugal pump injected water into the plexiglass open channel through an injection pipeline to form a strong water flow. The particles flowed homogeneously through the sand–water mixing tank at the injection point, and the flow speed and direction stability were controlled through the rectifier plate and guide grid group to simulate the stable flow situation in the process of trough transportation accurately. An acoustic Doppler velocimeter was set up in the open channel to monitor the variation in velocity at different positions during transportation in real time. The acoustic doppler velocimeter measures the three-dimensional velocity of X, Y and Z. Y is perpendicular to the X direction, and X and Y are in the same plane, Z is vertical upward. The three directions comply with the right-hand rule. The four “legs” of the flow meter are data acquisition points in four different directions (x, y, z) at the measurement position to measure the flow velocity and direction at the corresponding position, in which the red rectangle represents the x-axis. The evolution of the sedimentary bed was observed by a high-speed camera in real time.
Experimental Parameters
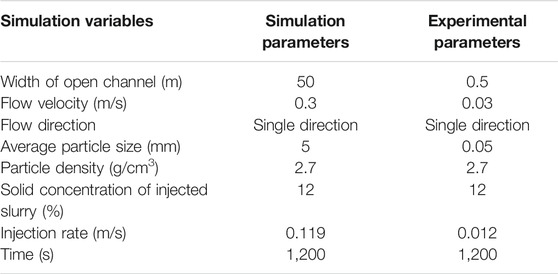
The scale of real hydraulic transportation is large, so it is impossible to restore the experimental simulation of transportation process 1:1 in the laboratory. Therefore, the hydraulic transport simulation experiment must be carried out through the appropriate similarity criterion. As mentioned above, in the process of hydraulic transport, whether in the macro evolution of the geometry of the sedimentary bed and the flow field in the transition layer, or in the micro collision and parabola movement of the particle swarm, the gravity is always the key factor affecting its motion form. Therefore, the Froude number similarity criterion is selected here. According to the Froude similarity criterion,
Where vm and vt represent the transport medium velocity under laboratory simulation conditions and real hydraulic conveying conditions respectively, m/s, lm and lt represent the scale size under laboratory experiment and real conditions respectively, m, gm and gt represent the gravitational acceleration under laboratory experiment and real conditions respectively. The parameters of the hydraulic transport simulation experiment were designed as Table 1.
Description of Experimental Phenomena
Observe the process from particle return to stopping upward return. At 1 min, there is basically no rock debris return. At 2 min, the particle concentration increases, and then returns stably. A sharp fan-shaped sedimentary bed is formed at the bottom of the flume along the ocean current direction. The deposition positions of particles with different particle sizes are different, and the geometric shape of the deposition unit formed by material particles with corresponding particle sizes is in accordance with Equation 76 (77).
Driven by the water flow, the material particles on the surface of the sedimentary bed begin to move and invade the transition layer against the resistance and resistance torque. The amount of invasion is controlled by Eq. 57. The moving particles climb over the upper surface of the paved sand layer after parabolic motion (50) (51) and collision motion (15). The sedimentary bed begins to evolve slowly as a whole, and the evolution law conforms to Eq. 58.
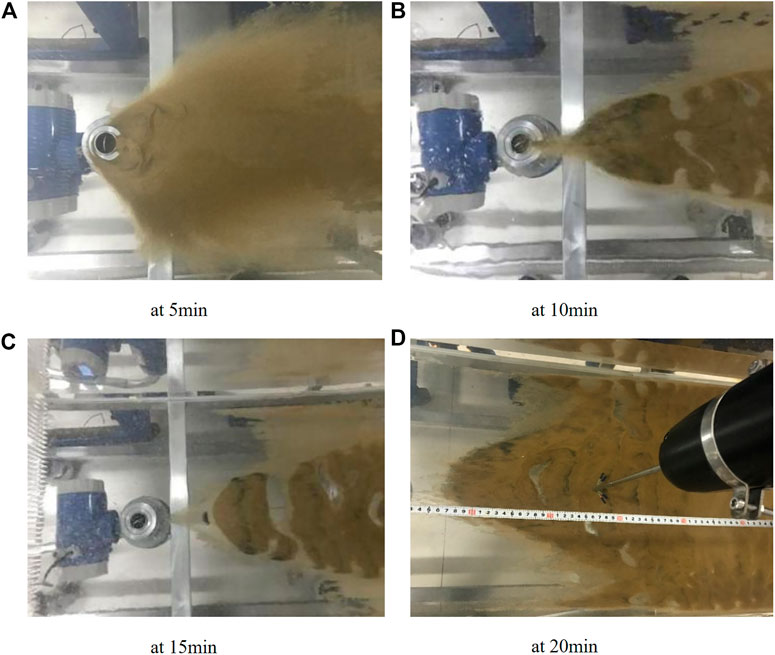
After 10 min of particle upward return process, all transported particles have entered the water tank. Keep the water velocity constant, observe the migration and deposition process of particles, and record the results every 5 min. In order to clearly observe the range of particle migration and deposition, the top view of the experimental process is shown in Figure 8.
When the particles stop returning, the sediment is in the shape of a sharp fan. Under the action of water flow, the tip of the sedimentary bed slowly disappears, the sand layer is a small sand dune along the width of the flume, and the sedimentary bed is accumulated in a horseshoe shape as a whole.
Comparative Analysis of Experimental Results and Model Calculation
Taking the simulation and experimental parameters listed in Table 1, the model calculation and experimental results are compared, as shown in Figure 9, where the color bar represents the height of the deposition bed. It can be observed that both of them show that the sedimentary bed presents, in general, a horseshoe-shaped accumulation, which indicates that the change in the morphological distribution of the sedimentary bed is affected by the transport of particles at the leading edge and the accumulation of particles at the tail, and the morphology evolution is that the particles in the front position are transported to the middle and rear positions of the sedimentary bed under the action of the liquid phase. It can be concluded that the intense parabolic and collision motions of the particles in the transition layer are accompanied by the synchronous evolution of the morphological distribution of the sedimentary bed, which ensures the continuity of particle transportation.
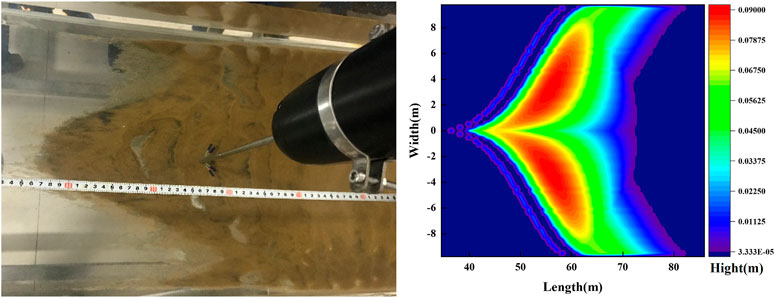
FIGURE 9. Comparison of experimental and model calculation results of sedimentary bed morphology distribution.
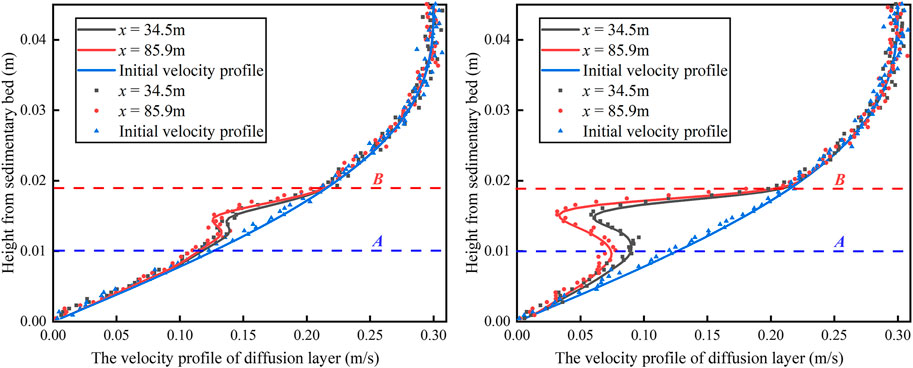
Table 2 presents the comparison between the experimental and model calculation data, and it can be observed that the maximum relative error is no more than 4%, which proves the rationality of the model. The velocity distribution of the transition layer is shown in Figure 10, where the continuous curve is the model calculation result of the velocity distribution in the transition layer, and the discrete points are the finite velocity points in the transition layer measured by acoustic Doppler velocimeter. It can be observed that the invasion of particles changes the original flow field distribution in the transition layer, and the change range of the velocity profile is different at different positions, but the influence area is mainly concentrated between positions A and B, which indicates that the particle transport is concentrated in this position. The continuous curve in Figure 10 represents the calculated data of the model, and the discrete points represent the measured data. It can be observed that the two have good consistency.

TABLE 2. Comparison of experimental data and model calculation data of sedimentary bed morphology distribution.
Analysis of Evolution of Slurry Property and Motion Parameters in Hydraulic Transportation
The upper limit of the velocity distribution in the transition layer is determined by the incoming velocity u, and the change in velocity distribution directly affects the distribution of flow shear force τ in the transition layer. Thus, the incoming velocity u represents the power of particle activation to a certain extent. According to Eq. 56, the particles invade the transition layer from the sedimentary bed when τl0> τt, and τt depends on the particle property parameters. In conclusion, the relationship between the flow motion parameters and the particle property parameters is the key factor affecting the particle motion state, which directly leads to a change in the particle invasion strength, determines the non-uniformity of fluid mass flow in the transition layer, and affects the evolution of the distribution of the sedimentary bed. In this section, based on the model, the characteristics of the evolution of slurry property and motion parameters in hydraulic transportation under different incoming flow velocities U and the distribution of particle size dp are simulated and calculated.
Characteristics of the Evolution of Slurry Property and Motion Parameters
Evolution of Flow Field and Solid Concentration in the Transition Layer
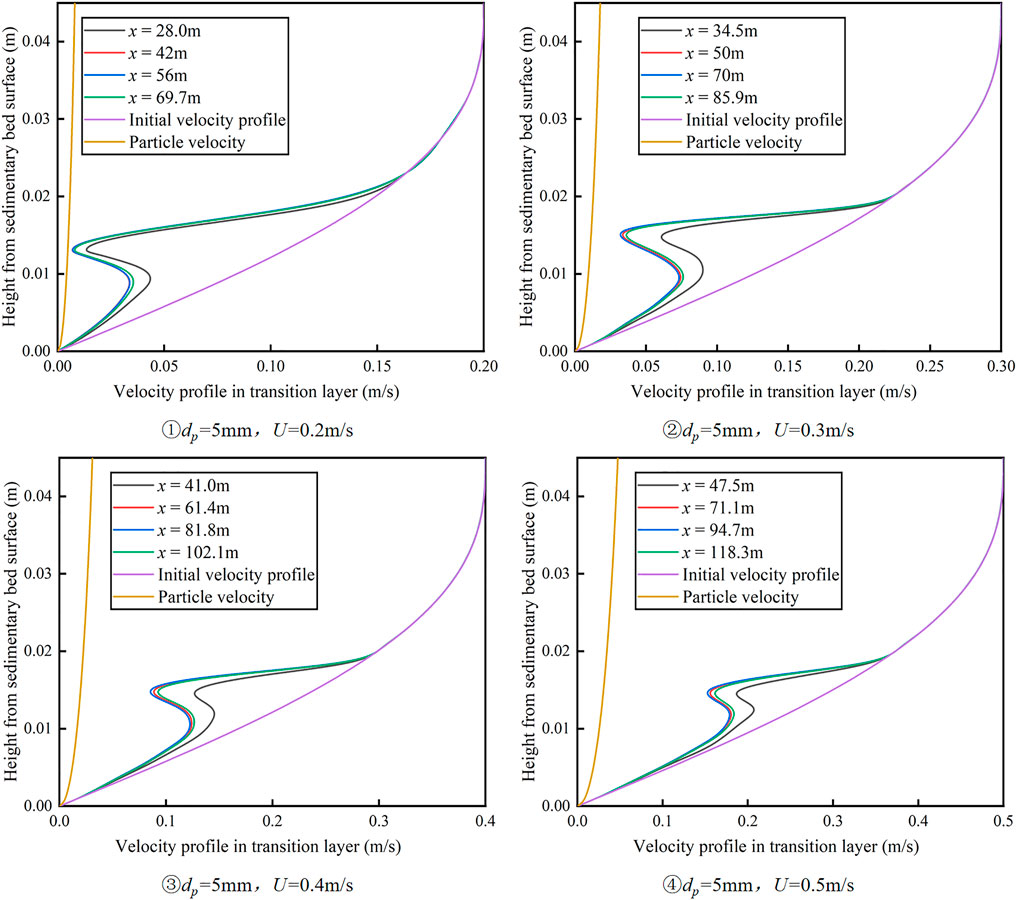
Pure water was used as the transport medium, flow velocity u = 0.3 m/s, particle density ρ = 2,751 kg/m3, and the particle size distribution satisfies the normal distribution dp ∼ N (5, 0.5), the total transportation volume is TTV = 75 m (Ihle et al., 2014). As can be observed, there is a difference in velocity distribution between the particle swarm and liquid phase during transportation, which tends to reduce the fluid velocity in the transition layer as a whole. The weakening range is related to the solid concentration at different positions on the sedimentary bed surface. The minimum value of the slurry velocity is obtained at position A in the figure, which corresponds to the maximum value of the solid concentration at this position. The solid content in the transition layer increases continuously during transportation, but the concentration distribution maintains the same change trend with time. This indicates that the transport of intrusive particles can reach the stationary state in a short time, and the velocity distribution has the same change response. The influence of particle motion on the flow field in the transition layer is limited to position B, which indicates that the range of particle motion is limited to the B position under the given flow motion parameters and solid property parameters.
Evolution of Mass Flux in the Transition Layer
According to the mass conservation Eq. 66, the variation in the mass flow rate in the transition layer depends on the transportation
Influence of Flow Velocity on Slurry Property and Motion Parameters
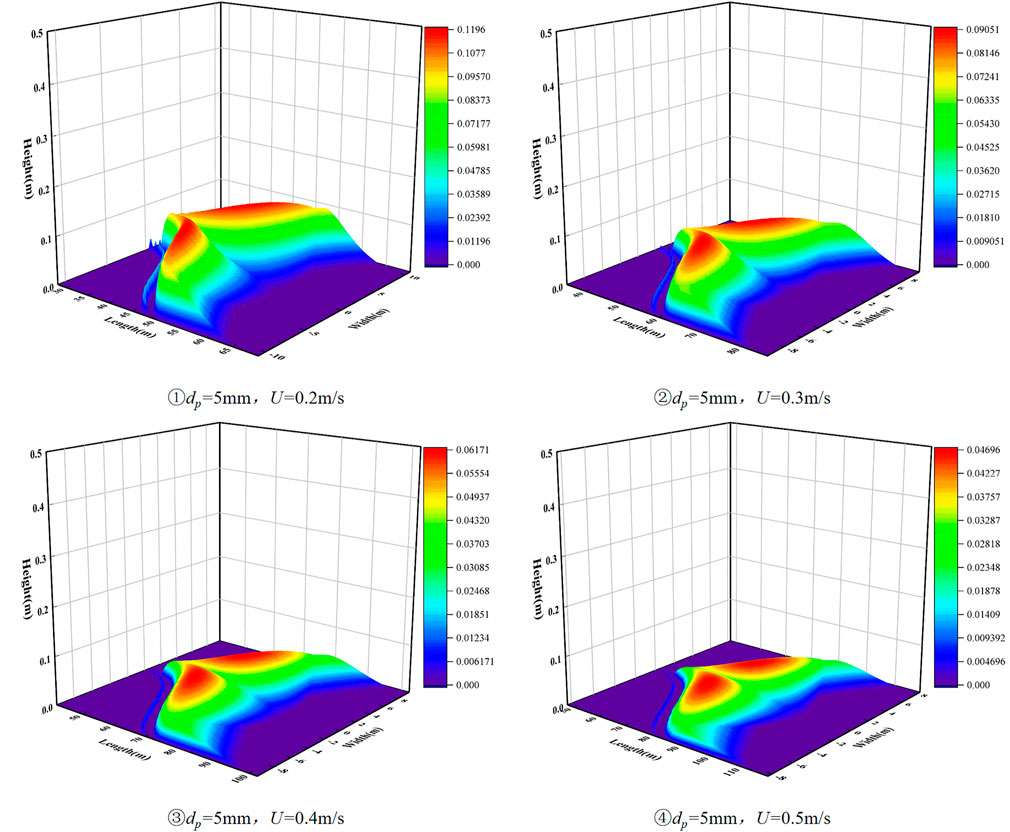
Figure 11 shows the evolution of the velocity distribution in the transition layer under different flow velocities. It can be observed that with the increase in flow velocity, the influence of particle invasion on the original velocity field gradually decreases, which indicates that the flow velocity can reflect the hydraulic energy of the transport medium to a certain extent. With the increase in flow velocity, the activation ability of the transition layer with respect to the particles in the sedimentary bed increases, and the thickness of the sedimentary bed decreases as a whole, which is consistent with the trend of the distribution of the sedimentary bed in Figure 12.
Influence of Particle Size Distribution on Property and Motion Parameters of Slurry
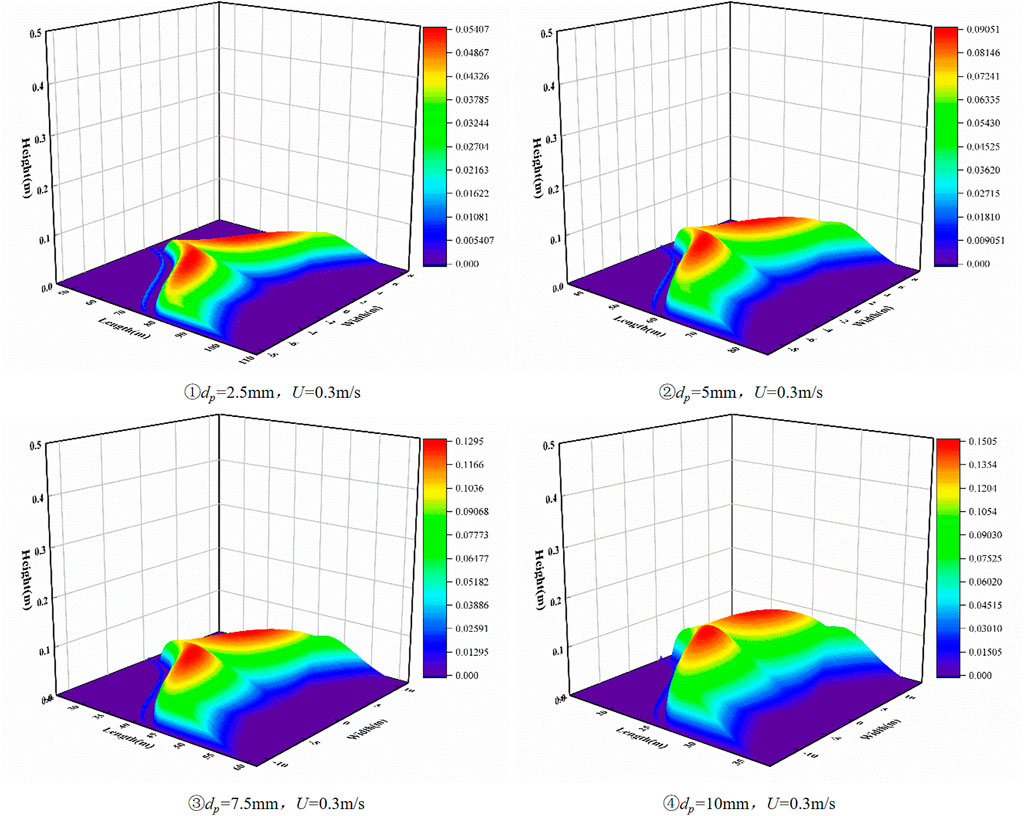
Figure 13 shows the evolution of the bed morphology distribution for different particle size distributions. As can be observed, the bed thickness increases with an increase in the average particle diameter. However, according to Figure 14, the velocity distribution of the transition layer does not respond to the change in particle size, which indicates that the morphological change of the sedimentary bed is simply caused by the change in the initial deposition position caused by the change in particle size distribution, and the change in particle size distribution has little effect on the transport of the transport medium.
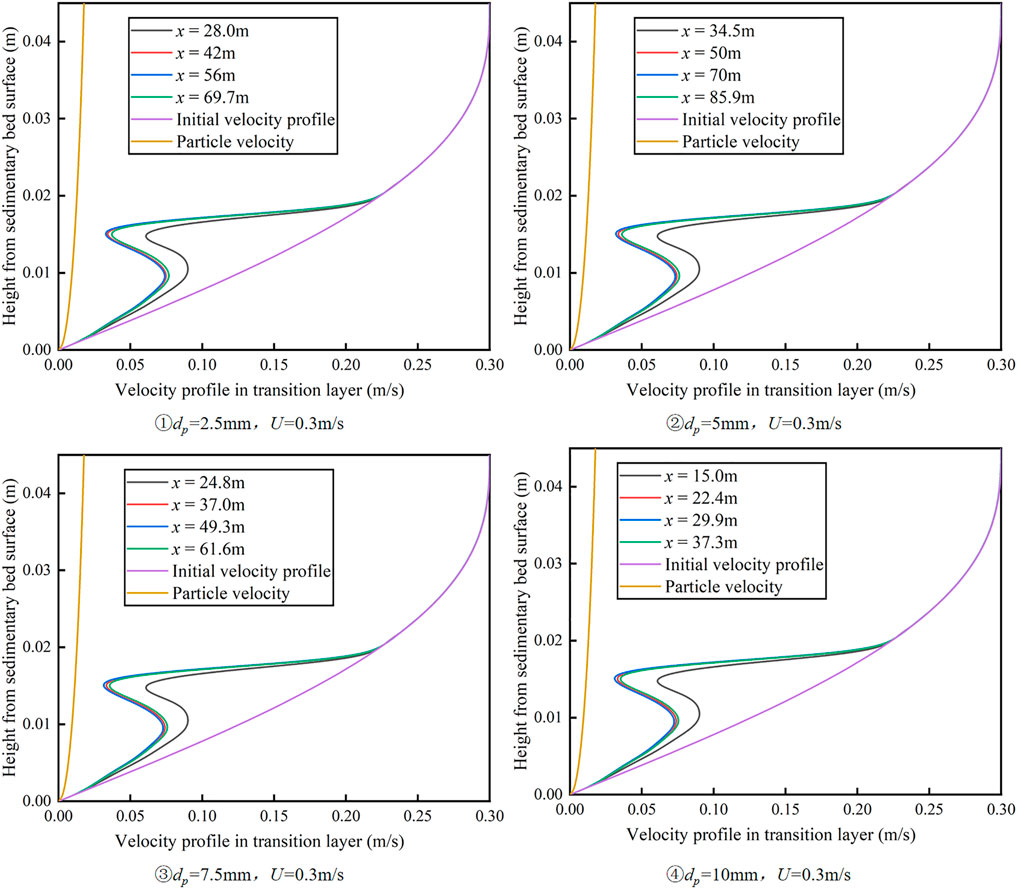
FIGURE 13. Variation of velocity distribution in the transition layer with particle size distribution.
Conclusion
1) Based on the analysis of the stress state of a single particle and the momentum distribution of the particle swarm, and considering the randomness and uncertainty of particle motion during transportation, a layered model of slurry hydraulic transportation suitable for transportation in pressure pipelines and open channels is established. Compared with the laboratory experiment data, the maximum error of the model calculation is less than 5%, which proves the rationality of the model calculation.
2) The movement of particles during transportation can be divided into two stages: parabolic motion and collision motion, and the momentum distribution of particles in the two stages converges to a stationary state with transportation.
3) The transition layer disturbs the stress state of the particles on the surface of the sedimentary bed, which leads to secondary transportation of particles. The particles intruding into the transition layer disturb the flow field in the transition layer, which causes the distribution of the deposit bed, and the flow field in the transition layer evolves gradually with transportation. The convergence of the particle swarm momentum ensures a stationary state in the evolution process.
4) The property and motion characteristics of the slurry during transportation were simulated and calculated using the proposed model. With an increase in the incoming flow velocity, the shape distribution of the sedimentary bed decreased as a whole, and the extent of disturbance of the flow field in the transition layer decreased as a whole, whereas with an increase in the particle size, the shape distribution of the sedimentary bed showed an overall expansion trend, and the extent of disturbance of the flow field in the transition layer remained basically unchanged.
Data Availability Statement
The original contributions presented in the study are included in the article/supplementary material, further inquiries can be directed to the corresponding author.
Author Contributions
ZZ provided the overall idea, SP designed the laboratory experiment, WL was responsible for data analysis, ST did image processing, and ZW and BS provided research funds.
Funding
The Special Project for Innovation for “Seventh Generation Ultra-Deepwater Drilling Platform ((2016) No. 24)” Supported by Ministry of Industry and Information Technology, and the Construction Project of Taishan Scholars have no grant numbers.
Conflict of Interest
The authors declare that the research was conducted in the absence of any commercial or financial relationships that could be construed as a potential conflict of interest.
Publisher’s Note
All claims expressed in this article are solely those of the authors and do not necessarily represent those of their affiliated organizations, or those of the publisher, the editors and the reviewers. Any product that may be evaluated in this article, or claim that may be made by its manufacturer, is not guaranteed or endorsed by the publisher.
References
Ahmed, R. (2001). Mathematical Modeling and Experimental Investigation of Solids and Cuttings Transport. Trondheim: Norwegian University of Science and Technology.
Anderson, R. S., and Haff, P. K. (1991). “Wind Modification and Bed Response during Saltation of Sand in Air,” in Aeolian Grain Transport (Vienna: Springer), 1, 21–51. doi:10.1007/978-3-7091-6706-9_2
Capecelatro, J., and Desjardins, O. (2013). Eulerian-Lagrangian Modeling of Turbulent Liquid-Solid Slurries in Horizontal Pipes. Int. J. multiphase flow 55, 64–79. doi:10.1016/j.ijmultiphaseflow.2013.04.006
Cho, H., Shah, S. N., and Osisanya, S. O. (2002). A Three-Segment Hydraulic Model for Cuttings Transport in Coiled Tubing Horizontal and Deviated Drilling. J. Can. Pet. Tech. 41 (06). doi:10.2118/02-06-03
Cuisinier, O., Auriol, J.-C., Le Borgne, T., and Deneele, D. (2011). Microstructure and Hydraulic Conductivity of a Compacted Lime-Treated Soil. Eng. Geology. 123 (3), 187–193. doi:10.1016/j.enggeo.2011.07.010
Doron, P., and Barnea, D. (1993). A Three-Layer Model for Solid-Liquid Flow in Horizontal Pipes. Int. J. Multiphase Flow 19 (6), 1029–1043. doi:10.1016/0301-9322(93)90076-7
Einstein, A. (1906). Eine neue Bestimmung der Moleküldimensionen. Ann. Phys. 324 (2), 289–306. doi:10.1002/andp.19063240204
Gillies, R. G., Shook, C. A., and Xu, J. (2004). Modelling Heterogeneous Slurry Flows at High Velocities. Can. J. Chem. Eng. 82 (5), 1060–1065.
Guo, X. L., Wang, Z. M., and Long, Z. H. (2010). Study on Three-Layer Unsteady Model of Cuttings Transport for Extended-Reach Well. J. Pet. Sci. Eng. 73 (1-2), 171–180. doi:10.1016/j.petrol.2010.05.020
Hunt, J. N. (1954). The Turbulent Transport of Suspended Sediment in Open Channels. Proc. R. Soc. Lond. A. 224 (1158), 322–335. doi:10.1098/rspa.1954.0161
Ihle, C. F., Tamburrino, A., and Montserrat, S. (2014). Identifying the Relative Importance of Energy and Water Costs in Hydraulic Transport Systems through a Combined Physics- and Cost-Based Indicator. J. Clean. Prod. 84, 589–596. doi:10.1016/j.jclepro.2013.11.070
Karabelas, A. J. (1977). Vertical Distribution of Dilute Suspensions in Turbulent Pipe Flow. Aiche J. 23 (4), 426–434. doi:10.1002/aic.690230404
Kaushal, D. R., Seshadri, V., and Singh, S. N. (2002). Prediction of Concentration and Particle Size Distribution in the Flow of Multi-Sized Particulate Slurry through Rectangular Duct. Appl. Math. Model. 26 (10), 941–952. doi:10.1016/s0307-904x(02)00054-9
Kaushal, D. R., and Tomita, Y. (2003). Comparative Study of Pressure Drop in Multisized Particulate Slurry Flow through Pipe and Rectangular Duct. Int. J. Multiphase Flow 29 (9), 1473–1487. doi:10.1016/s0301-9322(03)00125-3
Kaushal, D. R., and Tomita, Y. (2002). Solids Concentration Profiles and Pressure Drop in Pipeline Flow of Multisized Particulate Slurries. Int. J. multiphase flow 28 (10), 1697–1717. doi:10.1016/s0301-9322(02)00047-2
Kempe, T., Vowinckel, B., and Fröhlich, J. (2014). On the Relevance of Collision Modeling for Interface-Resolving Simulations of Sediment Transport in Open Channel Flow. Int. J. multiphase flow 58, 214–235. doi:10.1016/j.ijmultiphaseflow.2013.09.008
Levy, A., and Mason, D. J. (2000). Two-layer Model for Non-suspension Gas-Solids Flow in Pipes. Powder Technol. 112 (3), 256–262. doi:10.1016/s0032-5910(00)00300-4
Matousek, V. (2002). Pressure Drops and Flow Patterns in Sand-Mixture Pipes. Exp. Therm. Fluid Sci. 26 (6-7), 693–702. doi:10.1016/s0894-1777(02)00176-0
Muddle, D. M., and Briggs, K. M. (2019). Macropore Structure and Permeability of clay Fill Samples from a Historic clay Fill Earthwork. Transportation Geotechnics 19, 96–109. doi:10.1016/j.trgeo.2019.02.003
Nguyen, D., and Rahman, S. S. (1996). “A Three-Layer Hydraulic Program for Effective Cuttings Transport and Hole Cleaning in Highly Deviated and Horizontal wells,” in SPE/IADC Asia Pacific Drilling Technology (Kuala Lumpur, Malaysia: Society of Petroleum Engineers). doi:10.2118/36383-ms
Orell, A. (2007). The Effect of Gas Injection on the Hydraulic Transport of Slurries in Horizontal Pipes. Chem. Eng. Sci. 62 (23), 6659–6676. doi:10.1016/j.ces.2007.07.067
Owen, P. R. (1964). Saltation of Uniform Grains in Air. J. Fluid Mech. 20 (2), 225–242. doi:10.1017/s0022112064001173
Pati, S., Mehta, S. K., and Borah, A. (2017). Numerical Investigation of Thermo-Hydraulic Transport Characteristics in Wavy Channels: Comparison between raccoon and Serpentine Channels. Int. Commun. Heat Mass Transfer 88, 171–176. doi:10.1016/j.icheatmasstransfer.2017.09.001
Patterson, L. A., and Maloney, K. O. (2016). Transport of Hydraulic Fracturing Waste from Pennsylvania wells: A County-Level Analysis of Road Use and Associated Road Repair Costs. J. Environ. Manag. 181, 353–362. doi:10.1016/j.jenvman.2016.06.048
Pullum, L., Boger, D. V., and Sofra, F. (2018). Hydraulic mineral Waste Transport and Storage. Annu. Rev. Fluid Mech. 50, 157–185. doi:10.1146/annurev-fluid-122316-045027
Ravelet, F., Bakir, F., Khelladi, S., and Rey, R. (2013). Experimental Study of Hydraulic Transport of Large Particles in Horizontal Pipes. Exp. Therm. Fluid Sci. 45 (2), 187–197. doi:10.1016/j.expthermflusci.2012.11.003
Roco, M. C., and Balakrishnam, N. (1985). Multi‐Dimensional Flow Analysis of Solid‐Liquid Mixtures. J. Rheology 29 (4), 431–456. doi:10.1122/1.549819
Sauermann, G., Kroy, K., and Herrmann, H. J. (2001). Continuum Saltation Model for Sand Dunes. Phys. Rev. E Stat. Nonlin Soft Matter Phys. 64 (3), 031305. doi:10.1103/PhysRevE.64.031305
Stanić, F., Jaćimović, N., Ranđelović, A., and Despotović, J. (2017). Laboratory Investigation of Hydraulic Characteristics of Fly Ash as a Fill Material from the Aspects of Pollutant Transport. Water Sci. Technol. 76 (4), 976–982. doi:10.2166/wst.2017.243
Syamlal, M., and O’Brien, T. J. (1987). The Derivation of a Drag Coefficient Formula from Velocity-Voidage Correlations. NETL, Morgantown, WV: Technical Note, US Department of energy, Office of Fossil Energy.
Wilson, K. C. (1987). Analysis of Bed‐Load Motion at High Shear Stress. J. Hydraulic Eng. 113 (1), 97–103. doi:10.1061/(asce)0733-9429(1987)113:1(97)
Xie, Y., Jiang, J., Tufa, K. Y., and Yick, S. (2015). Wear Resistance of Materials Used for Slurry Transport. Wear 332-333, 1104–1110. doi:10.1016/j.wear.2015.01.005
You, L., and Liu, H. (2002). A Two-phase Flow and Transport Model for the Cathode of PEM Fuel Cells. Int. J. Heat mass transfer 45 (11), 2277–2287. doi:10.1016/s0017-9310(01)00322-2
Yu, M.-h., Wei, H.-y., and Wu, S.-b. (2015). Experimental Study on the Bank Erosion and Interaction with Near-Bank Bed Evolution Due to Fluvial Hydraulic Force. Int. J. Sediment Res. 30 (1), 81–89. doi:10.1016/s1001-6279(15)60009-9
Keywords: Solid hydraulic transport, spatio-temporal evolution model, unsteady and heterogeneous flow, liquid-solid two-phase flow, randomness and uncertainty
Citation: Zhang Z, Sun B, Wang Z, Pan S, Lou W and Tong S (2021) Spatio-Temporal Evolution Model of the Hydraulic Transport Characteristics of Particulate Solids. Front. Earth Sci. 9:752548. doi: 10.3389/feart.2021.752548
Received: 03 August 2021; Accepted: 15 September 2021;
Published: 28 September 2021.
Edited by:
Jean-louis Vigneresse, Université de Lorraine, FranceReviewed by:
Florent Ravelet, Arts et Metiers Institute of Technology, FranceArvind Kumar, YMCA University of Science and Technology, India
Copyright © 2021 Zhang, Sun, Wang, Pan, Lou and Tong. This is an open-access article distributed under the terms of the Creative Commons Attribution License (CC BY). The use, distribution or reproduction in other forums is permitted, provided the original author(s) and the copyright owner(s) are credited and that the original publication in this journal is cited, in accordance with accepted academic practice. No use, distribution or reproduction is permitted which does not comply with these terms.
*Correspondence: Zhiyuan Wang, d2FuZ3p5MTIwOUAxMjYuY29t
 Zhi Zhang
 Baojiang Sun
 Zhiyuan Wang