 Qingbin Fan
- 1Key Laboratory of Desert and Desertification, Northwest Institute of Eco-Environment and Resources, Chinese Academy of Sciences, Lanzhou, China
- 2University of Chinese Academy of Sciences, Beijing, China
- 3College of Forestry, Nanjing Forestry University, Nanjing, China
- 4College of Geography and Environmental Sciences, Zhejiang Normal University, Jinhua, China
The “Old Red Sand” (ORS) along the southeast coast of China is of significant paleoclimatic and paleoenvironmental significance. However, its provenance remains controversial. In this study, grain size characteristics and quartz grain surface microtextures were analyzed to study the origin and paleoenvironmental significance of the ORS, the results show that the grain size of the ORS show typical aeolian features, the quartz grain surface microtextures of the ORS show both aeolian features and subaqueous environments characteristics. Combined with the latest OSL dating data, we suggest that the ORS was coastal aeolian sand dunes developed since the last interglacial period. The formation of the ORS was restricted jointly by climate changes of the coastal area and the distance from the shoreline that resulted from sea level changes.
Introduction
Coastal dunes are common around the world and resulted from complex interactions related to prevailing winds, sand supply, climate changes and sea level fluctuations (Blumer et al., 2012). Red dunes are widespread in south Asia and east Asia, including Sri Lanka, India and the southeast coast of China, etc (Alappat et al., 2013). The “Old Red Sand” (ORS) refers to a Quaternary sediment of semi-cemented medium fine sand, mainly in red or brown red, and intermittently distributed along the southeast coast of China, its thickness can reach several meters to tens of meters (Wu et al., 1995; Zeng et al., 1999a; Li et al., 2012; Jin et al., 2018). The coastal area, as a special zone of interaction among lithosphere, hydrosphere and atmosphere, is very sensitive to climate and environment changes. The development of large areas of coastal dunes reflects the complex interaction among land, ocean and atmosphere, therefore, the origin and paleoenvironmental significance of the ORS is crucial for studying coastal climate and environment evolution along the southeast coast of China.
The large areas of red dunes had aroused great interests of geographers and geologists since the 1960s, researchers have done a lot of work on the ORS, however, there are still controversies on its origin nowadays. Firstly some researchers believed that the ORS belong to a marine deposit originated from beach sand in high sea level periods (Zeng and Huang, 1964; Zeng et al., 1999a; Li et al., 2012), while others considered it as a aeolian deposit derived from the exposed continental shelf plain in low sea level stages during glacial periods (Wu et al., 1995; Fangen et al., 2012; Jin et al., 2017). Different views on the origin of the ORS lead to contrasting environmental interpretations. The former interpretation implies that the development of the ORS resulted from more sand supply brought by rivers during high sea level stages in interglacial period (Zeng et al., 1999a; Li et al., 2012). The latter view indicates low sea level conditions and an intensified East Asian winter monsoon. Therefore, identification the origin and paleoenvironmental significance of the ORS is helpful for studying regional climate and environment evolution along the southeast coast of China.
With regard to its chronology, firstly it is reported that the ORS was developed in Würm Glaciation (the last glacial period), and there are mainly two views on its chronology. One view holds that the ORS was formed in 50–40 and 20–10 Ka BP (Zhu et al., 1981; Wu and Wu, 1987); the other view believes that the ORS was formed in 60–40, 35–25, and 20–10 Ka BP (Feng et al., 1988; Wu and Wang, 2001), among which 60–40 Ka BP is the earliest period, and 20–10 Ka BP is the latest period of the ORS. Researchers believe that during the last glacial period, with global cooling, the sea level declined, the intensified East Asian winter monsoon provided enough power to transport the loose sand materials on the exposed continental shelf plain and deposit along the coast, which were stained red by a later strong weathering after deposition (Zhu et al., 1981; Wu and Wu, 1987; Feng et al., 1988; Wu and Wang, 2001).
In 2007, a new method of Optically Stimulated Luminescence (OSL) dating was applied to determine the chronology of the ORS, which promoted the study of the geochronology of the ORS to a new stage. OSL dating for the ORS in Jinjiang, Fujian Province show that the ORS was formed earlier than 77 Ka BP (Zhang et al., 2007), indicating that the ORS could be formed in the last interglacial period, which broke the upper limit of the ORS dating results reported (not earlier than 60 Ka BP). Subsequently by OSL dating, Jin Jianhui suggests that the ORS in Qingfeng, Fujian Province was formed in 110–33 Ka BP (Jin et al., 2017), Yu Mingtong suggests that the four layers of the ORS in Qingfeng, Pingtan island were formed in 122.5, 97.7, 83.1 and 61.9 Ka BP respectively (Yu et al., 2014). Hu Fangen suggests that the ORS in Jinjiang of Fujian Province was formed in 6 stages: 125–115, 105–97, 84–74, 61.5–52.0, 39–29 and 15–9 Ka BP respectively (Fangen et al., 2012), indicating that the ORS was formed since the last interglacial period, which promoted the study of the ORS to a new stage, that is, the ORS developed in both the last interglacial period and the last glacial period, but not occur in the LGM.
Materials and Methods
The Study Area
Pingtan island (25°23′N–25°40′N, 119°41′E–119°52′E) (Figure 1), the most widely distributed area for the ORS (Figure 2), is located in the east coast of Fujian Province, adjacent to Taiwan Strait in the east and Pingtan Strait to the west, with an area of 278.61 km2 (Figure 1). Aiming at the most controversial issue in study of the ORS, we take Qingfeng (QF) ORS profile on the coastal platform in the northeast corner of Pingtan island as an example. QF profile (25°36′46.7″N, 119°48′19.6″E) (Figure 1), a complete, thick and continuously deposited ORS profile, with an altitude of 48 m, a thickness of 13.94 m, according to its sedimentary characteristics (Table 1), the QF profile was divided into 7 layers (Table 1), A total of 70 samples were collected from bottom to top at equal intervals of 20 cm. Its grain size characteristics and quartz grain surface microtextures were analyzed, coupled with the latest dating results, the origin and environmental significance of the ORS were interpreted. Our results could provide further data for us to have a scientific understanding of the ORS and to support paleoenvironment reconstruction of southeast coast China.
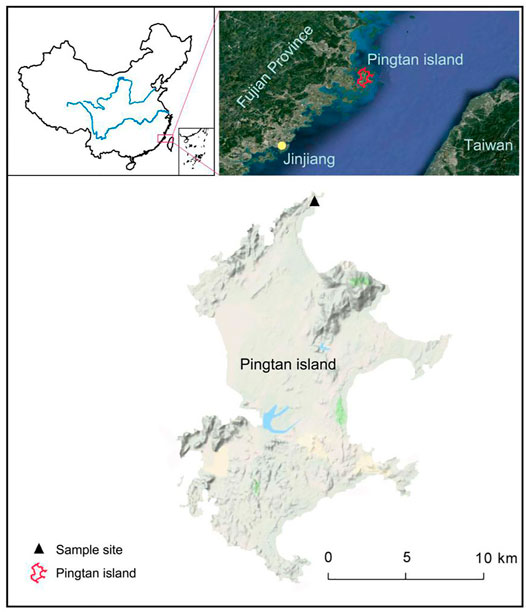
FIGURE 1. Sample site of QF profile in Pingtan island, Fujian Province.
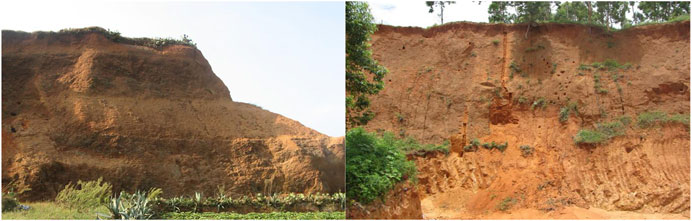
FIGURE 2. The Old Red Sand in Pingtan island, Fujian Province.
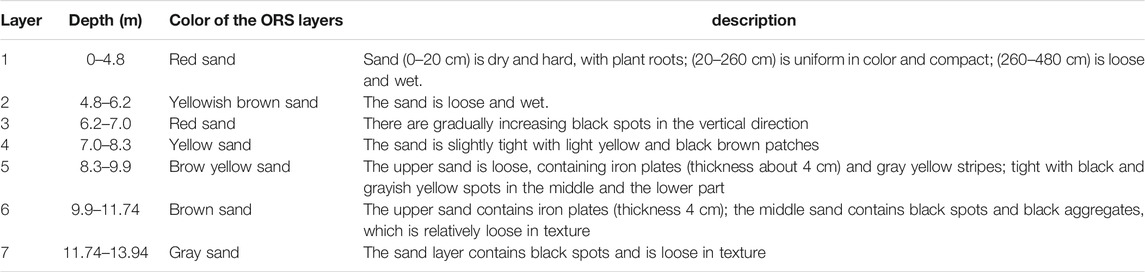
TABLE 1. Stratigraphic description of QF profile.
Methods
Grain Size
Grain size characteristics of sediments are mainly controlled by the transportation mode and sedimentary environment. Therefore, grain size analysis is often used to identify sedimentation process and depositional environment (Yang et al., 2017; Purtill et al., 2019). The classification scheme used in this study is: Clay (0–4 μm), silt (4–63 μm), very fine sand (63–125 μm), fine sand (125–250 μm), medium sand (250–500 μm), coarse sand (500–1,000 μm) and extremely coarse sand (1,000–2,000 μm). The commonly used grain size parameters include average grain size (Mz), standard deviation (Sd), skewness (Sk) and kurtosis (Kg). The mathematical calculation formula of particle size parameters is as follows (Folk and Ward, 1957; Yang et al., 2017):
Grain size analysis was carried out at the geographic process laboratory, Zhejiang Normal University, using a Mastersizer 2000 laser grain size analyzer (Malvern, United Kingdom) with a measurement range of 0.01–2000 µm and an error of <2%. Samples for grain size analysis were pre-treated as follows. Samples were first boiled with 10% H2O2 and 10% HCl to remove the organic matter and carbonate, respectively. Next, 0.5 mol/L (NaPO3)6 was added as a dispersant, then the pretreated samples were ultrasonicated for 15 min before being analyzed.
Fisher linear discriminant analysis (FLDA), a common classification method in multivariate statistical analysis, is widely used to identify the origin of various sediments (Yang et al., 2017). In this study, we use FLDA to identify the origin of the ORS based on statistical analysis of hydraulic deposit (HD) and aeolian deposit (AD) grain size parameters. The function we created is as follows. y = −1.138*Mz + 1.58*Sd − 0.781*Sk + 0.805*Kg, the threshold level is −4.5744 (if y > −4.5744, it belongs to AD; if y < −4.5744, it belongs to HD) (Yang et al., 2017).
In this study, we selected a typical aeolian loess profile of Zeketai (ZKT) profile in Xinjiang provenance, which is considered as the provenance for the loess on the Chinese Loess Plateau (CLP) (Liu, 1985; Yang et al., 2014). We also selected Luochuan (LC) loess profile which was located on the central CLP, as well as Nantong (NT) profile (floodplain deposit) in the lower reaches of the Yangtze River. To test the linear discriminant function created above, 215 aeolian loess samples of ZKT profile and 33 typical floodplain deposits samples from NT profile were inputted into statistical software (SPSS) as AD and HD training sets respectively. All the significance probability values of the variable group mean are <0.001 (Table 2). Therefore, the four variables in this discriminant analysis are all effective.
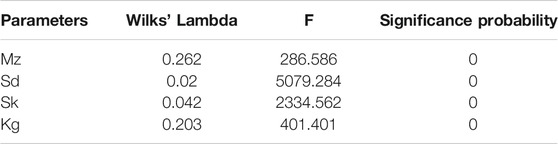
TABLE 2. Equality test of group means.
The Box’s M test assesses the assumption of homogeneity of covariance matrices. This test is very sensitive to meet the assumption of multivariate normality. The statistical value of Box’s M is 738.71 (Table 3), far >0.05. Therefore, each of the covariance matrices can be considered equal. The significance probability of the F-test is 0.000, <0.05, indicating that the error judgment rate is minimal.

TABLE 3. Box's M test results of equality covariance matrixes.
In order to verify the reliability of this model, sediment grain size parameters (Mz, Sd, Sk, and Kg) of 215 loess samples from ZKT profile, 33 floodplain deposit samples from NT profile, and 57 typical aeolian loess samples from LC profile were computed using the function. As shown in Table 4, all the aeolian loess samples from ZKT profile and LC profile were identified as AD, resulting in an accuracy of 100%. All the floodplain deposit samples from NT profile were identified as HD. Hence, the discriminant model is reliable.

TABLE 4. The verification of the discriminant function.
Quartz Grain Surface Microtextures
Quartz grains have high hardness, stable chemical properties and strong weathering resistance, leading to a variety of microtextures that are well preserved on the quartz grains. These microtextures are considered to record the sedimentary history of quartz grains, including the parent rock, transportation process, and sedimentary environment. Therefore, many researchers have stated that quartz grain surface microtextures can be used to identify sedimentary environments (Liu, 1985; Pye, 1995; Helland et al., 1997; Mahaney and Kalm, 2000; Mahaney, 2002; Guo et al., 2002; Costa et al., 2012; Costa et al., 2013; Mahaney et al., 2014; Smith, et al., 2018; Chen et al., 2019; Li et al., 2021). It is suggested that dish-shaped depressions, crescentic depressions, pockmarked surfaces, upturned plates, meandering ridges are considered as typical features of aeolian quartz grains (Ying and Deonarine, 1985; Guo et al., 2002; Krinsley and Doornkamp, 2011; Costa et al., 2012; Costa et al., 2013). For example, dish-shaped depressions often develop in aeolian environments with high energies where quartz grains collide with each other, and densely distributed pockmarks result from collision with other grains during wind transportation, forming pockmarked surfaces. Meandering ridges mainly occur in aeolian environments as well (Costa et al., 2012; Costa et al., 2013; Mahaney, et al., 2014). On the other hand, conchoidal fractures, V-shaped cracks, polished surfaces, flat cleavage surfaces, parallel striations, grooves (straight or curved) are regarded as typical features of quartz grains from subaqueous environments (Ying and Deonarine, 1985; Mahaney et al., 2001; Guo et al., 2002; Mahaney et al., 2014; Vos et al., 2014). V-shaped cracks, which are triangular in shape and non-oriented, are likely to be caused by grain-to-grain collisions in subaqueous environments, parallel striations result from grain-to-grain scratches in subaqueous environments (Ying and Deonarine, 1985; Mahaney, 2002; Vos et al., 2014). Mahaney (2002) concluded that the feature which is the most common in subaqueous environments are V-shaped cracks. Here, 10 quartz grains were randomly selected in each sample of QF profile, and a total of 700 quartz grains were selected for Scanning Electron Microscope (SEM) observations.
Quartz grain surface textures were observed under an S-4800 high-resolution field emission scanning electron microscope (SEM) produced by Hitachi (Japan) at the Institute of Physical Chemistry, Zhejiang Normal University. The extraction method for quartz sand before SEM observation was as follows:
(1) To remove free iron, the dried sample was placed in centrifuge tube with sodium dithionite, sodium citrate (0.3 mol/L) and sodium bicarbonate solution (1 mol/L) and heated in a water bath. The solution was then separated by centrifuge until clear.
(2) The quartz minerals were separated and purified by the potassium pyrosulfate melting-fluorosilicic acid immersion method. After removing the free iron, the samples were mixed with potassium pyrosulfate powder and heated in a muffle furnace for 1 h (initial temperature 350°C, then 650°C from 20 min to the end). The heated samples were transferred to a beaker, and HCL solution (l:3) was added to the heating plate to dissolve the frit. After separation by centrifuge, the samples were dried in the oven. The samples were then soaked in fluorosilicic acid for 3 days. The solution was centrifuged and the clear liquid was removed three days later. The residue was dried, and the quartz grains with highest purity were extracted.
Results
Grain Size Characteristics
The grain size characteristics of QF profile are as follows: the sand content ranges from 45.99 to 90.77% (mean 73.23%), the silt content varies from 6.25 to 34.18% (mean 17.34%), and the clay content ranges from 2.97 to 19.83% (mean 9.43%). The sand content is the first dominant grain size in QF profile, constituting the highest composition (Tab.5). In QF profile: (1) medium sand, fine sand and silt account for 30.17, 26.23 and 17.34% respectively; (2) coarse sand and clay are the second, with an average of 9.86 and 9.43%; (3) the content of extremely coarse sand is the least, with an average content of 0.97%. Whereas the beach sand in Pingtan island is mainly composed of medium sand, fine sand and coarse sand, with average contents of 48, 32.18, and 17.68% respectively, and almost without silt or clay (Zhang and Ming-Tong, 2014). Although beach sand is mainly composed of medium sand and fine sand, its contents of coarse sand and gravel is significantly higher than those in the ORS; in addition, the ORS contains more fine materials such as silt and clay, while beach sand has little silt or clay. Shepard believes that the difference in clay content is one of the most significant differences between beach sand and aeolian sand (Shepard and Young, 1961). Wave disturbance makes the fine materials such as silt and clay in a suspension state, which are carried to the open sea by waves instead of depositing on the beach, while wind can transport and deposit these fine materials (Shepard and Young, 1961). According to Whalley’s wind erosion quartz test, a small amount of fine materials such as silt and clay can be produced during the saltation process of sand grains transported by wind (Pye, 1983). The QF ORS profile contains more fine-grained materials, which is likely to be related to transport process of wind and the strong chemical weathering in a warm–humid subtropical monsoon climate after deposition.
TABLE 5. Grain size composition and Grain size parameters of QF profile.
The average grain size (Mz) of samples from QF profile varies 2.45−4.76φ (mean 3.38φ) (Table 5). Whereas the average grain size (Mz) of beach sand in coast of Fujian Province is 1.26–2.08φ (mean 1.76φ) (Zeng et al., 1999a). The sorting coefficient (Sd) ranges from 1.97 to 3.23 (mean 2.94φ), indicating a poor sorting. It is suggested that aeolian sand has a good sorting, while the sorting of modern coastal aeolian sand and beach sand are better than that of the ORS, this may be related to the chemical weathering in a warm–humid subtropical monsoon climate after deposition, which greatly increased the content of fine materials such as silt and clay; The skewness (Sk) varies from 2.34 to 0.25 (mean 1.12), Most of the samples show positive skewness, analogous to aeolian sand, while beach sand mostly show negative skewness (Zeng et al., 1999b). The kurtosis (Kg) ranges from 1.69 to 4.75 (mean 3.05), most samples are sharply peaked, analogous to aeolian sand, while beach sand mostly are medium to narrow peaked, without very narrow peaks (Zeng et al., 1999b). The grain-size frequency curve (Figure 3A) of QF profile is characterized by a single peak, a positive skewness and a long tail, which is very similar to that of a typical paleo-aeolian dune in Zhoushan (ZS) island, indicating QF profile a aeolian sand dune. The modal grain size is located near 2.5φ, and there is a small bulge from 4 to 12φ, indicating that the QF profile contains a certain amount of fine materials, namely silt and clay component, suggest an aeolian transportation and a strong chemical weathering process after deposition.
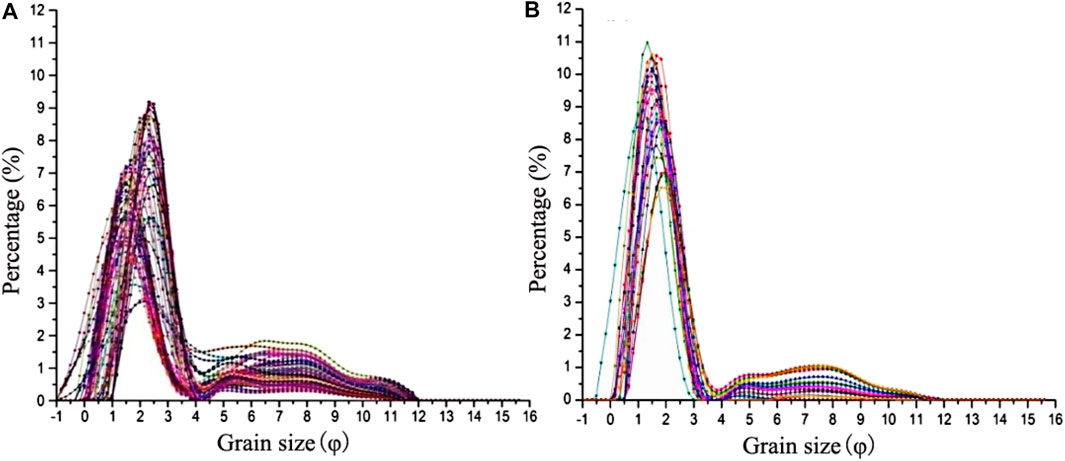
FIGURE 3. The grain-size frequency curve of QF profile (A) and ZS profile (B).
Seventy samples from QF profile were computed using the function, as shown in Table 6, all the ORS samples from QF profile were identified as AD, and all the floodplain deposit samples from NT profile were identified as HD. Therefore, the QF ORS profile is considered as an aeolian sediment.

TABLE 6. The identification result of the QF profile.
Quartz Grain Surface Microtextures of QF Profile
SEM observations show that most quartz grains in QF profile are characterized by subrounded (57%) outlines (Figure 4; Figure 5; Figure 6), with a certain number of angular particles (10%) and round particles (16%) (Figure 6). Mechanically produced features in QF profile are abundant and varied, suggest that the quartz grains have experienced a range of external forces. Characteristics typical of aeolian quartz grains in QF profile are common (Figures 4B–F), for example dish-shaped depressions (Figures 4C,D) and crescentic depressions (Figure 4E) have occurrence rates of 72% (Figure 6) and 65% (Figure 6), respectively. Other aeolian features such as upturned plates and meandering ridges also occur on the grains, as well as pockmarks, formed pockmarked surfaces (Figure 4F), indicating obvious surface erosion during wind transportation. Meanwhile, many subaqueous features are also observed in QF quartz grains: for example, V-shaped cracks (Figures 5B,C), triangle cracks (Figure 5D), conchoidal fractures (Figure 5A), underwater polished surfaces (Figure 5C), grooves (Figures 5A,D), parallel striations caused by scratch (Figure 5A) in subaqueous environments. V-shaped cracks, the most representative feature produced by grain-to-grain collisions in subaqueous environments (Mahaney, 2002; Krinsley and Doornkamp, 2011), reach an occurrence rate of 56% in QF ORS profile (Figure 6), indicating a subaqueous environment. A majority of quartz grains with abundant mechanical V-shaped cracks as well as parallel striations caused by scratches demonstrated that QF quartz grains have undergone a high-energy subaqueous transport. Some grains have surface microtextures typical of a subaqueous environment, on which dish-shaped depressions and pockmarked surfaces are superimposed: this combination suggests the quartz grains were abraded in a fluvial environment before undergoing aeolian transportation. In addition, the quartz grains in QF profile exhibit silica dissolution and silica precipitation textures indicative of chemical weathering as well. Silica dissolution mainly comprise oriented etch pits, solution pits and crevasses (Figure 5E). Oriented etch pits are usually oriented and aligned, mainly developed in rivers, lakes, and especially marine environments where the water affects the grains by dissolution (Mahaney, 2002), 27% of the quartz grains in QF profile show oriented etch pits, indicating a subaqueous environment. Silica precipitation suggest that the QF quartz grains have produced silica globules (Figure 5F), silica pellicles, some grains are even completely covered by silica pellicles, indicating that the quartz grains have undergone a strong chemical weathering after deposition.
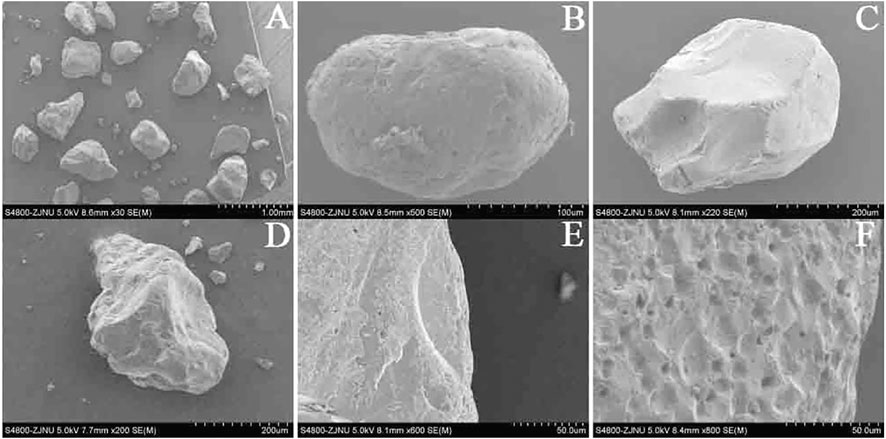
FIGURE 4. (A) Quartz grains in XG profile. (B) Rounded grain. (C, D) Dish-shaped depressions. (E). Crescentic marks. (F) Pockmarked surface.
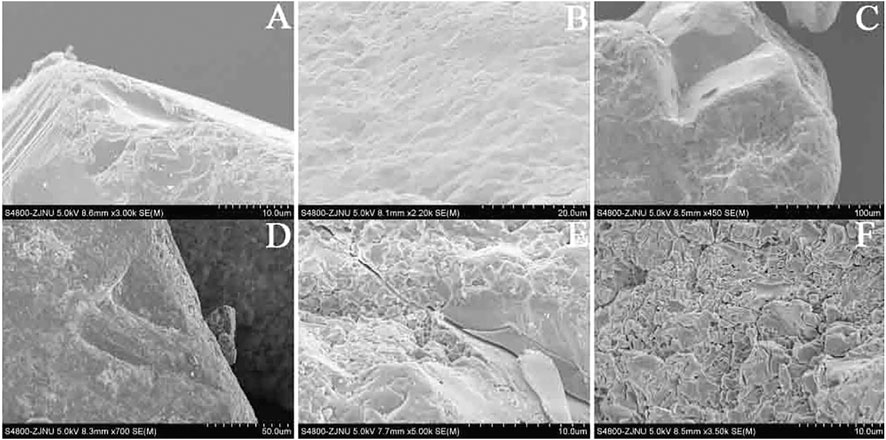
FIGURE 5. (A) Conchoidal fractures. (B, C) V-shaped cracks. (D) Triangular cracks. (E) Solution crevasses. (F) Silica globules.
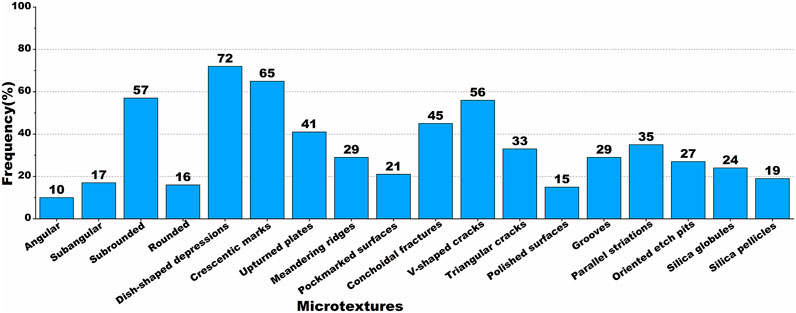
FIGURE 6. Frequencies of microtextures identified in QF profile.
Discussion
Evidence of Aeolian Deposition
The QF ORS profile is mainly composed of medium sand, fine sand and silt, with more silt and clay components, the average grain size is fine; whereas beach sand is mainly composed of coarse sand, medium sand and fine sand, almost without silt or clay components, and the average grain size is much coarser than that of the ORS (Zeng et al., 1999a), indicating that the grain size composition of the ORS is obviously different from that of beach sand, but close to that of aeolian sand. On the other hand, it is suggested that aeolian sand dunes usually show positive skewness, while beach sand mostly show negative skewness (Zeng et al., 1999b), our results indicate that most samples of QF profile show positive skewness, suggest typical aeolian characteristics of the ORS. In addition, it is believed that aeolian sand dunes usually show narrow peaks, while beach sand mostly correspond to medium-narrow peaks, without very narrow peaks. Most samples from QF profile show very sharp peaks, suggest an aeolian origin. The QF profile contains more silt and clay materials than modern coastal aeolian sand and beach sand, but its sorting is not as good as those of modern coastal aeolian sand and beach sand grains, this is probably related to the strong chemical weathering in the warm–humid subtropical monsoon climate after deposition, which greatly increased the content of fine materials and resulted in a poor sorting. The grain-size frequency curve (Figure 3A) of QF profile is very similar to that of a typical paleo-aeolian dune profile in Zhoushan (ZS) island, indicating QF ORS a aeolian sand accumulation, and the QF samples were all identified as aeolian sand by FLDA. Finally, all grain size characteristics of QF profile are consistent with those of other reported ORS profiles along the southeast coast of China, including a fine grain size, more silt and clay component, positive skewness, a poor sorting, very sharp peaks etc, indicating that they share the same provenance (Zeng et al., 1999a; Zeng et al., 1999b; Zhang et al., 2007; Fangen et al., 2012; Yu et al., 2014; Jin et al., 2018). It is suggested that quartz grains >63 μm are difficult to be transported by wind for long distances and are regarded as near-source materials (Liu, 1985), in QF profile, sand content is the first dominant grain size, constituting the highest composition, indicating a near-source accumulation. Thus we suggest that the ORS should be aeolian deposit originated from river sand or beach sand nearby, which were transported and deposited by wind along the coast.
SEM observations show that quartz grains in QF profile are mainly characterized by subrounded (57%) outlines. Mechanically produced marks are abundant and varied, including both subaqueous environment features such as triangle marks, V-shaped cracks, and aeolian traces like dish-shaped depressions and pockmarked surfaces, suggest that the QF ORS quartz grains have experienced comprehensive effect of two external forces. It is suggested that triangle cracks, V-shaped cracks and dish-shaped depressions are typical or indicative characteristics of river sand, beach sand and aeolian sand respectively. Furthermore, river sand and beach sand are without aeolian features like dish-shaped depressions, crescentic marks etc (Wu et al., 1995). In addition, it is suggested that river sand and beach sand are characterized by subangular outlines, while aeolian sand are mostly characterized by subrounded outlines (Ying and Deonarine, 1985; Krinsley and Doornkamp, 2011). Our results show that most sand grains from QF profile are subrounded in outline, its roundness is much better than that of river sand and beach sand. Finally, some subaqueous environment marks of the sand grains from QF profile were transformed or rounded by later wind transportation. Comprehensive analysis show that the ORS should be aeolian sand dune originated from river sand or beach sand. The ORS is likely to have been transported by rivers or waves, and then transported and deposited by wind power, ultimately transformed by chemical weathering after deposition. The better roundness of the ORS resulted from the abrasion by the fluvial process and the later aeolian process.
Paleoenvironmental Significance of the ORS Along the Southeast Coast of China
Based on the results of our study and the latest reported dating results (Zhang et al., 2007; Fangen et al., 2012; Yu et al., 2014; Jin et al., 2017), we found that the ORS was aeolian deposit mainly developed in 6 stages: 125–115, 105–97, 84–74, 61.5–52.0, 39–29, and 15–9 ka. Therefore, we can draw the conclusion that the ORS developed in the warm–humid high sea level stages during the last interglacial period and in the relatively cold-dry low sea level stages during the last glacial period, but not occur in the lowest sea level stages during the LGM, the formation of the ORS was restricted jointly by climate changes of the source area and the distance from the shoreline that resulted from sea level changes. This result is consistent with previous studies that red dunes developed in high sea level stages and in relatively low sea level stages (Giannini et al., 2007; Tamura et al., 2011; Jayangondaperumal et al., 2012; Alappat et al., 2013). During the last interglacial period, under a warm–humid climate, the precipitation increased significantly, rivers transported sufficient sand supply to the coast, the intensified East Asian summer monsoon transported these sand materials and deposited along the coast. During the last glacial period, with the sea level declined, the exposed continental shelf plain provided abundant sand materials for aeolian activities, the intensified East Asian winter monsoon transported these loose materials and deposited along the coast, subsequently dune reddening could occur rapidly in areas with high rainfall and high temperature, the red coating of sands resulted from iron oxides formed by in-situ weathering of garnet over hundreds of years (Chase and Thomas, 2007; Alappat et al., 2013). However, it is not the case that aeolian activities are non-existent along the coast in the LGM, just because with the rapid rise of the sea level after 15 ka BP, the aeolian dunes were submerged by sea water, became paleodunes buried in seabed. It has been widely reported that aeolian dunes developed on the shelf during the LGM. For example, there were aeolian dunes on the west African shelf in the LGM (Shepard and Young, 1961). A drilling research shows that there are a large number of submerged aeolian dunes on the shelf of the South China Sea at a depth of 60–200 m (Wu and Wu, 1987; Wu et al., 1995), and the distribution area of the ORS in southeast China coastal areas have evolved into an inland denudation environment because it was too far away from the coastline.
Conclusion
Grain size characteristics and quartz grain surface microtextures were analyzed to study the origin and paleoenvironmental significance of the ORS, the results show that the ORS show typical aeolian features and subaqueous environments characteristics, combined with the latest OSL dating data, we suggest that the ORS should be coastal aeolian sand dunes developed since the last interglacial period. The formation of the ORS was restricted jointly by climate changes of the coastal area and the distance from the shoreline that resulted from sea level changes.
Data Availability Statement
The original contributions presented in the study are included in the article/Supplementary Material, further inquiries can be directed to the corresponding author.
Author Contributions
Investigation, QF and JL; methodology, QF and YL; data curation, QF and XF; writing original draft, QF; review and editing, JL and WY; funding acquisition, TW.
Funding
This research was funded by the National Key and Program of China (2016YFC0500909)” Key Techniques and Demonstration of Desertification Control in Semiarid Area in North China,” and the National Key Research and Development Program of China (Grant No. 2017YFC0504804). We are very grateful to the reviewers for their constructive comments.
Conflict of Interest
The authors declare that the research was conducted in the absence of any commercial or financial relationships that could be construed as a potential conflict of interest.
References
Alappat, L., Seralathan, P., Shukla, A., Thrivikramji, K., and Singhvi, A. (2013). Chronology of Red Dune Aggradations of South India and its Palaeo-Environmental Significance. Geochronometria 40 (4), 274–282. doi:10.2478/s13386-013-0118-5
Blumer, B. E., Arbogast, A. F., and Forman, S. L. (2012). The OSL Chronology of Eolian Sand Deposition in a Perched Dune Field along the Northwestern Shore of Lower Michigan. Quat. Res. 77 (3), 445–455. doi:10.1016/j.yqres.2012.01.006
Chase, B. M., and Thomas, D. S. G. (2007). Multiphase Late Quaternary Aeolian Sediment Accumulation in Western South Africa: Timing and Relationship to Palaeoclimatic Changes Inferred from the Marine Record. Quat. Int. 166 (1), 29–41. doi:10.1016/j.quaint.2006.12.005
Chen, R., Chen, J., Ma, J., and Cui, Z. (2019). Quartz Grain Surface Microtextures of Dam-Break Flood Deposits from a Landslide-Dammed Lake: A Case Study. Sediment. Geol. 383, 238–247. doi:10.1016/j.sedgeo.2019.02.010
Costa, P. J. M., Andrade, C., Dawson, A. G., Mahaney, W. C., Freitas, M. C., Paris, R., et al. (2012). Microtextural Characteristics of Quartz Grains Transported and Deposited by Tsunamis and Storms. Sedimentary Geol. 275-276, 55–69. doi:10.1016/j.sedgeo.2012.07.013
Costa, P. J. M., Andrade, C., Mahaney, W. C., Marques da Silva, F., Freire, P., Freitas, M. C., et al. (2013). Aeolian Microtextures in Silica Spheres Induced in a Wind Tunnel Experiment: Comparison with Aeolian Quartz. Geomorphology 180-181, 120–129. doi:10.1016/j.geomorph.2012.09.011
Fangen, H., Zhizhong, L., Jianhui, J., et al. (2012). A Primary Research on Multiphase Development Pattern of Old Red Sand in Jinjiang Coast of Southeast Fujian. Quat. Sci. 32 (6), 1207–1220. doi:10.3724/sp.j.1226.2012.00462
Feng, W., Xue, W., and Yang, D. (1988). The Geological Environment of Late Quaternary in the Northern South china Sea. Guangzhou: Guangdong Technology Publishing House.
Folk, R. L., and Ward, W. C. (1957). Brazos River Bar [Texas]; a Study in the Significance of Grain Size Parameters. J. Sediment. Res. 27 (1), 3–26. doi:10.1306/74d70646-2b21-11d7-8648000102c1865d
Giannini, P. C. F., Sawakuchi, A. O., Martinho, C. T., and Tatumi, S. H. (2007). Eolian Depositional Episodes Controlled by Late Quaternary Relative Sea Level Changes on the Imbituba-Laguna Coast (Southern Brazil). Mar. Geol. 237, 143–168. doi:10.1016/j.margeo.2006.10.027
Guo, Z. T., Ruddiman, W. F., Hao, Q. Z., Wu, H. B., Qiao, Y. S., Zhu, R. X., et al. (2002). Onset of Asian Desertification by 22 Myr Ago Inferred from Loess Deposits in China. Nature 416, 159–163. doi:10.1038/416159a
Helland, P. E., Huang, P.-H., and Diffendal, R. F. (1997). SEM Analysis of Quartz Sand Grain Surface Textures Indicates Alluvial/Colluvial Origin of the Quaternary “Glacial” Boulder Clays at Huangshan (Yellow Mountain), East-Central China. Quat. Res. 48, 177–186. doi:10.1006/qres.1997.1916
Jayangondaperumal, R., Murari, M. K., Sivasubramanian, P., Chandrasekar, N. A. K., and Singhvi, A. K. (2012). Luminescence Dating of Fluvial and Coastal Red Sediments in the SE Coast, India, and Implications for Paleoenvironmental Changes and Dune Reddening. Quat. Res. 77 (3), 468–481. doi:10.1016/j.yqres.2012.01.010
Jin, J.-H., Li, Z.-Z., Cheng, Y., Xu, X.-L., Li, Z.-X., and Liu, X.-J. (2018). Late Pleistocene Aeolian Activity in Haitan Island, Southeast China: Insights from Optically Stimulated Luminescence Dating of Coastal Dunes on Marine Terraces. J. Mt. Sci. 15 (8), 1777–1788. doi:10.1007/s11629-018-4890-9
Jin, J., Li, Z., Lei, G., et al. (2017). Chronology and Environmental Significance of Old Red Sand in South China:Take the Old Red Sand in Qingfeng, Fujian as an Example. Scientia Geographica Sinica 37 (2), 301–310. doi:10.1007/bf02886083
Krinsley, D. H., and Doornkamp, J. C. (2011). Atlas of Quartz Sand Surface Textures. Cambridge: Cambridge University Press.
Li, Z. W., Dong, Y. X., and Li, B. S. (2012). Current Study and Prospect of the Old Red Sand along the Southeast Coast of China. Sci. Cold Arid Regions 4 (6), 0462–0471. doi:10.3724/sp.j.1226.2012.00462
Li, C., Peng, F., Lai, C., Xue, X., Yu, Q., Xiaojie, C., et al. (2021). Plant community changes determine the vegetation and soil δ13C and δ15N enrichment in degraded alpine grassland. Land Degradation & Development 32 (7), 2371–2382. doi:10.1002/ldr.3912
Mahaney, W. (2002). Atlas of Sand Grain Surface Textures and Applications. USA: Oxford University Press.
Mahaney, W., and Kalm, V. (2000). Comparative Scanning Electron Microscopy Study of Oriented till Blocks, Glacial Grains and Devonian Sands in Estonia and Latvia. Boreas 29, 35–51. doi:10.4095/304896
Mahaney, W. C., Hancock, R. G. V., Milan, A., Pulleyblank, C., Costa, P. J. M., and Milner, M. W. (2014). Reconstruction of Wisconsinan-Age Ice Dynamics and Compositions of Southern Ontario Glacial Diamictons, Glaciofluvial/lacustrine, and Deltaic Sediment. Geomorphology 206, 421–439. doi:10.1016/j.geomorph.2013.10.014
Mahaney, W. C., Stewart, A., and Kalm, V. (2001). Quantification of SEM Microtextures Useful in Sedimentary Environmental Discrimination. Boreas 30, 165–171. doi:10.1080/030094801750203170
Purtill, M. P., Kite, J. S., and Forman, S. L. (2019). Geochronology and Depositional History of the Sandy Springs Aeolian Landscape in the Unglaciated Upper Ohio River Valley, United States. Front. Earth Sci. 7, 322. doi:10.3389/feart.2019.00322
Pye, K. (1995). The Nature, Origin and Accumulation of Loess. Quat. Sci. Rev. 14, 653–667. doi:10.1016/0277-3791(95)00047-x
Shepard, F. P., and Young, R. (1961). Distinguishing between Beach and Dune Sands. J. Sed. Petr. 31 (2), 196–214.
Smith, C., Soreghan, G. S., and Ohta, T. (2018). Scanning Electron Microscope (SEM) Microtextural Analysis as a Paleoclimate Tool for Fluvial Deposits: a Modern Test. Geol. Soc. Am. Bull. 130, 1256–1272. doi:10.1130/b31692.1
Tamura, T., Kodama, Y., Bateman, M. D., et al. (2011). Coastal Barrier Dune Construction during Sea Level High Stands in MIS3 and 5a on Tottori Coast Line, Japan. Palaeoecology 308 (3-4), 492–501. doi:10.1016/j.palaeo.2011.05.054
Vos, K., Vandenberghe, N., and Elsen, J. (2014). Surface Textural Analysis of Quartz Grains by Scanning Electron Microscopy (SEM): from Sample Preparation to Environmental Interpretation. Earth-Science Rev. 128, 93–104. doi:10.1016/j.earscirev.2013.10.013
Wu, Z., Huang, S., and Hu, S. Z. (1995). Research on the Landforms of the Wind- Drift Sand in South China Coast. Beijing: Science Press, 114–118.
Wu, Z., and Wang, W. (2001). TL Dating of the Old “Red Sand”on the Coasts of Fujian and Guangdong. J. Desert Res. 21 (4), 328–332. doi:10.1007/bf02886083
Wu, Z., and Wu, K. G. (1987). Sedimentary Structure and Developing Model of Coastal Dunes along the Northeastern Coast of Hainan Island, China. Acta Geogr. Sin. 42 (2), 129–141.
Yang, L. H., Ye, W., Zheng, X. M., et al. (2014). The Discriminant Function with Grain Size of Floodplain and Aeolian Sediments and its Application in the Quaternary Red Clay. Geographical Res. 33 (10), 1848–1856. doi:10.1016/j.quaint.2012.08.2076
Yang, L.-H., Zheng, X.-M., Ye, W., et al. (2017). Sedimentary Environment of Vermicular Red Clay in South China. J. Mt. Sci. 14 (3), 513–526. doi:10.1007/s11629-016-3973-8
Ying, W., and Deonarine, B. (1985). Model Atlas of Surface Textures of Quartz Sand[M]. Beijing: Science Prees.
Yu, M. T., Zhang, H. Y., Gong, Z. Q., et al. (2014). The Monsoon Components in Qingfeng Old Red Sands and Their Formation Epoch, Pingtan Island, Fujian Province. Scientia Geographica Sinica 34 (3), 352–357. doi:10.1088/1755-1315/17/1/012075
Zeng, C. S., Chen, J. Z., and Wu, Y. G. (1999a). Research of Old Red Sad in Southeast Fujian. Beijing: Geology Publishing House, 35–39.
Zeng, C. S., Chen, J. Z., and Wu, Y. G. (1999b). The “Old Red Sands” along the Coast of Southeast Fujian and Environmental Evolution during Late Quaternary. J. desert Res. 19 (2), 110–114.
Zeng, Z. X., and Huang, S. M. (1964). “The Discussion on "Old Red Sand" along the South China Sea,” in Chinese Society of Quaternary SciencesThe Collection of Second Academic Session Papers. Beijing, 162–163.
Zhang, H. Y., and Ming-Tong, Y. U. (2014). Tracer Analysis of Old Red Sand Source in QF Section from Pingtan Island of Fujian Province. Journal of Subtropical Resources & Environment 9 (1), 815. doi:10.19687/j.cnki.1673-7105.2014.01.002
Zhang, J. F., Yuan, B. Y., and Zhou, L. P. (2007). Luminescence Chronology of “Old Red Sand” in Jinjiang and its Implications for Optical Dating of Sediments in South China. Chin. Sci. Bull. 52 (22), 2646–2654. doi:10.1007/s11434-008-0001-6
Keywords: old red sand, aeolian activity, east Asian monsoon, climate changes, sea level changes
Citation: Fan Q, Liao J, Li Y, Ye W, Wang T and Feng X (2021) Origin and Paleoenvironmental Significance of the Old Red Sand Along the Southeast Coast of China. Front. Earth Sci. 9:681361. doi: 10.3389/feart.2021.681361
Received: 16 March 2021; Accepted: 05 May 2021;
Published: 25 May 2021.
Edited by:
Xiangzhong Li, Yunnan University, ChinaCopyright © 2021 Fan, Liao, Li, Ye, Wang and Feng. This is an open-access article distributed under the terms of the Creative Commons Attribution License (CC BY). The use, distribution or reproduction in other forums is permitted, provided the original author(s) and the copyright owner(s) are credited and that the original publication in this journal is cited, in accordance with accepted academic practice. No use, distribution or reproduction is permitted which does not comply with these terms.
*Correspondence: Jie Liao, liaojie@lzb.ac.cn