
94% of researchers rate our articles as excellent or good
Learn more about the work of our research integrity team to safeguard the quality of each article we publish.
Find out more
BRIEF RESEARCH REPORT article
Front. Earth Sci., 06 October 2021
Sec. Environmental Informatics and Remote Sensing
Volume 9 - 2021 | https://doi.org/10.3389/feart.2021.589399
This article is part of the Research TopicRecent Advances in Natural Methane Seep and Gas Hydrate SystemsView all 14 articles
 Chiharu Aoyama*
 Nidomu Maeda
In recent years, discoveries of methane plumes (also called methane flares) have been reported in various sea areas around the world. Clusters of naturally seeping methane bubbles rising from the seafloor are visualized as methane plumes on the echograms of quantitative echo sounders and multibeam sonars. In order to determine if seeping methane can be used as energy resources and its environmental impact, it is necessary to estimate the amount of naturally seeping methane. From April, 2020, a 3-year project is being conducted in Japan to evaluate the amount of methane seepage from methane plumes. The authors propose the following steps to quantify the amount of methane seepage accurately. First of all, methane plumes in the Exclusive Economic Zone (EEZ) of Japan are mapped out using acoustic devices such as quantitative echo sounders and multibeam sonars. Secondly, methane bubbles of a few millimeters in diameter from methane seeps at seafloor are collected and sampled using a cone-shaped collector with 20 cm in diameter, operated by Remotely Operated Vehicle (ROV). If we can identify the number of seep mouths that form into one single plume, we will be able to quantify the methane seepage from one plume. Based on this result, calibration of the mean backscattering strength and the amount of seeping methane from methane plumes becomes possible and will be applied to the mapped plumes in order to estimate the methane seepage in the EEZ of Japan. Once this calibration is established, it can be applied to the methane plumes observed worldwide, and methane seepage can be quantified simply by acoustic observations of methane plumes. In this study, a method to verify the correlation between methane plumes and methane seeps is introduced, as well as a method to locate methane seeps effectively using the Target Position function of a quantitative echo sounder. The authors intend to use this as the basic data for establishing a method to estimate the amount of methane released from a methane plume by observing the methane plume acoustically.
Recent offshore seismic surveys and logging have confirmed a wide distribution of methane hydrate in deep sea deposits (Shipley and Houston, 1979; Shipley and Didyk, 1982; Matsumoto, 2001). Investigations such as drilling and diving surveys are being conducted in methane hydrate bearing sea areas (Aoyama and Matsumoto, 2009).
Methane hydrate bearing conditions are categorized as either shallow type or pore-filling sand layer type. Shallow type methane hydrate refers to methane hydrate that is, generated and observed near seafloor surface in various forms such as plates, veins, and clumps (Ministry of Economy, Trade and Industry, 2016) on the seafloor surface in waters deeper than 500 m, and at about 100 m below seafloor in the sea area of Joetsu, Sea of Japan. Shallow type methane hydrate in the Sea of Japan is mostly confirmed in muddy sediments at 500–1,500 m depths, shallower than about 100 m below seafloor (National Institute of Advanced Industrial Science and Technology, 2021).
A 3-year offshore investigation project of shallow type methane hydrate is being conducted in Japan from April 1, 2020. One of the purposes of this project is to establish a quantification method of methane plumes and utilize those results as an indicator to determine the potential of methane plume as a domestic natural resource and its environmental impacts (National Institute of Advanced Industrial Science and Technology, 2019).
Methane plumes, also called methane flares, are bubbles seeping from the seafloor which can be observed on the monitors of quantitative echo sounders and echogram of multibeam sonars onboard (Aoyama et al., 2009). Also, not all flares are continuously bubbling, often they switch on and off (Römer et al., 2016).
Based on the past investigations by Aoyama et al. (Aoyama and Matsumoto, 2009; Aoyama et al., 2009), shallow type methane hydrate is confirmed to exist in the subseafloor source of methane plumes and are used as indicators for shallow type methane hydrate investigations.
In recent studies, extensive observations of methane plumes have numerously been reported in areas such as offshore Spitsbergen (Mau et al., 2017), North Carolina (Skarke et al., 2014), northeastern Sakhalin (Young et al., 2011), as well as offshore Sado in the Sea of Japan (Niigata University, 2016), and offshore Shionomisaki in Wakayama, Japan (Aoyama and Mizukami, 2018). Methane plume observations from within methane hydrate stability zone is an indicator for the potential presence of methane hydrate, and quantification of these, including methane plumes, can reveal the potential use as an energy source.
One example from the past studies of methane flow quantification from ship’s echo sounder data is the study by Thomas C. Weber et al. where they surveyed 357 natural seeps in 6000km2 using acoustic mapping techniques (Weber et al., 2014).
One hypothesis made in this study is that all of the methane seeps are equal, but according to Figure 2C, they are not. However, this project will carry out an examination of many seeps so it will show the variability and uncertainty of this assumption. Also, whereas this study assumes that the methane flow rates from each plume to be constant, (Römer et al., 2016), for example, shows a strong correlation of methane flux with tides and also, longer timescale changes (weeks to months).
Future observations will help to indicate this variability and uncertainty. The methodology of Veloso et al. (2015) for quantifying bubble flow-rate using split-beam echo sounders has already been applied by Riedel et al. (2018) to estimate methane fluxes in Cascadia Margin. However, these types of studies are rare and have not been conducted in Japan, which is why the present methodology was proposed and is currently being implemented.
The following procedures are proposed to quantify methane seep rates.
① Assess methane plume mapping using acoustic devices such as quantitative echo sounders and multibeam sonars.
② Quantify methane seepage by collecting seeping methane with a cone-shaped container attached to an ROV. In this study, the author used a cone-shaped instrument with a diameter of 20 cm.
③ Determine the number of seep mouths of one single plume in order to quantify the methane seepage from a single plume.
④ Calibrate the mean backscattering strength of methane plume and the amount of methane seepage based on the result of ③.
⑤ By applying ④ to ①, the total amount of methane seepage in the surrounding sea areas of Japan will be estimated.
In this study, we consider a proposed methodology to understand ③ the correlation between methane plume and methane seeps accurately.
Methane plumes can be mapped by quantitative echo sounders and multibeam sonars. Observations have been conducted in offshore Joetsu in the Sea of Japan, northeast offshore Sado, and offshore Wakayama prefecture. Recently, this methodology has been used worldwide, including Spitsbergen (Mau et al., 2017) and North Carolina (Skarke et al., 2014).
In shallow type methane hydrate bearing sea areas, continuous seeping of methane bubbles with a diameter of 3–5 mm from seeps on seafloor surface are being confirmed. The diameter of these seep mouths is smaller than 1 cm and are often discovered at seafloor. Seeping methane are immediately coated with methane hydrate film (hereinafter referred to as methane hydrate coated bubbles) under low temperature and high pressure (Matsui and Aoyama, 2019). Specific gravity of methane hydrate is approximately 0.9, and thus the methane hydrate coated bubbles to rise. This state can be observed real-time onboard the research vessels as images recorded with the Remotely Operated Vehicle (ROV) camera (Aoyama and Matsumoto, 2009). These methane hydrate coated bubbles are collected with a cone-shaped device with a 20 cm diameter, attached to the manipulator of an ROV. Methane seepage is quantified by analysis of the video from the ROV (Aoyama and Matsumoto, 2009).
Several studies have been reported on the amount of methane seepage (Hachikubo, 2009), and the amount collected in Umitaka Spur, offshore Joetsu in the Sea of Japan, using this device is estimated to be several tons a year (Aoyama and Matsumoto, 2020). As a specific example, 1,150 ml container was filled with bubbles in 481 s at the Natsushima voyage (NT07-20) in October, 2007. Assuming the constant methane seepage, 8,610 ml of hourly methane seepage can be estimated, with an annual seepage of 75.4 m3.
Seeping of methane bubbles are confirmed as methane plumes on the echogram of a quantitative echo sounder (Aoyama and Matsumoto, 2009). However, the correlation between the amount of methane seepage measured with a methane bubble collecting tool and methane plumes observed on the echogram is still yet to be known. If the number of seeps within the footprint and their locations are specified on the monitor of a quantitative echo sounder, the amount of methane seepage can be estimated simply by observations of methane plumes on a research vessel.
Pulsed acoustic waves from the transducer of a quantitative echo sounder mounted beneath the research vessel scatter in various directions when these waves reflect off the objects underwater, such as methane hydrate coated bubbles. The decibel notation of the ratio between the intensity of reflected waves scattered back to the transducer and the intensity of incident waves is called volume backscattering strength (Sv), indicated as SV(= 10logSv) (Furusawa, 1995). The intensity of SV is indicated in different colors and shades on the echogram. Clusters of rising methane hydrate coated bubbles are visualized on the echogram and referred to as methane plumes. Figure 1 shows the echogram from the research cruise at Umitaka Spur in the Sea of Japan in June, 2019. Seafloor of about 900 m depth is marked in red line. Vertical axis indicates the depth with the sea surface on the top and the horizontal axis indicates the time lapse, with the recent data to the right. Echogram displays the images underwater, following the route of the research vessel. A candle flare-shaped image in the middle of Figure 1 from the seafloor rising to 350 m depth is methane plume. Based on the analysis of the water samples, observations from the images of the ROV camera, and by a methane sensor, components of methane plume are confirmed to be clusters of methane hydrate coated bubbles.
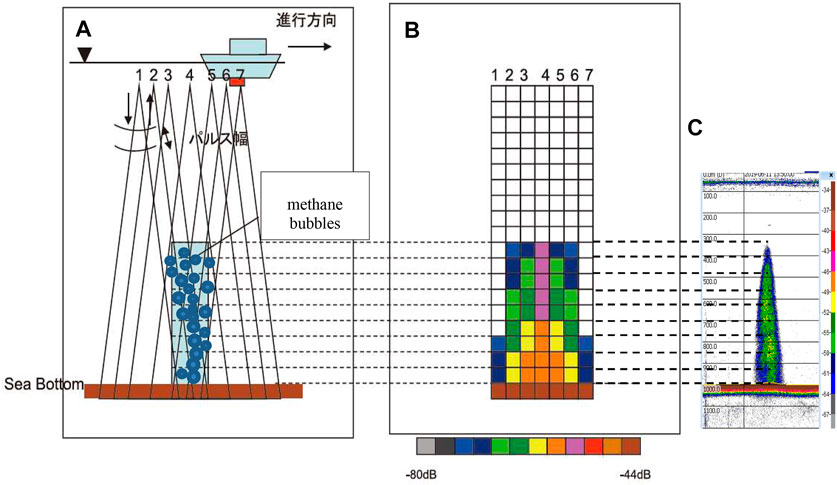
FIGURE 1. Correlation between the movement of the beam axis and the actual location of methane plume, as well as the correlation of its images on the echogram is shown schematically. In (A), the plume is first detected when the vessel is at position 1, so it appears as if the plume is directly below position 1, as shown in (B). However, the plume is located on the seafloor directly underneath position 4, not under position 1. When the vessel is at position 7 in (A), it appears as if methane is seeping directly under position 7, although the seep is not located directly underneath (B). (C) is an example of an echogram display (methane plume observed by EA600 quantitative echo sounder onboard Kaiyo Maru No. 1 at 13:52:41 on June 11, 2019, at position 37-35.304N, 137-58.830E).
As shown in Figure 1, methane plumes appear in the shape of a candle flare on the display of an echogram, with a wider base towards the bottom. The 7° beam width of the acoustic waves from the transducer causes methane plume to appear in such figure with an apparently wider base towards the bottom. At seafloor of 1,000 m depth, the diameter of the beam width expands to about 120 m. The mean backscattering strength per unit volume within this range is shown on the echogram at 1000 m depth. Therefore, methane plume on the echogram becomes wider as it gets deeper. Methane seeps cannot be specifically located within the footprint range.
On the other hand, the amount of methane from seeps of about 1 cm in diameter can be quantified by seafloor observation using the ROV. Several studies (Aoyama and Matsumoto, 2009) (Hachikubo, 2009) have been reported and verification of the one-to-one correspondence between methane seeps and methane plume is discussed in detail in Investigation of the Correlation Between Methane Plumes and Seeps Through Seafloor Experiments. In the future, more observation data are necessary to estimate the amount of methane seepage precisely.
First efforts at correlating and sonar return were conducted on data collected during the cruise as presented at the AGU Fall Meeting 2019 by Maeda and Aoyama. Methane seeps were identified at seafloor of 1,000 m depth at Umitaka Spur, offshore Joetsu in the Sea of Japan within the diameter range of 120 m, which is equivalent to the footprint diameter with the beam width expansion of 7°. The ROV rotated the echosounder beam axis (200 kHz frequency) 360° in the horizontal plane. As a result, 4 seeps (June 11, 37˚26.063′N,138°00.294′E, 880–885 m depth) and 8 seeps (June 12, 37˚26.051′N,138˚00.287′E, 880–885 m depth) were discovered within this range. Based on the quantitative echo sounder (38 kHz) onboard, the mean volume backscattering strength (mean SV) of the plume was −61.5 ㏈ at 4 points and −60.53 ㏈ at 8 points. In both cases, the average volumetric backscattering was obtained by integrating the data over a 60-min period at a height of 5 m above seafloor. Assuming the same amount of methane seepage from each source, the correlation between the number of seeps and the mean volume backscattering strength of methane plume becomes evident. Specifically, the fewer the seeps, the weaker the Sv.
In order to determine the amount of naturally seeping methane from seafloor simply by acoustic observations of methane plume onboard a vessel, the authors investigated the Target Position function of a quantitative echo sounder, originally used to specify the location of fish, to locate methane plumes.
The diameter of the target position indicates the diameter of the footprint, which is 0 at the center and 5.0 on the circumference, with increments of 0.1, as shown in the orange circle in Figure 2. There is no unit of these values. Center is 0, left on the circumference (270°) −5.0, right (90°) +5.0, top (0°) +5.0, bottom (180°) −5.0. These values are set by the software for data acquisition. The length of the diameter is determined by the beam width and depth (Figure 2A). The range is set to measure the depth direction. In Figure 2, the depth is about 900 m to the seafloor (Figure 2B), so the width of 30 m is set between 855 and 885 m depth. (Figure 2A). The 30 m width does not come from the 900 m depth. Since the vertical observation width using a quantitative echo sounder attached to the ROV was 30 m when observing the seepage, the target position function was also aligned to 30 m. The minimum unit of width setting is 5 m. The diameter of the black circle becomes approximately 100 m because of the beam width of 7° and the depth of 870 m (the middle of the measurement width). The distance resolution at this point is approximately 1 m. The red circles indicate the footprint area (black circle) with strong backscattering strength (seeps) (Figure 2C).
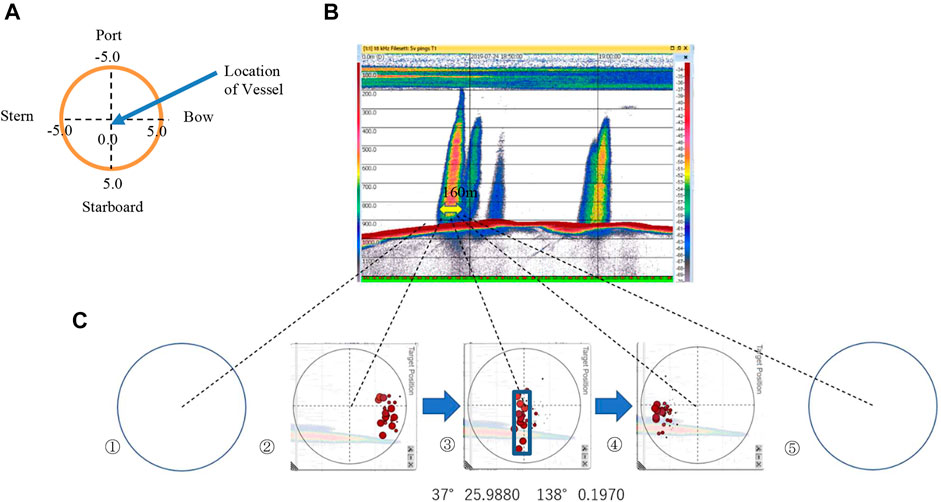
FIGURE 2. Identification of methane seeps using Target Position function of quantitative echo sounder. (A) Display of Target Position function. (B) Echogram (observed on July 25, 2019 using EK80 quantitative echo sounder onboard Shinyo Maru) Vertical axis of the echogram indicates the water depth, with the water surface at the top and depth of the water at the bottom. Horizontal axis indicates the passage of time, with the right side being the latest. Each grid represents 10 min. Since the traveling speed of the research vessel is 3 knots, the distance in 10 min will be 926 m. (C) ①⑤ Footprint range where plumes are not detected on the echogram.②③④ Distribution of methane seep location within the footprint range on the echogram (855–885 m depth). ③ Blue box indicates 53 m × 9 m range.
The vessel location is accurately determined by GPS at the center of the circle. Given that the distance and direction from the vessel (center of the circle) are determined with the split beam, this allows the location (latitude and longitude) of seeps to be identified.
Ten methane seeps were located directly under the vessel, within 53 m × 9 m (Figure 2C, ③). Larger red circles indicate the location of seeps during the current transmission, and smaller red circle indicates the location during the previous transmission. A solid red dot indicates a single seep. However, because the distance resolution is 1 m, there may be multiple seeps within 1 m. Plumes ②, ③, and ④ were also identified in a similar method. Since living organisms were not confirmed during seafloor observation of methane seepage using the ROV camera, red dots were assumed to be methane seeps.
As a result of in-situ experiment using the Target Position function, the location of the methane seepage range could be determined with high accuracy, and a clear correlation can be seen between the number of seeps and mean SV. The amount of methane seepage can be estimated by measuring the amount of methane seepage from a single seep.
④Based on the result of ③, the mean backscattering strength of methane plume and the amount of methane seepage is calibrated.
⑤Total amount of methane seepage in the surrounding sea areas of Japan can be obtained by applying ④ to ①. This result will be an indicator of whether methane plumes can be considered as a resource as well as its impact on the environment.
In this study, the correlation between methane plumes and methane seepage was examined. The results showed that multiple seeps exist within a single methane plume. Target Position function of a quantitative echo sounder is utilized to identify the precise locations of the methane seeps.
In the future, calibration of the mean back scattering strength and the amount of methane seepage need to be established to evaluate the total amount of methane seepage in Japan and to determine whether it can be used as a resource and its environmental impact.
Then the calibration can be applied to the methane plumes reported worldwide, and the amount of methane seepage can be estimated by simply observing the methane plumes acoustically.
The raw data supporting the conclusion of this article will be made available by the authors, without undue reservation.
NM performed the analysis of methane bubbles on echogram. CA organized the database, performed data analysis, wrote the manuscript, revision, read, and approved the submitted version.
We also thank Japan’s Independent Institute for funding this research cruise.
The authors declare that the research was conducted in the absence of any commercial or financial relationships that could be construed as a potential conflict of interest.
All claims expressed in this article are solely those of the authors and do not necessarily represent those of their affiliated organizations, or those of the publisher, the editors and the reviewers. Any product that may be evaluated in this article, or claim that may be made by its manufacturer, is not guaranteed or endorsed by the publisher.
We are grateful for the data provided from the research cruise on Shinyo Maru (Tokyo University of Marine Science and Technology) in July 23–27, 2019 and on Kaiyo Maru No. 1 (KAIYO ENGINEERING CO., LTD.) in June 9–13, 2019. Additional support was provided by the crew members of Shinyo Maru and Kaiyo Maru No. 1.
Aoyama, C., and Matsumoto, R. (2009). Acoustic Surveys of Methane Plumes by Quantitative Echo Sounder in Japan Sea and the Estimate of the Seeping Amount of the Methane Hydrate Bubbles. J. Geogr. 118 (1), 156–174. doi:10.5026/jgeography.118.156
Aoyama, C., Matsumoto, R., and Tomaru, H. (2009). Formation and Collapse of Gas Hydrate Deposits in High Methane Flux Area of the Joetsu Basin, Eastern Margin of Japan Sea. J. Geogr. 118 (1), 43–71. doi:10.5026/jgeography.118.43
Aoyama, C., and Matsumoto, R. (2020). Verifying Estimates of the Amount of Methane Carried by a Methane Plume in the Joetsu Basin. East. Margin Sea Jpn. 118 (1), 141–146. doi:10.5026/jgeography.129.141
Aoyama, C., and Mizukami, T. (2018). MIS17-08: Plumes Observation in Offshore Shionomisaki of Wakayama Prefecture over the Past Five Years [Poster Presentation]. Chiba, Japan: JpGU 2018.
Furusawa, M. (1995).Acoustic Survey Method for Marine Resources-Measuring Method and Quantitative Echo Sounder. Mar. Acoust. Soc. Jpn., 79 152–161.
Hachikubo, A. (2009). Methane Hydrates and Plumes in the Sea of Okhotsk. J. Geogr. 118 (1), 175–193. doi:10.5026/jgeography.118.207
Matsui, K., and Aoyama, C. (2019). OS43B-1707: Change of Phase Underwater Due to Change in the Depth of Methane Hydrate Particles [Poster Presentation]. San Francisco, CA, United States: AGU Fall Meeting 2019.
Matsumoto, R. (2001). Distribution, Occurrence of Methane Hydrate and Amount of Methane. Aquabiology 23, 439–445.
Mau, S., Römer, M., Torres, M. E., Bussmann, I., Pape, T., Damm, E., et al. (2017). Widespread Methane Seepage along the continental Margin off Svalbard - from Bjørnøya to Kongsfjorden. Sci. Rep. 7, 42997. doi:10.1038/srep42997
Ministry of Economy, Trade and Industry (2016). Resource Quantity Assessment of Surface Type Methane Hydrate and Extraction Development Survey. (In Japanese). Available at: https://www.meti.go.jp/committee/summary/0004108/pdf/032_07_00.pdf (Accessed July 27, 2020).
National Institute of Advanced Industrial Science and Technology (2019). Action Plan for Research and Development of Surface Type Methane Hydrate (FY2019-2022). (In Japanese). Available at: https://www.meti.go.jp/shingikai/energy_environment/methane_hydrate/pdf/035_03_00.pdf (Accessed July 27, 2020).
National Institute of Advanced Industrial Science and Technology (2021). What Is Methane Hydrate. (In Japanese). Available at: https://unit.aist.go.jp/georesenv/topic/SMH/methane_hydrate.html (Accessed July 7, 2021).
Niigata University (2016). FY2015 Gas Plume Investigation in Offshore Niigata Prefecture. Niigata: Niigata Prefectural Office.
Riedel, M., Scherwath, M., Römer, M., Veloso, M., Heesemann, M., and Spence, G. D. (2018). Distributed Natural Gas Venting Offshore along the Cascadia Margin. Nat. Commun. 9 (1). doi:10.1038/s41467-018-05736-x
Römer, M., Riedel, M., Scherwath, M., Heesemann, M., and Spence, G. D. (2016). Tidally Controlled Gas Bubble Emissions: A Comprehensive Study Using Long-Term Monitoring Data from the NEPTUNE Cabled Observatory Offshore Vancouver Island. Geochem. Geophys. Geosyst. 17 (9), 3797–3814. doi:10.1002/2016gc006528
Shipley, T. H., and Didyk, B. M. (1982). Occurrence of Methane Hydrates Offshore Southern Mexico. Initial Reports. Deep Sea Drilling Project 66, 547–555. doi:10.2973/dsdp.proc.66.120.1982
Shipley, T. H., Houston, M. H., Richard, T., Buffler, F., Jeanne, S. J., et al. (1979). Seismic Reflection Evidence for the Widespread Occurrence of Possible Gas-Hydrate Horizons on continental Slopes and Rises. Am. Assoc. Pet. Geologist Bull. 63, 2204–2213. doi:10.1306/2f91890a-16ce-11d7-8645000102c1865d
Skarke, A., Ruppel, C., Kodis, M., Brothers, D., and Lobecker, E. (2014). Widespread Methane Leakage from the Sea Floor on the Northern US Atlantic Margin. Nat. Geosci 7, 657–661. doi:10.1038/ngeo2232
Veloso, M., Greinert, J., Mienert, J., and De Batist, M. (2015). A New Methodology for Quantifying Bubble Flow Rates in Deep Water Using Splitbeam Echosounders: Examples from the A Rctic Offshore NW‐ S Valbard. Limnol. Oceanogr. Methods 13, 267–287. doi:10.1002/lom3.10024
Weber, T. C., Mayer, L., Kevin, J., Beaudoin, J., Rzhanov, Y., and Lovalvo, D. (2014). Acoustic Estimates of Methane Gas Flux from the Seabed in a 6000 Km2region Inthe Northern Gulf of Mexico. Available at: https://agupubs.onlinelibrary.wiley.com/doi/full/10.1002/2014GC005271 (Accessed July 7, 2021).
Keywords: methane hydrate, methane plume, quantitative echo sounder, target position, beam width, footprint, methane seep mouth, multi beam sonar
Citation: Aoyama C and Maeda N (2021) Proposed Methodology to Quantify the Amount of Methane Seepage by Understanding the Correlation Between Methane Plumes and Originating Seeps. Front. Earth Sci. 9:589399. doi: 10.3389/feart.2021.589399
Received: 30 July 2020; Accepted: 21 September 2021;
Published: 06 October 2021.
Edited by:
Ira Leifer,Reviewed by:
Benjamin Phrampus, United States Naval Research Laboratory, United StatesCopyright © 2021 Aoyama and Maeda. This is an open-access article distributed under the terms of the Creative Commons Attribution License (CC BY). The use, distribution or reproduction in other forums is permitted, provided the original author(s) and the copyright owner(s) are credited and that the original publication in this journal is cited, in accordance with accepted academic practice. No use, distribution or reproduction is permitted which does not comply with these terms.
*Correspondence: Chiharu Aoyama, Y2FveWFtMEBrYWl5b2RhaS5hYy5qcA==
Disclaimer: All claims expressed in this article are solely those of the authors and do not necessarily represent those of their affiliated organizations, or those of the publisher, the editors and the reviewers. Any product that may be evaluated in this article or claim that may be made by its manufacturer is not guaranteed or endorsed by the publisher.
Research integrity at Frontiers
Learn more about the work of our research integrity team to safeguard the quality of each article we publish.