 Michael Ochola1
 Sylvia Kiwuwa-Muyingo1*
 Tathagata Bhattacharjee2
 David Amadi2
 Maureen Ng’etich1Damazo Kadengye1Henry Owoko1Boniface Igumba1Jay Greenfield3
 Jim Todd2Agnes Kiragga1,4 for INSPIRE Network
- 1Data Science Program, African Population and Health Research Center (APHRC), Nairobi, Kenya
- 2Department of Population Health, Faculty of Epidemiology and Population Health, London School of Hygiene and Tropical Medicine, University of London, London, United Kingdom
- 3Machine Learning (AI and ML), Committee on Data of the International Science Council (CODATA), Paris, France
- 4Implementation Network for Sharing Population Information from Research Entities (INSPIRE Network), Nairobi, Kenya
Background: Observational health data are collected in different formats and structures, making it challenging to analyze with common tools. The Observational Medical Outcome Partnership (OMOP) Common Data Model (CDM) is a standardized data model that can harmonize observational health data.
Objective: This paper demonstrates the use of the OMOP CDM to harmonize COVID-19 sero-surveillance data from the Nairobi Urban Health and Demographic Surveillance System (HDSS).
Methods: In this study, we extracted data from the Nairobi Urban HDSS COVID-19 sero-surveillance database and mapped it to the OMOP CDM. We used open-source Observational Health Data Sciences and Informatics (OHDSI) tools like WhiteRabbit, RabbitInAHat, and USAGI. The steps included data profiling (scanning), mapping the vocabularies using the offline USAGI and online ATHENA, and designing the extract, transform, and load (ETL) process using RabbitInAHat. The ETL process was implemented using Pentaho Data Integration community edition software and structured query language (SQL). The target OMOP CDM can now be used to analyze the prevalence of COVID-19 antibodies in the Nairobi Urban HDSS population.
Results: We successfully mapped the Nairobi Urban HDSS COVID-19 sero-surveillance data to the OMOP CDM. The standardized dataset included information on demographics, COVID-19 symptoms, vaccination, and COVID-19 antibody test results.
Conclusions: The OMOP CDM is a valuable tool for harmonizing observational health data. Using the OMOP CDM facilitates the sharing and analysis of observational health data, leading to a better understanding of disease conditions and trends and improving evidence-based population health strategies.
1 Introduction
Population health studies play a key role in understanding specific populations or groups’ health status, determinants, and outcomes. Analyzing data from different sources is challenging due to inconsistencies in structures, formats, definitions, standards, coding systems, and database platforms. Data harmonization is a key process that addresses these challenges by standardizing and transforming data to enable seamless integration and enhanced interoperability and ensure consistency across diverse datasets for more accurate analysis, informed decision-making, and a unified understanding of information across different systems for meaningful comparisons and analyses. The extract, transform, and load (ETL) pipeline is the process embedded into the workflow, which does the standardization and transformation tasks to put data in a common standard, referred to as a common data model.
Population health data often include various indicators beyond clinical records, such as socioeconomic factors, and environmental and lifestyle data. The data may need to be aggregated, and granularity of data such as community-level factors and integrating population health outcomes are not comprehensively addressed in traditional clinical data for which OMOP CDM was intended. Adapting this to OMOP CDM to incorporate diverse data types introduces complexities. Extension to the OMOP Common Data Model is necessary to address these challenges, and interoperability with other data standards and models used in population health research must be carefully considered. Data harmonization is vital in population health studies. It improves data quality (1), enhances comparability across studies (2, 3), and facilitates large-scale analyses. This paper provides insights into the data harmonization process essential for transforming data from a COVID-19 Sero-surveillance at Nairobi Urban Health and Demographic Surveillance (NUHDSS) area into Observational Medical Outcomes Partnership (OMOP) Common Data Model (CDM), which is an open community data standard, intended to standardize the structure, format, and content of observational clinical data and to enable practical and effective analyses that can produce consistent evidence for better policymaking. This paper highlights the vital re-orientation process performed to adopt and use the clinical-based OMOP CDM in population studies.
1.1 Observational health data sciences and informatics (OHDSI)
The availability of medical records, surveys, population surveillance data, and other real-world data from the field of medical care and public health systems gives many opportunities for research and evidence-based understanding. However, utilizing the potential of such vast data requires standardized methods, collaborative efforts, and easy-to-access analytical tools. The Observational Health Data Sciences and Informatics (OHDSI) addresses many of these challenges and assists in large-scale analytics of observational health data. OHDSI is an international, multi-stakeholder, interdisciplinary, open-source collaborative that aims to improve health by empowering a community to collaboratively generate evidence that promotes better health decisions and better care (4).
OHDSI focuses on open science by promoting transparency and reproducibility in research. Specifically, OHDSI supports the development of open-source software tools for the community. The Observational Medical Outcomes Partnership (OMOP) Common Data Model (CDM) is one such effort, which facilitates the harmonization of heterogeneous health data using standardized terminologies and common data models. The common data model and standardized vocabularies set the stage for uniform analytics (5, 6).
To achieve the common data structure and leverage the use of big data analytics tools, building ETL (extract, transform, and load) is necessary for extracting source data, transforming it into a standard format of the OMOP CDM data structure, and loading it into the OMOP CDM database (7). The extract, transform, and load process are a series of tasks designed to align source data with the structure and terminology of the target database. Supporting data harmonization typically involves two consecutive phases, each handled by professionals with distinct expertise. During the first phase, subject matter experts familiar with the source data (e.g., EHR, claims, population health and mental health data) identify the necessary data elements for extraction and define mappings between the source and target data elements. This step demands expertise in both source and target data, encompassing domain knowledge of local population health implementations and terminologies. In the second phase, database programmers execute data transformation methods and schema mappings to load data into the OMOP CDM-ready tables.
1.2 The source data
The study utilized archived secondary data from the African Population and Health Research Center (APHRC) online microdata portal (https://microdataportal.aphrc.org/index.php/catalog/138), it provides metadata and a high-level overview of various research outputs within the center, datasets can be accessible for further research by requesting the portal managers. Data were collected within Nairobi Urban Health and Demographic Surveillance Systems (NUHDSS). The NUHDSS is a pioneer in urban-based HDSS sites. It was created to fill an evidence gap in understanding the challenges stemming from rapid urbanization, the growing concentration of the urban poor, and health status within two informal settlements (Korogocho and Viwandani) in 2002 (8).
The data was collected as part of a COVID-19 seroprevalence survey within representative samples of the Kenyan population approximately two years into the COVID-19 pandemic and approximately one year after the rollout of the national COVID-19 vaccination program (9).
The primary sero-surveillance study sample comprised 870 individuals randomly selected from the NUHDSS database, reflecting diverse socio-demographic characteristics, from whom the blood samples were collected to ascertain the presence or absence of COVID-19 antibodies. In total, the dataset had approximately 140 variables, and a subset (60%) of these variables have been harmonized into OMOP CDM based on the success of source-to-target mapping i.e., from the source codes to OMOP CDM vocabularies using the ATHENA vocabulary repository, and the availability of concepts in respective vocabulary sets.
The dataset was anonymized before uploading into the micro-data portal in adherence with data protection guidelines. Additionally cleaning, quality checks, and descriptive statistical analysis were performed before the start of the actual harmonization pipeline as shown on Table 1. It is important to highlight that during the initial implementation of sero-surveillance at the primary data collection stage, the researchers adhered to ethical standards and approvals as expected by Kenya's research governing body (10).
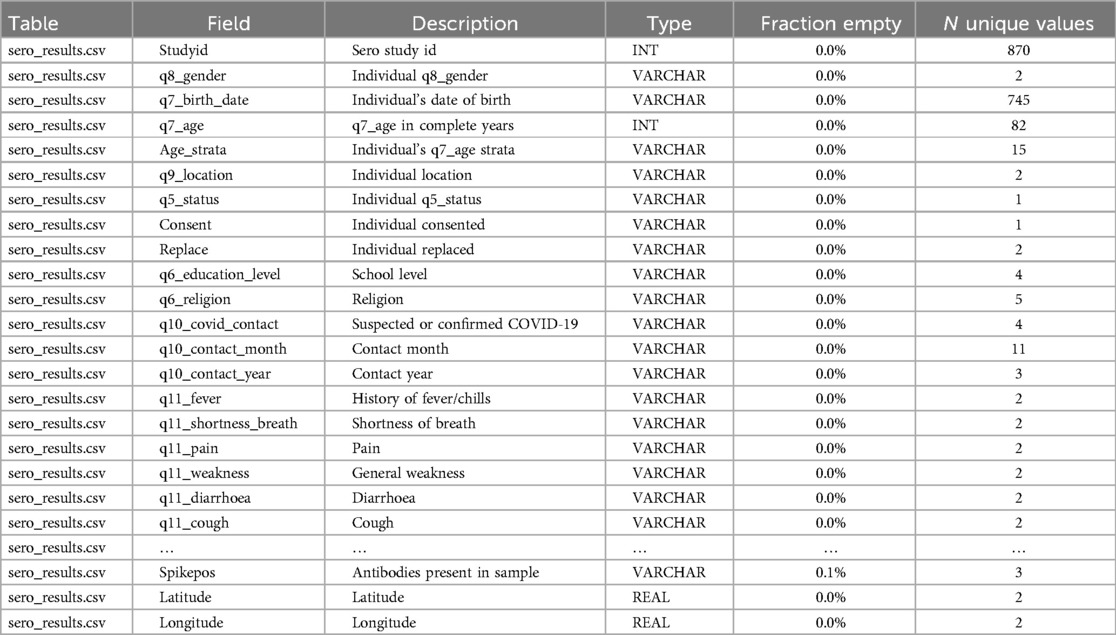
Table 1. Overview of NUHDSS COVID-19 sero-survey data scan report.
With a conventional basic descriptive analysis of the data. It showed the majority of study participants were under the age of 35, which is typical of informal settlements, with males slightly leading. Overall, nearly half of the respondents had completed primary school as their highest level of education as shown on Table 2.
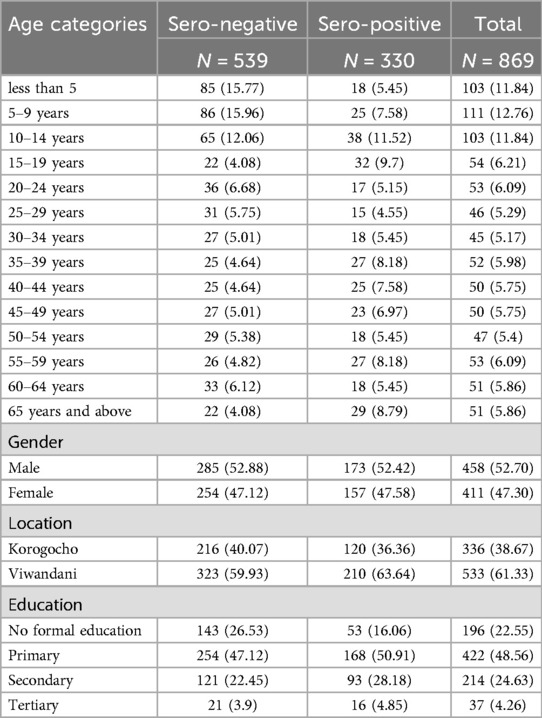
Table 2. Sero-prevalence by various demographics characteristics.
2 Methods
2.1 Designing the data harmonization workflow using OHDSI tools
Figure 1 shows data harmonization and integration workflows for the NUHDSS data. The first step in the data harmonization pipeline was an exploratory data analysis (EDA). In the OHDSI suite of tools, WhiteRabbit performs scanning and profiling of the source data. This stage yielded a comprehensive overview of the source data content, encompassing details like data types, occurrences of missing data, data dimension, and summary statistics of numeric variables. WhiteRabbit accommodates various data sources, spanning from flat files to relational databases. As a result, seamless integration with any source data is facilitated (11). EDA was followed by “mapping”, also referred to as ETL design. During mapping a scan report produced by WhiteRabbit was uploaded into Rabbit-in-a-Hat. This tool is Java-based and platform-independent, serving as a valuable aid in the creation of the ETL specification document. This step builds upon the implementation guide already generated by the USAGI tool, which mapped source codes to the standard OMOP CDM codes (12–14).
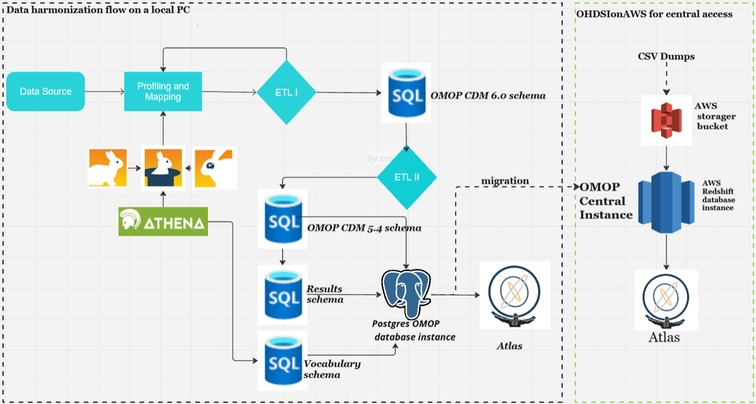
Figure 1. Harmonization pipeline architecture for NUHDSS COVID-19 sero-survey.
Figure 2 shows a detailed mapping of the source data to OMOP CDM schema version 6.0 respective tables as defined by the source data variables. Some of the notable tables mapped include person, observation_period, visit_occurrence, visit_detail, condition_occurrence, drug exposure, measurement, observation, specimen, drug_era, dose_era, condition_era, location, provider, cdm_source, and metadata (15).
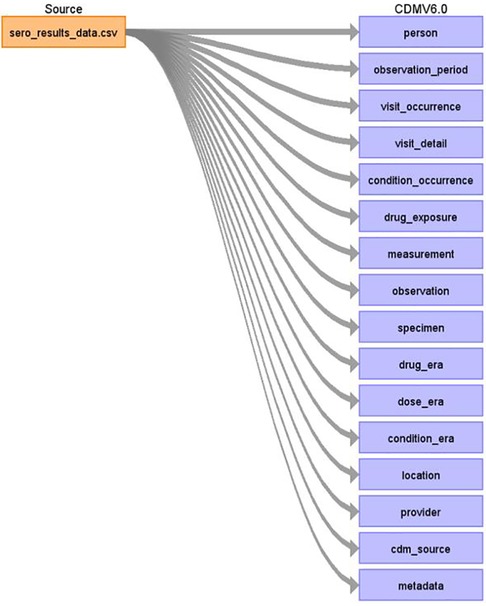
Figure 2. High-level overview of NUHDSS COVID-19 sero-survey data mapped to OMOP CDM tables.
It is best practice to anonymize data before harmonization. As stated earlier, sero-survey data was anonymized. During the anonymization, key personal identifiers had been removed from the data prior to uploading on the APHRC microdata portal. During mapping, the first table mapped to the OMOP CDM was the person table which contained information regarding the patient's gender, date of birth, ethnicity, race, and other variables like location code, provider code, and care_site code obtained through linkage with other tables within the OMOP CDM (16). Figure 3 shows how a subset of sero-survey data was mapped to the person table. Study_id or row unique identifier in the source data was mapped to person_source_value, gender was mapped to gender_concept_id which has standardized codes for both males and females. Lastly, the birth_date variable was used to generate within the OMOP CDM person table year_of_birth, month_of_birth and day_of_birth.
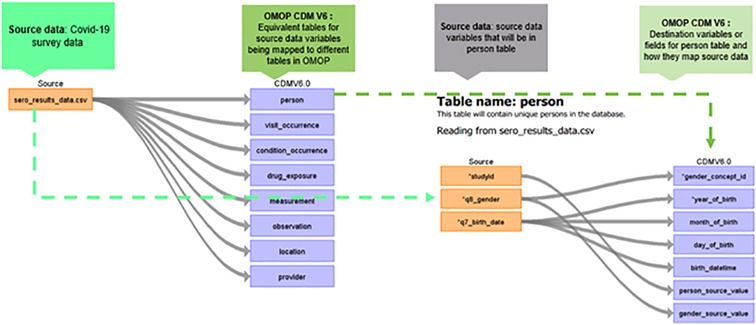
Figure 3. Mapping from source data to OMOP CDM person table.
Figure 3 describes the mapping from the source to the OMOP CDM's person table. This was an important first step in mapping as the study participants’ demographic details are populated into this table.
The third stage involved downloading the OHDSI vocabulary into the local database instance. ATHENA, an online OHDSI vocabulary repository (12), was utilized to incorporate the current vocabulary version in preparation for ETL development. This process involved populating a vocabulary schema in a PostgreSQL database from the OHDSI ATHENA repository. The applicable standard vocabularies were obtained as comma-separated (csv) files and then loaded into the corresponding tables within the vocabulary schema using the SQL COPY command. Typically, this is a one-time task, unless there are updates to the ATHENA vocabularies. The mapping process generated an ETL specification document used for ETL development.
Figure 4 is an extract of an ETL specification document for the person table depicting the code-level mappings. The process above was replicated for all the tables, and the resulting ETL specification document was passed on for actual ETL development.
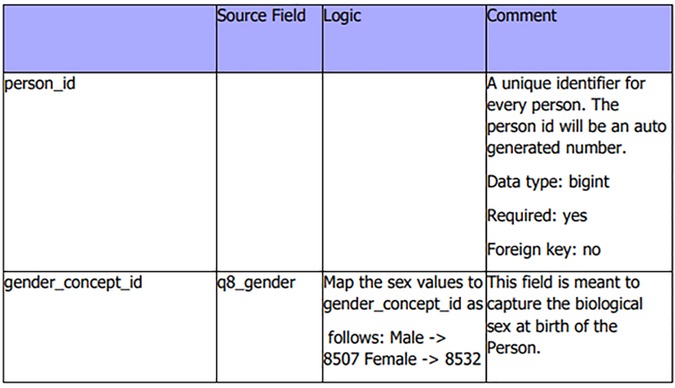
Figure 4. ETL specification document extract from person table with some variables.
The mapping process for sero-survey data to the OMOP CDM schema encountered some challenges. Some variables representing vaccines given to young children and socioeconomic status (SES) lacked clearly defined standard codes or concepts within the OHDSI vocabulary and, therefore, were mapped to concept code zero as the OHDSI standard for missing concepts. This problem is not unique to this dataset mainly because concepts primarily developed to annotate clinical data in Europe and America will need localization when it comes to population health data collected on the African content (17).
An ETL process involves combining data from multiple sources into a centralized database (18). Data is extracted from different sources and stored on a temporary schema. A transform step will then consolidate the raw data in the temporary schema to prepare it for the OMOP CDM respective tables, either through data deduplication, data format revisions to match target schema, splitting, cleansing, encryption, and joining data. Lastly, in the loading step, transformed data is moved from the staging schema to the target database schema. ETL uses a set of rules to clean and structure the raw data, making it ready for data analysis and machine learning applications (19).
Before the actual ETLs were executed on the survey data, additional exploratory data analysis (EDA) was conducted to understand the demographics of the source data. This proved useful during the quality checks on the final ETL, where both EDAs were compared. The actual ETL workflow for the NUHDSS COVID-19 sero-survey started with data extraction. Here the archived data from the micro-data portal was read into an R program.
R is a programming language and environment specifically designed for statistical computing and graphics. It provides a wide variety of statistical and graphical techniques, making it a popular choice for data analysis and visualization. The data was converted into comma-separated values for ease of use within the ETL suite of tools. Pentaho data integration (PDI) and structured query language (SQL) were used to orchestrate the workflows that took the csv file and pipelined it to the OMOP CDM ready tables. Pentaho Data Integration, commonly known as PDI and previously referred to as Kettle, is an ETL tool encompassing a suite of software applications tailored for creating data workflows. These workflows can be executed either within server environments or as standalone processes. PDI is characterized by two primary components: Kitchen, serving as a runner for jobs and transformations, and Spoon, a graphical user interface specifically designed for the creation and configuration of these jobs and transformations (20). With SQL all the OMOP CDM table structures are generated using already available table creation scripts provided by the OHDSI community, covering at least major database engines both for on-premises and cloud platforms (21, 22). In addition, the source dataset schema is created mainly to serve as a staging database.
So, the source csv data was read into a table created within the staging schema. Transformation of data in the staging database using the SQL scripts and a combination of PDI transforms and jobs created table structures in alignment with the respective OMOP CDM tables. The provider, location, and care site tables were generated and loaded, followed by a person, visit occurrence, visit detail, condition occurrence, measurement, observation, specimen, drug exposure, observation_period, condition_era, drug_era, and dose_era as shown on Figure 5. PostgreSQL was used here as the target database engine, although OMOP CDM supports several database engines, therefore promoting interoperability as an integral component of the Findable Accessible Interoperable, and Reusable (FAIR) principle in data systems.
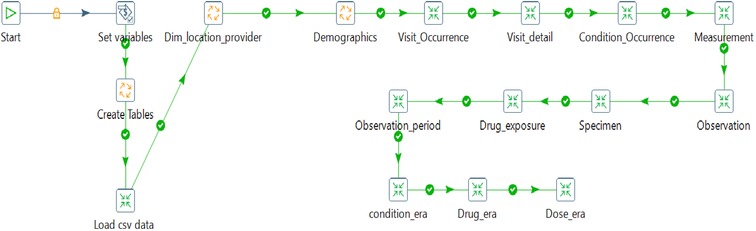
Figure 5. Pentaho ETL pipeline with various transformations and jobs moving data to OMOP CDM v6.0.
Harmonized data within the OMOP CDM version 6 was migrated to CDM version 5.4 to allow for backward compatibility with the OHDSI suite of tools. The migration involved loading data from OMOP CDM 6.0 tables to respective OMOP 5.4 tables, which required either data type alignment, dropping column(s), and removing the required attribute on the date and datetime fields. This was necessary to allow usage of the OHDSI suite of tools currently supporting OMOP CDM versions 5.4 and 5.3. The data harmonization pipeline, along with detailed documentation of the process, is available on GitHub (https://github.com/APHRC-DSE/Sero-data-to-OMOP-ETL).
2.2 Data quality checks
After a successful ETL process, quality assurance of the resulting common data model was undertaken. A team verified an ETL design document to ensure that data was mapped to the appropriate OMOP CDM tables and fields. This verification resulted in documentation of the design phase. Next, SQL scripts, Pentaho transformations, OMOP CDM tables, and the data were verified for any mistakes or incorrect mappings.
After harmonization, data quality metrics were produced. They encompassed various aspects, including the comparison of the total number of individuals in the OMOP CDM person table with the source data, and the same number of distinct individuals reported in exposure and era tables. The last quality check on the harmonized data was implemented using the OHDSI suite of tools; ACHILLES and data quality dashboard (DQD) (23). DQD is an open-source R library supported in OMOP CDM versions 5.4, 5.3, and 5.2. It runs a series of systematic checks on the OMOP CDMready database instance and supports multiple relational database management systems (RDBMS) including PostgreSQL, Microsoft SQL server, Google Big Query and Amazon Redshift popular for cloud deployment using the OHDSI on cloud architecture. The tool applied over 3300 quality checks on the OMOP CDM database, grouped into conformance, completeness, and plausibility checks. For conformance checks the aim was to ensure data adhered to the specified format and standards. Completeness checked if data values were present, and plausibility checked if a given measurement and a given unit based on context were valid. Notable errors checked were: any records after death date, persons lacking recorded year of birth, missing gender, and more. The approach to correct the identified quality issues involved examining the source data or ETL pipeline to determine the appropriate fix (24–26).
Data analysis on OMOP CDM-ready tables took three forms. First, the OHDSI ACHILLES R library was used to characterize the data. Secondly, OHDSI ATLAS, a low code data analysis workbench, was used to produce descriptive statistics on persons and various symptom distributions. Thirdly, specialized libraries and analysis packages tailored to individual OMOP CDM instances expands the range of possibilities for developing custom algorithms for descriptive and inferential analysis. In this study, we used a combination of these approaches (27).
3 Results
As previously specified, a quality assessment for the process and the output was carried out using the data quality dashboard (DQD), this provided a mechanism to check the resulting OMOP CDM for conformance, completeness, and plausibility, and set the stage for ATLAS visualization. Data quality assessment through the dashboard in Table 3 showed the resultant quality of the ETL process that generated OMOP CDM data had a 98% quality score. Additional quality checks to ensure data reliability and consistency were carried out, cross-referencing OMOP CDM aggregates against raw data aggregates from the EDA.
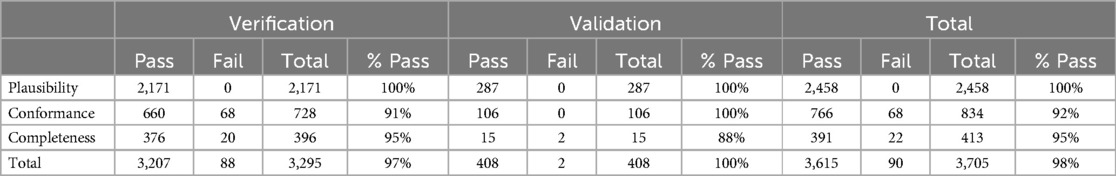
Table 3. Data quality dashboard for harmonized COVID-19 sero-survey.
Figure 6 shows ATLAS dashboard reports and visualizations of the harmonized sero-survey data. We used the data sources module in ATLAS to explore database characteristics created by ACHILLES. The harmonized sero-survey data comprised 870 individuals, with 52% of respondents being males. The age distribution ranged from 0 to 70 years, with a predominant majority below 35 years, a characteristic common in most informal settlements.
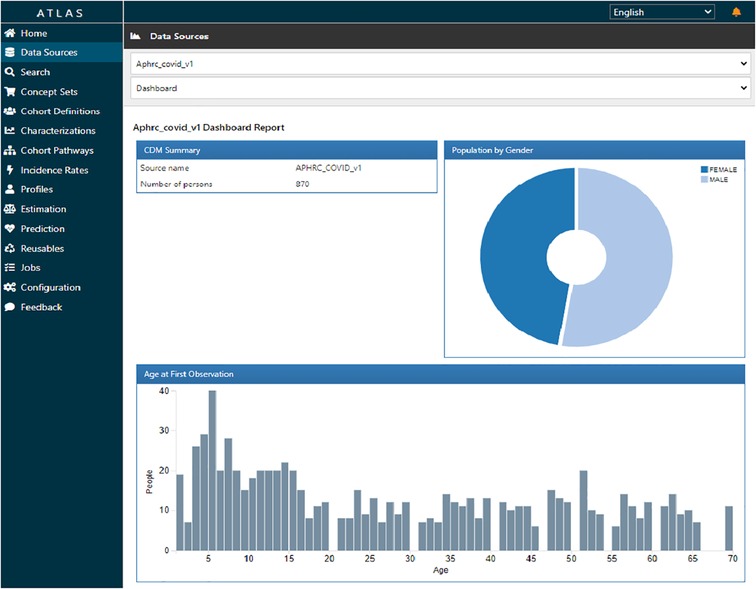
Figure 6. ATLAS dashboard report for harmonized COVID-19 sero-survey.
Figure 7 shows the prevalence of various conditions observed. Notably, a significant number of individuals experienced cough, headache, and fever with a single condition record per person interviewed, this being a cross-sectional study.
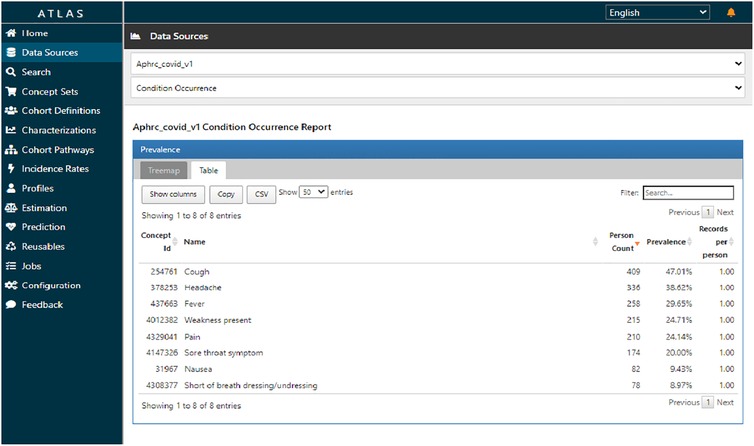
Figure 7. ATLAS condition occurrence report for harmonized COVID-19 sero-survey.
The median number of reported conditions was two, though some individuals reported as many as five conditions, as indicated on Figure 8. This figure suggests that it was likely to have a cough with headache or cough with fever, or any other combination. There was no variation to report on observation and measurement concepts for this data.
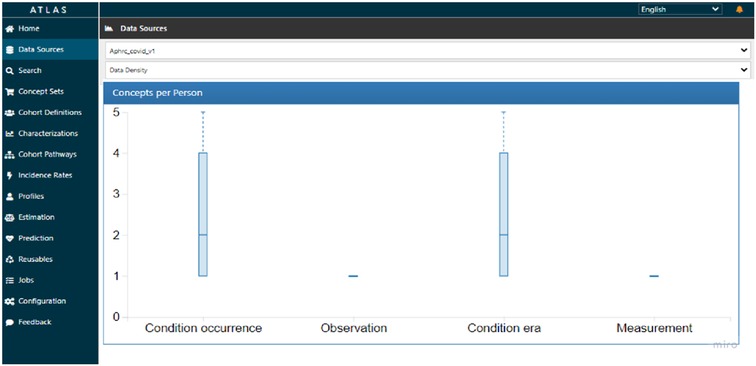
Figure 8. ATLAS data density plot on condition occurrence for harmonized COVID-19 sero-survey.
In addition to utilizing the ATLAS dashboard for visualization, OMOP CDM databases offer the flexibility of programmatic access through widely used data science scripting languages. R was integrated with the OMOP CDMdatabase instance to visualize the proportion of various conditions across age groups as shown in Figure 9.
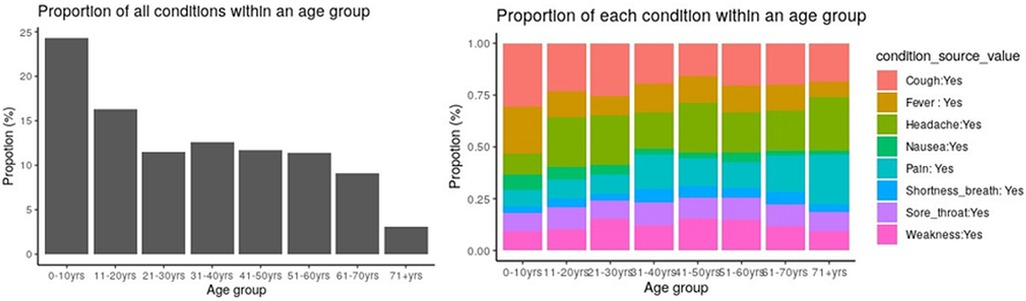
Figure 9. Proportion of conditions across age groups.
The proportion of respondents who tested positive for SARS-CoV-2 antibodies was 39%. The analysis could also be achieved in ATLAS using its point-and-click interface to construct cohorts with particular feature sets. Notably, the analysis of COVID-19 vaccination was omitted due to insufficient data records pertaining to vaccination uptake in the available data.
4 Discussion
Utilizing the OMOP CDM for data harmonization offers numerous benefits, its uniqueness lies in its use of OHDSI vocabularies, which facilitate seamless interoperability with leading health sector vocabulary standards. As long as the necessary vocabularies are supported, studies can be integrated into the OMOP CDM framework. Expanding these vocabularies further extends the potential to harmonize data across a wide range of domains.
In our study, converting COVID-19 sero-surveillance data from the Nairobi Urban HDSS to the OMOP CDM facilitated the uniformity of data, simplifying subsequent analysis through available OHDSI tools and software packages. This harmonization process not only standardized the data but also enhanced its profiling and accessibility for researchers, establishing a shared format for data encoding, structure, and database software. Moreover, it enabled seamless data exploration and visualization through the user-friendly ATLAS interface.
The Data Quality Dashboard (DQD) results showed that the dataset's quality for the OMOP CDM was at 98%, meeting most of the quality checks built into the OHDSI DQD R package. This was the outcome of a successful data migration process from the source to the OMOP CDM: adopting the ETL approach for this migration resulted in high-quality output.
Integrating data into the OMOP CDM, however, comes with its share of challenges, with one of the primary concerns being the inability to completely map all data to a standardized vocabulary from the ATHENA repository. The vocabulary accessible through the ATHENA repository is a continually evolving collection that may lack definitions for numerous conditions across various contexts. These vocabularies are classified into different domains and sets, and they may not perfectly align with every aspect of the source dataset.
More specifically, some variables from the source dataset didn't fit well in the OMOP CDM standardized concepts. A few instances like the work missed due to the infection, some childhood vaccinations like the Penta & BCG along with the household levels variables from the social economic status questionnaire didn't map to the existing standardized concepts in the OMOP CDM. This results into a potential data loss on the final OMOP CDM, which could limit some downstream processes, including visualization, analysis, and modeling referencing such variables.
One viable solution to address this issue involves extending the existing sets by introducing new concepts tailored to different types of studies. The ATHENA vocabulary repository is structured in a hierarchical organization of concepts and classes. Therefore, adding new concepts must be implemented methodically to avoid disrupting this hierarchy. This hierarchy plays an important role in data analysis, especially when using tools like ACHILLES R scripts, and in visualizing the data through the ATLAS interface. In this regard, the Implementation Network for Sharing Population Information from Research Entities (INSPIRE) network is at the forefront of championing the development of vocabulary concepts for population health data within the vocabulary working group OHDSI Africa chapter.
Another challenge encountered during the mapping process from the APHRC COVID-19 sero-surveillance dataset pertained to the restricted availability of variables and values within the source data. This limitation posed hurdles in comprehensively representing and capturing the characteristics of the data, as certain essential variables and values were either absent or insufficiently documented. This challenge highlighted the importance of careful data collection designs to ensure that comprehensive and meaningful insights could be derived from the dataset. Lastly, incomplete data on COVID-19 vaccine uptake hindered further analysis.
5 Future direction
The Implementation Network for Sharing Population Information from Research Entities (INSPIRE) (17), is actively engaged in extending the OMOP CDM to include data elements, particularly concepts, that are not currently captured by the existing ATHENA vocabulary set. This effort aims to improve the CDM's comprehensiveness and facilitate the integration of a broader range of data sources. The process of filling the gaps between the existing terminologies and concepts used for Africa-specific variables like ethnicity, housing conditions, socioeconomic status, etc., and the OMOP CDM vocabularies is ongoing.
Additionally, the INSPIRE team is collaborating closely with ministries across various African nations to secure access to COVID-19 datasets. These datasets will be processed and integrated into the OMOP CDM, enabling deeper analysis and comparisons on a pan-African scale. This initiative holds immense potential for uncovering regional trends, identifying areas of concern, and informing effective public health strategies, through the adoption of federated analytics where analysis algorithms are brought to the data, eliminating the need for physical data sharing.
6 Conclusion
The utilization of the OMOP CDM to harmonize COVID-19 sero-surveillance data from the Nairobi Urban HDSS has proven to be a good experience in mapping surveillance data into a standardized model for observational population health. It achieved data standardization which ensured consistency in data representation, enabling better analysis and data accessibility by adhering to a standard format, facilitating easier retrieval and utilization by different user groups, and opening opportunities for wider collaboration and knowledge sharing. The integration of population demographics with COVID-19 vaccination, and COVID-19 testing data into a standardized format provided a platform for improved analysis and interpretation of public health data. As we continue to work on COVID-19 data, the OMOP CDM will undoubtedly play a crucial role in standardizing it across studies for effective public health strategies. Population health data standardization in Africa is a catalyst for improving health outcomes. By addressing challenges and investing in standardization, African countries can build a robust health data ecosystem that enhances decision making, drives innovation, and strengthens the continent's readiness to tackle emerging health challenges.
Data availability statement
The datasets presented in this article are not readily available because the dataset is licensed and available according to the license agreement. Requests to access the datasets should be directed to the APHRC data portal at: https://microdataportal.aphrc.org/index.php/catalog/138.
Ethics statement
The study has received ethical approval from AMREF Health Africa's Ethics and Scientific Review Committee ESRC, Kenya (Ref. ESRC P952/2021 on 30th April 2021). The study has also received permission to carry out the study from the National Commission for Science, Technology and Innovation (NACOSTI) (License No: NACOSTI/P/21/10821 on 16th June 2021).
Author contributions
MO: Conceptualization, Data curation, Formal Analysis, Methodology, Software, Validation, Visualization, Writing – original draft, Writing – review & editing. SK-M: Conceptualization, Funding acquisition, Investigation, Methodology, Resources, Supervision, Validation, Writing – original draft, Writing – review & editing. TB: Conceptualization, Data curation, Formal Analysis, Methodology, Software, Supervision, Validation, Visualization, Writing – original draft, Writing – review & editing. DA: Data curation, Validation, Writing – review & editing. MN: Writing – review & editing. DK: Writing – review & editing. HO: Writing – review & editing. BI: Writing – review & editing. JG: Formal Analysis, Methodology, Validation, Writing – review & editing. JT: Conceptualization, Formal Analysis, Funding acquisition, Investigation, Methodology, Validation, Writing – review & editing. AK: Conceptualization, Formal Analysis, Investigation, Methodology, Supervision, Validation, Writing – review & editing.
Funding
The author(s) declare financial support was received for the research, authorship, and/or publication of this article. This work was supported by the IDRC/SIDA funding for the Global South AI4COVID programs under Grant Agreement for Grant No. 109622-001.
Conflict of interest
The authors declare that the research was conducted in the absence of any commercial or financial relationships that could be construed as a potential conflict of interest.
Publisher's note
All claims expressed in this article are solely those of the authors and do not necessarily represent those of their affiliated organizations, or those of the publisher, the editors and the reviewers. Any product that may be evaluated in this article, or claim that may be made by its manufacturer, is not guaranteed or endorsed by the publisher.
References
1. Reimer AP, Milinovich A, Madigan EA. Data quality assessment framework to assess electronic medical record data for use in research. Int J Med Inform. (2016) 90:40–7. doi: 10.1016/j.ijmedinf.2016.03.006
2. Cacace M, Ettelt S, Mays N, Nolte E. Assessing quality in cross-country comparisons of health systems and policies: towards a set of generic quality criteria. Health Policy. (2013) 112(1–2):156–62. doi: 10.1016/j.healthpol.2013.03.020
3. Hripcsak G, Shang N, Peissig PL, Rasmussen LV, Liu C, Benoit B, et al. Facilitating phenotype transfer using a common data model. J Biomed Inform. (2019) 96:2–3. doi: 10.1016/j.jbi.2019.103253
4. OHDSI. Observational Health Data Sciences and Informatics (OHDSI). Available online at: https://ohdsi.org/ (accessed September 14, 2023)
5. Lynch KE, Deppen S, Duvall S, Viernes B, Cao A, Park D, et al. Dynamic-ETL: a hybrid approach for health data extraction, transformation and loading. Appl Clin Inform. (2017) 17(5):1–12. doi: 10.1186/s12911-017-0532-3
6. Khera R, Schuemie MJ, Lu Y, Ostropolets A, Chen R, Hripcsak G, et al. Large-scale evidence generation and evaluation across a network of databases for type 2 diabetes mellitus (LEGEND-T2DM): a protocol for a series of multinational, real-world comparative cardiovascular effectiveness and safety studies. BMJ Open. (2022) 12(6):e057977–16. doi: 10.1136/bmjopen-2021-057977
7. OHDSI. The Book of OHDSI. Observational Health Data Sciences and Informatics (OHDSI). Available online at: https://ohdsi.github.io/TheBookOfOhdsi/CommonDataModel.html#person (accessed August 30, 2023)
8. APHRC. APHRC Online Microdata Library. African Population and Health Research Center (APHRC). Available online at: https://microdataportal.aphrc.org (accessed August 30, 2023)
9. Kagucia EW, Ziraba AK, Nyagwange J, Kutima B, Kimani M, Akech D, et al. SARS-CoV-2 seroprevalence and implications for population immunity: evidence from two health and demographic surveillance system sites in Kenya, February–June 2022. medRXiv [Preprint]. (2022):6–8. doi: 10.1101/2022.10.10.22280824
10. Etyang AO, Adetifa I, Omore R, Misore T, Ziraba AK, Ng'oda MA, et al. SARS-CoV-2 seroprevalence in three Kenyan health and demographic surveillance sites, December 2020–May 2021. PLOS Global Public Health. (2022) 2(8):e0000883. doi: 10.1371/journal.pgph.0000883
11. OHDSI. WhiteRabbit for ETL Design. Observational Health Data Sciences and Informatics (OHDSI). Available online at: https://www.ohdsi.org/analytic-tools/whiterabbit-for-etl-design/ (accessed August 30, 2023)
12. OHDSI. Athena. Observational Health Data Sciences and Informatics (OHDSI). Available online at: https://athena.ohdsi.org/search-terms/start (accessed August 30, 2023)
13. OHDSI. Usagi. Observational Health Data Sciences and Informatics (OHDSI). Available online at: https://www.ohdsi.org/analytic-tools/usagi/ (accessed August 30, 2023)
14. OHDSI. Rabbit in a Hat. Observational Health Data Sciences and Informatics (OHDSI). Available online at: https://ohdsi.github.io/WhiteRabbit/RabbitInAHat.html (accessed August 30, 2023)
15. OHDSI. OMOP CDM v6.0. Observational Health Data Sciences and Informatics (OHDSI). Available online at: https://ohdsi.github.io/CommonDataModel/cdm60.html (accessed August 30, 2023)
16. OHDSI. OHDSI/CommonDataModel. Observational Health Data Sciences and Informatics (OHDSI). Available online at: https://github.com/OHDSI/CommonDataModel/tree/v5.4.0/inst/ddl/5.4 (accessed August 30, 2023)
17. Kiwuwa-Muyingo S, Todd J, Bhattacharjee T, Taylor A, Greenfield J. Enabling data sharing and utilization for African population health data using OHDSI tools with an OMOP-common data model. Front Public Health. (2023) 11:2–4. doi: 10.3389/fpubh.2023.1116682
18. Yu Y, Zong N, Wen A, Liu S, Stone DJ, Knaack D, et al. Developing an ETL tool for converting the PCORnet CDM into the OMOP CDM to facilitate the COVID-19 data integration. J Biomed Inform. (2022) 127:104002. doi: 10.1016/j.jbi.2022.104002
19. Nishimwe A, Ruranga C, Musanabaganwa C, Mugeni R, Semakula M, Nzabanita J, et al. Leveraging artificial intelligence and data science techniques in harmonizing, sharing, accessing and analyzing SARS-COV-2/COVID-19 data in Rwanda (LAISDAR project): study design and rationale. BMC Med Inform Decis Mak. (2022) 22(1):2–5. doi: 10.1186/s12911-022-01965-9
20. Hitachi. Pentaho Data Integration. Hitachi Vantara LLC. Available online at: https://www.hitachivantara.com/en-us/products/pentaho-platform/data-integration-analytics.html (accessed August 30, 2023)
21. OHDSI. OHDSI/CommonDataModel. Observational Health Data Sciences and Informatics (OHDSI). Available online at: https://github.com/OHDSI/CommonDataModel (accessed August 30, 2023)
22. OHDSI. Standardized Data: The OMOP Common Data Model. Observational Health Data Sciences and Informatics (OHDSI). Available online at: https://www.ohdsi.org/data-standardization/ (accessed June 30, 2023)
23. Biedermann P, Ong R, Davydov A, Orlova A, Solovyev P, Sun H, et al. Standardizing registry data to the OMOP common data model: experience from three pulmonary hypertension databases. BMC Med Res Methodol. (2021) 21(1):3–7. doi: 10.1186/s12874-021-01434-3
24. Blacketer C, Voss E, Defalco F, Hughes N, Schuemie M, Moinat M, et al. Using the data quality dashboard to improve the ehden network. Appl Sci. (2021) 11(24):6–8. doi: 10.3390/app112411920
25. Kahn MG, Callahan T, Barnard J, Bauck A, Brown J, Davidson B, et al. A harmonized data quality assessment terminology and framework for the secondary use of electronic health record data. eGEMs. (2017) 4(1):18. doi: 10.13063/2327-9214.1244
26. Etyang AO, Lucinde R, Karanja H, Kalu C, Mugo D, Nyagwange J, Gitonga J, et al. Seroprevalence of antibodies to severe acute respiratory syndrome coronavirus 2 among healthcare workers in Kenya. Clin Infect Dis. (2022) 74(2):288–93. doi: 10.1093/cid/ciab346
Keywords: observational health data, OMOP CDM, population health data, COVID-19, sero-surveillance, Nairobi Urban HDSS, ETL, Africa
Citation: Ochola M, Kiwuwa-Muyingo S, Bhattacharjee T, Amadi D, Ng’etich M, Kadengye D, Owoko H, Igumba B, Greenfield J, Todd J and Kiragga A (2025) Harmonizing population health data into OMOP common data model: a demonstration using COVID-19 sero-surveillance data from Nairobi Urban Health and Demographic Surveillance System. Front. Digit. Health 7:1423621. doi: 10.3389/fdgth.2025.1423621
Received: 26 April 2024; Accepted: 8 January 2025;
Published: 28 January 2025.
Edited by:
Hong Sun, Jiaxing University, ChinaReviewed by:
David M. A. Mehler, University Hospital RWTH Aachen, GermanyMarcin Rządeczka, Marie Curie-Sklodowska University, Poland
Emel Seker, University of Arkansas Medical Center, United States
Copyright: © 2025 Ochola, Kiwuwa-Muyingo, Bhattacharjee, Amadi, Ng’etich, Kadengye, Owoko, Igumba, Greenfield, Todd and Kiragga. This is an open-access article distributed under the terms of the Creative Commons Attribution License (CC BY). The use, distribution or reproduction in other forums is permitted, provided the original author(s) and the copyright owner(s) are credited and that the original publication in this journal is cited, in accordance with accepted academic practice. No use, distribution or reproduction is permitted which does not comply with these terms.
*Correspondence: Sylvia Kiwuwa-Muyingo, c211eWluZ29AYXBocmMub3Jn