 Luca Cossu
 Giacomo Cappon
 Andrea Facchinetti
- Department of Information Engineering, University of Padova, Padova, Italy
Introduction: The incorporation of health-related sensors in wearable devices has increased their use as essential monitoring tools for a wide range of clinical applications. However, the signals obtained from these devices often present challenges such as artifacts, spikes, high-frequency noise, and data gaps, which impede their direct exploitation. Additionally, clinically relevant features are not always readily available. This problem is particularly critical within the H2020 BRAINTEASER project, funded by the European Community, which aims at developing models for the progression of Multiple Sclerosis (MS) and Amyotrophic Lateral Sclerosis (ALS) using data from wearable devices.
Methods: The objective of this study is to present the automated pipeline developed to process signals and extract features from the Garmin Vivoactive 4 smartwatch, which has been chosen as the primary wearable device in the BRAINTEASER project. The proposed pipeline includes a signal processing step, which applies retiming, gap-filling, and denoising algorithms to enhance the quality of the data. The feature extraction step, on the other hand, utilizes clinical partners' knowledge and feedback to select the most relevant variables for analysis.
Results: The performance and effectiveness of the proposed automated pipeline have been evaluated through pivotal beta testing sessions, which demonstrated the ability of the pipeline to improve the data quality and extract features from the data. Further clinical validation of the extracted features will be performed in the upcoming steps of the BRAINTEASER project.
Discussion: Developed in Python, this pipeline can be used by researchers for automated signal processing and feature extraction from wearable devices. It can also be easily adapted or modified to suit the specific requirements of different scenarios.
1 Introduction
Multiple Sclerosis (MS) and Amyotrophic Lateral Sclerosis (ALS) are chronic conditions characterized by a progressive decline in motor and cognitive neurological functions. Although they are distinct diseases, they present similar challenges for patients and the healthcare system (1). Individuals with either condition must transition between receiving care in clinical facilities and managing daily care at home to monitor disease progression and treat acute episodes. This constant physical and psychological burden, coupled with an uncertain future, is shared by both patient groups. Clinicians, on the other hand, require tools that can effectively support patients with ALS and MS by providing personalized therapeutic decisions based on the patient’s conditions, identifying critical interventions, and providing insight into the status of the disease and the overall clinical situation. In recent years, significant efforts have been made to estimate the progression of ALS and MS and to develop tools that can assist both patients and clinicians in managing the disease (2, 3).
BRAINTEASER (BRinging Artificial INTelligencE home for a better cAre of amyotrophic lateral sclerosis and multiple SclERosis) (www.brainteaser.health) is a project funded by the European Horizon 2020 initiative, which aims to deploy Artificial Intelligence (AI)-based technologies for the daily home care of MS and ALS. In this context, AI is considered a key element in meeting the needs of both patients and clinicians. Specifically, AI methodologies can be utilized to analyze the progression of MS and ALS, allowing for the capture and handling of patients’ inter-variability, and providing tools for forecasting disease evolution (4). For AI methods to be effective, they need to be trained on large quantities of heterogeneous data from various sources, such as patient-specific medical history, environmental data, and signals potentially derived from commercially available wearable devices. Currently, wearable devices are widely available and they are becoming an essential instrument to monitor patients’ health-related signals in an almost continuous, noninvasive, and painless way, moving the collection process from limited controlled in-clinic sessions to daily life. Among wearable devices, commercial smartwatches allow users to easily track several important signals such as heart rate, step counts, physical exercise, and pulse oximetry, which can be used to evaluate the general health condition of the wearer (5). These functionalities can be particularly beneficial for patients with chronic diseases, who can use them to monitor the status of their disease, while clinicians can utilize these data to gain insight into disease progression. However, there are two main problems with using commercially available smartwatches to collect health-related signals. The first is that these health signals often cannot be directly used as provided by the device, mainly because of the noise of collected signals and elements tied to the use of the device itself. In fact, the wearer’s movement during usage might lead to artifacts in the signals, in the form of spikes, high-frequency noise, or gaps. Moreover, the device must be user-friendly and with an appropriate form factor, to avoid dropouts in use, thus ensuring continuous data collection. Finally, the device battery has to be recharged periodically, inevitably leading to data loss in that specific period. The second problem is that clinically relevant features, essential for monitoring chronic diseases such as ALS and MS, are not currently available through these devices. To solve these problems, many solutions have been proposed in the literature to process and analyze wearable data, but most of them have been applied only to non-consumer/experimental devices or to signals with different characteristics than the one collectible from consumer wearable devices like smartwatches (6, 7). Some previous works have focused on the processing of wearable data. For example, the works by Beyer et al. (8) and Vega et al. (9) present two processing pipelines for various wearabale devices, but lack the support for the Garmin Vivoactive 4 smartwatch, used for the project. Others like the works by Bent et al. (10) do not support all the required signals or don’t extract the features needed for the study. Lastly, the work by Foell et al. (11), while supporting the specific device, requires the data to be in the raw extracted format, which was not available during the project. Therefore, this work aims to present the automated pipeline to process health-related signals and extract clinically relevant features for ALS and MS that we developed within the BRAINTEASER project, in which signals are acquired via Garmin Vivoactive 4 smartwatch. Our solution has been meticulously crafted to meet the distinct needs, peculiarities, and requirements of the BRAINTEASER project. Briefly, the automated pipeline is composed of two steps: the signal processing step applies retiming, gap filling and denoising algorithms to improve data quality, whereas the feature extraction step selects the most important variables for ALS and MS according to clinical partners’ knowledge and feedback. The proposed automated pipeline, developed in Python, can be of help to researchers for the preliminary automated processing of the large amount of data that can be collected from wearable devices and can be easily adapted/modified to suit the specific needs of each scenario.
The structure of the paper is the following. We will start by presenting the BRAINTEASER project and its aims, and the rationale behind the selection of the Garmin Vivoactive 4 smartwatch and, by exploiting the feedback received from the clinical teams in the project, we will show the procedure we applied to identify the most useful signals and features. Then, we will illustrate in detail the automated pipeline we developed to obtain signals with improved quality and extract relevant features for AI-based models employed in BRAINTEASER. Finally, we will conclude by thoroughly defining all the extracted features, and in the last section, we will present the effectiveness of the automated pipeline by evaluating the result of its application to pivotal beta testing sessions.
2 Materials and methods
2.1 Wearable device selection for ALS/MS model development in BRAINTEASER
The BRAINTEASER project aims at exploiting clinically relevant features extracted from wearable devices to feed AI-based models to monitor and predict the progression of ALS and MS chronic diseases. Before selecting the wearable device, there was the need to better understand which signals could be potentially relevant, from the clinical point of view, for the two considered diseases.
2.1.1 Wearable device data of interest for ALS/MS AI-based model development
Both ALS and MS have multiple degradation effects on many vital functions of patients, especially related to respiration, blood oxygenation, and fatigue. These symptoms have been studied and analyzed in recent years by many research teams, to better understand their connection with the disease and its progression. Heart rate and related features have been identified as significantly different between individuals with each respective disease and healthy subjects (12–14). Thus this signal has been identified as relevant to track in both diseases, to investigate possible insight into patients’ status, even in the early stages. Respiration rate has proven to be an easy-to-collect signal that is highly correlated to more invasive clinical tests to predict survival in ALS patients (15, 16), and for MS respiratory dysfunction is one of the main outcomes of the disease (17). Moreover, sleep time is critical for both diseases. In fact, it has been shown how sleep quality and fatigue are relevant for both diseases, and tracking during sleep can show important patterns and apnoea periods (18–20). The final clinical relevance of HRV and SpO2 features as key info to monitor the progression of ALS and MS diseases will be available only at the end of the AI-based model development stage. However, it is important to note that the ultimate clinical relevance of HRV and SpO2 features as crucial information for monitoring the progression of ALS and MS diseases will only be determined at the conclusion of the development stage of the AI-based models.
To further validate these findings with hands-on input, we asked the clinical partners of the BRAINTEASER project to provide a list of desired features to collect from the wearable device, their priority, and the ideal sampling rate. For MS, Fondazione Istituto Neurologico Nazionale Casimiro Mondino (IT) and Servicio Madrileño de Salud (ES) are the clinical partners involved in BRAINTEASER and their teams identified a very high priority for activity-related signals, such as daily steps, burnt calories, and the raw accelerometer data. They also identified the tracking of respiration rate and during sleep as crucial to monitor the patient’s disease status. For ALS, the clinical partners (University of Turin (IT), Instituto De Medicina Molecular João Lobo Antunes (PT), and Servicio Madrileño de Salud (ES)) identified respiration rate and as crucial too, with the addition of the heart rate and beat-to-beat intervals with the request of the highest sampling rate possible. This list of desired signals is in line with the literature and allowed us to define a list of candidate wearable devices compliant with both clinical and technical requirements.
2.1.2 Candidate wearable devices and critical requirements for their integration
The clinical input provided expert-based information for identifying the device’s requirements. Subsequently, a more technical analysis of the available devices was conducted. We focused on wrist-worn devices because of their ease of use, small impact on the patient’s life, wide availability, and ability to collect signals such as heart rate, sleep patterns, and blood oxygen concentration. We conducted a comprehensive literature search in order to identify the devices utilized in similar studies. Additionally, we thoroughly explored the manufacturer websites to obtain a more profound understanding of the capabilities and functionalities of each device.
Table 1 reports the devices that have been considered for the project together with the pros and cons of their potential adaptation. The considered devices collect all the required signals. As such, the device of choice has been selected revolving around the maximization of the battery life, user experience, and possibility of accessing the collected data via a dedicated Application Programming Interface (API) or Software Developer Kit (SDK). Indeed, while a short battery life would imply a high burden for the patient to charge the device and data loss during the charging period, poor user experience threatens user compliance to wear the device and the absence of an API/SDK undermines the possibility of automatically collecting data and eases the development of AI-based methodologies within the project.
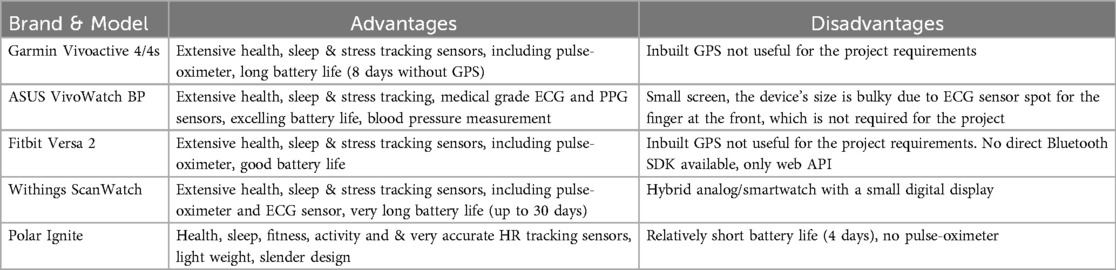
Table 1. Compared wearable devices with a brief summary of the identified advantages and disadvantages.
After considering all previously listed aspects, the BRAINTEASER project agreed to select the Garmin Vivoactive 4/4s as the one that best fits the clinical and technical needs.
2.1.3 Garmin Vivoactive 4/4s
The Garmin Vivoactive 4/4s (Garmin Ltd, Olathe, KS, USA) is a smartwatch that comes in two sizes and allows collecting all the signals identified in Section 2.1.1. It guarantees up to 8 days of battery life, which lowers the burden on the patient. The availability of two form factors improves the range of patients who will be able to wear the device without aesthetic and bulkiness concerns. Data collection can be automated via either via web API or via dedicated SDK, which would allow direct Bluetooth Low Energy (BLE) communication with the device from a mobile application. It is important to note that the device is not intended for clinical use, and the accuracy of the measurements was not directly quantified in this study. Our focus has been on exploring the potential use of a non-clinical-grade smartwatch as a means to gather relevant information for the BRAINTEASER project. Moreover, it has some important features to improve the user experience such as built-in notifications to encourage wearers healthy habits, like hourly stand time and drinking water.
Table 2 reports the sampling rate of each signal that can be collected from the Garmin Vivoactive 4/4s. Given this information on types of signals and their sampling rate, the next step was to investigate whether to use or discard their collection based on the specific needs of the BRAINTEASER project.
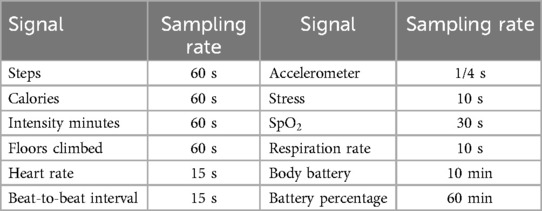
Table 2. List of health-related signals available from the Garmin Vivoactive 4/4s.
Of course, as discussed in Section 2.1.1, we retained heart rate, respiration rate, sleep, and given their key role evidenced by clinical partners.
As far as the accelerometer signal is concerned, its high sampling rate would potentially lead to a high amount of data management and processing. Furthermore, its continuous collection greatly reduces the battery life to a few hours. Due to these considerations, we chose to drop this signal. However, the inclusion of accelerometer data in future studies remains relevant to these diseases. Despite the difficulties associated with its ongoing collection, it has the potential to enhance the understanding of these conditions and should be considered whenever feasible. For this project, we have chosen to use steps and calories as a proxy for physical activity information since they are readily obtainable from the device. These two specific data types represent the cumulative sum of steps performed and calories burned up to the current moment.
Regarding Stress and Body battery signals, all clinical partners agreed that they would be beneficial to track. However, these signals are computed by Garmin and there is neither information nor validation on how these variables are calculated by the manufacturer, as well as no info on their clinical validity. The previous considerations led all the partners to agree on discarding these signals as well.
Finally, an additional note on the signal is needed. Enabling its collection for the whole day allows collecting only a few more points due to the user’s movement since the arm should be at rest, but has the drawback of critically reducing the duration of the battery life. For this reason, we chose to collect the signal during nighttime only.
The final list of signals to be collected, analyzed, and processed with the pipeline presented in this work (see Section 2.2 is reported in Table 3. Table 3 also reports the minimum sampling rate for each signal that is clinically relevant, according to clinical teams’ feedback (this may be higher than the minimum value provided by the device as reported in Table 2).
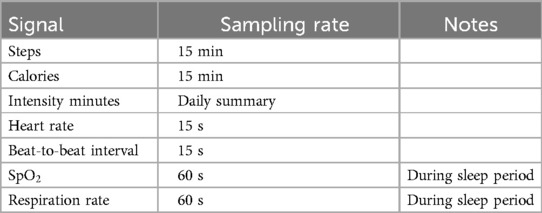
Table 3. Final list of health-related signals and the selected sampling rate exploited in the BRAINTEASER project after the device capabilities analysis and usability considerations.
2.2 Pipeline for signal processing and feature extraction
The AI models require as input clinically relevant features that are computed from the signals collected with the Garmin Vivoactive 4/4s and allow for a summary of the most important signal characteristics. In this section, we present the processing pipeline that has been designed and developed in Python aimed at extracting clinically relevant features. Figure 1 shows the overall structure of the pipeline, which is composed of three blocks of signal processing (retiming, gap filling, and denoising) aimed at making data usable to extract the features (last block).

Figure 1. Complete processing pipeline. It can be divided into two parts: the first three blocks are devoted to signal processing, to improve the quality of the raw data by retiming the input to a fixed sampling grid, filling data gaps, and removing noise, whereas the last block performs the extraction of clinically-relevant features.
2.2.1 Wearable device data preparation and denoising
All the collected signals need to be processed before being usable for feature extraction. In our pipeline, the signal processing consists of three steps specifically tuned to deal with the characteristics of each signal.
The first step is the retiming of the signal, which aims at bringing all data points to a uniform time grid. Indeed, input data might have a non-constant sampling grid and this may bias the calculation of the features. Being our final aim of feature extraction, this aspect represents a clear problem. Retiming is implemented by an algorithm that averages all input data points to the closest output grid point. In this way, the original data are preserved and only translated to the constant time grid. The average is reduced to a sum in the case of cumulative data types, such as daily calories and steps.
The second step is gap-filling. Indeed, the data can have missing values, and the presence of missing values can bias the calculation of the features and any further analysis. Several strategies have been investigated to reliably fill data gaps. Since a priori information on wearable-derived data was not available, it has been decided to employ a simple but effective strategy, i.e., fill missing values by linear interpolation of nearby values. This choice is also functional since it allows performing all the feature extraction algorithms without introducing major changes in the dynamics of the wearable-derived data. It is also worth noting that there is no difference between gaps caused by the sensor itself and by non-wearing periods. The ad-hoc procedure we developed consists first of automatically identifying fillable gaps for each input signal, then filling them by linear interpolation only those whose duration is equal or inferior to the limits reported in Table 4. These thresholds have been meticulously established through multiple iterations of a trial-and-error process aimed at striking an optimal balance between preserving signal dynamics and mitigating the introduction of excessive artificially generated values. Importantly, these values have undergone scrutiny and received approval from our clinical project partners. For instance, the respiration rate during nighttime, which is not expected to significantly change in less than 5 min, dictates a maximum time gap for filling set at 300 s. Similarly, the heart rate and beat-to-beat signal, projected to undergo negligible alterations in less than one minute during nighttime, have prompted the establishment of a maximum time gap for filling at 60 s. The blood oxygen concentration, not anticipated to experience significant shifts in less than 2 min during nighttime, has influenced the setting of a maximum time gap for filling at 120 s. Importantly, this duration deliberately maintains a lower threshold than the respiration rate, guided by valuable insights from clinical teams emphasizing the criticality of levels, particularly during nighttime and periods of diminished oxygen concentration.
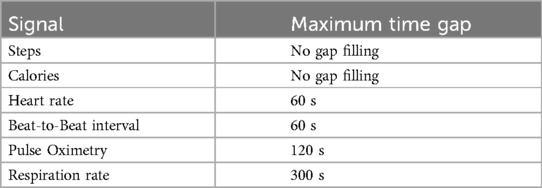
Table 4. For each signal, the maximum time gap that allows linear interpolation is reported.
Note that not all signals can be processed with the gap-filling procedure, e.g., steps and calorie signals skip the gap-filling block because of their non-continuous nature, both being aggregated samples over their sampling period.
Finally, the third processing step is denoising. Due to the sensor’s characteristics, some noise overlapped with the true signal is always expected. In the case of wearable devices, this might be caused, for example, by device movement on the user’s wrist, sweating, jumps, etc., which all lead to outliers and general noise in the collected data. To improve the quality of the signals before performing the feature extraction, since no a priori information on wearable-derived data was available, we decided to adopt a very robust methodology for denoising that does not require any a priori information on the wearable-derived data, i.e., a moving average algorithm. The algorithm works by calculating the average of data points within a sliding window. This sliding window moves through the time series data, and at each position, it computes the average value of the data points within the window. This process effectively smooths out variations and reduces high-frequency noise in the data, making it a suitable choice for enhancing data quality without requiring prior information about the characteristics of the wearable-derived data. The default window is three samples wide, but it can be easily customized in the code and passed as parameter to the processing functions.
2.2.2 Feature extraction
The output of the data processing pipeline (i.e., the first three blocks in Figure 1) is a signal that is now suitable to be used for the extraction of clinically relevant features. Each signal has been treated separately, to exploit all the relevant characteristics that are of interest for ALS and MS. All the features have been validated by the clinical partners of the project. Similar works in the literature on the two diseases (21–23) have served as additional confirmation of the features selected in this study. All the features are computed for the full daily data.
The explored features focus on the time, frequency, and geometric domains. In particular, the latter domain is explored by resorting to the Poincaré plot, which allows easy visualization and analysis of recursive signals like heart rate. This method and the geometric features that can be extracted from the plot are widely used in heart rate variability analysis, thus those features have been included in the list of important features for the project (24, 25). In our case, the Poincaré plot has been applied to heart and respiration rate signals only.
2.2.2.1 Heart rate and beat-to-beat interval features
Heart rate variability is correlated with the presence of ALS and MS (12–14), especially its frequency domain features. To extract features for this signal that can be relevant to the project, we leveraged two main packages, Neurokit (26) and HRVAnalysis (27). The packages focused on signals with higher sampling rates, and thus some adjustments before being applied were needed, such as refactoring functions and changing their parameters. For instance, some functions in the packages required a large number of points to work on, so we had to remove that constraint. Table 5 shows the list of the extracted features from the heart rate and beat-to-beat interval signals, respectively, and their description.
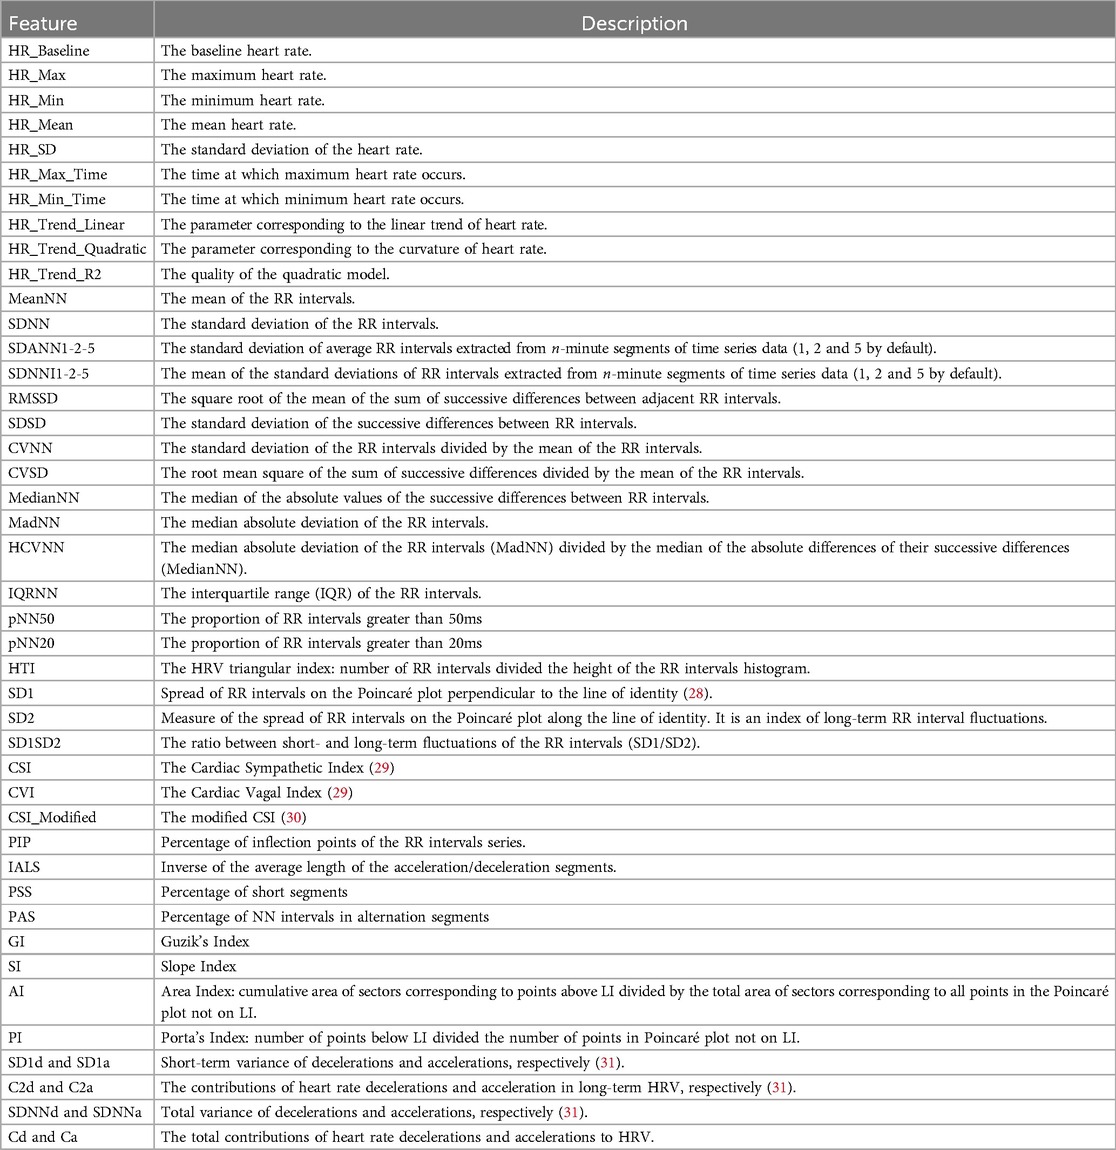
Table 5. Complete list of features for heart rate and beat-to-beat signals. The latter is derived by the inversion of the heart rate signal.
2.2.2.2 Pulse oximeter and respiration rate features
Sleeping hours are a vital time to watch. Numerous physiological indicators, including respiratory rate and (32, 33), are important to monitor during sleeping. Given that blood oxygen levels and sleep quality both reflect weariness and sleep apnoea, these signals are extremely important for both disorders being studied (18–20). Furthermore, since breathing is one of the vital processes that is most commonly hampered by disease development (16, 17, 34), it is essential to monitor respiration rate and related features to identify trends and predict disease-related events in the future. For the purpose of extracting features from pulse oximeter signals, the Neurokit2 package has been used as a starting point. The extracted features from the signal concentrate on the temporal domain, with a particular emphasis on the mean characteristics of desaturation occurrences, defined as values less than 90%. The features of the respiration signal use both the time and frequency domains, with an emphasis on the timing and characteristics of breath-to-breath intervals. The full description of the features that were extracted from and respiration rate is reported in Tables 6 and 7, respectively.
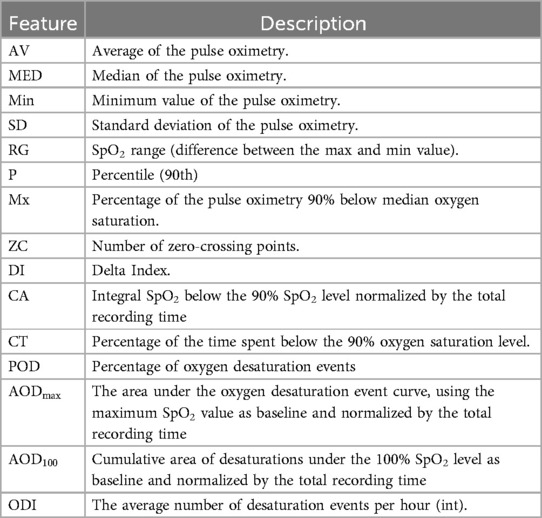
Table 6. Complete list of features for pulse oximetry signal.
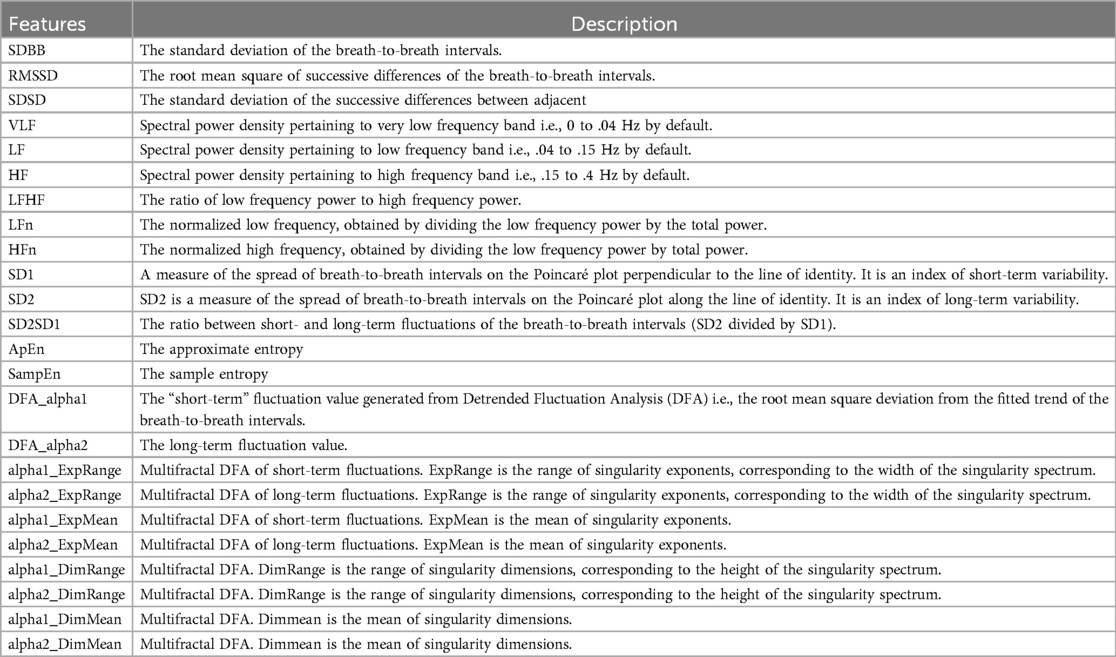
Table 7. Complete list of features for respiration rate signal.
3 Results
The pipeline for signal processing and feature extraction has been validated using sample data collected during the project’s development period and the initial phase of patient enrollment. This data was obtained from 10 subjects participating in the BRAINTEASER clinical trial, including both ALS and MS patients. The subjects wore the Garmin Vivoactive 4s device in an outpatient setting without any specific tasks for data collection. The subjects gave their informed consent for inclusion before they participated in the study. The study was conducted following the Declaration of Helsinki, and the protocol was approved by the Ethics Committee of A.O.U. Città della salute e della scienza di Torino (314/2021). In this work, we present the results on a representative subject with ALS, who used the device for 7 days to acquire a comprehensive data set that encompasses both daytime and nighttime periods. During this period, this individual engaged in various physical activities, which enabled the verification of the collected data’s quality and the assessment of the efficiency of the processing pipeline in eliminating potential artifacts resulting from the device’s movement on the wrist. The data presented here, as well as additional sample data, can be found in the repository linked as Supplementary Material. This data is representative of future datasets that will be collected using the wearable device, during the BRAINTEASER clinical trial and the pipeline will be further tested on the complete dataset when available.
The sample dataset contains some of the expected artifacts that the processing pipeline is asked to remove/correct. For instance, the sleeping time signal presents some peaks that could be a consequence of the wrong positioning of the device or compression of the sensor due to movement during sleep. Moreover, all signals present data gaps of different durations, which need to be identified and filled by linear interpolation if the gap duration is lower or equal to the limits previously. The results of the signal processing pipeline, comprising the initial three blocks outlined in Figure 1, are illustrated in Figure 2 for heart rate (top), (middle), and respiration (bottom) signals. Each figure depicts a segment of the available data to demonstrate the effects of each processing step. The input retimed signal is represented by the blue dashed line, the outcome of gap filling is displayed as green dots, and the denoised signal is depicted in red.
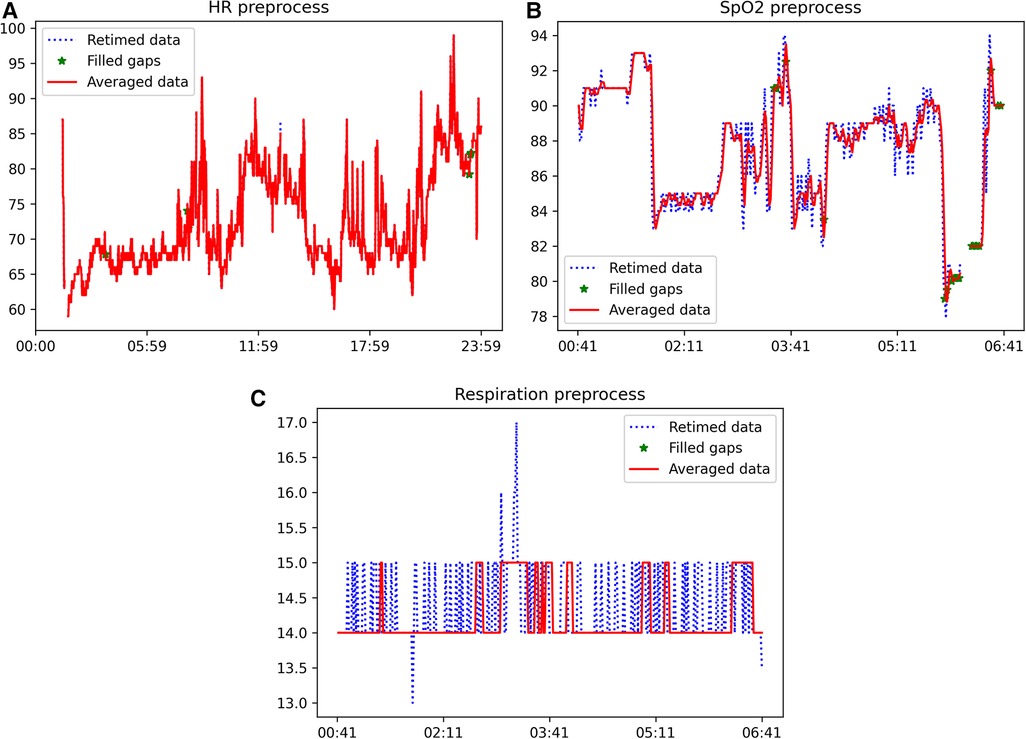
Figure 2. Example of the outcome of the application of the signal processing pipeline (first three blocks of Figure 1) to heart rate (top), (middle), and respiration (bottom) signals. The blue dashed line is the input retimed signal, the result of the gap filling is shown as green dots and the denoised signal is in red. (A) Example of heart rate signal after each step of the processing pipeline, (B) Example of signal after each step of the processing pipeline, (C) Example of respiration rate signal after each step of the processing pipeline.
These results illustrate the varying susceptibility of different signals to artifacts. Specifically, the heart rate signal obtained from the wearable device was found to be suitable for feature extraction without the need for further processing. Conversely, the and respiration rate signals exhibited a significant number of missing data points and artifacts, requiring pre-processing prior to feature extraction. The proposed automatic processing pipeline demonstrates the capability to effectively identify and correct the prevalent issues in health-related signals obtained from wearable devices. The results presented in Figure 2 illustrate that the application of the signal processing steps leads to an enhancement in the usability of the acquired time-series, and subsequently, the quality of the extracted features. This is achieved through the reconstruction of missing data and the removal of artifacts through denoising.
The cleaned sample was utilized to extract sample features that will serve as input to the AI models. As an example, Table 8 presents a list of sample features that were extracted from the heart rate signal.
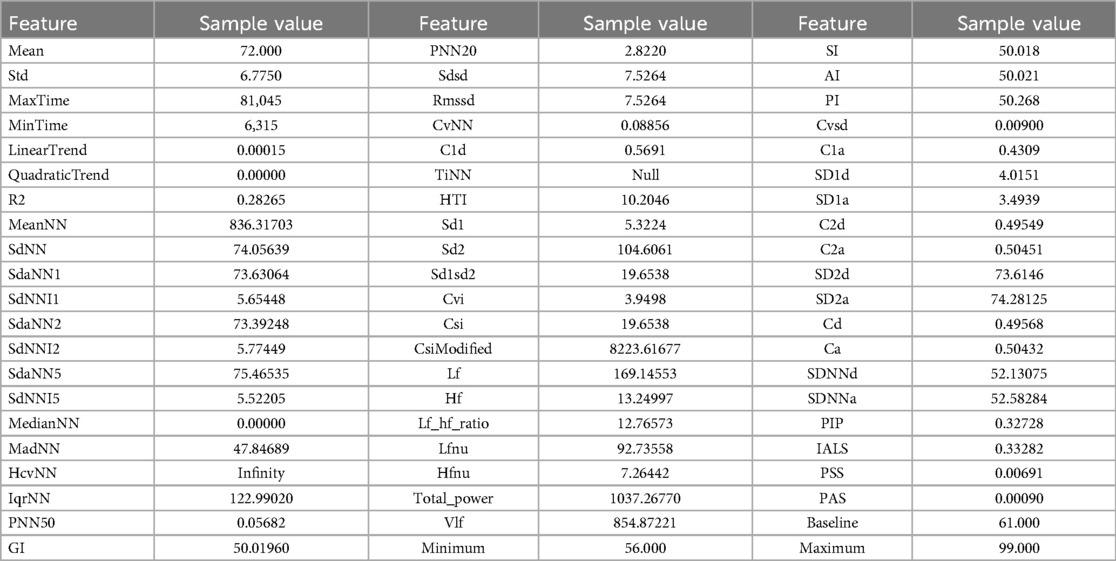
Table 8. List of the extracted features from the heart rate and beat-to-beat sample signal.
Tables 9 and 10 show an example of the features extracted from the sleeping time signals. These focus on overall summary values and, especially for the signal, some of the features highlight important events such as time in desaturation and its characteristics.
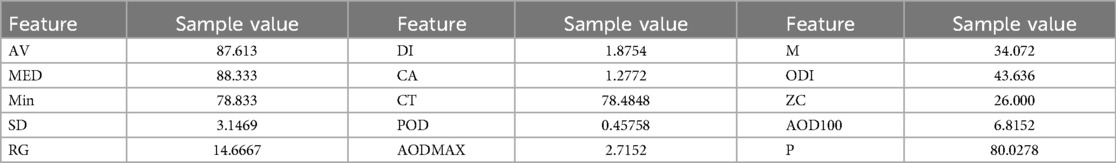
Table 9. List of the extracted features from blood oxygen saturation signal.

Table 10. List of the extracted features from the respiration rate sample signal.
In this study, the validity and impact of the extracted features on model performance have not been directly evaluated. This evaluation is important to understand the effect of the pipeline on model performance. However, such an analysis would necessitate the complete development of dedicated ALS/MS models to fully leverage the features extracted by our pipeline, which is a matter of ongoing research and is out of the scope of the present manuscript. Of course, once these models are finalized within the framework of the BRAINTEASER project, future investigations will explore the impact of our processing and feature extraction steps on their performance.
4 Discussion
Health signals obtained from wearable devices present a valuable source of monitoring data for chronic diseases, and AI models can leverage this information to predict disease progression. In the context of the BRAINTEASER project, the Garmin Vivoactive 4 was selected as the device for training the AI models for monitoring the progression of MS and ALS. This paper presents the processing pipeline developed and intended for deployment in the BRAINTEASER project. This pipeline incorporates state-of-the-art techniques and addresses the requirements for analyzing these signals in a real-world consumer scenario. While numerous current techniques concentrate on high-frequency data obtained from specialized and case-specific sensors, this approach utilizes a readily accessible consumer device and their built-in sensors and features, such as optical sensors and pulse-oximeters. During the development and signal selection process, it was crucial to incorporate input from clinicians to ensure the extraction of necessary features and focus on the most relevant signals for the specific situation. The selection process also considered additional engineering and usability factors. However, as a result, the accelerometer data was discarded. It is worth noting that the readings from the accelerometer can be valuable for a variety of functionality assessments, particularly those related to motor skills. This interdisciplinary approach is of paramount importance to guarantee that the processing is performed on valuable signals for the specific case. This process results in the extraction of useful features that can be utilized in subsequent analysis steps or, for example, displayed in a monitoring interface.
The proposed pipeline has been developed to work on data covering one day, but it can also process data in shorter time windows. However, when using shorter time windows, the consistency of certain features should be ensured the consistency of certain features. Regardless of the time window, patterns over multiple days can be analyzed at a later stage by comparing the extracted features and metrics as necessary. The proposed pipeline will be implemented in the BRAINTEASER project and continuously refined to meet the specific requirements of its application in the project. Future work will involve examining the noise characteristics of data obtained from wearable devices and evaluating various advanced noise-filtering approaches. One possible approach is to utilize Kalman filtering, as investigated in the study cited in (35), to assess its potential to enhance the heart rate signal in this processing pipeline. Additionally, new features will be explored and developed to expand the capabilities of the pipeline beyond the current processing task. One specific area of improvement is the gap-filling technique, particularly in sleep-related signals. By using Bayesian approaches based on imputation of earlier periods, it may be possible to take into account patient habits and routines, which could enable the development of a priori information that is relevant for both imputation and long-term statistics. This could allow for better exploration of signal patterns, and more accurate analysis of the signals. Furthermore, the long-term statistics generated by the pipeline could provide a deeper understanding of the signals and could potentially aid in the detection of outliers, which may indicate significant health events. The developed pipeline is a useful tool for effectively utilizing consumer smartwatches in health monitoring, and it might enable improved monitoring and signal analysis of both sick and healthy individuals in various scenarios.
Data availability statement
The original contributions presented in the study are included in the article/Supplementary Material, further inquiries can be directed to the corresponding author/s.
Ethics statement
The studies involving humans were approved by A.O.U. Città della salute e della scienza di Torino. The studies were conducted in accordance with the local legislation and institutional requirements. The participants provided their written informed consent to participate in this study.
Author contributions
LC: Conceptualization, Methodology, Software, Validation, Visualization, Writing – original draft, Data curation; GC: Methodology, Supervision, Writing – review & editing, Data curation; AF: Conceptualization, Supervision, Writing – review & editing, Methodology.
Funding
The author(s) declare financial support was received for the research, authorship, and/or publication of this article. The BRAINTEASER project has received funding from the European Union’s Horizon 2020 research and innovation program under grant agreement No 101017598. Open Access funding provided by Università degli Studi di Padova — University of Padua, Open Science Committee.
Conflict of interest
The authors declare that the research was conducted in the absence of any commercial or financial relationships that could be construed as a potential conflict of interest.
Publisher's note
All claims expressed in this article are solely those of the authors and do not necessarily represent those of their affiliated organizations, or those of the publisher, the editors and the reviewers. Any product that may be evaluated in this article, or claim that may be made by its manufacturer, is not guaranteed or endorsed by the publisher.
Supplementary material
The Supplementary Material for this article can be found online at: https://github.com/KingLudwig94/GarminHealthPreprocessing.git
References
1. Deeb O, Nabulsi M. Exploring Multiple Sclerosis (MS) and Amyotrophic Lateral Scler osis (ALS) as neurodegenerative diseases and their treatments: a review study. Curr Top Med Chem. (2020) 20:2391–403. doi: 10.2174/1568026620666200924114827
2. Mandel M, Mercier F, Eckert B, Chin P, Betensky RA. Estimating time to disease progression comparing transition models and survival methods—an analysis of multiple sclerosis data. Biometrics. (2013) 69:225–34. doi: 10.1111/biom.12002
3. Knibb JA, Keren N, Kulka A, Leigh PN, Martin S, Shaw CE, et al. A clinical tool for predicting survival in ALS. J Neurol Neurosurg Psychiatry. (2016) 87:1361–7. doi: 10.1136/jnnp-2015-312908
4. Termine A, Fabrizio C, Strafella C, Caputo V, Petrosini L, Caltagirone C, et al. Multi-layer picture of neurodegenerative diseases: lessons from the use of big data through artificial intelligence. J Pers Med. (2021) 11(4):280. doi: 10.3390/jpm11040280
5. Jovanov E. Preliminary analysis of the use of smartwatches for longitudinal health monitoring. In: 2015 37th Annual International Conference of the IEEE Engineering in Medicine and Biology Society (EMBC) (2015). p. 865–8. doi: 10.1109/EMBC.2015.7318499
6. Bianchi AM, Villantieri OP, Mendez MO, Cerutti S. Signal processing and feature extraction for sleep evaluation in wearable devices. In: 2006 International Conference of the IEEE Engineering in Medicine and Biology Society (2006). p. 3517–20. doi: 10.1109/IEMBS.2006.260547
7. Casson AJ. Opportunities and challenges for ultra low power signal processing in wearable healthcare. In: 2015 23rd European Signal Processing Conference (EUSIPCO) (2015). p. 424–8. doi: 10.1109/EUSIPCO.2015.7362418
8. Beyer KB, Weber KS, Cornish BF, Vert A, Thai V, Godkin FE, et al. NiMBaLWear analytics pipeline for wearable sensors: a modular, open-source platform for evaluating multiple domains of health and behaviour. BMC Digit Health. (2024) 2:8. doi: 10.1186/s44247-024-00062-3
9. Vega J, Li M, Aguillera K, Goel N, Joshi E, Khandekar K, et al. Reproducible analysis pipeline for data streams: open-source software to process data collected with mobile devices. Front Digit Health. (2021) 3:769823. doi: 10.3389/fdgth.2021.769823
10. Bent B, Wang K, Grzesiak E, Jiang C, Qi Y, Jiang Y, et al. The digital biomarker discovery pipeline: an open-source software platform for the development of digital biomarkers using mHealth and wearables data. J Clin Transl Sci. (2021) 5:e19. doi: 10.1017/cts.2020.511
11. Föll S, Maritsch M, Spinola F, Mishra V, Barata F, Kowatsch T, et al. FLIRT: a feature generation toolkit for wearable data. Comput Methods Programs Biomed. (2021) 212:106461. doi: 10.1016/j.cmpb.2021.106461
12. Damla O, Altug C, Pinar KK, Alper K, Dilek IG, Kadriye A. Heart rate variability analysis in patients with multiple sclerosis. Mult Scler Relat Disord. (2018) 24:64–8. doi: 10.1016/j.msard.2018.06.012
13. Merico A, Cavinato M. Autonomic dysfunction in the early stage of ALS with bulbar involvement. Amyotroph Lateral Scler. (2011) 12:363–7. doi: 10.3109/17482968.2011.584628
14. Findling O, Hauer L, Pezawas T, Rommer PS, Struhal W, Sellner J. Cardiac autonomic dysfunction in multiple sclerosis: a systematic review of current knowledge and impact of immunotherapies. J Clin Med. (2020) 9(2):335. doi: 10.3390/jcm9020335
15. Siirala W, Saaresranta T, Vuori A, Salanterä S, Olkkola KT, Aantaa R. Using respiratory rate and thoracic movement to assess respiratory insufficiency in amyotrophic lateral sclerosis: a preliminary study. BMC Palliat Care. (2012) 11:26. doi: 10.1186/1472-684X-11-26
16. Pinto S, de Carvalho M. SVC is a marker of respiratory decline function, similar to FVC, in patients with ALS. Front Neurol. (2019) 10:109. doi: 10.3389/fneur.2019.00109
17. Tzelepis GE, McCool FD. Respiratory dysfunction in multiple sclerosis. Respir Med. (2015) 109:671–9. doi: 10.1016/j.rmed.2015.01.018
18. Carvalho MD, Costa J, Pinto S, Pinto A. Percutaneous nocturnal oximetry in amyotrophic lateral sclerosis: periodic desaturation. Amyotroph Lateral Scler. (2009) 10:154–61. doi: 10.1080/17482960802382305
19. Boentert M, Glatz C, Helmle C, Okegwo A, Young P. Prevalence of sleep apnoea and capnographic detection of nocturnal hypoventilation in amyotrophic lateral sclerosis. J Neurol Neurosurg Psychiatry. (2018) 89:418–24. doi: 10.1136/jnnp-2017-316515
20. Stanton BR, Barnes F, Silber E. Sleep and fatigue in multiple sclerosis. Mult Scler. (2006) 12:481–6. doi: 10.1191/135248506ms1320oa
21. Gashi S, Oldrati P, Moebus M, Hilty M, Barrios L, Ozdemir F, et al. Modeling multiple sclerosis using mobile and wearable sensor data. npj Digit Med. (2024) 7:1–14. doi: 10.1038/s41746-024-01025-8
22. Garcia-Gancedo L, Kelly ML, Lavrov A, Parr J, Hart R, Marsden R, et al. Objectively monitoring amyotrophic lateral sclerosis patient symptoms during clinical trials with sensors: observational study. JMIR Mhealth Uhealth. (2019) 7:e13433. doi: 10.2196/13433
23. Johnson SA, Karas M, Burke KM, Straczkiewicz M, Scheier ZA, Clark AP, et al. Wearable device and smartphone data quantify ALS progression and may provide novel outcome measures. NPJ Digit Med. (2023) 6:34. doi: 10.1038/s41746-023-00778-y
24. Guzik P, Piskorski J, Krauze T, Schneider R, Wesseling KH, Wykretowicz A, et al. Correlations between the poincarè; plot and conventional heart rate variability parameters assessed during paced breathing. J Physiol Sci. (2007) 57:63–71. doi: 10.2170/physiolsci.RP005506
25. Golińska AK. Poincaré plots in analysis of selected biomedical signals. Stud Log Grammar Rethoric. (2013) 35:117–27. doi: 10.2478/slgr-2013-0031
26. Neurokit2 package v0.2.1. (2023). Available online at: https://neuropsychology.github.io/NeuroKit/ (Accessed March 15, 2024).
27. HRVAnalysis package v1.0. (2023). Available online at: https://aura-healthcare.github.io/hrv-analysis/ (Accessed March 15, 2024).
28. Ciccone AB, Siedlik JA, Wecht JM, Deckert JA, Nguyen ND, Weir JP. Reminder: RMSSD and SD1 are identical heart rate variability metrics. Muscle Nerve. (2017) 56:674–8. doi: 10.1002/mus.25573
29. Toichi M, Sugiura T, Murai T, Sengoku A. A new method of assessing cardiac autonomic function and its comparison with spectral analysis and coefficient of variation of R–R interval. J Auton Nerv Syst. (1997) 62:79–84. doi: 10.1016/S0165-1838(96)00112-9
30. Jeppesen J, Beniczky S, Johansen P, Sidenius P, Fuglsang-Frederiksen A. Using lorenz plot and cardiac sympathetic index of heart rate variability for detecting seizures for patients with epilepsy. In: 2014 36th Annual International Conference of the IEEE Engineering in Medicine and Biology Society (2014). p. 4563–6. doi: 10.1109/EMBC.2014.6944639
31. Piskorski J, Guzik P. Asymmetric properties of long-term and total heart rate variability. Med Biol Eng Comput. (2011) 49:1289–97. doi: 10.1007/s11517-011-0834-z
32. Krystal AD, Edinger JD. Measuring sleep quality. Sleep Med. (2008) 9 Suppl 1:S10–7. doi: 10.1016/S1389-9457(08)70011-X
33. Braun F, Theurillat P, Proenca M, Lemkaddem A, Ferrario D, De Jaegere K, et al. Pulse oximetry at the wrist during sleep: performance, challenges and perspectives. Annu Int Conf IEEE Eng Med Biol Soc. (2020) 2020:5115–8. doi: 10.1109/EMBC44109.2020.9176081.
34. Rolfe S. The importance of respiratory rate monitoring. Br J Nurs. (2019) 28:504–8. doi: 10.12968/bjon.2019.28.8.504. PMID: 31002547.31002547
Keywords: smartwatches, processing, feature extraction, health data, wearable devices, long-term health monitoring
Citation: Cossu L, Cappon G and Facchinetti A (2024) Automated pipeline for denoising, missing data processing, and feature extraction for signals acquired via wearable devices in multiple sclerosis and amyotrophic lateral sclerosis applications. Front. Digit. Health 6:1402943. doi: 10.3389/fdgth.2024.1402943
Received: 18 March 2024; Accepted: 16 September 2024;
Published: 27 September 2024.
Edited by:
Bobak Mortazavi, Texas A and M University, United StatesReviewed by:
Givago Silva Souza, Federal University of Pará, BrazilColin K. Drummond, Case Western Reserve University, United States
Giulia Regalia, Empatica Inc., United States
Copyright: © 2024 Cossu, Cappon and Facchinetti. This is an open-access article distributed under the terms of the Creative Commons Attribution License (CC BY). The use, distribution or reproduction in other forums is permitted, provided the original author(s) and the copyright owner(s) are credited and that the original publication in this journal is cited, in accordance with accepted academic practice. No use, distribution or reproduction is permitted which does not comply with these terms.
*Correspondence: Andrea Facchinetti, ZmFjY2hpbmVAZGVpLnVuaXBkLml0