 Sheila Flanagan*
 Angela M. WilsonFiona C. GabrielczykAnnabel MacFarlaneGeorgia Feltham
 Kanad Mandke
 Usha Goswami
- Centre for Neuroscience in Education, Department of Psychology, University of Cambridge, Cambridge, United Kingdom
In this article, we report a longitudinal study of the relationship between tapping consistency, phonological awareness, and literacy development in a sample of children initially aged approximately 8 years who were followed for 6 years. The sample comprised 121 participants, some of whom were diagnosed with developmental dyslexia (DYS, N = 58). The other typically developing children were either chronological-age-matched controls (CA, N = 30) for DYS, or reading-age-matched controls (RA, N = 33). The task was tapping to a 2-Hz beat, and the data were analyzed using circular statistics. This resulted in a vector for each child with two dependent variables, magnitude (length, between 0 and 1, often termed synchronization consistency) and phase (+/– π radians). The number of children able to synchronize (“synchronizers”) increased with age, and so did synchronization consistency. The number of “non-synchronizers”, children tapping at random, declined as the study progressed. Time-lagged relations between synchronization consistency and composite measures of phonological awareness and literacy were significant during the first 3 years of the study. They remained significant for the literacy composite as the children got older. All groups of children (DYS, CA, and RA) established a significant preferred tapping phase; however, time-lagged relations between the behavioral composites and phase measures were not significant at any time point. Mediation analysis and multiple regression analyses showed that tapping consistency significantly predicted later phonological awareness and that cross-sectional relations between rhythmic synchronization and literacy were mediated by phonology. The data are discussed in terms of temporal sampling theory.
1 Introduction
An increasing number of experimental studies demonstrate that the accurate perception and production of rhythm patterns are associated with both language development and reading development (Bégel et al., 2022; Sousa et al., 2022; Cumming et al., 2015; Dellatolas et al., 2009; Douglas and Willatts, 1994; Forgeard et al., 2008; Gordon et al., 2015; Goswami et al., 2013a,b; Huss et al., 2011; Kalashnikova et al., 2021a; Lundetrae and Thomson, 2018; Overy, 2000, 2003; Overy et al., 2003; Waber et al., 2000; Wolff, 2002; Wolff et al., 1990). In rhythm perception tasks, the listener typically makes a judgement about rhythm, and in rhythm production tasks, the listener typically produces a rhythm, for example by drumming or tapping to a rhythmic stimulus such as a metronome beat (Fiveash et al., 2022). Both rhythm perception and rhythm production tasks show relations with language and literacy across many languages. Such studies have included both typically developing (TD) children and children with dyslexia (DYS) or a developmental language disorder (DLD). These developmental studies suggest a causal link between rhythmic impairments and risk for either DYS or DLDs, which has led to theories about why this may be the case, for example, temporal sampling (TS) theory (Goswami, 2011, 2015), the precise auditory timing hypothesis (PATH; Tierney and Kraus, 2014), and the atypical rhythm risk (ARR) hypothesis (Ladányi et al., 2020). The current study is based on TS theory.
It is important to note that these different theoretical views are based on different types of data. At the behavioral level, Ladányi et al. (2020) proposed the ARR hypothesis, based on a systematic review of a range of behavioral rhythm tasks administered to children with DYS, DLDs, or stuttering. Ladányi et al. proposed that atypical rhythmic processing during infancy and early childhood could be a risk factor for DLDs. At the sensory/neural level, TS theory (Goswami, 2011) explained this increased risk via a theoretical framework linking rhythm, language, and reading development with sensory discrimination of amplitude rise times and neural oscillatory sampling of the speech signal (Goswami, 2011, 2015, 2022a). TS theory proposed that impairments in rhythmic processing were causally related to impaired acoustic processing of the amplitude envelope (AE) of speech, the relatively slow-varying changes in intensity that occur over time as speech is produced that are critical for speech perception (Shannon et al., 1995). AE processing is known to be impaired in children with DYS across languages, particularly at amplitude modulation rates below 10 Hz that carry information about rhythm and syllable stress patterns (see Greenberg, 2006; and Goswami, 2022b; for recent reviews). TS theory proposed that the sensory/neural processing of rhythm was a key factor underpinning phonological development in children and, consequently, their reading and spelling development. TS theory thus predicts that the relations between rhythmic synchronization and literacy/language outcomes are mediated by phonology.
Other sensory/neural theories regarding rhythm impairments have been based on music studies. An example is PATH, proposed by Tierney and Kraus (2014). PATH and TS theory share a number of similarities; however, PATH focuses on the precise perception of more rapid timescales in the region of approximately 10 ms that are required to detect the fine-grained timing details relevant to language, for example, changes in voice onset time that distinguish consonants like /b/ and /d/. PATH was derived from brainstem synchronization measures of the frequency-following response (FFR) at a millisecond timescale (< 10 ms). By contrast, TS theory focuses on relatively longer timescales of 500–200 ms as found in amplitude modulations at rates of approximately 2 Hz and approximately 5 Hz (Leong and Goswami, 2015). Recently, PATH has converged with TS theory to some extent via analysis of the precision of envelope encoding in children with precise FFRs who can synchronize their tapping to a beat (designated synchronizers; see Bonacina et al., 2021; reviewed later). The current study was designed as a test of TS theory. It aimed to test whether the developmental relations between rhythmic synchronization and literacy are indeed mediated by phonology, as predicted by TS theory.
Prior behavioral studies with children have shown that the relation between rhythm, phonology, and reading is very robust. Indeed, rhythm perception has accounted for around 40% of unique variance in both word reading and reading comprehension in some behavioral studies of children with DYS using beat-perception tasks (Huss et al., 2011; Goswami et al., 2013a). These developmental relations have also been measured before literacy is formally taught using reading readiness measures such as letter–sound knowledge as the outcome measure. Such studies suggest that the subsequent relations between rhythmic skills and literacy are mediated by phonological awareness (Kalashnikova et al., 2021a; Rios-Lopez et al., 2019; Woodruff Carr et al., 2014). For example, Woodruff Woodruff Carr et al. (2014) asked 35 TD American English 4-year-olds to drum in time with an adult and reported that drumming consistency was related to a range of phonological skills, including phonological awareness, rapid automatized naming (RAN), and phonological short-term memory. The children who were good synchronizers also showed better neural encoding of the speech AE, which Woodruff Carr et al. argued supported TS theory. Bonacina et al. (2021) studied rhythmic synchronization in a large sample (N = 156) of American English children aged, on average, 4 years, using the same drumming/tapping task that Woodruff Woodruff Carr et al. (2014) used but utilizing two rates, 400 ms and 600 ms. Bonacina et al. reported that the preschool children who performed well on the rhythmic synchronization task (synchronizers) outperformed their peers on a range of preliteracy tasks including phonological awareness, rapid automatized naming, and phonological short-term memory. The synchronizers also showed more precise neural encoding of the speech AE for different syllables, as well as more consistent FFRs. However, only about half of this young sample was able to synchronize their tapping to the beat.
In a complementary study of 4-year-olds based on TS theory, Kalashnikova et al. (2021a) assessed both beat perception and beat production (rhythmic synchronization in a tapping task) in 4-year-old Australian English children who were either at family risk for DYS (FR) or not at family risk (NFR). Kalashnikova et al. (2018)'s FR and NFR samples were followed from infancy, and the FR group showed prior impairments in discriminating a sensory cue to rhythm, amplitude-envelope rise-time discrimination, as 10-month-old infants. Infant rise-time thresholds subsequently predicted their vocabulary development as 3-year-olds (Kalashnikova et al., 2019), and the FR group then showed reduced phonological skills and reading readiness skills as 4-year-olds (Kalashnikova et al., 2021b). Kalashnikova et al. (2021a), using a simplified version of the beat perception task developed by Huss et al. (2011), reported that beat perception was significantly poorer in the FR 4-year-olds compared to the NFR control children. They also found that tapping precision was more variable in the FR group. Individual differences in tapping precision in the whole sample were related to measures of non-word repetition (a measure of the development of the phonological lexicon), vocabulary size (a language measure), and letter knowledge (a pre-reading measure). These longitudinal relations are supportive of TS theory, as rhythmic processing in this preschool cohort was a key factor underpinning both phonological and pre-reading skills. Studies with children after the onset of reading are consistent with these pre-reading data. For example, similar findings to Huss et al. (2011) regarding both perception and production of the beat were reported by Bégel et al. (2022) in a sample of school-aged 8–11-year-old French children with DYS and age-matched control children. In Bégel et al.'s study, the best predictors of DYS were beat perception, tapping precision, and tapping rate. However, because the French study did not assess phonological skills, the possible mediating role of phonology regarding the relations with literacy in this study could not be ascertained.
Training studies are one useful method for establishing causal relations in development, and training studies with younger children have typically included investigations of a potentially causal role for phonology in the relationship between rhythm skills and literacy. Such intervention studies consistently show that training younger children's rhythm perception and production skills improves their phonological awareness and their early reading performance (e.g., Dellatolas et al., 2009; Bhide et al., 2013; Cancer et al., 2020; Degé and Schwarzer, 2011; Flaugnacco et al., 2015; Moritz et al., 2013). For example, a study with German preschoolers reported by Degé and Schwarzer (2011) trained participants with a musical programme that included joint singing, joint drumming, metrical training, dancing, and other rhythmic exercises. A control group of preschoolers received training in sport. The children who had received the musical training subsequently showed significant gains in phonological awareness compared to the control group. A study of 1,028 French-speaking children aged 5–6 years asked the participants to produce 21 rhythmic patterns modeled by the experimenter, who tapped a pencil on a table (Dellatolas et al., 2009). Dellatolas et al. (2009) reported that individual differences in rhythmic performance were a significant predictor of reading at age 7–8 years (2nd grade), even after controlling for attention and linguistic skills. A small-scale (N = 48) randomized control trial (RCT) carried out in Italian investigated the efficacy of musical training based on the Kodály method on phonological awareness and reading in children aged 8–11 years who had a diagnosis of DYS (Flaugnacco et al., 2015). The Kodály (1965) method teaches children about musical concepts, such as tempo, pitch, and rhythm, using multimodal (kinesthetic, visual, and auditory) activities based on simple melodies or rhythms. Following 7 months of musical training, Flaugnacco et al. (2015) reported that the experimental group showed significant gains in both phonological awareness and reading compared to the business-as-usual children. Moritz et al. (2013) studied English-speaking children following a music curriculum based on the Kodály rhythm method. They reported that 5-year-olds following the Kodály programme showed better phonological awareness at the end of their preschool year than those in a matched control group following a musical curriculum not focused on rhythm. The participants were also followed up 2 years later, and significant time-lagged correlations between rhythm copying and later phonological awareness, non-word repetition, reading, and spelling were found (Moritz et al., 2013). A different rhythmic intervention developed for Italian children with DYS, the Rhythmic Reading Training (RRT) computerized software (which is based on TS theory), aims to help students synchronize reading both syllables and words aloud with an acoustic rhythm (Cancer et al., 2020, 2022). The pace of the acoustic rhythm is gradually increased to increase reading fluency. Experiencing RRT as an intervention has been shown to be as effective as other multimodal therapies for DYS in 10-year-old Italian children, and the improvements in reading skills following RRT appear to relate to its effects on phonological awareness (Cancer et al., 2020). Accordingly, rhythmic training studies across languages support a causal role for phonology in the developmental relations between rhythmic synchronization and literacy.
Nevertheless, the possibility that individual differences in rhythmic abilities are continuously related to individual differences in phonological skills across development has rarely been addressed empirically. Longitudinal studies of rhythmic synchronization are infrequent in the literature. Rios-Lopez et al. (2019) measured rhythmic synchronization in 38 Spanish kindergarteners at the ages of both 4 and 5 years using the beat synchronization task developed by Woodruff Carr et al. (2014). In this task, children drum in time with the experimenter, who in Rios-Lopez's study was drumming at 1.67 Hz (606 ms). They also measured non-word repetition and letter-name knowledge at both ages, as well as a pre-reading electroencephalography (EEG) indicator of print awareness, the N170, a negative deflection in averaged neural electrical activity that occurs when children recognize that a letter string is a real word. The N170 was measured at the 5-year test point only. Beat synchronization at 4 years was a marginal predictor of letter-name knowledge at 5 years (p = 0.06) but not of non-word repetition and was a significant predictor of the N170. Z-scores suggested that beat synchronization improved between the ages of 4 (mean Z = 1.69) and 5 years (mean Z = 4.88). Similar longitudinal relations between rhythmic synchronization and literacy skills were reported by Kertész and Honbolyg (2023) in a sample of Hungarian children. The children (N = 37) received a metronome tapping task at two ages, 6 years and 8 years, as well as measures of phonological awareness and literacy. Three rhythmic synchronization rates were included: 1.3 Hz (750 ms), 2 Hz (500 ms), and 2.5 Hz (400 ms). Tapping consistency did not show age-related improvements in this study, but tapping consistency at age 6 years was related to reading and spelling levels at age 8 years. Kertész and Honbolygo reported that children's tapping performance at age 6 years was already at a high level, which could explain the lack of developmental improvement in rhythmic synchronization. Accordingly, the potentially mediating role of phonology in explaining developmental relations between rhythmic synchronization and literacy is not addressed by current longitudinal studies.
The longitudinal investigation reported here was designed to help fill this gap. The current study was developed based on prior tapping and neural rhythm tracking studies based on TS theory (Thomson and Goswami, 2008; Huss et al., 2011; Power et al., 2013, 2016; Colling et al., 2017). These studies suggested that the sensory/neural processing of rhythm at a rate of 2 Hz was a key factor underpinning phonological development at all linguistic levels (prosody, syllable, rhyme, and phoneme). For example, cortical tracking studies measuring the encoding of low-frequency envelope information in continuous speech by low-frequency oscillations (focused on the electrophysiological delta and theta bands, 0.5–4 Hz and 4–8 Hz, respectively) demonstrated impaired encoding of approximately 2-Hz envelope information in children with DYS (Power et al., 2016). The TS-driven Cambridge BabyRhythm study, which involved 122 TD infants, reported that their preferred spontaneous motor tempo from approximately 5 months of age was 2 Hz (Rocha et al., 2024). Prior studies of beat synchronization in older children (8 years plus) have also found that 2 Hz (500 ms) is the preferred spontaneous tempo (the rate at which children choose to tap in the absence of an external timekeeper; see McAuley et al., 2006). A beat rate of 2 Hz was also utilized for the current study.
Here, the 2-Hz tapping measure was administered for at least 4 years of a 6-year longitudinal study of English-speaking children with and without DYS (see Supplementary Table 1). The study was originally designed to measure the key behavioral, sensory and neural factors proposed by TS theory (see also Flanagan et al., 2021, 2024; Mandke et al., 2022, 2023). In addition to its longitudinal measurement, the 2-Hz tapping task also formed part of a series of oral rhythmic interventions received by pre-assigned groups of DYS children as the study progressed. The longitudinal analyses presented here thus exclude any DYS data collected after these interventions. Unfortunately, following recruitment and initial testing, the longitudinal research design was significantly impacted by the COVID-19 pandemic. Nevertheless, the tapping task was administered reasonably regularly over 4 years of the study, commencing once all children (at Time Point 0 [TP0]) finished the baseline assessment. Tapping was completed either as part of pretesting before the interventions were delivered (January–July 2019, hereafter Time Point 1 [TP1]; September–December 2019, hereafter Time Point 2 [TP2]; and September–December 2021, hereafter Time Point 4 [TP4]) or as part of post-testing following the oral interventions (September–December 2020, hereafter Time Point 3 [TP3] and May–July 2022, hereafter Time Point 5 [TP5]). Supplementary Table 1 provides the full timeline and task administration for the longitudinal study.
Based on TS theory, individual differences in rhythmic synchronization were expected to have significant longitudinal effects on both phonological development and the development of reading and spelling. Children were also expected to increase in tapping consistency with age; however, children with DYS were expected to be significantly less consistent in their tapping at any given age than children without DYS. A number of hypotheses were thus tested in the current study: (H1) Rhythmic synchronization ability should increase with age when measured by both the magnitude and phase measures; (H2) rhythmic synchronization ability in the children with DYS should be significantly less at any time point compared to children of the same age without DYS; (H3) individual differences in rhythmic synchronization ability should positively predict phonological development and literacy outcomes; and (H4) the relationship between rhythmic synchronization and literacy outcomes should be mediated by phonological awareness.
2 Methods
2.1 Participants
Originally, 127 children were recruited for this study in 2018 when they were administered a series of baseline measures of reading, phonology and non-verbal IQ. Baseline testing is hereafter referred to as TP0. Prior to the pandemic (which began closing U.K. schools in March 2020), six children (4 male, 2 female) had either dropped out or been excluded for low IQ (SS < 80). The remaining 121 children were being tested yearly, with some of the children with DYS receiving oral/motor rhythm-based interventions designed to improve phonological processing. All children had normal vision or corrected-to-normal vision with spectacles. All participants received a short hearing screen using an audiometer. Sounds were presented monaurally at a range of octave frequencies (0.5, 1.0, 2.0, 4.0 kHz), and all participants were sensitive to sounds in the 20 dB hearing level (HL) range. In accordance with the Declaration of Helsinki, participant-informed assent and written parental-informed consent were obtained from all participants, and the study was reviewed by the Psychology Research Ethics Committee of the University of Cambridge.
The data reported here were collected in the first 5 school years of the study (TPs 0–5, 2018–2022), with the first intervention delivered following TP2. Children with DYS were recruited via learning support teachers, who were informed that inclusion criteria for the children with DYS were participants to be free of any diagnosed learning difficulties aside from DYS (i.e., dyspraxia, attention deficit hyperactivity disorder (ADHD), autistic spectrum disorder, and speech and language impairments). The language requirement was also assessed directly by administering a standardized vocabulary task, the British Picture Vocabulary Scales (BPVS; Dunn et al., 2009). The mean score for the children with DYS was 98 (see Table 1), which did not differ from the control children (mean score: 102). Children were also required to have a non-verbal IQ of 80 or above and English as their first language. Children were assigned to the DYS group if they scored at least one standard deviation (score of 84 or less) below the test norm of 100 on (a) at least two of the four literacy measures and/or (b) the phonology measure administered in the baseline screen (that was used to verify DYS status; described later), and (c) had a non-verbal IQ of 80 or above. This approach was similar to previous studies (e.g., Kuppen et al., 2011) and was adopted as children without DYS in the United Kingdom typically score above the standardized mean of 100 on tests of literacy and phonology. In all, 58 children met the inclusion criteria (DYS group: 27 female, mean age at recruitment: 8 years 1 month, U.K. school Year 3; see Table 1). Control participants scored within the typical range (standard score of 85+) for all literacy measures and had a non-verbal IQ of 80 or above. Control participants consisted of 30 chronological-aged-matched, typically reading children (CA; 10 female, mean age at recruitment: 7 years 11 months) and 33 reading-age-matched children (RA; 18 female, mean age at recruitment: 6 years 7 months, UK school Year 1). Note, even though the DYS group were, on average, 2 months older than the age-matched controls, at TP0, they were, on average, 19 months behind the CA group on the British Ability Scales (BAS) single-word reading task (Elliot et al., 1996).
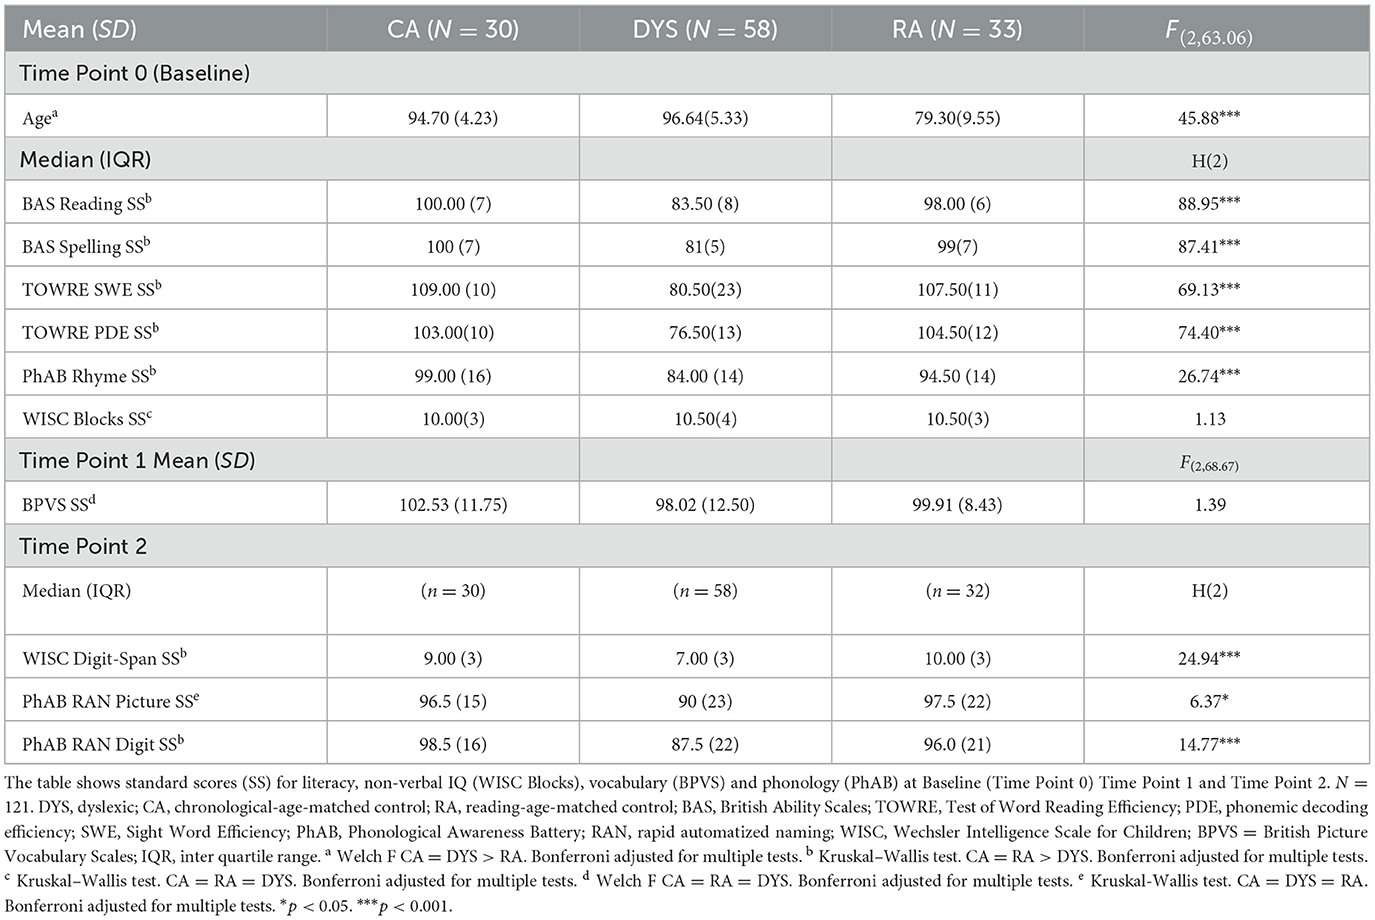
Table 1. Participant characteristics by group for the behavioral tests.
2.2 Procedure
Baseline screening (TP0) was carried out in schools in 2018 (January–December) to identify participants with poorer reading skills and recruit children for the two control groups (CA children, and RA children). The baseline screening consisted of a phonological awareness task—the Rhyme subtest of the Phonological Assessment Battery (PhAB; Frederickson et al., 1997); four measures of reading and spelling—the Reading and Spelling scales of the BAS (Elliot et al., 1996) and the Sight Word Efficiency (SWE) and non-word Phonemic Decoding Efficiency (PDE) scales of the Test of Word Reading Efficiency (TOWRE; Torgesen et al., 1999); and a non-verbal IQ measure—the Block Design subtest of the Wechsler Intelligence Scale for Children, Fifth Edition (WISC-V; Wechsler, 2016). No tapping tasks were administered in the baseline screening session. Experimental assessments of tapping, literacy, and phonological processing were subsequently administered at five further time points over the project (January–July 2019, TP1; September–December 2019, TP2; September–December 2020, TP3; September–December 2021, TP4; and May–July 2022, TP5). All assessments reported in this article were conducted in person when the schools were open between lockdowns (the U.K. lockdowns occurred in March–July 2020 and January–March 2021; in addition, many of our participating schools did not allow researchers back into classrooms until September 2021). Furthermore, the 58 children with DYS were randomly assigned to three intervention groups when the project began (19, 19, and 20 per group, respectively); hence, some of the children with DYS received a rhythm-based oral–motor intervention during the spring term (January–March) of either 2020, 2021, or 2022. Once a child received an intervention, their tapping, psychoacoustic, and behavioral data were omitted from the group comparisons and longitudinal analyses reported in this article. Therefore, the participant numbers at each time point were as follows: TP1, N = 121 (CA = 30, DYS = 58, and RA = 33); TP2, N = 121 (CA = 30, DYS = 58, and RA = 33); TP3, N = 102 (CA = 30, DYS = 39, and RA = 33); TP4, N = 83 (CA = 30, DYS = 20, and RA = 33); and TP5, N = 63 (CA = 30, RA = 33).
2.3 Tapping task
The tapping task was programmed in Presentation© and consisted of two trials lasting approximately 30 s. The auditory beat stimulus used in this study consisted of a rhythm track of duration 24 s with a beat rate of 2 Hz, that is, 48 beats with an inter-beat interval of 500 ms. Each beat stimulus was based on a pure tone of 500 Hz for a 30-ms duration, with a rise, steady-state, and fall time of 10 ms. A trial was started by the child pressing button “A” on an Xbox® game controller connected via USB to the laptop. The beat, or “metronome,” stimuli were presented over headphones at a comfortable listening level, and the children were instructed verbally and by on-screen instruction to listen and join in, tapping along in time, by pressing the Y button on the controller (this was found by children to be the most comfortable option). The second trial was started by the child when they were ready, which was usually within a few seconds.
2.4 Standardized tests
2.4.1 Vocabulary
The BPVS (Dunn et al., 2009) is a receptive vocabulary test. In the test, the child is shown four pictures on a page in a stimulus book. The child must point to the picture that best illustrates the meaning of the word spoken by the experimenter. The maximum raw score is 168, and a standard score is computed (mean: 100, SD: 15).
2.4.2 Phonological skills
Phonological skills were assessed using three measures from the standardized PhAB, subscales Rhyme, Spoonerisms and RAN (Frederickson et al., 1997). Rhyme and Spoonerisms tested phonological awareness, and the RAN tested naming skills. At recruitment, some of the children assigned to the RA group were too young to achieve standard scores on the PhAB. A measure of phonological short-term memory (PSTM) was also administered. Children's performance on the RAN and PSTM measures is reported for completeness. However, note that the RAN and the PSTM were not included in the phonological awareness composite used in the mediation analyses.
2.4.2.1 Rhyme task
In the PhAB Rhyme task, children are asked to identify the rhyme in single-syllable real words. Three practice trials are given with feedback. The experimenter reads out three words to the child. The task is to select the two words that rhyme, that is, sound the same at the end (e.g., sail, boot, nail; big, hiss, miss). The test is scored out of 21 trials, and the child's standardized score was used for subsequent analyses.
2.4.2.2 Spoonerism task
The PhAB Spoonerisms test is a timed test and comes in two parts, each lasting a maximum of 3 min. The first part consists of 10 semi-spoonerisms, where the first phoneme of a word is replaced by a new one, for example, “dog” with a /l/ gives?—“log.” The second part consists of 10 full spoonerisms, where the task is to exchange the leading sounds of two words, for example, “lazy dog” gives… (answer: “daisy log”). The raw score is out of 30 and, the child's standardized score was used for subsequent analyses.
2.4.2.3 RAN
PhAB RAN consists of two parts, a picture-naming speed task, and a digit-naming speed task. In the picture-naming task, line drawings of five common objects, are to be named as quickly and accurately as possible. To begin, the child is familiarized with the five drawings of objects (ball, hat, door, table, and box). Then they are asked to name them from a sheet with 50 objects (5 rows × 10 columns) in a randomized order. This is repeated with a second set of 50. The raw score is the sum of the two times, in seconds. For digit naming, the eight single-syllable digits (1, 2, 3, 4, 5, 6, 8, and 9) are used. After the child is familiarized with these digits, a list of 50 digits (10 × 5 digit numbers) is to be read out as quickly as possible. This is repeated with a second set of 50. The raw score is the sum of the two times, in seconds, and the standardized score was used for subsequent analyses.
2.4.2.4 PSTM (auditory)
PSTM was assessed using the WISC-V digit span test. In this test, children listen to a sequence of numbers read aloud by the researcher. The test consists of three types. The child must repeat back the sequence in one of three ways: in the same order, the reverse order, or ascending order. Each test item consists of two trials. The first trial consists of two numbers (e.g., 2–9) and increases by one number on subsequent items. Each test type is discontinued when the child incorrectly answers both trials in an item. The tests start with a practice for the reverse and ascending sequences. One point is given for each correct response. The maximum raw score for digit span is 54, and standard scores are normalized to have a mean of 10, with a standard deviation of 3.
2.4.3 Standardized tests of literacy
Reading and spelling ability was measured using the BAS single-word reading and spelling subscales (Elliot et al., 1996). SWE and PDE were measured using the TOWRE (Torgesen et al., 1999). The TOWRE is a two-part timed measure of reading accuracy. Each part is limited to 45 s, in which the child reads aloud as many words (SWE) or non-words (PDE) as quickly and as accurately as possible. Although standard scores for all participants fell during the COVID-19 pandemic, standardized scores were used for the correlational and longitudinal analyses reported here to control for the age differences between the groups.
2.4.4 Standardized cognitive non-verbal ability
Children were given the Block Design subscale of the WISC-V (Wechsler, 2016). In the Block Design task, the child must re-create, within a specified time limit, the design of a handmade model or picture in a stimulus book, using red and white blocks. There are 14 items with a total maximum score of 68. A scaled score between 1 and 19 can then be computed. The mean scaled score is 10.
2.5 Statistical analysis
Data exploration and analysis were conducted using SPSS (ver. 28.0) with boxplots in R/R Studio (R Core Team, 2018). Circular statistics were analyzed using the Circular Statistics Toolbox (Berens, 2009) in MATLAB version (R2020b). The different measures of phonological awareness and literacy were highly inter-correlated. Accordingly, two composite variables based on raw scores were created using the Percent of Maximum Possible transformation (Cohen et al., 1999). This transform is suitable for longitudinal studies as it maintains the longitudinal relationships in the data. To create the Literacy (LIT) composite variable, scores on the BAS Reading, BAS Spelling, TOWRE PDE, and TOWRE SWE were combined for each time point (LIT TP0–LIT TP4). Using the same approach, the composite Phonological Awareness (PA) measure was created (combining PhAB Rhyme and Spoonerism raw scores; PA TP1–PA TP4).
Analysis of circular statistics for individual and group data are described in Sections 2.5.1 and 2.5.2, respectively. Vector analysis was performed on the circular data to generate two metrics: magnitude and phase. Data screening is reported in Section 3.1. Tests of Normality were conducted for the linear and circular data. For analysis of magnitude, cross-sectional analyses (Kruskal–Wallis) to identify group differences (CA, DYS, and RA) at each time point (TP1–TP4) and longitudinal analyses (Friedman repeated measures analysis of variance [ANOVA]) to determine the effect of TP for each group are reported in Section 3.2. An analysis of the tapping phase is reported in Section 3.3. The longitudinal relationships between magnitude, phonological awareness, RAN, PSTM, and literacy are reported in Section 3.4. Analyses of the mediating effect of PA are reported in Section 3.5. A final regression analysis of the longitudinal effects of tapping on PA is reported in Section 3.6.
2.5.1 Tapping task: individual data
To analyse the most consistent tapping behavior for each participant, the first two taps for each run, and the last tap was trimmed. The last tap was trimmed as this may have occurred after the metronome had stopped. The resulting tap-timing data set was analyzed using circular statistics with the CircStat MATLAB toolbox (Berens, 2009), resulting in a vector with two dependent variables: magnitude (length, between 0 and 1) and phase (+/– π radians). If there was no consistent tapping to the metronome beat, then the distribution would tend to be uniform, that is, with no preferred phase, and the magnitude of the subsequent vector would be small. An indication of uniformity would indicate that a child was a “non-synchronizer,” that is, tapping at random. If the child was a “synchronizer” with a consistent tapping response, there would be a concentration of responses around a certain phase value, resulting in a non-uniform distribution. In this case, the magnitude of the vector would tend toward 1. The Rayleigh test for uniformity was applied to each data set. This test assumes sampling from a circular normal distribution (i.e., the Von Mises distribution). A significant result from the Rayleigh test (p < 0.05) indicates that the data were not uniformly distributed. A non-significant result (p > 0.05) is interpreted as no evidence of a significant difference from the null condition of uniformity. The preferred tapping phase at each time point for each participant was calculated as the circular mean of the phase of the resultant vector for each run. The arithmetic mean of the magnitude of the resultant vectors was calculated to give a measure of individual tapping consistency. This generated two dependent variables of interest at both the group and individual levels; the resultant magnitude; and the preferred phase.
2.5.2 Tapping task: group analyses
To assess whether the CA and DYS groups differed in their tapping behavior, the first step was to assess each group for their distribution of preferred tapping phase. As for the individual data analyses, if there was no consistent relationship in the group response to the metronome beat, then the distribution would tend to be uniform, that is, with no preferred phase. If there was a consistent tapping response at the group level, there would be a concentration of responses around a certain phase value, resulting in a non-uniform distribution. The circular Rayleigh test for uniformity was conducted for the group data at each TP. Again, this test assumes sampling from a circular normal distribution (i.e., the Von Mises distribution). The second step in assessing potential differences between groups in the mean preferred phase was to perform a two-sample and a multi-sample Watson–Williams test (circular one-factor ANOVA), which also assumes underlying von Mises distributions. For robustness, a non-parametric multi-sample test for equality of medians analogous to a circular Kruskal–Wallis test was conducted. A significant result in these tests would indicate a group difference in the preferred phase of tapping. To meet the assumption of linearity required for subsequent analysis the vector magnitude values were logit-transformed (Field, 2009). Tests for group differences in the mean of the vector magnitude were carried out to investigate between-group consistency of tapping. A significant result would indicate a group difference in the consistency of tapping.
3 Results
Prior to the analyses investigating H1–H4, we report the literacy and phonological data for the sample at TP0 (baseline), TP1, and TP2 in Table 1 by group. The results for the standardized behavioral tasks are reported more fully in Flanagan et al. (2024) and, hence, are only summarized here. Shapiro–Wilk tests were used to test the normality of data. When variables were not normally distributed [BAS Spelling, TOWRE PDE, PhAB Rhyme, WISC-V digit span, and non-verbal intelligence quotient (NVIQ)], independent-samples Kruskal–Wallis tests (non-parametric one-way ANOVA) were used to test for group differences. Levene's test for homogeneity of variance was not met by the variables Age, BAS Reading, TOWRE SWE, and BPVS, so for these measures, the Welch test (robust one-way ANOVA) was used. Boxplots revealed an extreme outlier [>3 × inter quartile range (IQR)] in BAS Reading at TP3. This outlier was winsorized using the next-highest score plus 1 in the data set (Field, 2009). The composite scores at TP0, TP1, TP2, TP3, and TP4 are shown in Table 2, followed by the tapping consistency and phase measures by group in Table 3.
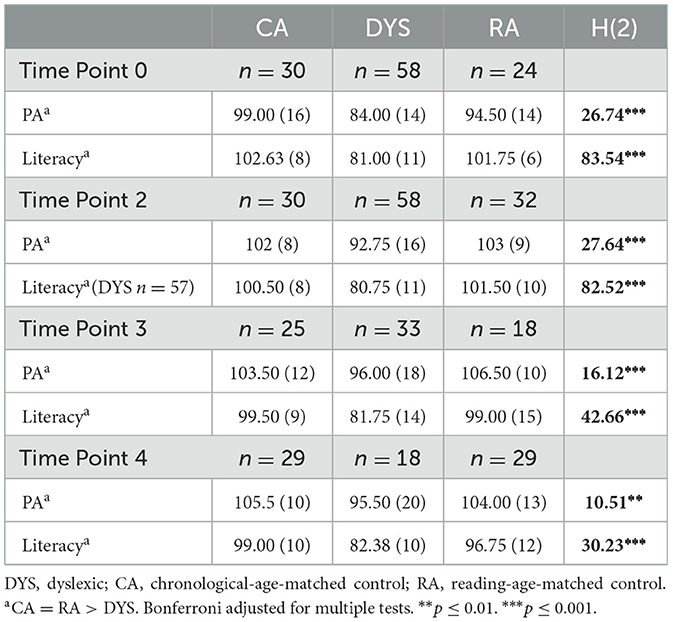
Table 2. Participant composite standardized scores and Kruskal-Wallis test of group difference for Phonological Awareness (PA) and Literacy. Median (IQR).
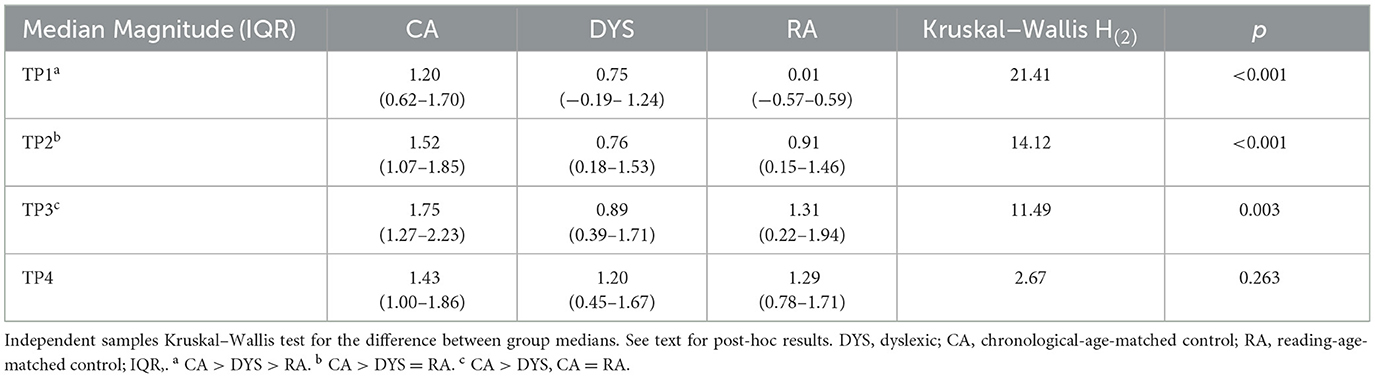
Table 3. Tapping consistency (logit magnitude of resultant vector) by group at time points 1–4.
3.1 Tapping data screening
The tapping magnitude data were explored for outliers by group using Boxplots at TPs 1–4. One significant outlier (>3 SD) in the CA group was observed at TP1. An investigation of their tapping rate suggested they were not tapping along to the beat stimulus. Their data were thus removed from further analyses. A Shapiro–Wilk test revealed that the distribution of magnitudes for the dyslexic group at TP2 was significantly different from normal; hence, non-parametric methods were used in further analysis.
3.2 Tapping magnitude: individual and group analyses
To explore H1, that rhythmic synchronization should improve with age, and H2, that rhythmic synchronization in the children with dyslexia should be significantly worse than in age-matched TD control children, independent-samples Kruskal–Wallis tests comparing the magnitude of the resultant group vectors for CA, DYS, and RA were used. The logit magnitude of the resultant vectors by groups (CA, DYS, and RA) is shown in Figure 1.
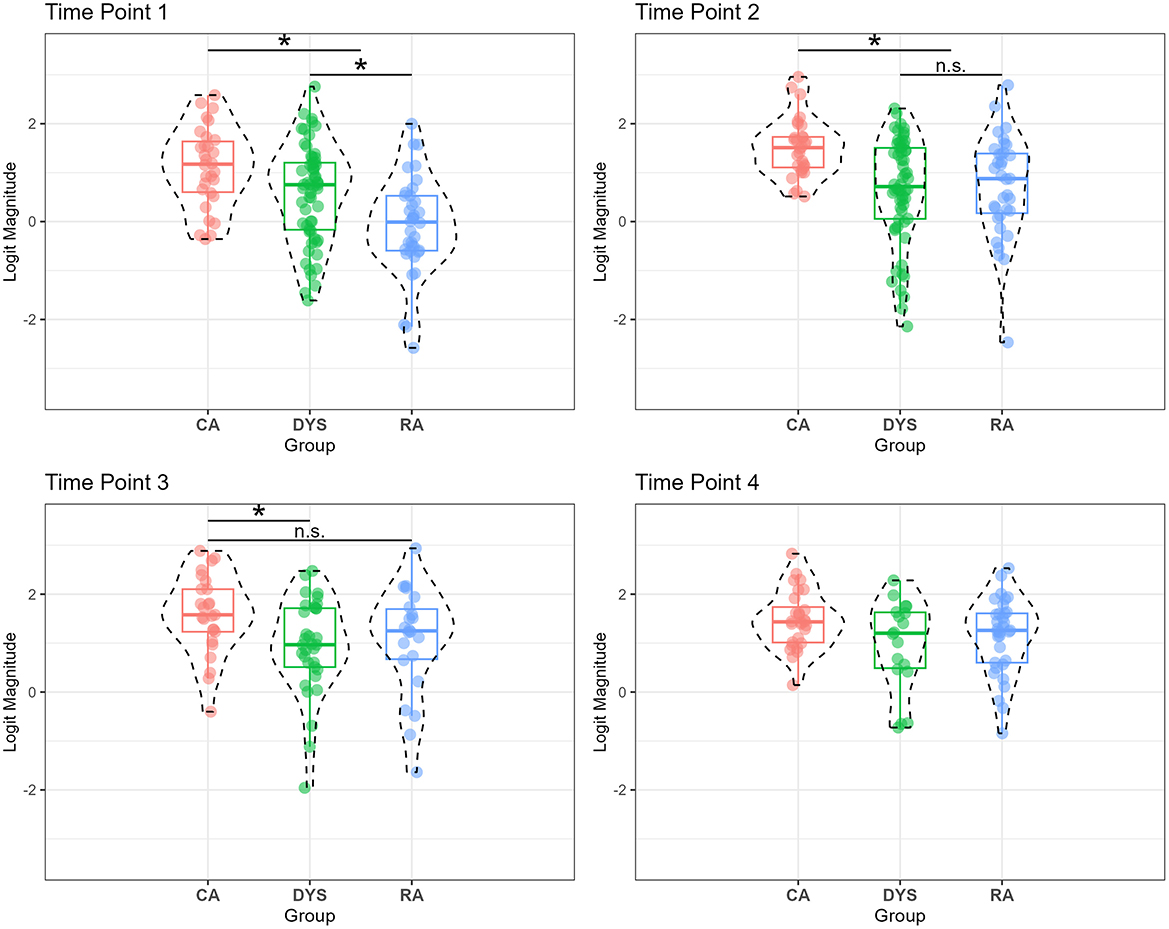
Figure 1. Box plot with individual data points and distribution for tapping consistency (Logit Magnitude) for chronological-age-matched controls (CA), those with dyslexia (DYS), and reading-age-matched controls (RA) at Time Points 1–4. *, Significant difference. n.s., no significant difference.
To explore H1, a repeated measures Friedman test (non-parametric ANOVA) for TP1–4 was conducted for each of the groups CA, RA, and DYS. Due to the design of the experiment, this analysis was less well-suited to the DYS group, as there is a systematic loss of DYS participants across TPs (due to the intervention schedule). Therefore, the Friedman test for DYS only compared TP1–3, thereby including DYS who did not receive an intervention. There was a significant positive effect of TP for groups CA and RA, CA: = 10.65, df = 3, p = 0.014, and RA: = 18.24, df = 3, p < 0.001, but the analysis for DYS revealed no effect of TP, DYS: = 2.24, df = 2, p < 0.326. However, the reduced number of TP in this analysis makes the non-significant effect difficult to interpret.
As Figure 1 shows, the CA group show greater consistency than the other two groups (DYS and RA) at TP1 but, subsequently, consistency improves at a faster rate for the younger TD children (RA group). The Kruskal–Wallis analyses by group revealed a significant difference between groups at TP1, TP2, and TP3, but there was no significant group difference by TP4 (see Table 3). The finding of no improvement in consistency for the control groups (RA and CA) between TP3 and TP4 suggests that they had reached optimal performance for their age. By TP4, the DYS group appear to have caught up developmentally. Follow-up pairwise comparisons were two-sided, with Bonferroni adjustment for multiple comparisons. At TP1, there was a significant difference between DYS and CA, H(1) = 20.21, p = 0.032; RA and DYS, H(1) = 20.45, p = 0.021; and RA and CA, H(1) = 40.66, p = 0.000. At TP2, there was a significant difference between DYS and CA, H(1) = 27.66, p = 0.001, and RA and CA, H(1) = 27.71, p = 0.005, with no significant difference between DYS and RA, H(1) = 0.05, p = 1.00. At TP3, there was a significant difference between DYS and CA, H(1) = 20.00, p = 0.002, with no significant difference between RA and CA, H(1) = 10.92, p = 0.322, or DYS and RA, H(1) = −9.09, p = 0.459. Accordingly, at TP1 and TP3, H2 (that tapping synchronization in DYS is worse than in CA) was supported for the magnitude measure. Further investigation of the control participants only (i.e., CA and RA) at TP1, using simple linear regression, showed that tapping consistency (magnitude) increased with increasing age [SE_beta = 0.631, t(60) = 6.30, CI (0.036,0.070), p < 0.001, = 0.388]. Accordingly, for the magnitude measure, rhythmic consistency does improve with age, supporting H1.
3.3 Individual and group tapping analyses
The Rayleigh test of uniformity was calculated for both tapping runs for each participant. The number of participants with at least one random tapping run (i.e., showing a uniform distribution, hence non-synchronizers) is reported in Table 4. Upon inspection, the table suggests that non-synchronizers were more frequent among the youngest TD participants and in children with DYS. For the within-groups analysis, a significant result from the Rayleigh test indicated that the data for the CA, DYS, and RA groups were concentrated around a preferred phase angle; see Figure 2. Thus, all groups display a significant preferred phase of tapping at each time point. Accordingly, H1 and H2 for the phase measure can be explored.
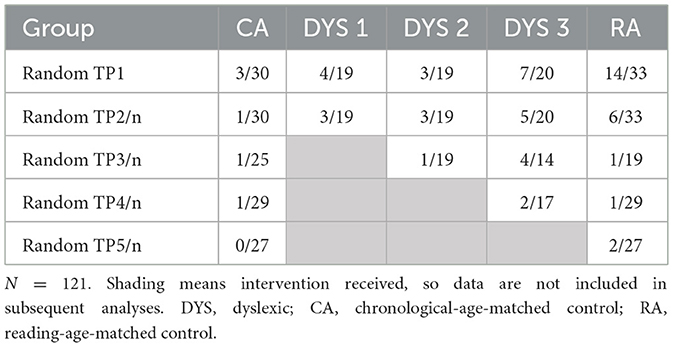
Table 4. Number of “non-synchronizers” in each group tapping in a random manner at each Time point (TP).
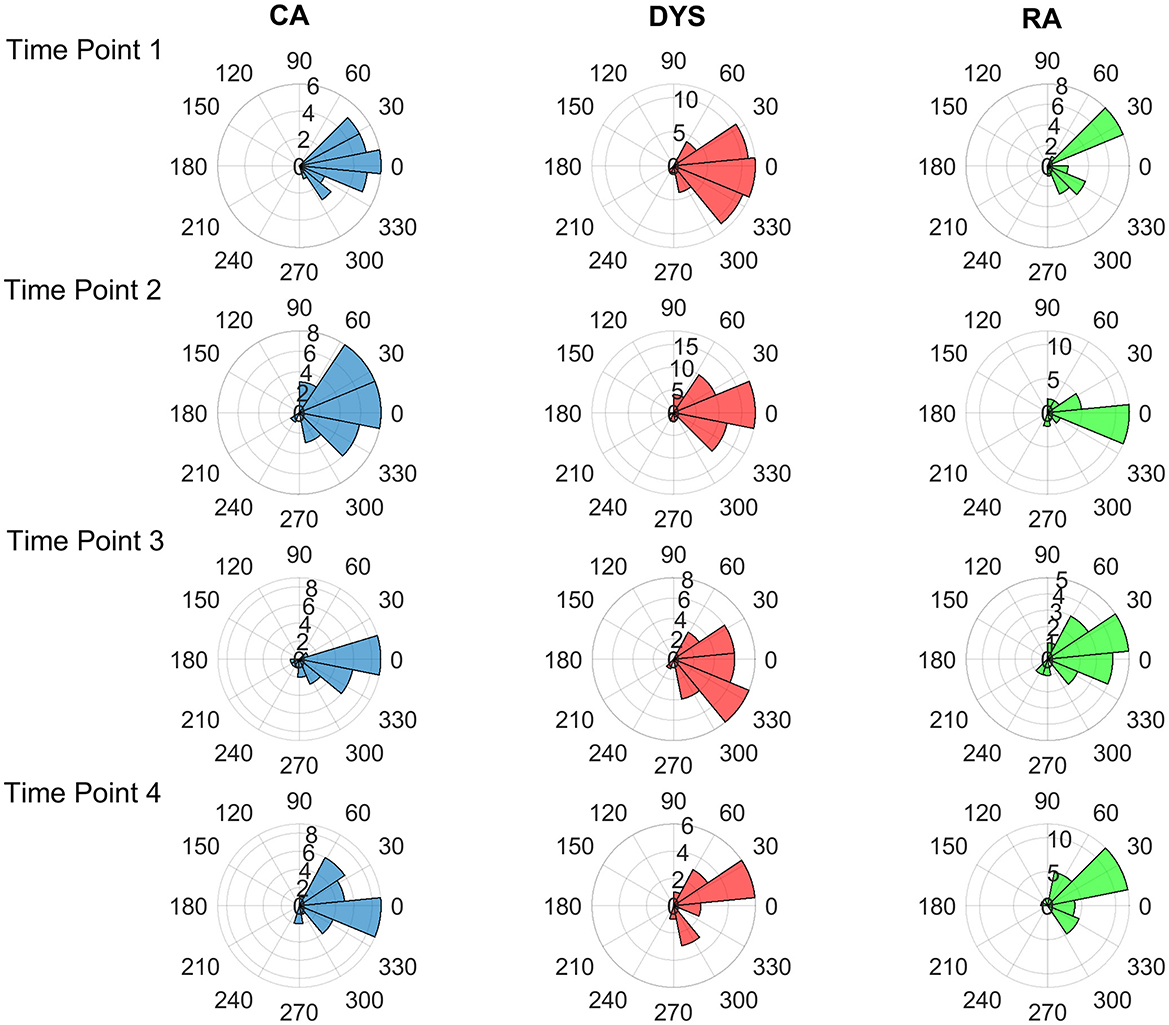
Figure 2. Polar histograms of tapping phase at Time Points 1–4 for synchronizers in each group, chronological-age-matched controls (CA), those with dyslexia (DYS), and reading-age-matched controls (RA).
3.3.1 Age effects and random tapping to a 2-Hz beat
To explore H1, that rhythmic synchronization should improve with age for the phase measure, as well as the magnitude measure, the number of non-synchronizers in the CA and RA groups were compared at TP1 (see Table 4). There was a significant effect of age on random tapping behavior (Fisher's exact test, p = 0.005, two-sided), with more RA children tapping at random (14/33, compared with CA, 3/30). By TP4, the RAs were at a similar (ceiling) performance level to the CA group (1/29, compared with CA, 1/28). Accordingly, H1 was supported.
3.3.2 Reading group and random tapping to a 2-Hz beat
H2 was that rhythmic synchronization in the children with DYS should be worse compared to CA children at all time points, as any improvement in tapping consistency with age found in children with DYS should lag that shown by TD children. The effect of reading status on tapping behavior was analyzed by comparing non-synchronizers among the CA children with non-synchronizers among the children with DYS, thereby matching the groups for age. At TP1, there was no significant difference between the number of participants tapping at random in each group, = 2.54, p = 0.1105; Fisher's exact test p = 0.093, one-sided; see Table 4. However, by TP2, the proportion of non-synchronizers in the TD group (1/30) was significantly less than in the DYS group (11/58), Fisher's exact test p = 0.038, one-sided. Accordingly, there was evidence to support H2.
3.3.3 Comparison of group preferred phase
The phase data by group are shown in Table 4 and Figure 2. As shown in the polar histograms provided, the phase data contained conditions where the data were significantly positively skewed (Z-skew > 1.96) or significantly platykurtic. In these cases, non-parametric analyses were used to explore group differences and further test H2, that age-related improvements in tapping behavior should lag in the DYS group. The Watson-Williams tests (circular one-way ANOVA) comparing the CA group with the DYS group at each time point were non-significant for all TPs tested for (a) participants who were synchronizers and (b) excluding intervention participants. Furthermore, a circular Kruskal–Wallis (non-parametric) test on the group median phase comparing the CA and DYS children at TP1 and TP3 was also not significant. Accordingly, the phase measure did not reveal any group differences, inconsistent with H2. The descriptive statistics and test results are shown in Supplementary Table 2. Note that the mean phase of a poor-synchronizer child tapping inconsistently but around the beat can be the same as the mean phase of a good-synchronizer child tapping consistently close to the beat. So, within each group, a distribution of phases will be related to the target tapping phase but unrelated to synchronization ability, which could account for the absence of group phase differences.
3.3.4 Relationships between phase angle and behavioral measures
No significant correlations were found between the tapping phase and any of the phonological or literacy measures. For the interested reader, the analysis and data are shown in Supplementary Tables 3, 4.
3.4 Longitudinal relationships between tapping consistency, phonological awareness, RAN, PSTM, and literacy
Given that the phase data did not show any effects of dyslexia status, the analyses testing H3 focused on the consistency data for the age-matched groups (CA and DYS only; see the scatterplots in Figures 3–6). H3 was that individual differences in rhythmic synchronization should predict phonological awareness and literacy outcomes. Figures 3–6 show partial correlations between tapping magnitudes on the ordinate at TP1, TP2, and TP3 against the phonological and literacy measures on the abscissa at TP2, TP3, and TP4, controlling for age and non-verbal IQ. It is important to control for age and non-verbal IQ to ensure that any differences found are not due to maturation or cognitive ability. For each combination of tapping consistency with the phonological or literacy measures, the least squares linear model fitted to the data in Figures 3–6 shows a positive relationship; that is, better consistency of tapping is associated with better phonology and literacy scores. The numeric data for both the composite measures and PSTM are presented in Table 5. Table 5 shows that all the time-lagged relations were significant at TPs 2 and 3, after which the literacy variables tend to display a greater number of significant relationships.
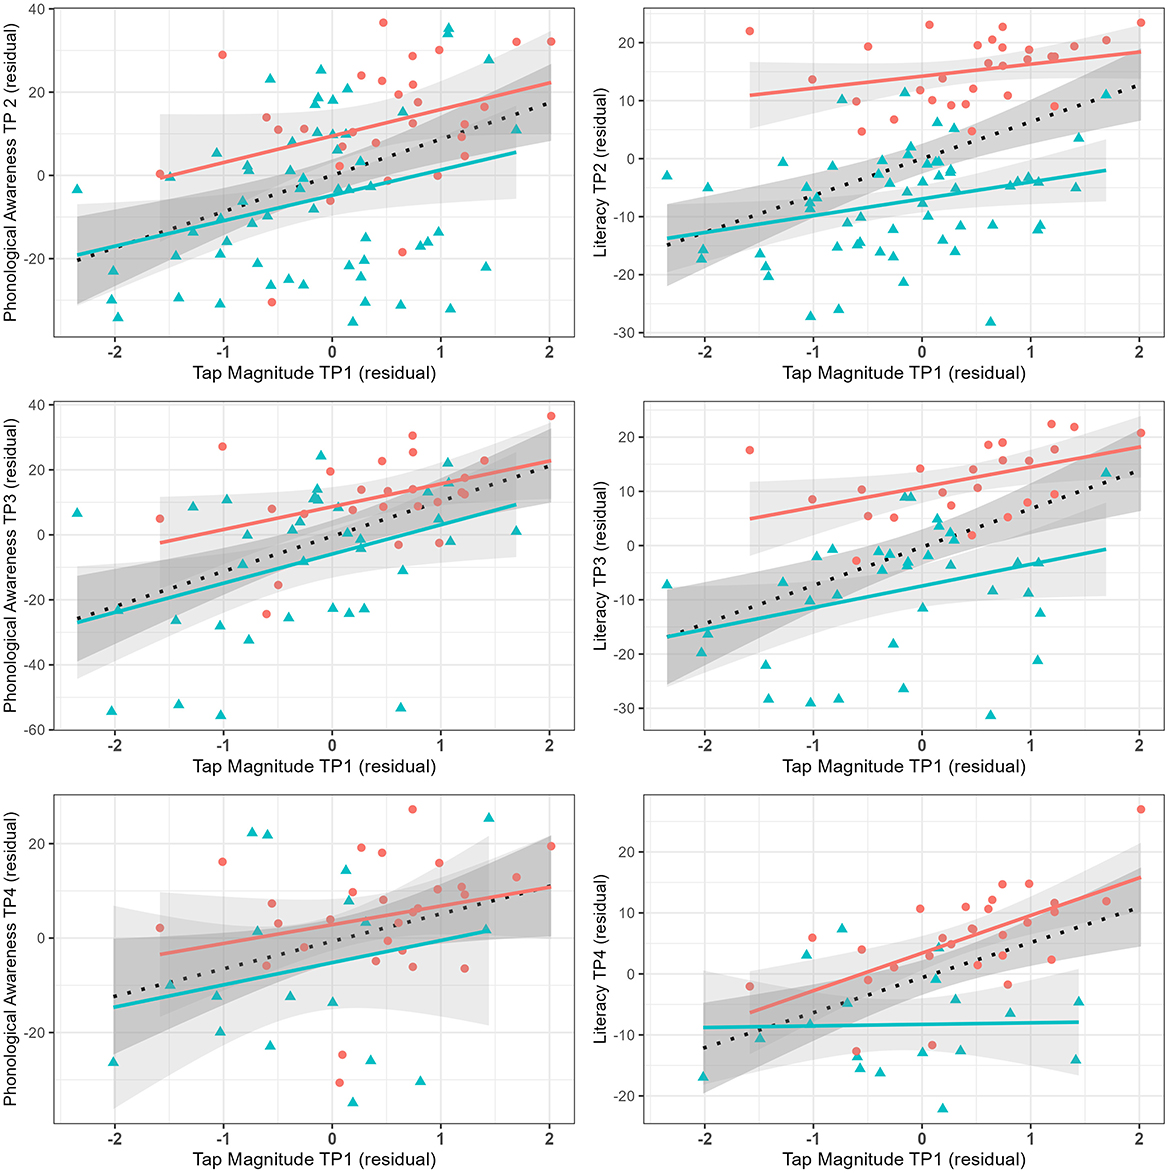
Figure 3. Plot of Spearman partial correlation between tapping consistency (Tap Magnitude) at time Point 1 (TP1) and composite phonological awareness (left column) and composite literacy scores (right column) at Time Points 2, 3, and 4 (TP2, TP3, and TP4). The scatterplots display time-lagged relationships between tapping consistency and composite phonological awareness scores and composite literacy measures accounting for age and non-verbal IQ (residual scores). The lines show a least squares linear model with standard error shading. Aqua Triangle, those with dyslexia (DYS); Orange Circle, chronological-age-matched controls (CA); Dashed, DYS and CA.
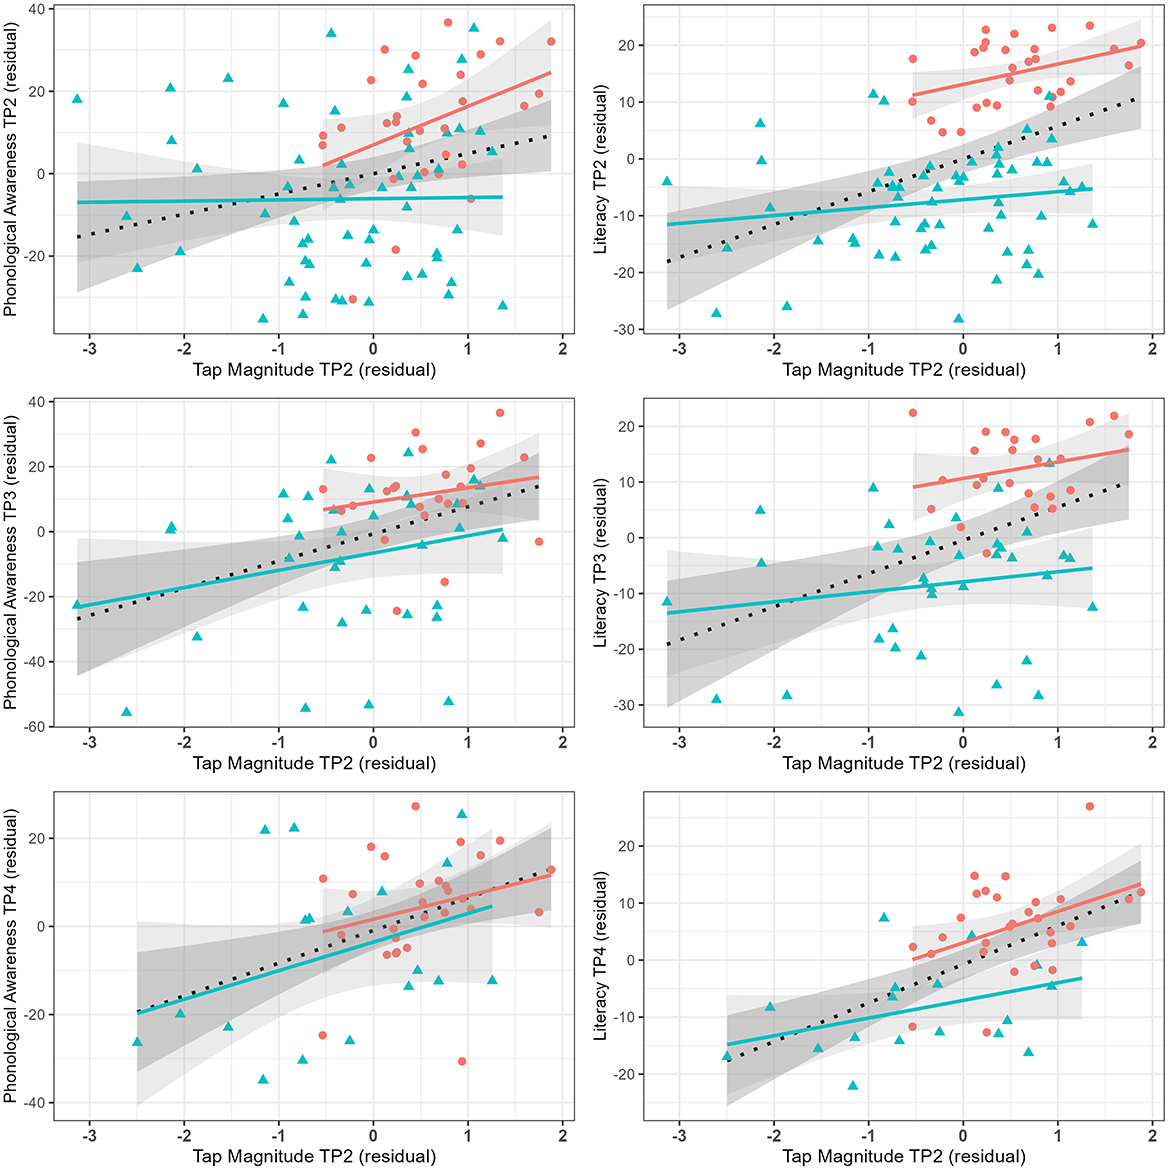
Figure 4. Plot of Spearman partial correlation between tapping consistency (Tap Magnitude) at Time Point 2 (TP2) and composite phonological awareness (left column) and composite literacy scores (right column) at Time Points 2, 3, and 4 (TP2, TP3, and TP4). The scatterplots display time-lagged relationships between tapping consistency and composite phonological awareness scores or composite literacy measures accounting for age and non-verbal IQ (residual scores). Lines show a least squares linear model with standard error shading. Aqua Triangle, those with dyslexia (DYS); Orange Circle, chronological-age-matched controls (CA); Dashed, DYS and CA.
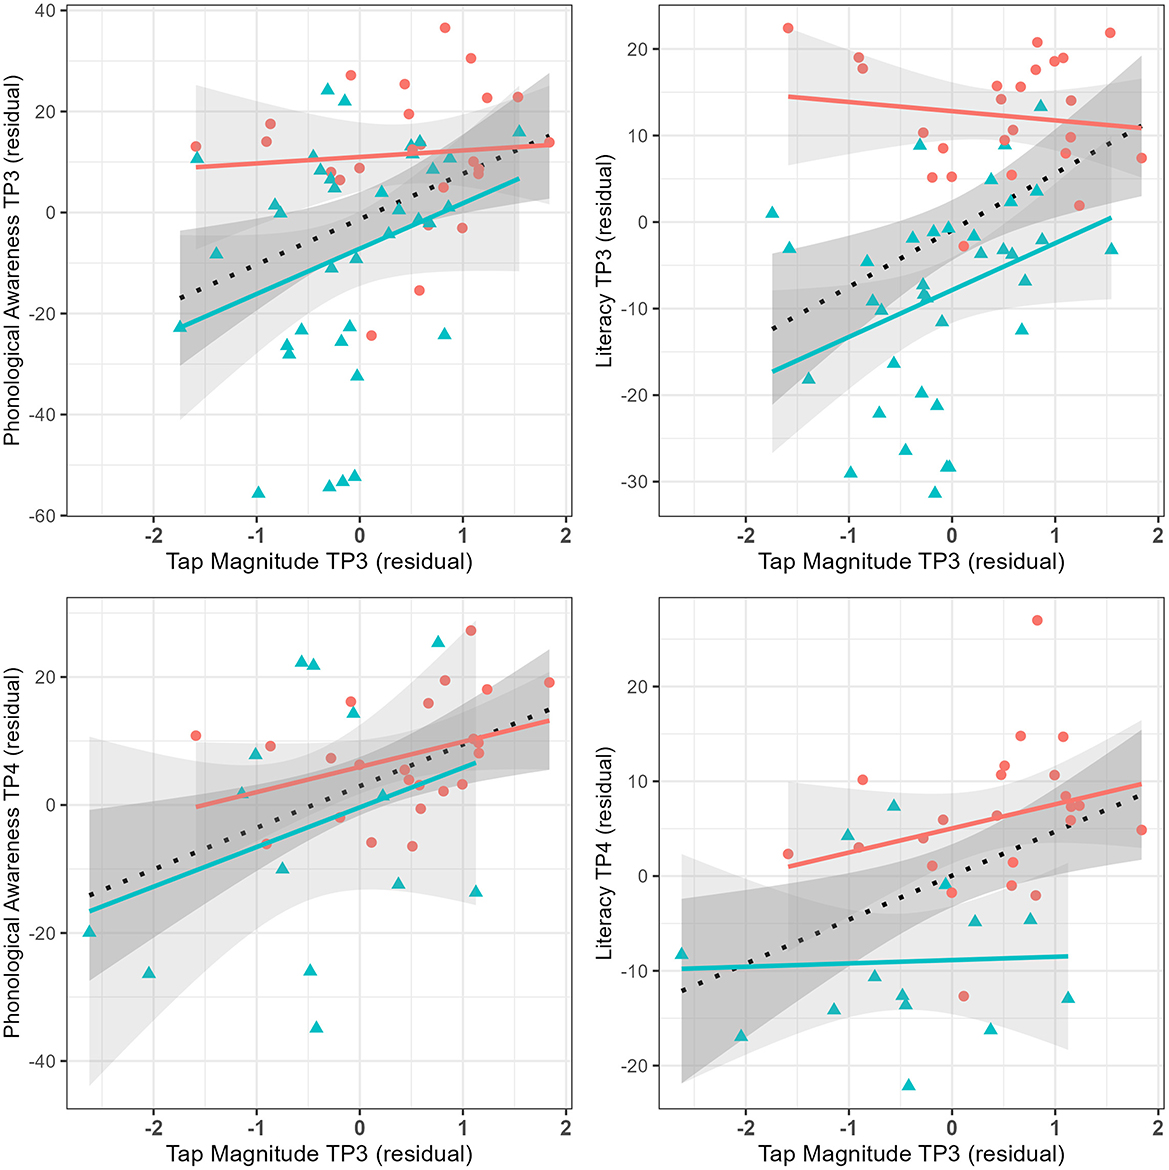
Figure 5. Plot of Spearman partial correlation between tapping consistency (Tap Magnitude) at time point Time Point 3 and composite phonological awareness (left column) and composite literacy scores (right column) at Time Points 3 and 4. The scatterplots display time-lagged relationships between tapping consistency and composite phonological awareness scores or composite literacy measures accounting for age and non-verbal IQ (residual scores). Lines show a least squares linear model with standard error shading. Aqua Triangle, those with dyslexia (DYS); Orange Circle, chronological-age-matched controls (CA); Dashed, DYS and CA.
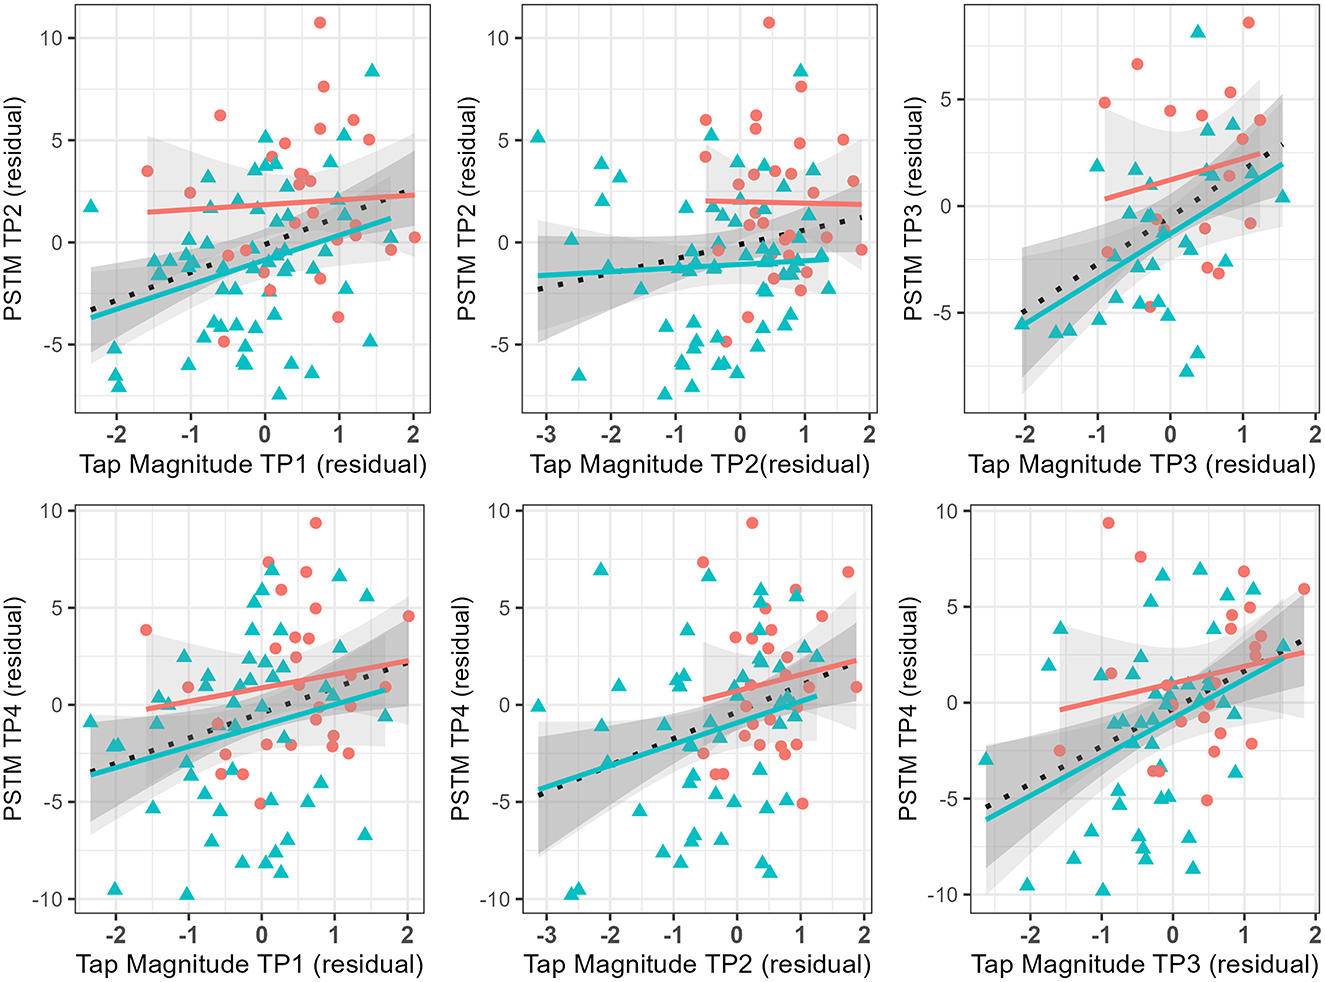
Figure 6. Plot of Spearman partial correlation between tapping consistency (Tap Magnitude) at Time Points 1, 2, and 3 and PSTM at Time Points 2, 3, and 4. The scatterplots display time-lagged relationships between tapping magnitude (consistency) and PSTM measures accounting for age and non-verbal IQ (residual scores). Lines show a least squares linear model with standard error shading. Aqua Triangle, those with dyslexia (DYS); Orange Circle, chronological-age-matched controls (CA); Dashed, DYS and CA.
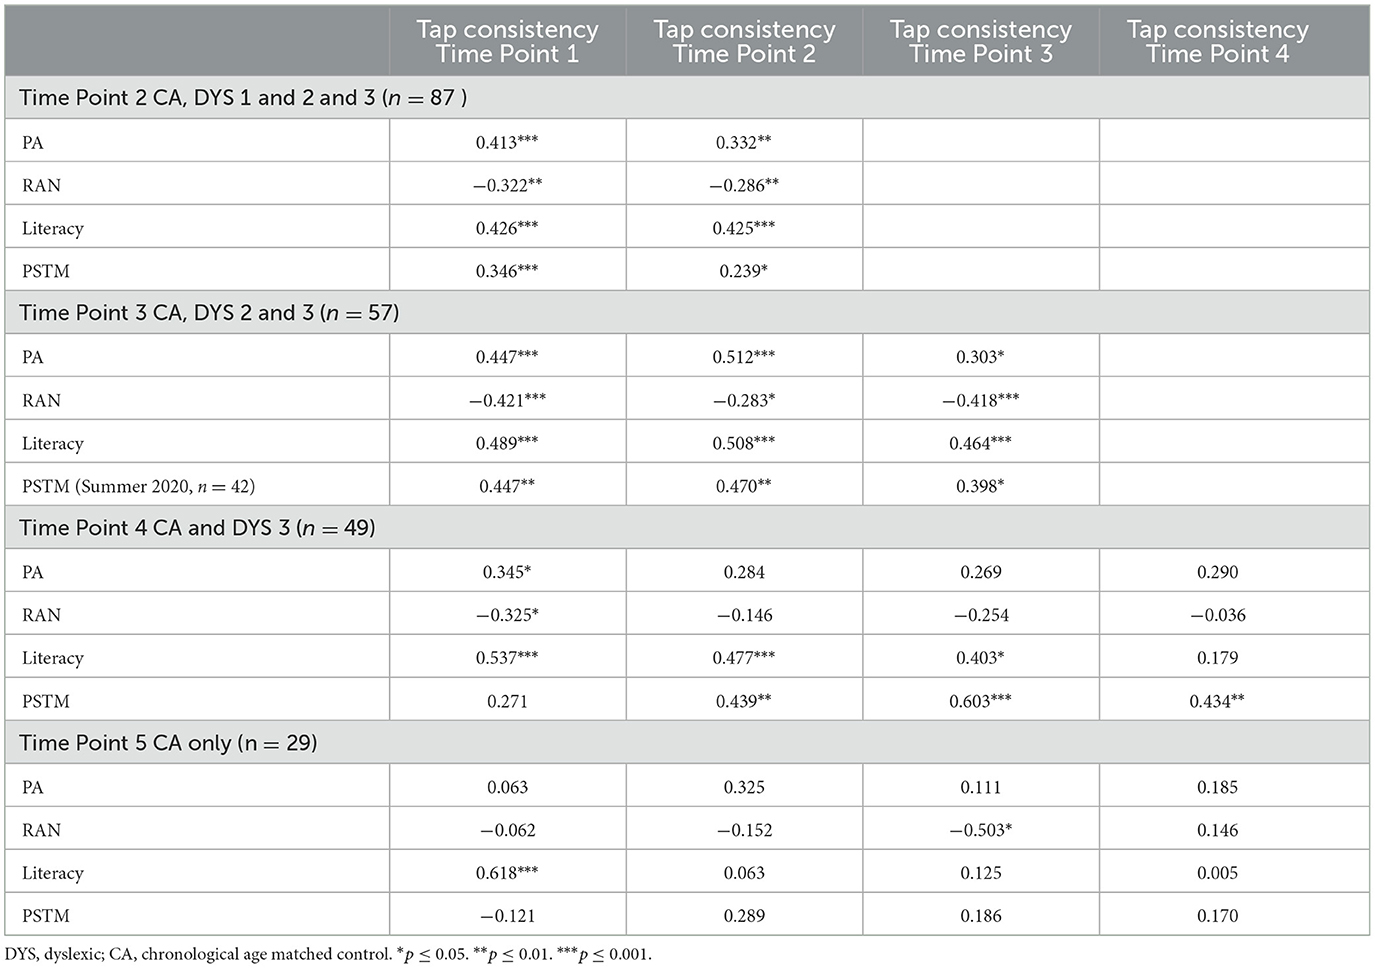
Table 5. Spearman time-lagged partial correlations between tapping consistency at Time Points 1, 2, 3 and 4 and RAW scores in the composite phonological awareness (PA), rapid automatized naming (RAN), composite literacy, and phonological short term memory (PSTM) outcomes at Time Points 2, 3, 4, and 5, controlling for age and non-verbal IQ (CA and DYS only).
3.5 Mediation effects regarding phonological awareness
3.5.1 Cross-sectional mediation effects
The central research question underpinning this study was whether the relationship between rhythmic synchronization and literacy outcomes would be mediated by phonological awareness (H4). A series of cross-sectional mediation analyses for each TP were conducted using the PROCESS macro (Type 4 model; Hayes, 2022) in SPSS. The mediation model consisted of the composite Literacy score as the outcome variable, tapping consistency as the predictor variable and composite PA as the mediator. Indirect 95% confidence intervals were estimated using 5,000 samples. In addition, the Sobel test was run to test the significance of a mediation effect (Preacher and Leonardelli, 2001). Based on H4, we would expect a significant indirect effect of phonological awareness, so the Sobel value should be significant. The results of the cross-sectional mediation analyses are shown in Table 6.
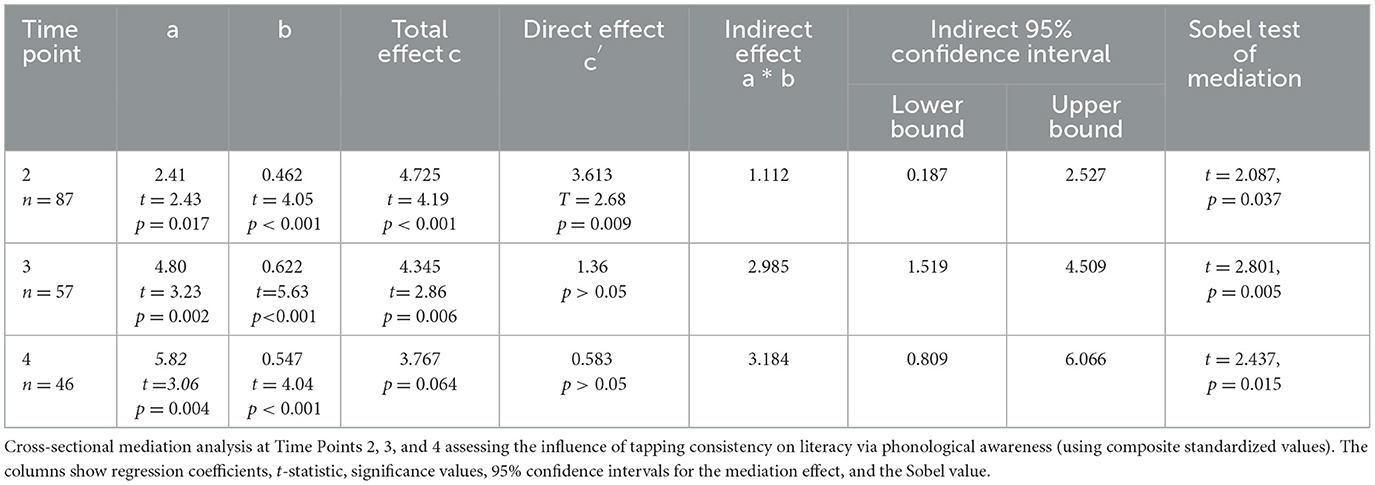
Table 6. Regression coefficients a, b, c, and c′ for a Type 4 Mediation model.
For TP2, the analysis showed that tapping consistency at TP2 significantly predicted phonological awareness at TP2, R2 = 0.065, F(1,85) = 5.926, p < 0.05. Of the variance in phonological awareness at TP2, 6.5% was explained by tapping consistency at TP2. In a subsequent combined regression model predicting literacy, both tapping consistency at TP2 and phonological awareness at TP2 were included as predictors, resulting in a model that explained 30.7% of the variance in literacy at TP2. Tapping at TP2 was a significant predictor of literacy at TP2 (B = 3.61, SE =1.13, β = 0.316, t = 3.37, p = 0.001) and so was phonological awareness at TP2 (B = 0.46, SE = 0.11, β = 0.381, t = 4.06, p < 0.001). The mediating effect of phonological awareness was shown to be significant (B = 1.11, β = 0.097), with the 95% bootstrapped confidence interval not containing zero. The results for TP2 show a partial mediation of the effect of tapping consistency on literacy via phonological awareness. The Sobel test was significant (p < 0.05), supporting a mediation effect.
Mediation analyses at TP3 again showed that tapping consistency significantly predicted phonological awareness at TP3, R2 = 0.159, F(1,55) = 10.43, p = 0.002, indicating that 15.9% of the variance in phonological awareness at TP3 was explained by tapping consistency at TP3. In the combined regression model predicting literacy, both tapping consistency at TP3 and phonological awareness at TP3 were included as predictors, resulting in a model that explained 45.1% of the variance in literacy at TP3. Tapping at TP3 was not significantly predictive of literacy at TP3 (p > 0.05) whereas phonological awareness at TP3 was (B = 0.627, SE = 0.11, β = 0.618, t = 5.63, p < 0.001). The full mediating effect of phonological awareness was shown to be significant (B = 2.985, β = 0.247), with the 95% bootstrapped confidence interval not containing zero. The result of the analysis for TP3 shows a full mediation effect of tapping on literacy via phonological awareness. The Sobel test was significant (p < 0.01) supporting a mediation effect.
Mediation analyses at TP4 showed that tapping consistency was a significant predictor of phonological awareness at TP4, R2 = 0.175, F(1,44) = 9.35, p = 0.004, indicating that 17.5% of the variance in phonological awareness at TP4 was explained by tapping consistency at TP4. In a combined regression model predicting literacy, both tapping consistency at TP4 and phonological awareness at TP4 were included as predictors, resulting in a model that explained 33% of the variance in literacy at TP4, R2 = 0.330, F(1,44) = 9.35, p = 0.004. Tapping at TP4 was not a significant predictor of Literacy at TP4 (p > 0.05), whereas phonological awareness at TP4 was a significant predictor of Literacy at TP4 (B = 0.547, SE = 0.14, β = 0.56, t = 4.04, p < 0.001). The full mediating effect of phonological awareness was shown to be significant (B = 3.18, β = 0.247), with the 95% bootstrapped confidence interval not containing zero. The analysis results for TP4 show a full mediation effect of tapping on literacy via phonological awareness. The Sobel test was significant (p < 0.05) supporting a mediation effect. The results of the cross-sectional mediation analysis at TP2–TP4 and the Sobel test are shown in Table 6.
3.5.2 Longitudinal meditation effects
Note that the study was underpowered with respect to conducting longitudinal mediation analyses. For the interested reader, these analyses were conducted on an exploratory basis and are presented in the Supplementary Data 3.
3.6 Longitudinal effects of tapping on phonological awareness
In a final regression analysis, the influence of tapping at TP1 on phonological awareness at TP3 (n = 58) after controlling for phonological awareness at TP0 (the autoregressor) was investigated and was significant, B = 4.420, β = 0.391, t = 3.487, p < 0.001, f2 = 0.22, (1 – β) = 0.88, accounting for 14.6% of the variance in phonological awareness at TP3. This indicates that individual differences in synchronization exert longitudinal effects on the development of phonological awareness.
4 Discussion
The extent to which individual differences in children's rhythmic synchronization skills, such as tapping to a beat, are relevant to the development of linguistic and literacy skills remains debated. Here we provide data from a longitudinal study of tapping to the beat in school-aged children, including cross-sectional mediation analyses to study whether the relations between rhythmic synchronization skills and literacy are mediated by phonological awareness. The study tested 121 children, including 58 children with DYS, over 6 years. We employed circular statistics (consistency and phase measures) to explore the relations between tapping skills, phonological awareness and literacy. We report that performance in all three tasks is significantly interrelated, with tapping consistency predicting literacy outcomes in time-lagged analyses at all time points. Cross-sectional mediation analyses confirmed that this relationship was mediated by phonological awareness at each time point. The number of children able to synchronize (synchronizers) increased with age, as did synchronization consistency; however, children with DYS showed poorer synchronization skills at each time point until the final test point at age 11 years.
The study was designed as a test of TS theory, which predicts that the relations between rhythmic synchronization and literacy/language outcomes are mediated by phonology (Goswami, 2011, 2015, 2022a). Four hypotheses were explored. H1 was that rhythmic synchronization should improve with age. H2 was that rhythmic synchronization in the children with dyslexia should be significantly worse at any time point compared to TD children of the same age because children with dyslexia should consistently lag TD children regarding age-related improvements in rhythmic synchronization. H3 stated that individual differences in rhythmic synchronization should predict phonological development and literacy outcomes, and H4 stated that the relationship between rhythmic synchronization and literacy outcomes should be mediated by phonological processing. As noted, the study was underpowered regarding testing for longitudinal mediation relations; hence, cross-sectional mediation analyses are reported.
Robust evidence for H1 was found for the tapping consistency measure of rhythmic synchronization (magnitude or vector length measure) but not for the mean phase measure. This suggests that the mean phase metric was not capturing the difference in tapping behavior between groups. The mean phase of a poor synchronizer can be the same as the mean phase of a good synchronizer, which can result in each group having a distribution of phases that are primarily related to the target tapping phase (0°) but are not necessarily related to synchronization ability per se. Indeed, Figure 2 and Supplementary Table 2, show the large amount of overlapping variance in the phase measures of the groups. Synchronization consistency increased with age in our older sample of children, a finding that has not been reported in longitudinal studies with younger children (e.g., Kertész and Honbolyg, 2023; Rios-Lopez et al., 2019). For the phase measure, the data showed that all the groups of children, even the youngest RA group, were able to establish reliable synchronization, at all TPs tested. H2, that rhythmic synchronization in the children with dyslexia should be significantly worse at any TP compared to TD children of the same age, was also supported for the consistency measure only. For the consistency measure of tapping, the children with dyslexia showed significantly poorer performance at TP1, TP2, and TP3 compared to the TD age-matched controls, indicating worse rhythmic synchronization. By TP4, when the children were aged, on average, 11 years, this group difference had disappeared. Practice, age, and ceiling effects may explain why group differences in our study disappeared at the age of 11 years. Referencing Figure 1 and Table 3, the CA control group started at TP1 being significantly better than the other children in their tapping consistency. The younger TD group (RA) then improved at a greater rate than the DYS group so that by TP2, the RA group caught up with the DYS group. By TP3, the RA group had overtaken the DYS group and caught up with the CA group. There is no improvement in consistency for the TD control groups (RA and CA) between TP3 and TP4 suggesting they had reached ceiling performance. The DYS group finally catches up with the control groups at TP4.
The group differences at TP1, TP2, and TP3 are consistent with many prior cross-sectional studies, including studies with adults (Thomson and Goswami, 2008; Flaugnacco et al., 2015; Bégel et al., 2022). H2 was also supported by the analyses of synchronizers and non-synchronizers. The number of non-synchronizers was significantly greater in the dyslexic group than in the TD group at all TPs except TP1. This finding supports prior work with both TD preschoolers and 4-year-olds at risk for dyslexia (Woodruff Carr et al., 2014; Bonacina et al., 2021; Kalashnikova et al., 2021a).
As may be expected given the extensive prior literature (Bégel et al., 2022; Sousa et al., 2022; Cumming et al., 2015; Dellatolas et al., 2009; Douglas and Willatts, 1994; Forgeard et al., 2008; Gordon et al., 2015; Goswami et al., 2013a,b; Huss et al., 2011; Lundetrae and Thomson, 2018; Overy, 2000, 2003; Overy et al., 2003; Waber et al., 2000; Wolff, 2002; Wolff et al., 1990), individual differences in rhythmic synchronization (consistency measure) significantly predicted phonological development and literacy outcomes when time-lagged relations were computed (Table 5), supporting H3. However, there was some longitudinal variability, with the relationship between rhythmic synchronization and phonological development strongest at the earlier TPs in the study. The composite variables developed to test H3 showed that better tapping consistency was associated with better phonological outcomes at TP2, TP3, and TP4, but this association was no longer significant by TP5 (CA control children only), even though a positive relationship was still present (see Table 5 and Figures 3–6). For the literacy composite, the relationship between rhythmic synchronization at TP1 and literacy development was significant at all TPs measured. As the relationship between reading and phonological development becomes a reciprocal one after the onset of fluent reading (Wagner and Torgesen, 1987), reading itself may improve phonological skills for our older children, attenuating the impact of the relationship between rhythmic synchronization and phonology.
Finally, in line with the predictions of TS theory, we explored the potentially mediating effect of phonology regarding the systematic relations found between rhythmic synchronization and literacy outcomes. By TS theory, impairments in rhythmic processing are causally related to impaired acoustic processing and impaired neural encoding of the AE of speech, which exert negative effects on speech perception (e.g., of syllable stress patterns; see Goswami et al., 2010, 2013b) and phonological development. AE processing and AE encoding are known to be impaired in children with DYS across languages (see Goswami et al., 2013b, for a recent review), and negative impacts on phonological development and reading and spelling development have been consistently demonstrated. Accordingly, individual differences in rhythmic synchronization should affect literacy development via a direct effect on phonological development (H4). Consistent with H4, a series of cross-sectional mediation analyses demonstrated a significant mediating effect of phonology between rhythmic synchronization and literacy at all TPs investigated. The consistent mediation effects demonstrated for phonological awareness in the cross-sectional analyses are consistent with TS theory.
The study had some clear limitations. One of the limitations of the study was the impact of the COVID-19 pandemic on school closures, which restricted data collection and interfered with the original research design. This resulted in missing data for some children. Another inadvertent limitation was the effect of the study design on the longitudinal analyses testing H3 and H4. The three interventions for the DYS groups delivered during the study introduced a systematic loss of data that limited the available power for our longitudinal analyses. A further limitation is that the children were relatively old when the study began, with an average age of 8 years. Although 8 years was the oldest age tested in the prior longitudinal study by Kertész and Honbolyg (2023), there is little longitudinal data available regarding the development of rhythmic synchronization skills in children aged 5–8 years. However, in the UK, receiving a diagnosis of DYS before the age of 8–9 years is rare, which is why this average age was used for recruitment in the current study.
In conclusion, the tapping consistency data presented here support all four of the a priori hypotheses concerning rhythmic synchronization and literacy, but the tapping phase data are not. Rhythmic synchronization ability did increase with age, (H1), rhythmic synchronization ability in the children with DYS was significantly poorer at TP1–TP3 compared to children of the same age without DYS (H2), individual differences in rhythmic synchronization ability predicted phonological development and literacy outcomes (H3), and the cross-sectional relationships between rhythmic synchronization and literacy were mediated by phonological awareness (H4). Accordingly, the sensory/neural TS theory can explain why atypical rhythmic processing during infancy and early childhood is a risk factor for developmental language disorders, such as DYS (Ladányi et al., 2020). The sensory/neural processing of rhythm is a key factor underpinning phonological development in children and, consequently, exerts important effects on children's subsequent reading and spelling development.
Data availability statement
Anonymised data and derivatives are available on the Open Science Framework (OSF) project: Tapping to the beat by children with and without dyslexia (https://osf.io/d6psy/) or by contacting the senior author (dWNnMTBAY2FtLmFjLnVr).
Ethics statement
The studies involving humans were approved by the Psychology Research Ethics Committee, University of Cambridge, UK. Ethics Ref: CPREC PRE.2017.078. The studies were conducted in accordance with the local legislation and institutional requirements. Written informed consent for participation in this study was provided by the participants' legal guardians/next of kin.
Author contributions
SF: Data curation, Formal analysis, Methodology, Software, Validation, Visualization, Writing – original draft, Writing – review & editing. AW: Investigation, Data curation, Writing – review & editing. FG: Investigation, Data curation, Writing – review & editing. AM: Investigation, Data curation, Writing – review & editing. GF: Investigation, Data curation, Writing – review & editing. KM: Writing – review & editing. UG: Conceptualization, Funding acquisition, Methodology, Project administration, Supervision, Writing – original draft, Writing – review & editing.
Funding
The author(s) declare that financial support was received for the research and/or publication of this article. This research was funded by a grant awarded to UG by the Fondation Botnar (project number: 6064).
Acknowledgments
The study data were collected and managed using REDCap electronic data capture tools hosted at the University of Cambridge (Harris et al., 2009, 2019).
Conflict of interest
The authors declare that the research was conducted in the absence of any commercial or financial relationships that could be construed as a potential conflict of interest.
Generative AI statement
The author(s) declare that no Gen AI was used in the creation of this manuscript.
Publisher's note
All claims expressed in this article are solely those of the authors and do not necessarily represent those of their affiliated organizations, or those of the publisher, the editors and the reviewers. Any product that may be evaluated in this article, or claim that may be made by its manufacturer, is not guaranteed or endorsed by the publisher.
Supplementary material
The Supplementary Material for this article can be found online at: https://www.frontiersin.org/articles/10.3389/fdpys.2025.1528427/full#supplementary-material
References
Bégel, V., Dalla Bella, S., Devignes, Q., Vandenbergue, M., Lemaître, M.-P., and Dellacherie, D. (2022). Rhythm as an independent determinant of developmental dyslexia. Dev. Psychol. 58, 339–358. doi: 10.1037/dev0001293
Berens, P. (2009). CircStat: A MATLAB toolbox for circular statistics. J. Stat. Softw. 31:10. doi: 10.18637/jss.v031.i10
Bhide, A., Power, A. J., and Goswami, U. (2013). A rhythmic musical intervention for poor readers: a comparison of efficacy with a letter-based intervention. Mind Brain Educ. 7, 113–123. doi: 10.1111/mbe.12016
Bonacina, S., Huang, S., White-Schwoch, T., Krizman, J., Nicol, T., and Kraus, N. (2021). Rhythm, reading, and sound processing in the brain in preschool children. NPJ Sci. Learn. 6:20. doi: 10.1038/s41539-021-00097-5
Cancer, A., Bonacina, S., Antonietti, A., Salandi, A., Molteni, J., and Lorusso, M. L. (2020). The effectiveness of interventions for developmental dyslexia: Rhythmic reading training compared with hemisphere-specific stimulation and action video games. Front. Psychol. 11:1158. doi: 10.3389/fpsyg.2020.01158
Cancer, A., De Salvatore, M., Granocchio, E., Andreoli, L., Antonietti, A., and Sarti, D. (2022). The role of auditory and visual components in reading training: No additional effect of synchronized visual cue in a rhythm-based intervention for dyslexia. Appl. Sci. 12:3360. doi: 10.3390/app12073360
Cohen, P., Cohen, J., Aiken, L. S., and West, S. G. (1999). The problem of units and the circumstances for POMP. Multivar. Behav. Res. 34, 315–346. doi: 10.1207/S15327906MBR3403_2
Colling, L. J., Noble, H. L., and Goswami, U. (2017). Neural entrainment and sensorimotor synchronization to the beat in children with developmental dyslexia: an EEG study. Neuroscience 11:360. doi: 10.3389/fnins.2017.00360
Cumming, R., Wilson, A., Leong, V., Colling, L., and Goswami, U. (2015). Awareness of rhythm patterns in speech and music in children with specific language impairments. Front. Hum. Neurosci. 9:672. doi: 10.3389/fnhum.2015.00672
Degé, F., and Schwarzer, G. (2011). The effect of a music program on phonological awareness in preschoolers. Front. Psychol. 2:124. doi: 10.3389/fpsyg.2011.00124
Dellatolas, G., Watier, L., Le Normand, M.-T., Lubart, T., and Chevrie-Muller, C. (2009). Rhythm reproduction in kindergarten, reading performance at second grade, and developmental dyslexia theories. Arch. Clin. Neuropsychol. 24, 555–563. doi: 10.1093/arclin/acp044
Douglas, S., and Willatts, P. (1994). The relationship between musical ability and literacy skills. J. Res. Read. 17, 99–107. doi: 10.1111/j.1467-9817.1994.tb00057.x
Dunn, L. M., Dunn, D. M., and Whetton, Burley. (2009). British Picture Vocabulary Scale, 3rd Edn. London: GL Assessment.
Elliot, C. D., Smith, P., and McCulloch, K. (1996). British Ability Scales (2nd ed.). Slough: NFER-NELSON.
Fiveash, A., Bella, S. D., Bigand, E., Gordon, R. L., and Tillman, B. (2022). You got rhythm, or more: The multidimensionality of rhythmic abilities. Atten. Percept. Psychophys. 84, 1370–1392. doi: 10.3758/s13414-022-02487-2
Flanagan, S., Moore, B. C. J., Wilson, A. M., Gabrielczyk, F. C., Macfarlane, A., Mandke, K., et al. (2021). Development of binaural temporal fine structure sensitivity in children. J. Acoust. Soc. Am. 150:4. doi: 10.1121/10.0006665
Flanagan, S., Wilson, A. M., Gabrielczyk, F. C., Macfarlane, A., Mandke, K., and Goswami, U. (2024). Amplitude rise time sensitivity in children with and without dyslexia: differential task effects and longitudinal relations to phonology and literacy. Front. Psychol. 15:1245589. doi: 10.3389/fpsyg.2024.1245589
Flaugnacco, E., Lopez, L., Terribili, C., Montico, M., Zoia, S., and Schön, D. (2015). Music training increases phonological awareness and reading skills in developmental dyslexia: a randomized control trial. PLoS ONE 10:e0138715. doi: 10.1371/journal.pone.0138715
Forgeard, M., Schlaug, G., Norton, A., Rosam, C., Iyengar, U., and Winner, E. (2008). The relation between music and phonological processing in normal-reading children and children with dyslexia. Music Percept. 25, 383–390. doi: 10.1525/mp.2008.25.4.383
Frederickson, N., Frith, U., and Reason, R. (1997). Phonological Assessment Battery: Standardised edition. Slough: NFER-Nelson.
Gordon, R. L., Shivers, C. M., Wieland, E. A., Kotz, S. A., Yoder, P. J., and Devin McAuley, J. (2015). Musical rhythm discrimination explains individual differences in grammar skills in children. Dev. Sci. 18, 635–644. doi: 10.1111/desc.12230
Goswami, U. (2011). A temporal sampling framework for developmental dyslexia. Trends Cog. Sci. 15, 3–10. doi: 10.1016/j.tics.2010.10.001
Goswami, U. (2015). Sensory theories of developmental dyslexia: three challenges for research. Nat. Rev. Neurosci. 16, 43–54. doi: 10.1038/nrn3836
Goswami, U. (2022a). Language acquisition and speech rhythm patterns: an auditory neuroscience perspective. R. Soc. Open Sci. 9:211855. doi: 10.1098/rsos.211855
Goswami, U. (2022b). “Theories of dyslexia,” in The Cambridge Handbook of Dyslexia and Dyscalculia, eds. M. Skeide (Cambridge: Cambridge University Press), 5–24. doi: 10.1017/9781108973595.002
Goswami, U., Gerson, D., and Astruc, L. (2010). Amplitude envelope perception, phonology and prosodic sensitivity in children with developmental dyslexia. Read. Writ. 23, 995–1019. doi: 10.1007/s11145-009-9186-6
Goswami, U., Huss, M., Mead, N., Fosker, T., and Verney, J. (2013a). Perception of patterns of musical beat distribution in phonological developmental dyslexia: significant longitudinal relations with word reading and reading comprehension. Cortex 49, 1363–1376. doi: 10.1016/j.cortex.2012.05.005
Goswami, U., Mead, N., Fosker, T., Huss, M., Barnes, L., and Leong, V. (2013b). Impaired perception of syllable stress in children with dyslexia: a longitudinal study. J. Mem. Lang. 69, 1–17. doi: 10.1016/j.jml.2013.03.001
Greenberg, S. (2006). “A multi-tier framework for understanding spoken language,” in Listening to speech: An auditory perspective, eds. S. Greenberg and W. Ainsworth (New Jersey: Lawrence Erlbaum Associates).
Harris, P. A., Taylor, R., Minor, B. L., Elliott, V., Fernandez, M., O'Neal, L., et al. (2019). The REDCap consortium: building an international community of software partners. J. Biomed Inform. 95:103208. doi: 10.1016/j.jbi.2019.103208
Harris, P. A., Taylor, R., Thielke, R., Payne, J., Gonzalez, N., and Conde, J. G. (2009). Research electronic data capture (REDCap)—A metadata driven methodology and workflow process for providing translational research informatics support. J. Biomed. Inform. 42, 377–381. doi: 10.1016/j.jbi.2008.08.010
Hayes, A. F. (2022). Introduction to Mediation, Moderation, and Conditional Process Analysis: A Regression-Based Approach (3rd edition). New York: The Guilford Press.
Huss, M., Verney, J. P., Fosker, T., Mead, N., and Goswami, U. (2011). Music, rhythm, rise time perception and developmental dyslexia: Perception of musical meter predicts reading and phonology. Cortex 47, 674–689. doi: 10.1016/j.cortex.2010.07.010
Kalashnikova, M., Burnham, D., and Goswami, U. (2021a). Rhythm discrimination and metronome tapping in 4-year-old children at risk for developmental dyslexia. Cog. Dev. 60:101129. doi: 10.1016/j.cogdev.2021.101129
Kalashnikova, M., Burnham, D., and Goswami, U. (2021b). The role of paired associate learning in acquiring letter-sound correspondences: a longitudinal study of children at family risk for dyslexia. Sci. Stud. Read. 25, 504–518. doi: 10.1080/10888438.2020.1850732
Kalashnikova, M., Goswami, U., and Burnham, D. (2018). Mothers speak differently to infants at-risk for dyslexia. Dev. Sci. 21:e12487. doi: 10.1111/desc.12487
Kalashnikova, M., Goswami, U., and Burnham, D. (2019). Sensitivity to amplitude envelope rise time in infancy and vocabulary development at three years: A significant relationship. Dev. Sci. 22:e12836. doi: 10.1111/desc.12836
Kertész, C., and Honbolyg,ó, F. (2023). First school year tapping predicts children's third-grade literacy skills. Sci. Rep. 13:2298. doi: 10.1038/s41598-023-29367-5
Kuppen, S., Huss, M., Fosker, T., Fegan, N., and Goswami, U. (2011). Basic auditory processing skills and phonological awareness in low-IQ readers and typically developing controls. Sci. Stud. Read. 15, 211–243. doi: 10.1080/10888431003706291
Ladányi, E., Persici, V., Fiveash, A., Tillmann, B., and Gordon, R. L. (2020). Is atypical rhythm a risk factor for developmental speech and language disorders? WIREs Cogn. Sci. 11:e1528. doi: 10.1002/wcs.1528
Leong, V., and Goswami, U. (2015). Acoustic-emergent phonology in the amplitude envelope of child-directed speech. PLoS ONE 10:e0144411. doi: 10.1371/journal.pone.0144411
Lundetrae, K., and Thomson, J. M. (2018). Rhythm production at school entry as a predictor of poor reading and spelling at the end of first grade. Read. Writ. 31, 215–237. doi: 10.1007/s11145-017-9782-9
Mandke, K., Flanagan, S., Macfarlane, A., Feltham, G., Gabrielczyk, F. C., Wilson, A. M., et al. (2023). Neural responses to natural and enhanced speech edges in children with and without dyslexia. Front. Hum. Neurosci. 17:1200950. doi: 10.3389/fnhum.2023.1200950
Mandke, K., Flanagan, S., Macfarlane, A., Gabrielczyk, F. C., Wilson, A. M., Gross, J., et al. (2022). Neural sampling of the speech signal at different timescales by children with dyslexia. Neuroimage 253:119077. doi: 10.1016/j.neuroimage.2022.119077
McAuley, J. D., Jones, M. R., Holub, S., Johnston, H. M., and Miller, N. S. (2006). The time of our lives: Life span development of timing and event tracking. J. Exp. Psychol. 135, 348–367. doi: 10.1037/0096-3445.135.3.348
Moritz, C., Yampolsky, S., Papadelis, G., Thomson, J., and Wolf, M. (2013). Links between early rhythm skills, musical training, and phonological awareness. Read. Writ. 26, 739–69. doi: 10.1007/s11145-012-9389-0
Overy, K. (2000). Dyslexia, temporal processing and music: the potential of music as an early learning aid for dyslexic children. Psych. Mus. 28, 218–229. doi: 10.1177/0305735600282010
Overy, K. (2003). Dyslexia and music: from timing deficits to musical intervention. Ann. N. Y. Acad. Sci. 999, 497–505. doi: 10.1196/annals.1284.060
Overy, K., Nicolson, R. I., Fawcett, A. J., and Clarke, E. F. (2003). Dyslexia and music: measuring musical timing skills. Dyslexia 9, 18–36. doi: 10.1002/dys.233
Power, A. J., Colling, L. C., Mead, N., Barnes, L., and Goswami, U. (2016). Neural encoding of the speech envelope by children with developmental dyslexia. Brain Lang. 160, 1–10. doi: 10.1016/j.bandl.2016.06.006
Power, A. J., Mead, N., Barnes, L., and Goswami, U. (2013). Neural entrainment to rhythmic speech in children with developmental dyslexia. Front. Hum. Neurosci. 7:777. doi: 10.3389/fnhum.2013.00777
Preacher, K. J., and Leonardelli, G. J. (2001). Calculation for the Sobel test: An interactive calculation tool for mediation tests. Available online at: http://quantpsy.org (accessed October 9, 2024).
R Core Team (2018). R: A language and environment for statistical computing. Vienna, Austria: R Foundation for Statistical Computing. Available online at: https://www.R-project.org/ (accessed May 22, 2020).
Rios-Lopez, P., Molinaro, N., and Lallier, M. (2019). Tapping to a beat in synchrony predicts brain print sensitivity in pre-readers. Brain Lang. 199:104693. doi: 10.1016/j.bandl.2019.104693
Rocha Attaheri, A., Ní Choisdealbha, A. S, Brusini, P. M, Mead, N., et al. (2024). Precursor to infant sensorimotor synchronization to speech and non-speech rhythms: A longitudinal study. Dev. Sci. 27:e13483. doi: 10.1111/desc.13483
Shannon, R. V., Zeng, F. G., Kamath, V., Wygonski, J., and Ekelid, M. (1995). Speech recognition with primarily temporal cues. Science 270, 303–304. doi: 10.1126/science.270.5234.303
Sousa, J., Martins, M., Torres, N., Castro, S. L., and Silva, S. (2022). Rhythm but not melody processing helps reading via phonological awareness and phonological memory. Sci. Rep. 12:13224. doi: 10.1038/s41598-022-15596-7
Thomson, J. M., and Goswami, U. (2008). Rhythmic processing in children with developmental dyslexia: auditory and motor rhythms link to reading and spelling. J. Phys.- Paris 102, 120–129. doi: 10.1016/j.jphysparis.2008.03.007
Tierney, A., and Kraus, N. (2014). Auditory-motor entrainment and phonological skills: precise auditory timing hypothesis (PATH). Front. Hum. Neurosci. 8:949. doi: 10.3389/fnhum.2014.00949
Torgesen, J. K., Wagner, R. K., and Rashotte, C. A. (1999). Test of Word Reading Efficiency (TOWRE). Pro-Ed.
Waber, D. P., Weiler, M. D., Bellinger, D. C., Marcus, D. J., Forbes, P. W., Wypij, D., et al. (2000). Diminished motor timing control in children referred for diagnosis of learning problems. Dev. Neuropsych. 17, 181–197. doi: 10.1207/S15326942DN1702_03
Wagner, R. K., and Torgesen, J. K. (1987). The nature of phonological processing and its causal role in the acquisition of reading skills. Psychol. Bull. 101, 192–212. doi: 10.1037/0033-2909.101.2.192
Wechsler, D. (2016). Wechsler Intelligence Scale for Children, 5th Edn. London, UK: Pearson Assessment. doi: 10.1037/t79544-000
Wolff, P. H. (2002). Timing precision and rhythm in developmental dyslexia. Read. Writ. 15, 179–206. doi: 10.1023/A:1013880723925
Wolff, P. H., Michel, G. F., Ovrut, M., and Drake, C. (1990). Rate and timing precision of motor coordination in developmental dyslexia. Dev. Psychol. 26, 349–359. doi: 10.1037/0012-1649.26.3.349
Keywords: rhythm, phonology, literacy, developmental dyslexia, children
Citation: Flanagan S, Wilson AM, Gabrielczyk FC, MacFarlane A, Feltham G, Mandke K and Goswami U (2025) A longitudinal study of tapping to the beat by school-aged children with and without dyslexia: assessments of the mediating role of phonology. Front. Dev. Psychol. 3:1528427. doi: 10.3389/fdpys.2025.1528427
Received: 14 November 2024; Accepted: 19 February 2025;
Published: 19 March 2025.
Edited by:
Rachel L. Severson, University of Montana, United StatesReviewed by:
Chiara Cantiani, Eugenio Medea (IRCCS), ItalyAnnalisa Valle, Catholic University of the Sacred Heart, Italy
Copyright © 2025 Flanagan, Wilson, Gabrielczyk, MacFarlane, Feltham, Mandke and Goswami. This is an open-access article distributed under the terms of the Creative Commons Attribution License (CC BY). The use, distribution or reproduction in other forums is permitted, provided the original author(s) and the copyright owner(s) are credited and that the original publication in this journal is cited, in accordance with accepted academic practice. No use, distribution or reproduction is permitted which does not comply with these terms.
*Correspondence: Sheila Flanagan, c2FmMzFAY2FtLmFjLnVr