 Phasuwut Chunnapiya
 Porawat Visutsak
94% of researchers rate our articles as excellent or good
Learn more about the work of our research integrity team to safeguard the quality of each article we publish.
Find out more
ORIGINAL RESEARCH article
Front. Comput. Sci., 12 March 2025
Sec. Computer Vision
Volume 7 - 2025 | https://doi.org/10.3389/fcomp.2025.1505446
This research addresses the challenge of automating electric vehicle (EV) charging in Thailand, where five distinct EV charging plug types are prevalent. We propose a deep learning approach using YOLO (You Only Look Once) to accurately identify these plug types, enabling robots to perform charging tasks efficiently. The study evaluates four YOLO versions (V5s, V6s, V7, and V8s) to determine the optimal model for this application. Our results demonstrate that YOLO V8s achieves the highest accuracy with a Mean Average Precision (mAP) of 0.95, while YOLO V7 exhibits superior performance in certain real-world scenarios. This research contributes to the development of automated EV charging systems by providing a robust and accurate model for detecting all five types of EV charging plugs used in Thailand. The model’s ability to accurately detect and classify EV charging plugs paves the way for the design of automated charging robots, addressing a key challenge in EV charging infrastructure and promoting the wider adoption of electric vehicles.
The increasing adoption of electric vehicles (EVs) in Thailand necessitates the development of efficient automatic charging systems. However, the diversity of EV charging plugs used in the country (AC Type 1, AC Type 2, DC CCS Type 2, DC CCS Type 1, and CHAdeMO) poses a challenge for automatic charging robots to accurately identify and connect to the correct plug. Supplementary Figures S1, S2 show the locations of electric vehicle charging plugs, the types of electric vehicle charging plugs around the world, and the types of electric vehicle charging plugs in Thailand, respectively.
This research aims to develop a reliable and efficient model for identifying these five types of EV charging plugs using the YOLO (You Only Look Once) object detection algorithm, a deep learning approach that provides high accuracy and real-time performance.
The performance of four different YOLO versions (YOLO V5s, YOLO V6s, YOLO V7, and YOLO V8s) will be compared to determine the most suitable version for this specific task. The selection of these YOLO versions is based on their recent advancements in object detection accuracy and efficiency, with each version offering potential benefits for real-time applications like EV charging.
The primary contribution of this research is to provide an in-depth analysis of the performance of these YOLO versions in the context of EV charging plug detection, considering factors such as accuracy, speed, and robustness. The findings of this study will be valuable for the development of automated charging robots, addressing a key challenge in EV charging infrastructure and promoting the wider adoption of electric vehicles.
Additionally, this research will address the lack of comprehensive studies on the application of YOLO algorithms for EV charging plug detection in Thailand. The results of this study will contribute to the advancement of automatic EV charging systems in the country, paving the way for more efficient and convenient EV charging solutions.
YOLO is a one-stage object detection algorithm developed by Joseph Redmon and his team. It is a onstage detector capable of detecting multiple objects simultaneously. YOLO utilizes a single neural network to process input images and produce bounding box outputs. Each bounding box includes a confidence score for each class, allowing for rapid object detection. However, this speed comes at the expense of lower accuracy compared to two-stage object detection approaches (Chalitapanukul and Wongseri, 2022; Li et al., 2016; Li F. F. et al., 2023).
In January 2024, YOLO will be divided into 8 versions, including YOLO, YOLO V2, YOLO V3, YOLO V4, YOLO V5, YOLO V6, YOLO V7, and YOLO V8. Each version has been upgraded and features different architectures (Aggarwal et al., 2023).
This research focuses on comparing the performance of YOLO V5s, YOLO V6s, YOLO V7, and YOLO V8s for the specific task of identifying electric vehicle charging plugs in Thailand. These versions represent a significant advancement in the YOLO architecture, offering improved speed and accuracy compared to earlier iterations.
YOLO V5s, an open-source project from 2020, uses CSPDarknet53 as its backbone, combining CBS, C3, and SPPF modules for efficient feature extraction. Its neck employs FPN and PAN structures for enhanced feature fusion across different scales. The head, similar to YOLO V4 and V3, generates three feature maps for multi-scale prediction, and utilizes CIOU Loss and NMS for bounding box regression and object detection (Arifando et al., 2023; Olorunshola et al., 2023).
YOLO V6, introduced in 2022, emphasizes efficiency for industrial use. It utilizes EfficientRep as its backbone, incorporating RepBlock, RepConvBlock, and CPSStackRep Block for varying model sizes. The neck utilizes Rep-PAN, an improved version of PAN, and replaces CSPBlock with either RepBlock or CSPStackRep Block depending on model size. The head remains similar to YOLO V5, focusing on regression and classification tasks. Overall, YOLO V6 architecture balances speed and accuracy, with multiple versions catering to different performance needs (Hussain, 2023; Terven and Cordova-Esparza, 2023).
YOLO V7, introduced in 2022, improves real-time object detection accuracy without increasing costs. Its backbone features an Efficient Layer Aggregation Network (ELAN) and Maximum Pooling Convolution (MPConv) module, enhancing feature extraction and generalization capabilities. The neck utilizes RepConv for improved feature map diversity across scales. The head, similar to YOLO V5, focuses on regression and classification tasks. Overall, YOLO V7 architecture offers enhanced accuracy and efficiency for object detection (Hussain, 2023; Olorunshola et al., 2023; Sun et al., 2023; Terven and Cordova-Esparza, 2023).
YOLO V8, released in 2023, resembles YOLO V5 architecturally but with key enhancements. The backbone replaces CSPLayer with the C2f module, boosting detection accuracy by integrating high-level and contextual features. While the neck is similar to YOLO V5, it incorporates unspecified modifications. The head also sees adjustments, though details remain unmentioned. Notably, YOLO V8 shifts from anchor based to anchor-free detection and reduces convolutional layer kernel size, potentially improving efficiency and performance (Hussain, 2023; Li S. et al., 2023; Terven and Cordova-Esparza, 2023).
To further explore the methodology of YOLO algorithms, it’s essential to explore into their underlying mathematical modeling aspects. While many research papers primarily focus on the application of YOLO for a specific task, they do not explicitly detail these mathematical foundations. However, we can discuss some key concepts crucial for understanding how YOLO works.
Firstly, YOLO algorithms predict bounding boxes around objects, a process known as bounding box regression. This involves utilizing Intersection over Union (IoU), a metric that measures the overlap between the predicted and ground bounding boxes. IoU is calculated as the ratio of the intersection area to the union area of the two boxes (Everingham et al., 2010).
Where: IoU = a metric used to evaluate the accuracy of an object detector. Bp = the predicted bounding box of an object. This is the box that your model predicts as the location of the object in an image. Bgt = the ground truth bounding box. This is the actual, manually annotated box that shows the true location of the object.
Additionally, loss functions play a vital role in measuring the difference between the predicted and actual bounding box parameters (x, y, width, height). Common loss functions include Mean Squared Error (MSE) (Felzenszwalb et al., 2010):
Where: N = The total number of bounding boxes being evaluated. xpi, ypi = The coordinates of the center point of the predicted bounding box for the ith object. xgti, ygti = The coordinates of the center point of the ground truth bounding box for the ith object. wpi, hpi = The width and height of the predicted bounding box for the ith object. wgti, hgti = The width and height of the ground truth bounding box for the ith object. ΣNi = 1 N = This means to sum the squared differences for each of the N bounding boxes.
And more specialized ones like CIoU (Complete IoU), which consider factors like distance, overlap, and aspect ratio.
Another critical aspect is Non-Maximum Suppression (NMS), a post-processing step used to eliminate redundant bounding boxes. NMS involves assigning confidence scores to each bounding box, representing the model’s certainty that it contains an object. The NMS algorithm then iteratively selects the box with the highest score and suppresses boxes with significant overlap (high IoU) with the selected box.
Furthermore, some YOLO versions employ Feature Pyramid Networks (FPN) to improve multi-scale object detection. FPN involves extracting feature maps at different scales using a convolutional neural network backbone. It then combines low-resolution, semantically strong features with high-resolution, semantically weak features to create a feature pyramid, enabling the network to detect objects of various sizes more effectively.
Earlier YOLO versions also utilized anchor boxes, which are predefined boxes of various aspect ratios used to aid object detection. During training, ground truth boxes are matched to the most similar anchor boxes based on IoU. The network then predicts offsets (Δx, Δy, Δw, Δh) to refine the position and size of the anchor boxes (Everingham et al., 2010):
Finally, Convolutional Neural Networks (CNNs) are the fundamental building blocks of YOLO. CNNs involve convolutional layers that apply filters to extract features from the input image, pooling layers that reduce the spatial dimensions of feature maps, and activation functions that introduce non-linearity to the network.
In addition to the mathematical concepts mentioned above, the convergence of the YOLO algorithm during training is typically assessed using a loss function. The loss function quantifies the difference between the predicted output and the ground truth labels. During training, the algorithm aims to minimize this loss function. Convergence is typically determined by monitoring the loss function over training epochs. When the loss function stabilizes and stops decreasing significantly, it indicates that the algorithm has converged. Specific criteria for convergence may vary depending on the dataset and training parameters.
Non-Maximum Suppression (NMS) is a critical postprocessing technique in object detection algorithms, including the YOLO models used in this research. Its importance lies in its ability to refine the initial output of the object detection model, ensuring that only the most accurate and relevant bounding boxes are retained for each detected object (Terven and Cordova-Esparza, 2023). Supplementary Figure S7 illustrates this process. In the context of identifying electric vehicle (EV) charging plugs, NMS plays a crucial role in several ways:
1. Eliminating Redundant Detections: Object detection models often generate multiple overlapping bounding boxes around the same EV charging plug. NMS helps filter out these redundant detections, leaving only one bounding box per plug. This is important for accurate identification and prevents the system from mistaking multiple detections of the same plug as separate plugs.
2. Improving Accuracy: NMS selects the bounding box with the highest confidence score among overlapping boxes. This ensures that the final detection is more accurate and reliable, as it represents the most confident prediction made by the model.
3. Reducing False Positives: By eliminating less confident and overlapping bounding boxes, NMS helps reduce the number of false positives, where the model incorrectly identifies objects that are not actually EV charging plugs.
4. Enhancing Efficiency: By reducing the number of bounding boxes that need to be processed further, NMS contributes to the overall efficiency of the EV charging plug identification system.
The Feature Pyramid Network (FPN) is a convolutional neural network architecture designed for object detection, particularly for tasks involving objects of various sizes within a single image. It addresses the challenge of scale invariance in object detection, where smaller objects often go undetected due to their limited spatial resolution in feature maps. Supplementary Figure S8 shows the architecture of FPN. The FPN architecture consists of a bottom-up pathway, a top-down pathway, and lateral connections. The bottom-up pathway extracts features from the input image at multiple scales using a convolutional neural network backbone such as ResNet or VGG. The top down pathway up samples the high-level semantic features from the backbone and combines them with the corresponding features from the bottom-up pathway through lateral connections. This process creates a feature pyramid with multiple levels of detail, where each level is suitable for detecting objects of a specific size range (Lin et al., 2017).
The FPN architecture offers several benefits for EV charger detection:
• Improved accuracy: FPN effectively addresses the scale invariance problem, leading to improved accuracy in detecting EV chargers of various sizes. This is crucial for real-world applications, where chargers can be of different sizes and located at varying distances from the camera.
• Reduced false positives: FPN helps to reduce false positives by focusing on the most relevant features for each object size. This is important for avoiding unnecessary charging attempts on objects that are not actually EV chargers.
• Faster inference: FPN can be implemented efficiently using techniques such as shared convolutional layers and feature fusion modules. This allows for faster inference times, which is essential for real-time applications like autonomous charging robots.
FPN can be further enhanced by incorporating a Path Aggregation Network (PAN). PAN adds an additional pathway to the FPN architecture that aggregates features from different levels of the pyramid. This helps to improve the overall feature representation and further enhance the accuracy of object detection.
The successful implementation of NMS is essential for achieving high accuracy in identifying different types of EV charging plugs in Thailand. By refining the output of the YOLO models, NMS ensures that the system can accurately and efficiently detect and classify EV charging plugs, facilitating the development of reliable automatic charging systems for electric vehicles. While FPN is a powerful and versatile architecture for object detection, particularly for tasks involving objects of various sizes. Its ability to address scale invariance and provide multi-level feature representations makes it well-suited for the task of detecting EV charging plugs in images. By incorporating FPN into their models, researchers can achieve high accuracy and efficiency in EV charger detection, paving the way for the development of reliable automatic charging systems for electric vehicles.
Generally, electric car charging is divided into two types: AC Charger (charging with alternating current) and DC Charger (charging with direct current).
The charging process involves receiving electricity as alternating current, which is then passed through an inverter to convert it into direct current. Once the direct current is available, it charges the battery. There is also a Battery Management System (BMS) that controls the charging process.
The AC Charger charges slowly, generally taking about 4 to 12 h to fully charge.
There are four types of AC Charger plugs: Type 1 (SAE J1772), Tesla (Tesla US Connector), Type 2 (IEC 62196-2), and GB/T AC (20,234 AC) (Finnerty, 2024).
Supplementary Figure S9 shows examples of electric car charging plugs, both the male and female ends, while Supplementary Figure S10 displays the charging power levels, standards, and configurations.
The charging process involves directly injecting direct current (DC) into the battery. There is a Battery Management System (BMS) that controls this charging process.
DC Chargers provide fast charging, typically taking about 10 to 15 min to fully charge. Since DC charging uses high power, it requires a three-phase power source with a high current rating. This type of charging is commonly used in public locations where quick charging is needed.
The plugs for DC Chargers include several types: Type 1 (CCS Combo 1), Type 2 (CCS Combo 2), GB/T DC (20,234 DC), CHAdeMO, and Tesla (Tesla US Connector).
Supplementary Figure S9 shows examples of electric car charging plugs (Sangruji, 2021), while Supplementary Figure S10 displays the charging power levels and standards.
From previous sections, we can see that there are a total of 8 types of electric car charging plugs worldwide. For AC charging, these are Type 1 (SAE J1772), Tesla (Tesla US Connector), Type 2 (IEC 62196-2), and GB/T AC (20,234 AC). For DC charging, the types include Type 1 (CCS Combo 1), Type 2 (CCS Combo 2), GB/T DC (20,234 DC), CHAdeMO, and Tesla (Tesla US Connector).
The Tesla plug can be used for both AC and DC charging. You can view images of the various electric car charging plugs worldwide in Supplementary Figure S9.
In Thailand, the Industrial Standards Institute (ISI) has established industrial product standards for electric car charging plugs, consisting of three parts: TIS 2749-1:2016, TIS 2749-2:2016, and TIS 2749-3:2016. The standards specify that the plug and socket for alternating current (AC) should be Type 2. For electric vehicles with different socket types, an adapter must be used to convert to Type 2.
For direct current (DC), the standard socket configuration for electric buses is Configuration FF Z (CCS Combo Type 2). However, there is currently no specific standard for the direct current socket type for personal electric vehicles.
The charging plug standard used in Thailand references the Government Gazette announcement from the Ministry of Industry, which sets the industrial product standard for vehicle plugs and sockets based on IEC 62196 and IEC 61851.
Before the announcement of TIS 2749-2:2016, there were already electric vehicles sold in Thailand that used different charging plugs. These included five types: CHAdeMO, AC Type 1, AC Type 2, DC CCS Type 1, and DC CCS Type 2. We will explain the origins of these electric vehicle charging plugs in the next section.
Selvarajan et al. (2024a,b) investigated the security challenges of consumer electronic products operating on advanced 6G networks. While 6G offers significant advantages in speed and responsiveness, ensuring secure data transmission remains a critical concern. To address this, the authors propose a collaborative framework that utilizes a novel AI model called Deep Adaptive Neuro Convoluted Chameleon Classifier (DANC3). This model effectively identifies and categorizes consumer data acquired from 6G networks, enabling the detection and mitigation of potential security threats. By employing advanced artificial intelligence algorithms and natural language processing, the proposed framework aims to optimize security and reduce data transmission vulnerabilities for all consumer electronic products in the 6G ecosystem. The ultimate goal is to achieve a data security level where vulnerabilities are minimized to less than 1%.
Khadidos et al. (2024) presents a novel resource allocation model for beyond 5G networks, enabling efficient data distribution across network nodes. The model allows for flexible resource management, including the addition and sharing of essential resources through parallel optimization. Evaluation using four case studies demonstrates the effectiveness of the model, with resource utilization for power and end-users remaining within defined limits (1.4 and 6%). Further testing with coefficient determination and blockage factors shows results falling within acceptable margins of error (31 and 87%, respectively).
Aircraft monitoring systems face challenges in accurately identifying objects due to extreme conditions and delays in data transmission across multiple sensor units. To overcome these obstacles, a novel methodology for generating digital replicas, or “digital twins,” of aircraft components is proposed. These digital twins utilize aero transfer functions and mapping functions to monitor various parameters associated with object identification within the data network, ultimately minimizing uncertainty. By incorporating analytical representations and deep learning methods, the system achieves enhanced accuracy, referred to as “zero point twin functionalities.” This integrated approach was evaluated in four different scenarios using an aero communication toolbox, which translates device configuration into simulation outputs. The results demonstrate that the proposed model significantly extends the maintenance period of aircraft components while simultaneously reducing data errors, leading to improved efficiency and reliability in aircraft monitoring systems (Selvarajan et al., 2024a,b).
We divided the data collection process into two main steps as follows: (1) Searching for types of EV chargers in Thailand. (2) Creating a dataset.
We have researched the information on electric cars sold in Thailand to find out the types of electric car chargers. We have separated the search into two types: (1) searching by brand and model, and (2) searching at charging stations.
We searched for the names and models of electric cars on websites such as the Department of Land Transport (MOT Data Catalog, Open Government Data of Thailand, n.d.), the Electric Vehicle Association of Thailand (Electric Vehicle Association of Thailand 2019.pdf, n.d.; Electric Vehicle Association of Thailand 2020.pdf, n.d.; Electric Vehicle Association of Thailand 2021.pdf, n.d.; Electric Vehicle Association of Thailand 2022-2023.pdf, n.d.), and domestic car review websites (Autolifethailand.Tv, n.d.a, n.d.b). The search resulted in five models: ‘CHAdeMO’, ‘AC Type 1’, ‘AC Type 2’, ‘DC CCS Type 2’, and ‘DC CCS Type 1’.
We searched for information about electric vehicle charging stations from websites such as the Energy Policy and Planning Office (EPPO) (EV chargers’ station in Thailand, n.d.) to find a list of electric cars charging service providers in Thailand. After receiving the list, we downloaded the applications of these service providers to continue looking for the types of electric car chargers available. The search resulted in five models: ‘CHAdeMO’, ‘AC Type 1’, ‘AC Type 2’, and ‘DC CCS Type 2’. As of May 22, 2023, there are 1,482 EV charging stations and 827 charging locations across Thailand, with 376 in the Bangkok metropolitan region. The top 5 providers are EA Anywhere (406), PTT OR (252), MEA (189), PEA Volta (184), and EGAT (11). Other notable providers include Evolt, On-ion, Haup, MEA, GWM, SHARGE, and Chosen. These stations are distributed across different regions in Thailand, with 827 in the Central region, 152 in the Eastern region, 89 in the Northeastern region, 106 in the Northern region, and 104 in the Southern region. The information is based on data from the Energy Policy and Planning Office (EPPO) of Thailand, which promotes the adoption of electric vehicles in the country. The office also provides information on charging station locations and types of charging. Supplementary Figure S11 shows an example of an application that provides electric vehicle charging services in Thailand.
In surveying the actual location and the actual work site, we surveyed two main types: (1) Survey of electric vehicle charging stations in Thailand. (2) Survey of electric cars sold in Thailand.
To search for electric vehicle charging stations, we conducted on-site visits and surveys at various locations such as shopping malls, conference centers, gas stations, companies, and hotels. We found that there are four main types of charging connectors: ‘CHAdeMO’, ‘AC type 1’, ‘AC type 2’, and ‘DC CCS type 2’. Figure 1 shows the electric vehicle charging stations we surveyed.
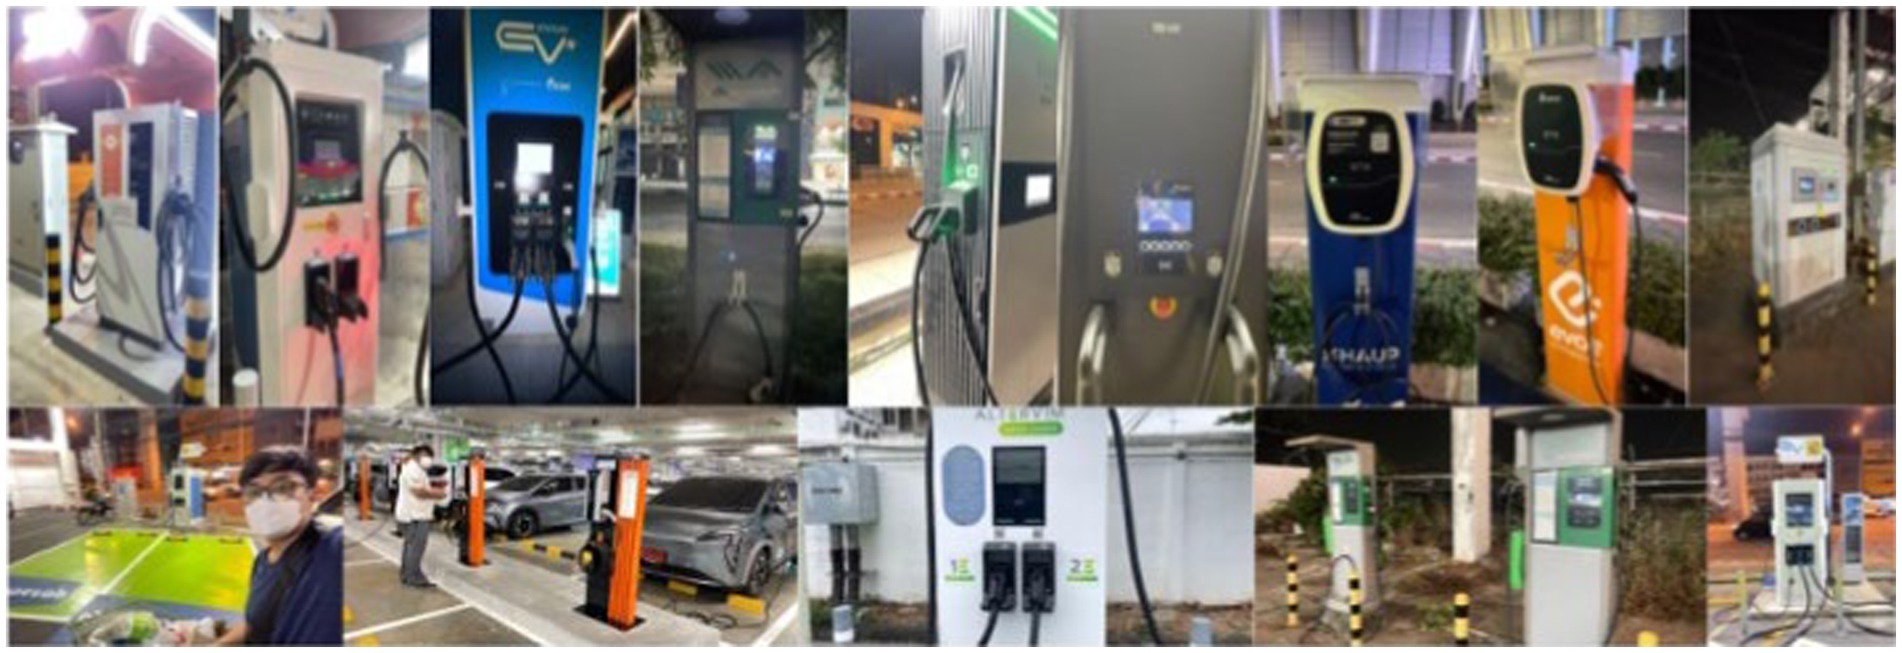
Figure 1. The electric vehicle charging stations which we surveyed.
To identify types of electric car charging plugs, we surveyed electric cars sold in Thailand at the Bangkok International Motor Show 2024 at Impact Muang Thong Thani on April 1, 2024, and the Bangkok EV Expo at Queen Sirikit National Convention Center on February 11, 2024. The survey revealed four types of electric car charging plugs: ‘AC type 1’, ‘AC type 2’, ‘DC CCS type 2’, and ‘DC CCS type 1’. Figure 2 shows images of electric car charger plugs sold in Thailand.
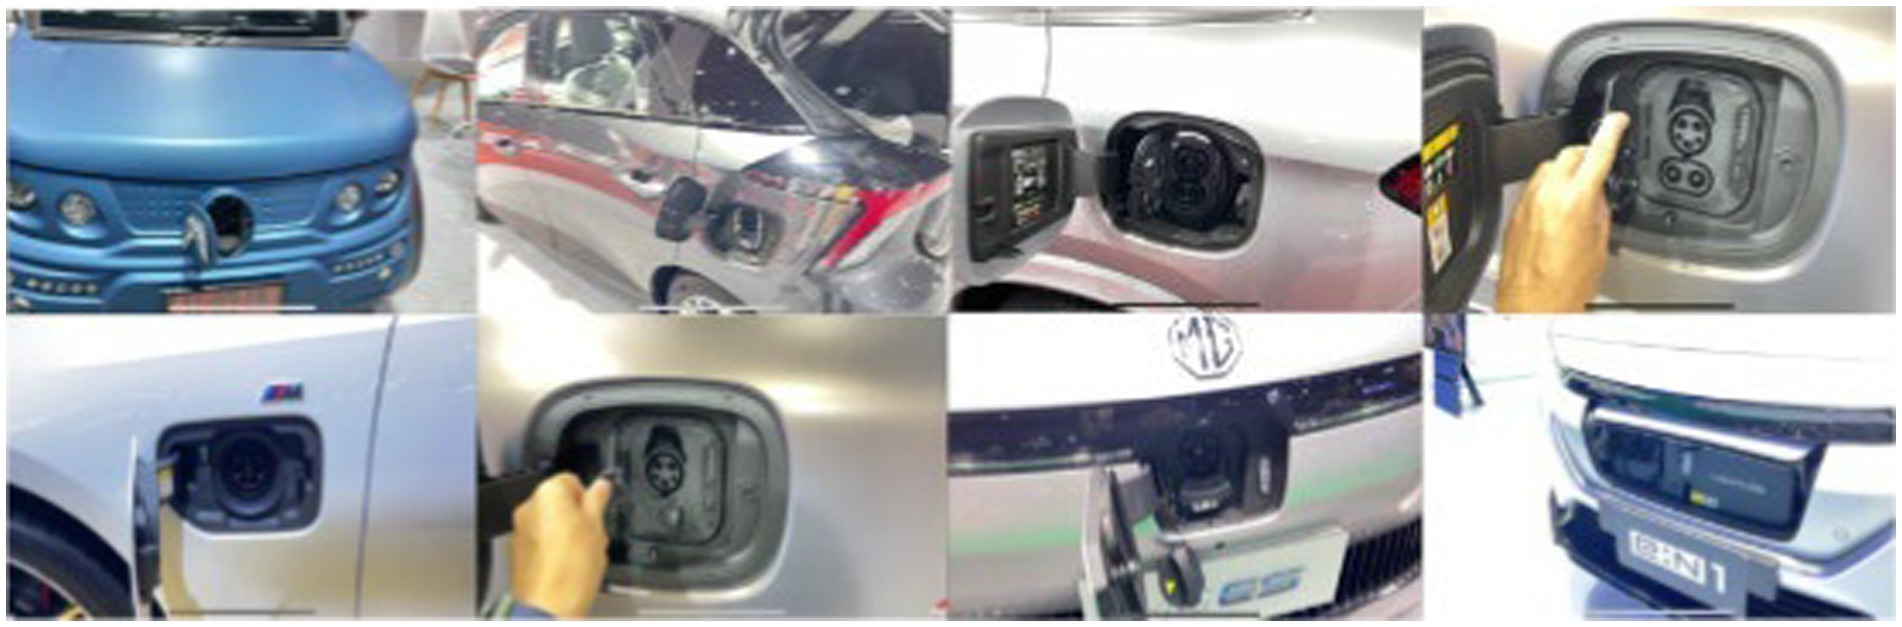
Figure 2. Images of electric car charger plugs sold in Thailand.
Creating a dataset is an important step in research. The process of preparing the dataset can be divided into 7 steps. The steps for preparing the data set include:
1. Finding image data and recording images of electric vehicle chargers.
2. Double-checking images.
3. Labeling image.
4. Adjusting images to the same size.
5. Augmentation.
6. Train test validation division.
7. Importing data into Kaggle.
We searched for images of electric car chargers on the internet, using only publicly available images. The process can be divided into two types: (1) searching for image data and (2) searching for video data. After completing both searches, we obtained images of electric car chargers.
We searched for image data on the internet, specifically from publicly available sources. Our search included websites such as Roboflow (n.d.), Google, various online marketplaces, and others. For details on the search process, please refer to this file (List Source.xlsx, n.d.)
We searched for video data from YouTube. The process involved three steps: (1) searching for electric car models, (2) watching the clips, and (3) capturing images.
Checking for duplicate images is a crucial step to prevent dataset redundancy. We utilized two tools for this task: (1) Duplicate Photos Fixer and (2) Duplicate Photo Cleaner.
Labeling images involves creating rectangular boxes that enclose objects of interest in the image. The program used for labeling is CVAT (Computer Vision Annotation Tool) (CVAT, n.d.). CVAT helps define the position of objects in the image along the X and Y axes by drawing bounding boxes on the image.
This step adjusts all images to the same size. After resizing the image, the label must remain in the original position of the object. We used a Python library named Albumentations.
Augmentation is a process that increases the size of a dataset by generating new, previously unseen data. This augmented dataset enhances the diversity of the original dataset, leading to improved model performance and robustness. Augmentation techniques encompass various methods for modifying and creating examples from the original dataset, such as rotating images, flipping images, changing colors, adjusting pixel values, introducing noise to images, and more (A’la et al., 2023; Badeka et al., 2020; Padigela et al., 2023; Rahman and Das, 2022; Wang, 2022). To implement augmentation in this study, we utilized the Albumentations library. Before delving into the specific augmentation techniques used in this paper, let us first provide an overview of how the Albumentations library works. Then, we will explain the augmentation techniques applied to the dataset in this study in the next steps.
The Albumentations library is a library for image augmentation that can do many things, such as:
• It can support adding data with bounding boxes and is compatible with bounding box formats such as COCO, Pascal VOC, and YOLO (Buslaev et al., 2020).
• It can generate new images from existing ones by flipping, rotating, scaling, optical distortion, grid distortion, blur processing, noise processing, and more.
• After augmentation, the position of the label will remain in the original position of the object.
In this paper, we conducted a total of 25 augmentation. The augmentations used include flipping, rotating, scaling, cropping, ShiftScaleRotate, ElasticTransform, OpticalDistortion, GridDistortion, zooming, rotating, shearing, blur processing, noise processing, brightened augmentation, Gaussian blurred, motion blurred, and others. After augmentation, the dataset increased from 4,227 to 109,903 examples. An example after augmentation is shown in Figure 3. (A list of augmentations can be seen in List Augmentation.Txt, n.d..)
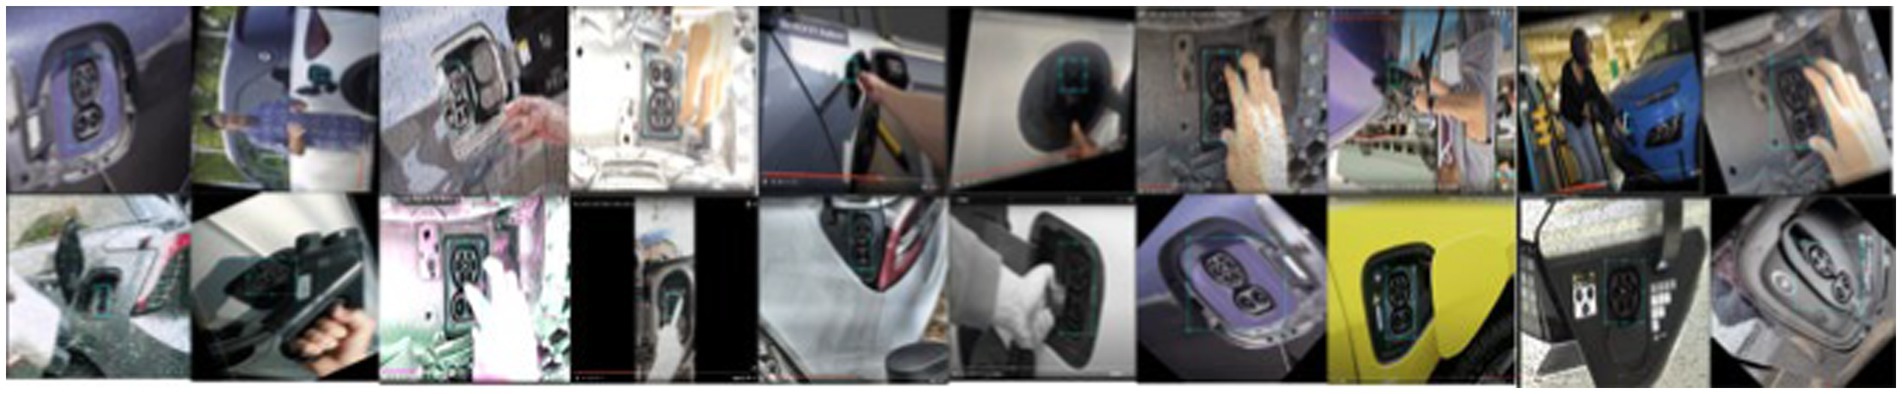
Figure 3. Precision and recall curve of four models.
The dataset will be split into three subsets: train (80%), test (10%), and validation (10%). We will utilize the Python library split-folders to accomplish this.
We zipped the dataset and uploaded it to the Kaggle Private Cloud to create a Private Dataset. Kaggle is a website that collects datasets and can collect large amounts of data and is convenient to continue using.
YOLO V5s, YOLO V6s, YOLO V7, and YOLO V8s in the experiments. We used the same parameters and environmental data in all experiments. We describe the environment in Section 3.2.1, the parameters used in Section 3.2.2, and the datasets used in Section 3.2.3.
In our experiment, we utilized two environments: Environment A and Environment B. Environment A was utilized for training, validation, and prediction purposes, while Environment B was used exclusively for prediction. Table 1 displays the details of Environment A and B.

Table 1. The environment for Environment A and B.
In the training and validation of the model, we used the same parameters for all four models (YOLO V5s, YOLO V6s, YOLO V7, and YOLO V8s) in the experiments. The parameters used can be seen in Table 2.
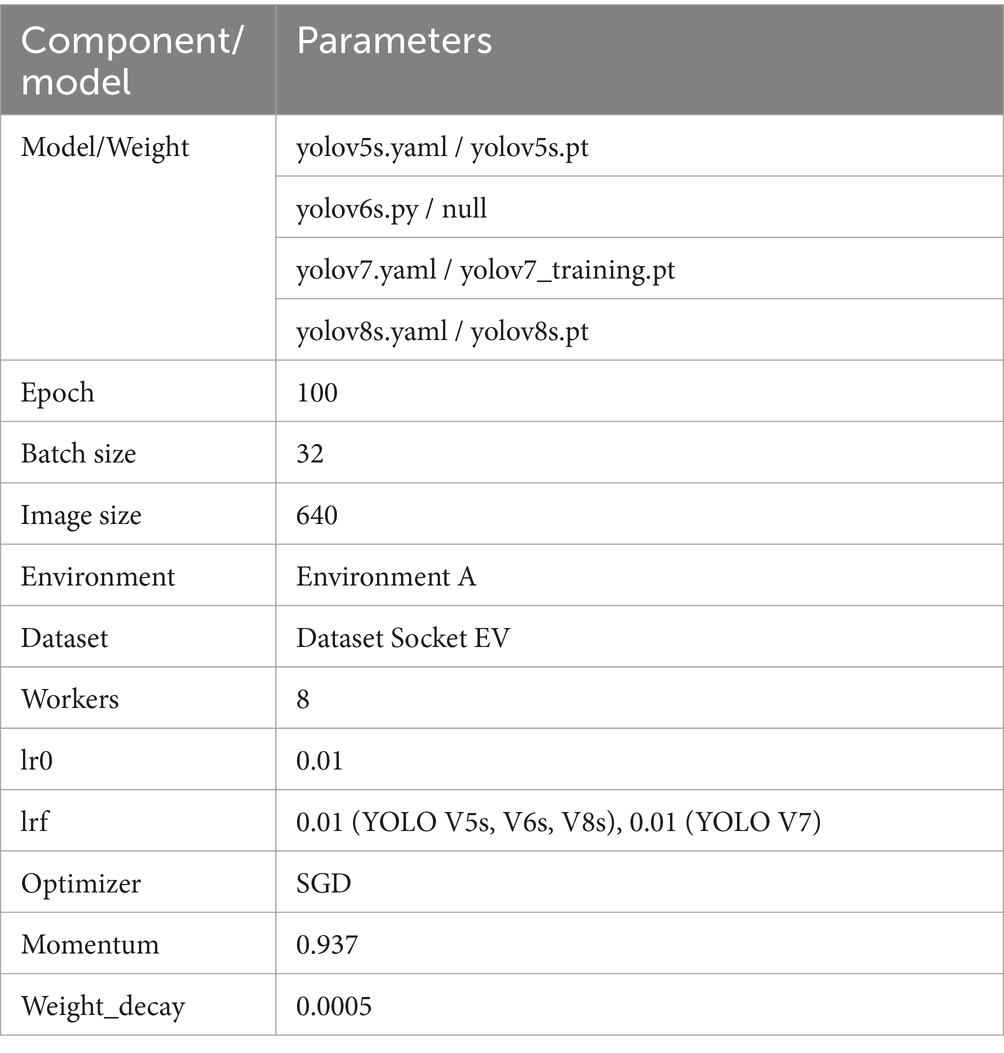
Table 2. The training and validation parameters.
To evaluate the performance and robustness of the YOLO V5-V8 algorithm in detecting EV charging sockets, we utilized a dataset of over 109,902 images obtained in Section 3.1 (details in Table 3). This dataset encompasses various types of EV charging sockets, manually categorized into five distinct classes: ‘CHAdeMO’, ‘AC type 1’, ‘AC type 2’, ‘DC CCS type 1’, and ‘DC CCS type 2’. Each image in the dataset has been manually labeled and classified into its corresponding socket type. The dataset is divided into training, validation, and testing sets in an 8:1:1 ratio, respectively.
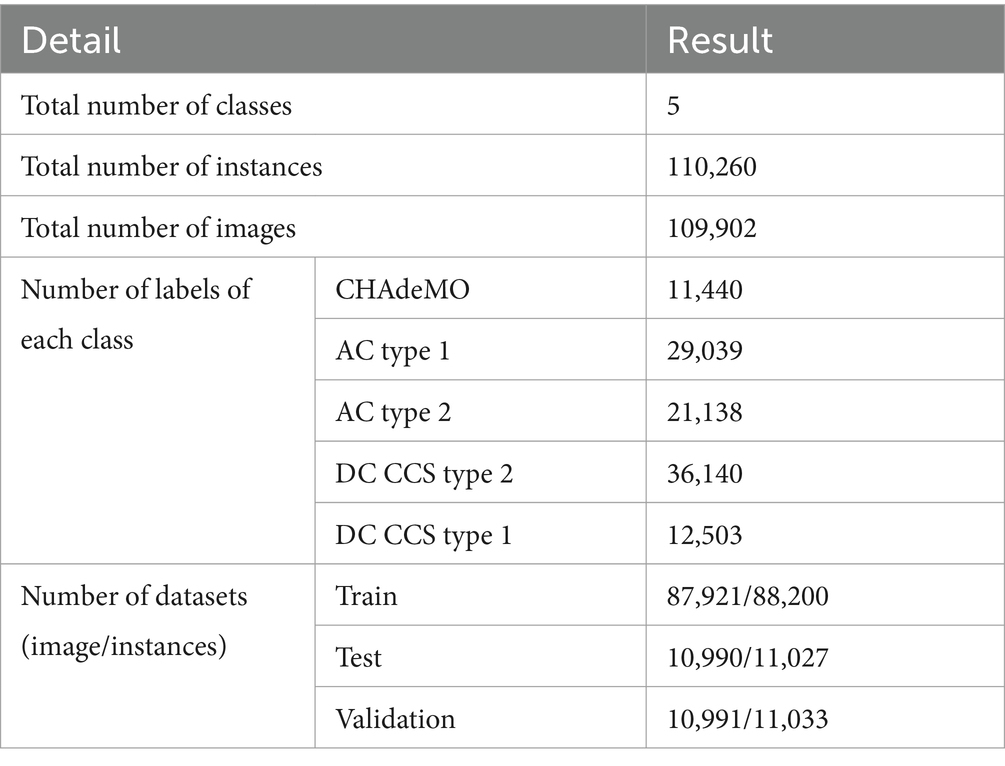
Table 3. Details of the dataset.
Figure 4 represents the instances of different types of classes in the dataset used for the analysis of YOLO V5- V8 model. An overview of the dataset showing different sockets namely ‘CHAdeMO’, ‘AC type 1’, ‘AC type 2’, ‘DC CCS type 1’ and ‘DC CCS type 2’ is illustrated in Figure 5.
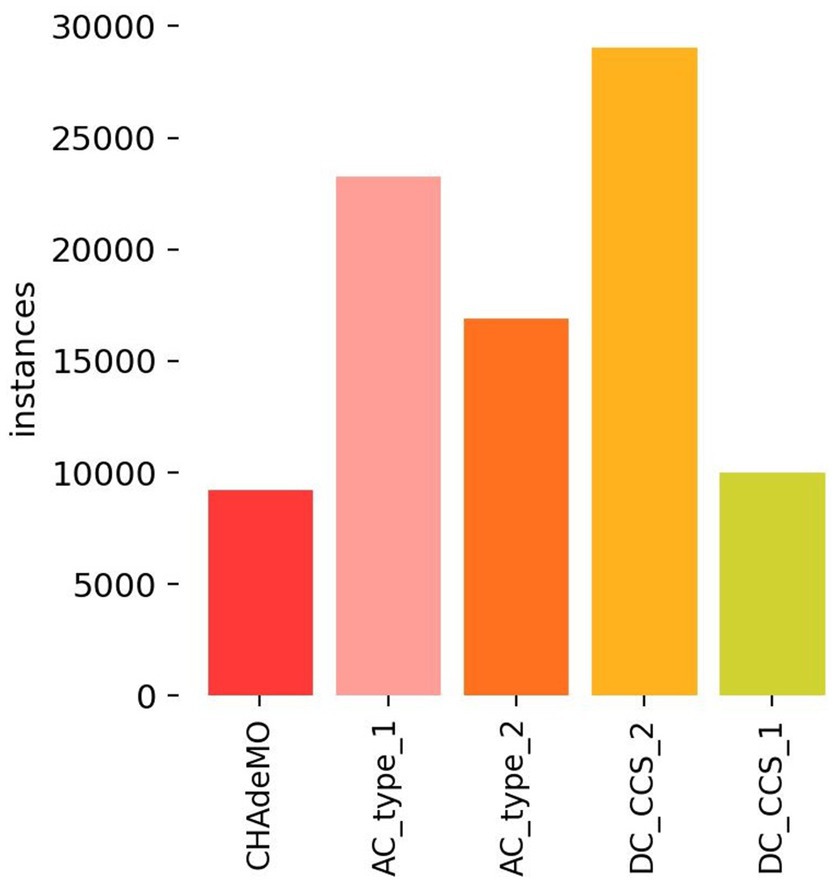
Figure 4. Instances of different types of classes in the dataset used for the analysis of YOLO V5-V8.
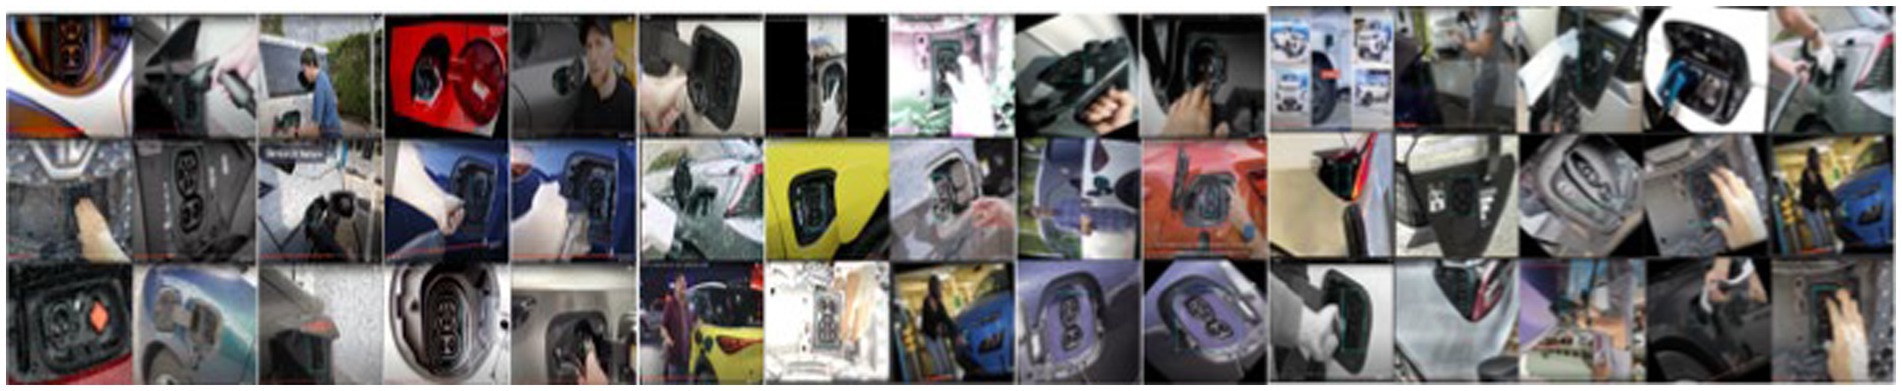
Figure 5. An example image of how to adjust the image to be the same size. An overview of the dataset showing different sockets.
This paper presents a comparative analysis of four object detection algorithms—YOLO V5s, YOLO V6s, YOLO V7, and YOLO V8s—with a focus on their performance in detecting EV charging sockets. The accuracy, recall, mAP50, and mAP50-95 values of the four models were obtained through rigorous training procedures, and the results are presented in Table 4.
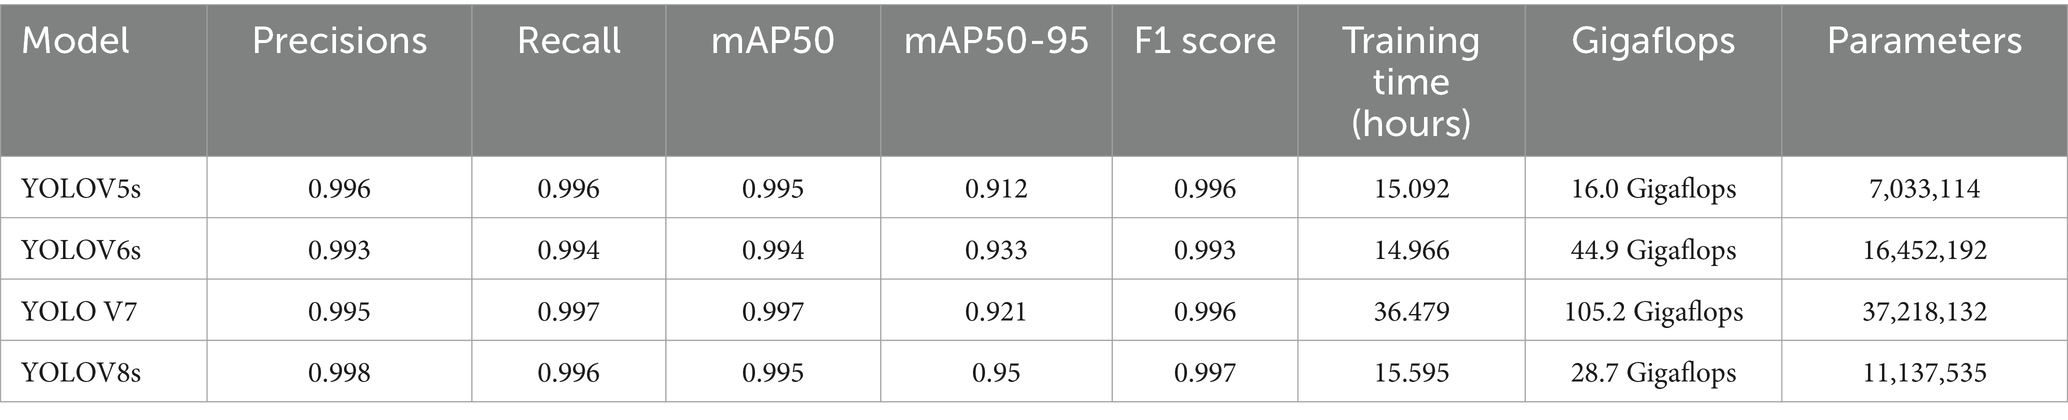
Table 4. Detection results.
The results presented in Table 3 demonstrate that YOLO V8s outperforms YOLOv5s, YOLO V6s, and YOLO V7 in terms of Precision, mAP50-95, and F1- score when evaluated on the same dataset. Additionally, YOLO V7 exhibits superior Recall compared to YOLOv5s, YOLO V6s, and YOLO V8s when evaluated on the same dataset. Furthermore, YOLO V6s demonstrates the fastest training time compared to YOLOv5s, YOLO V7, and YOLO V8s when evaluated on the same dataset.
In comparing the confusion matrices between the four algorithms, it can be observed that YOLO V5s, YOLO V6s, and YOLO V7 sometimes misclassify the background as ‘AC type 2’, while YOLO V8s occasionally misclassifies the background as ‘AC type 1’. As a result, YOLO V5s, YOLO V6s, and YOLO V7 perform less effectively than YOLO V8s in detecting ‘AC type 2’, and YOLO V8s performs less effectively than YOLO V5s, YOLO V6s, and YOLO V7 in detecting ‘AC type 1’ (see Figure 6).
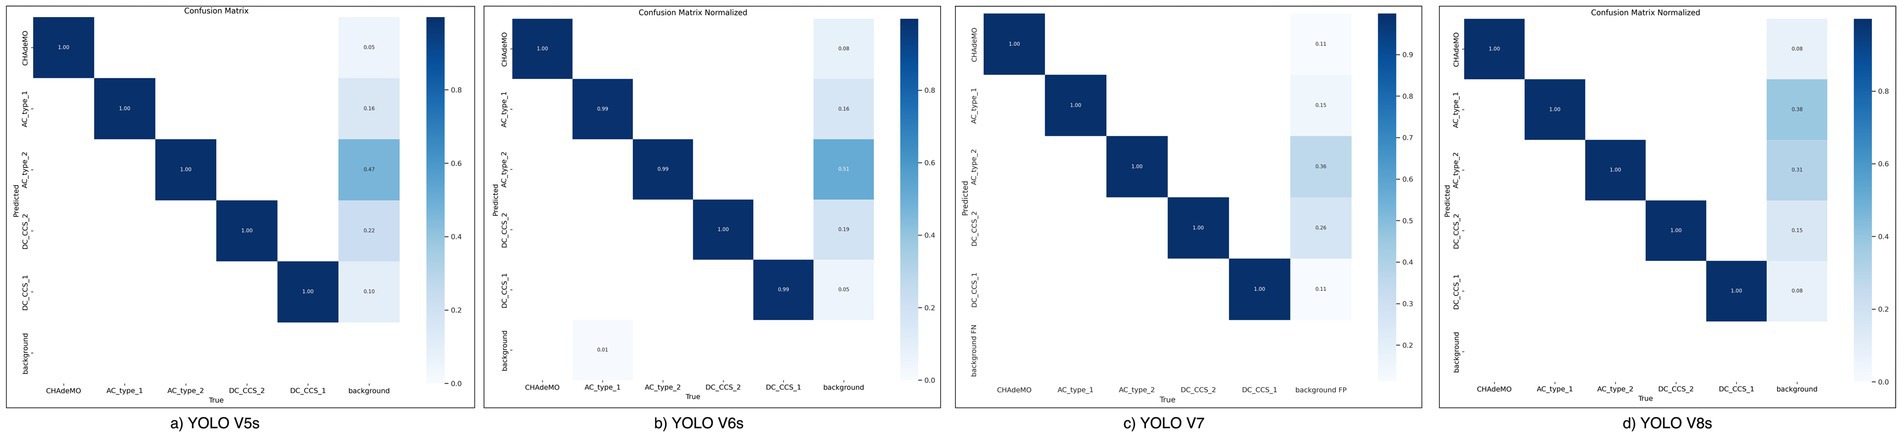
Figure 6. Confusion matrix of four models.
As shown in Figure 7, the localization loss, target loss, and classification loss vary across training sessions. Notably, the fluctuation of the loss curves decreases as the number of training iterations increases for all four models. This indicates that the network’s training process has converted to a stable state. Figures 8, 9 illustrate that increasing the number of training sessions leads to a continuous improvement in model accuracy, recall, and mAP0.5, with a gradual upward trend as the rounds increase. The performance trends observed for each image during experimental training validate the effectiveness of our training results.
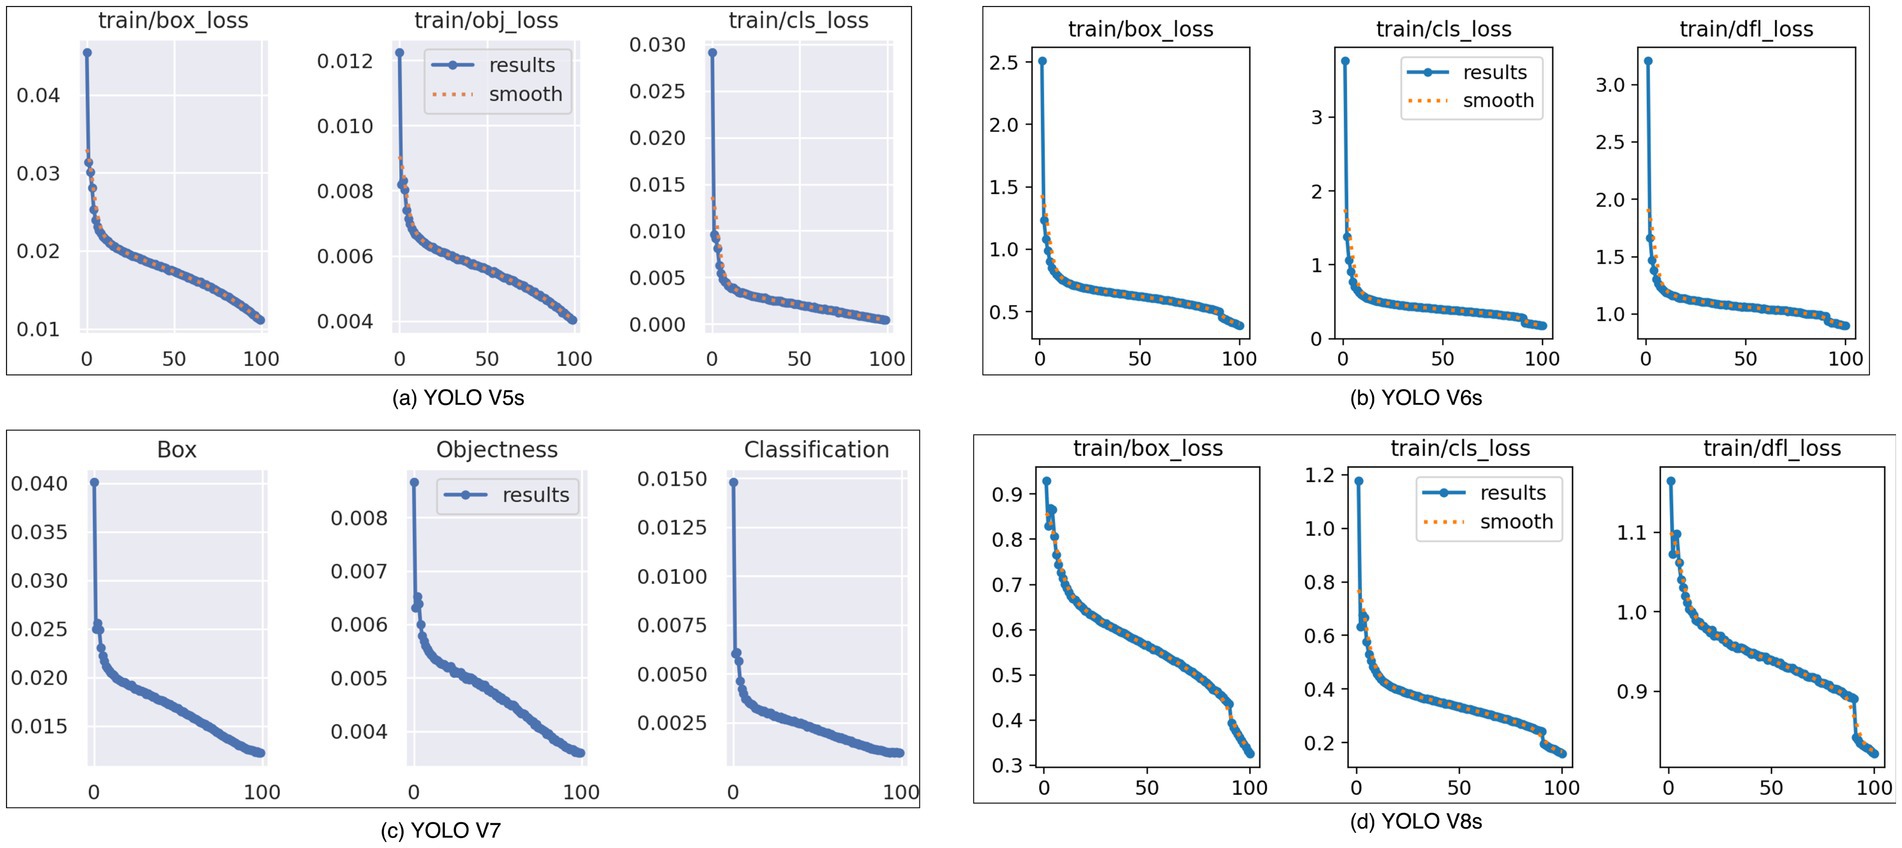
Figure 7. Loss curve of four models.
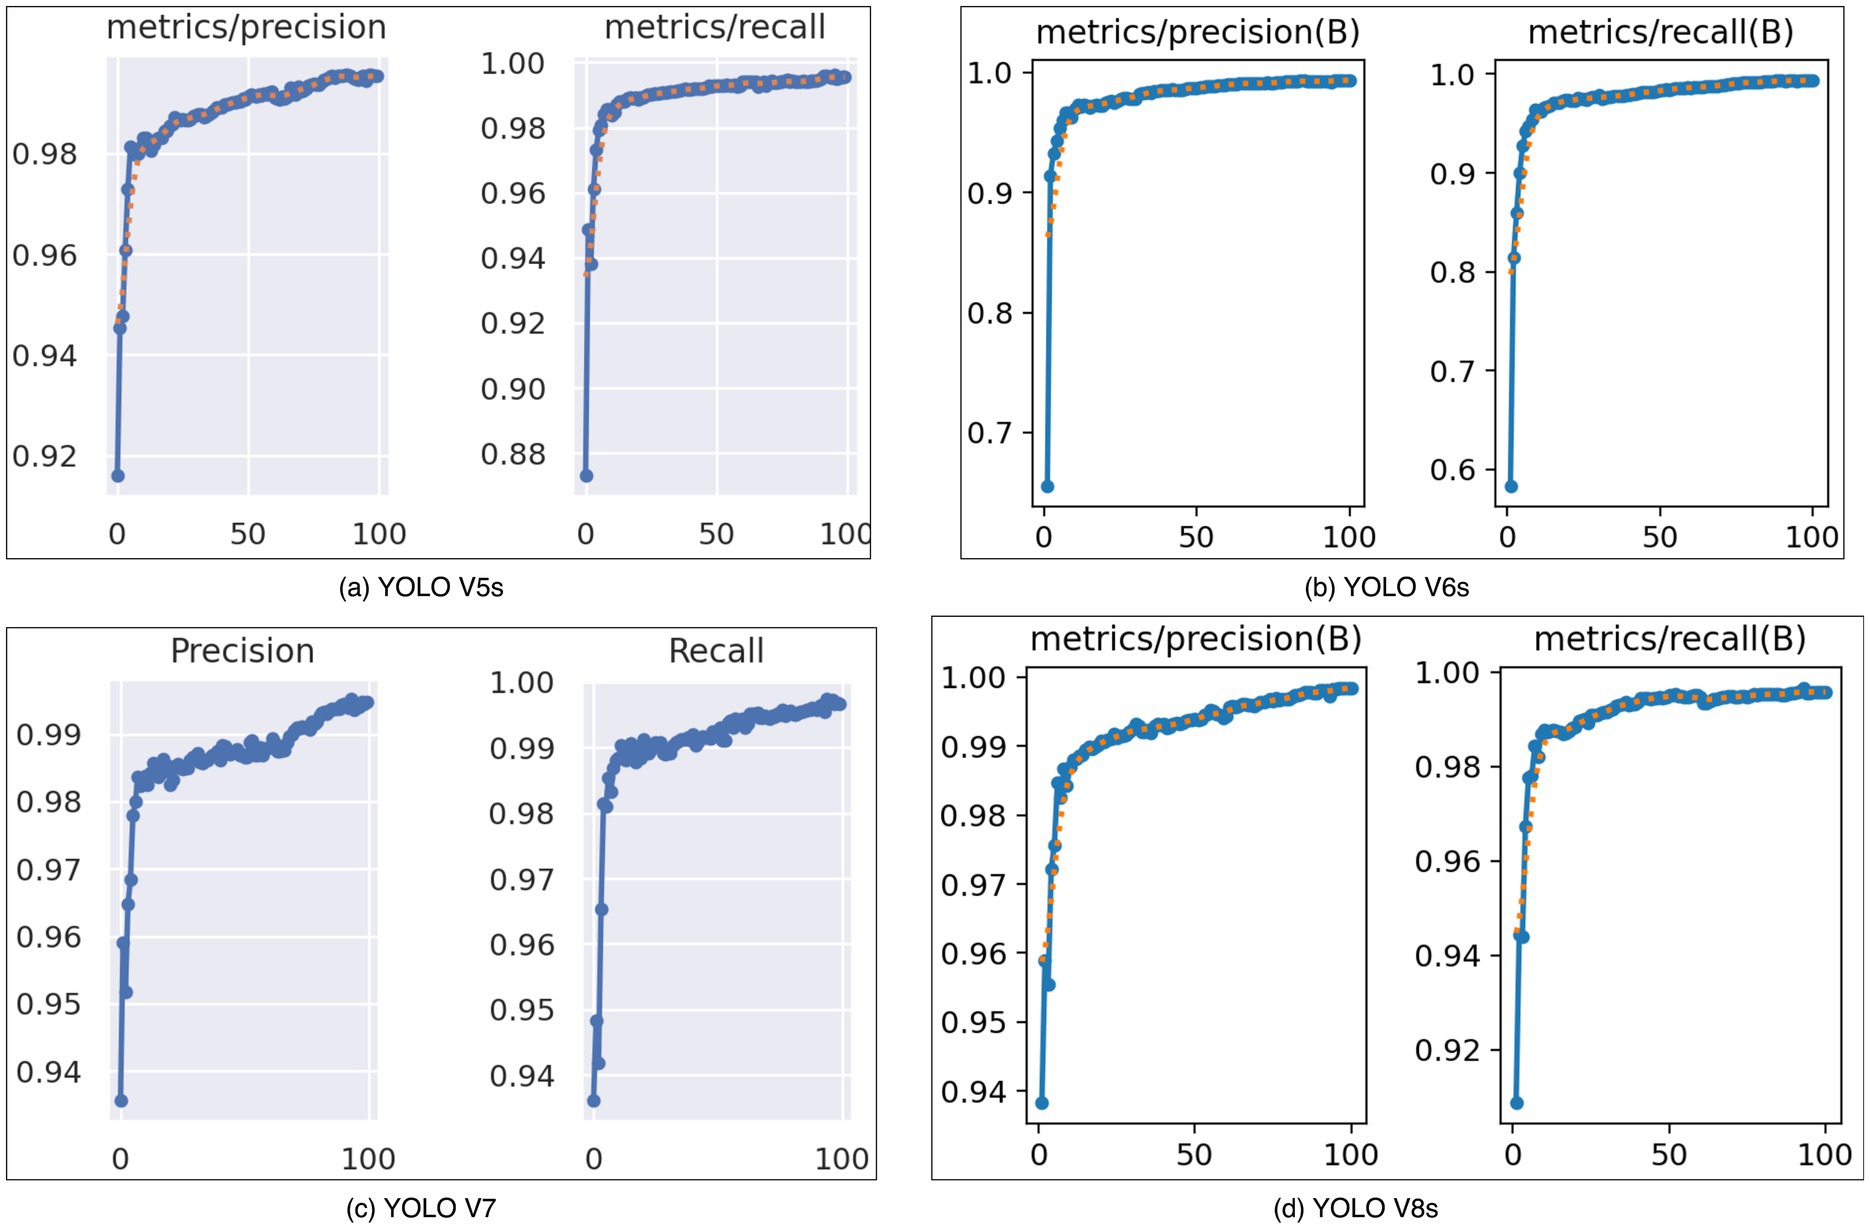
Figure 8. Accuracy and recall curve of four models.
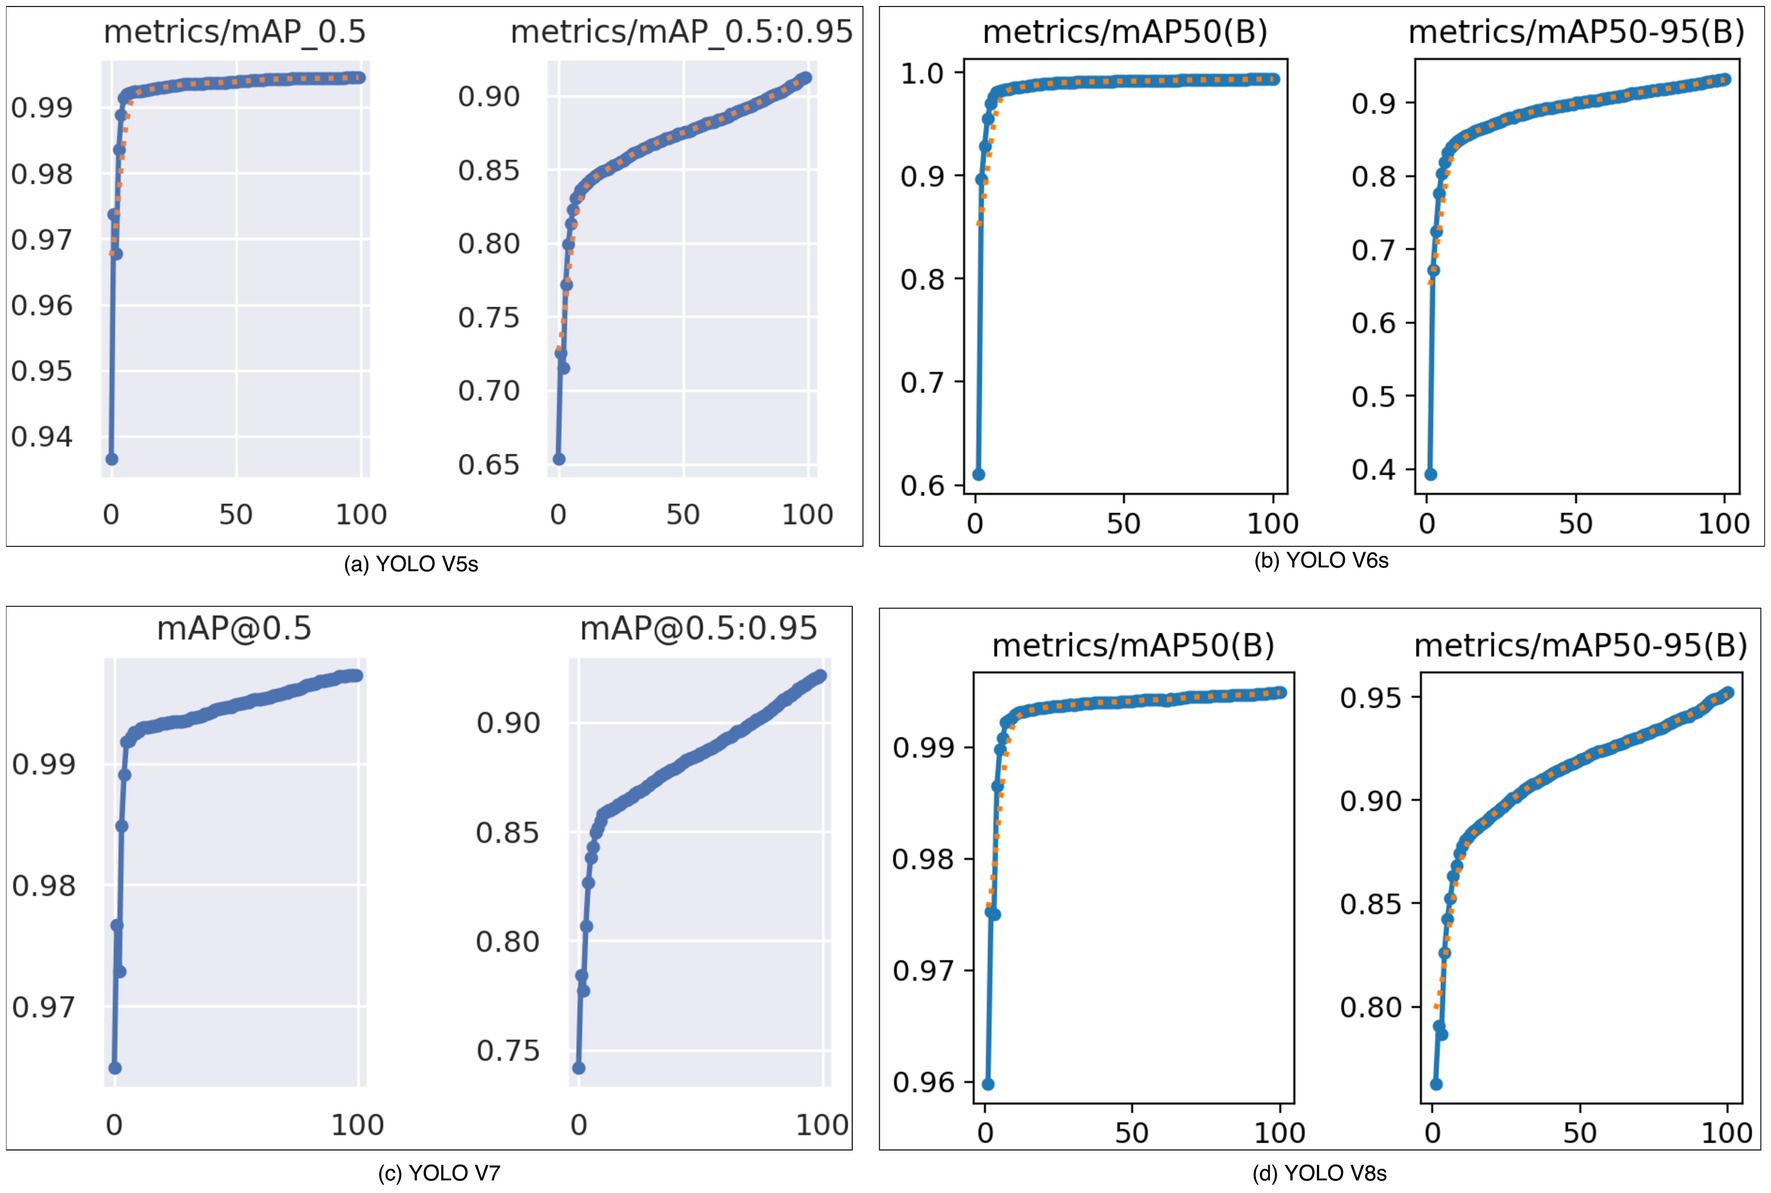
Figure 9. mAP0.5, mAP0.5-95 curve of four models.
To evaluate the real-world performance of the YOLO V5s, YOLO V6s, YOLO V7, and YOLO V8s models trained for EV socket detection, we captured videos containing EV sockets as detection targets. The goal was to assess the effectiveness of all four models and establish consistent confidence thresholds.
We conducted experiments using four video clips. Videos 1–3, captured at the Bangkok International Motor Show 2024 in Thailand, contained ‘AC type 1’, ‘AC type 2’, ‘DC CCS type 1’, and ‘DC CCS type 2’ EV sockets. Video 4, sourced from YouTube, featured ‘CHAdeMO’ EV sockets. The experiment is depicted in Figures 10–13. We captured screenshots every 5 s for videos 1–3 and every 0.25 s for Video 4. The experimental results for all four videos are presented in Table 5.
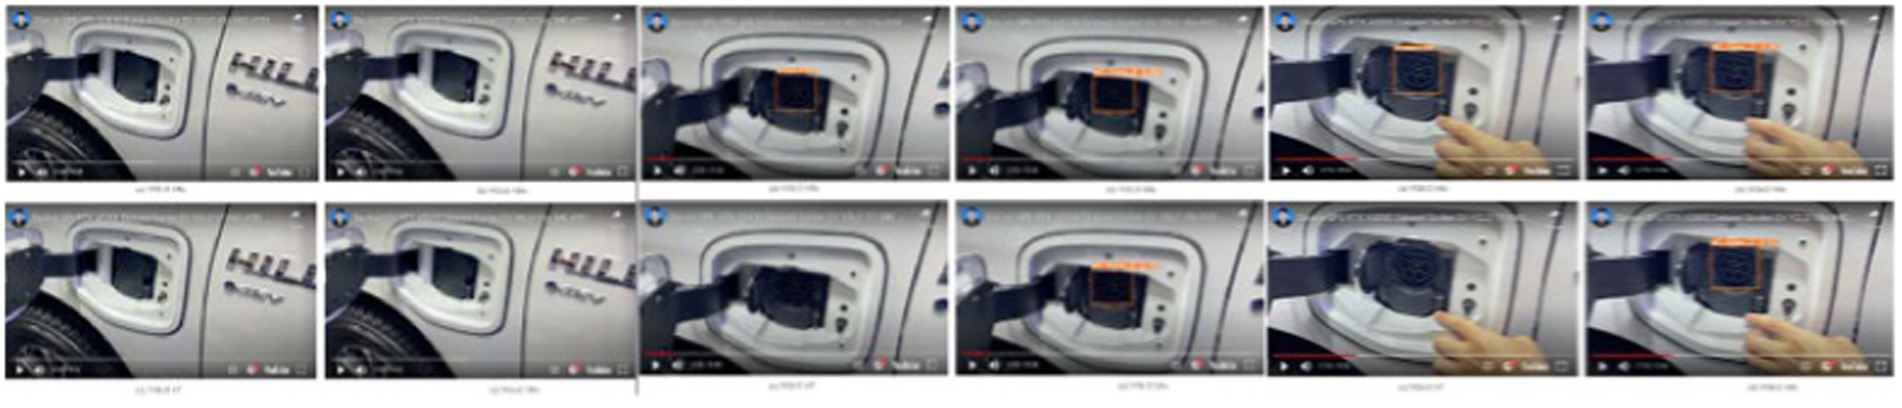
Figure 10. The results of detection EV socket of video 1.
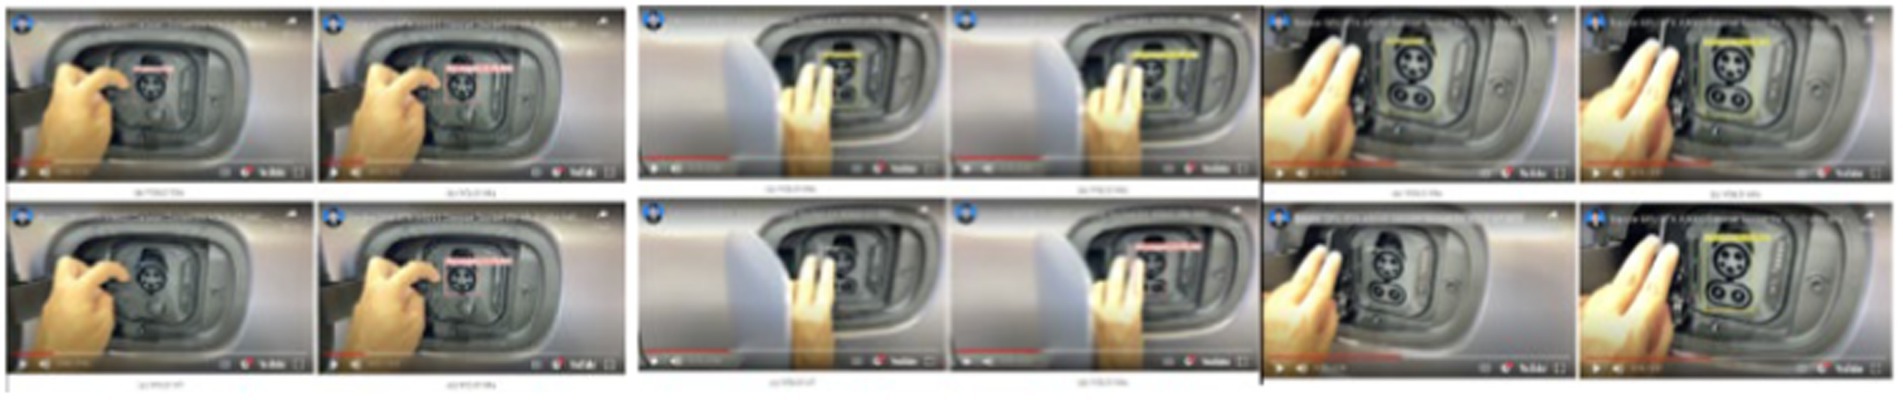
Figure 11. The results of detection EV socket of video 2.
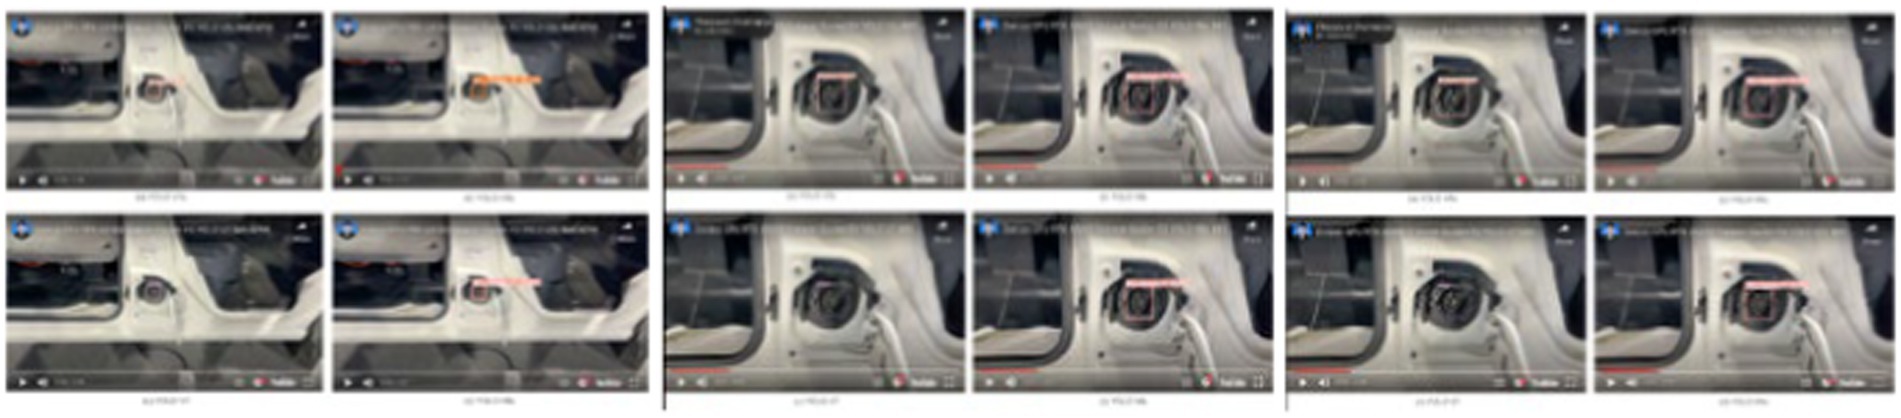
Figure 12. The results of detection EV socket of video 3.
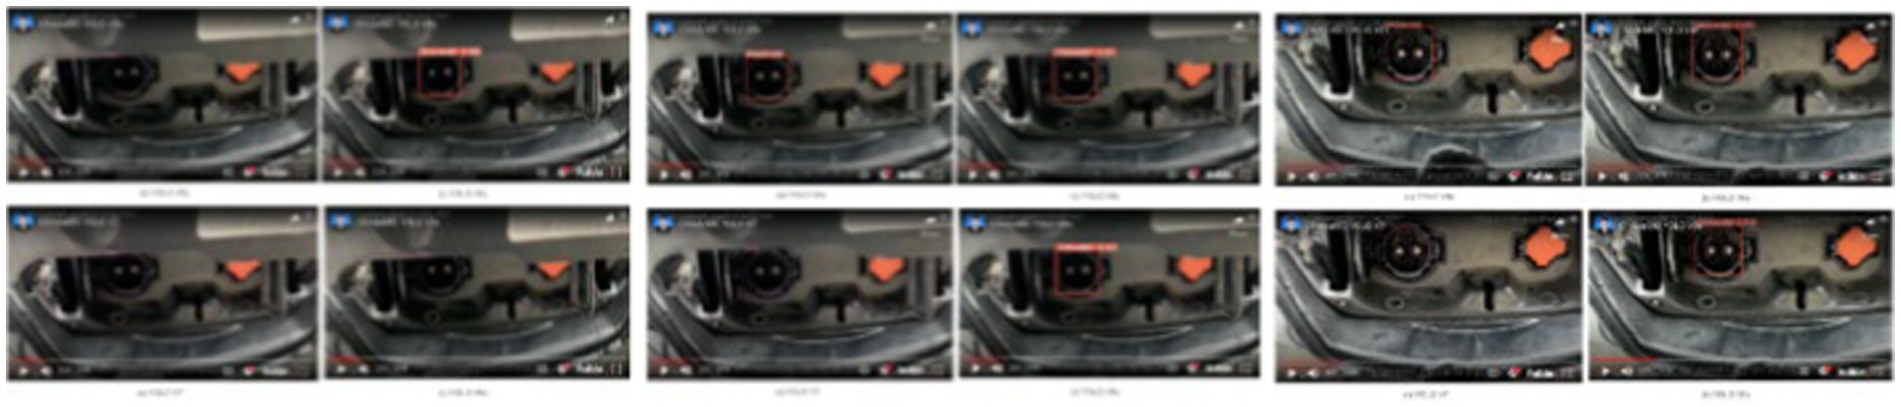
Figure 13. The results of detection EV socket of video 4.
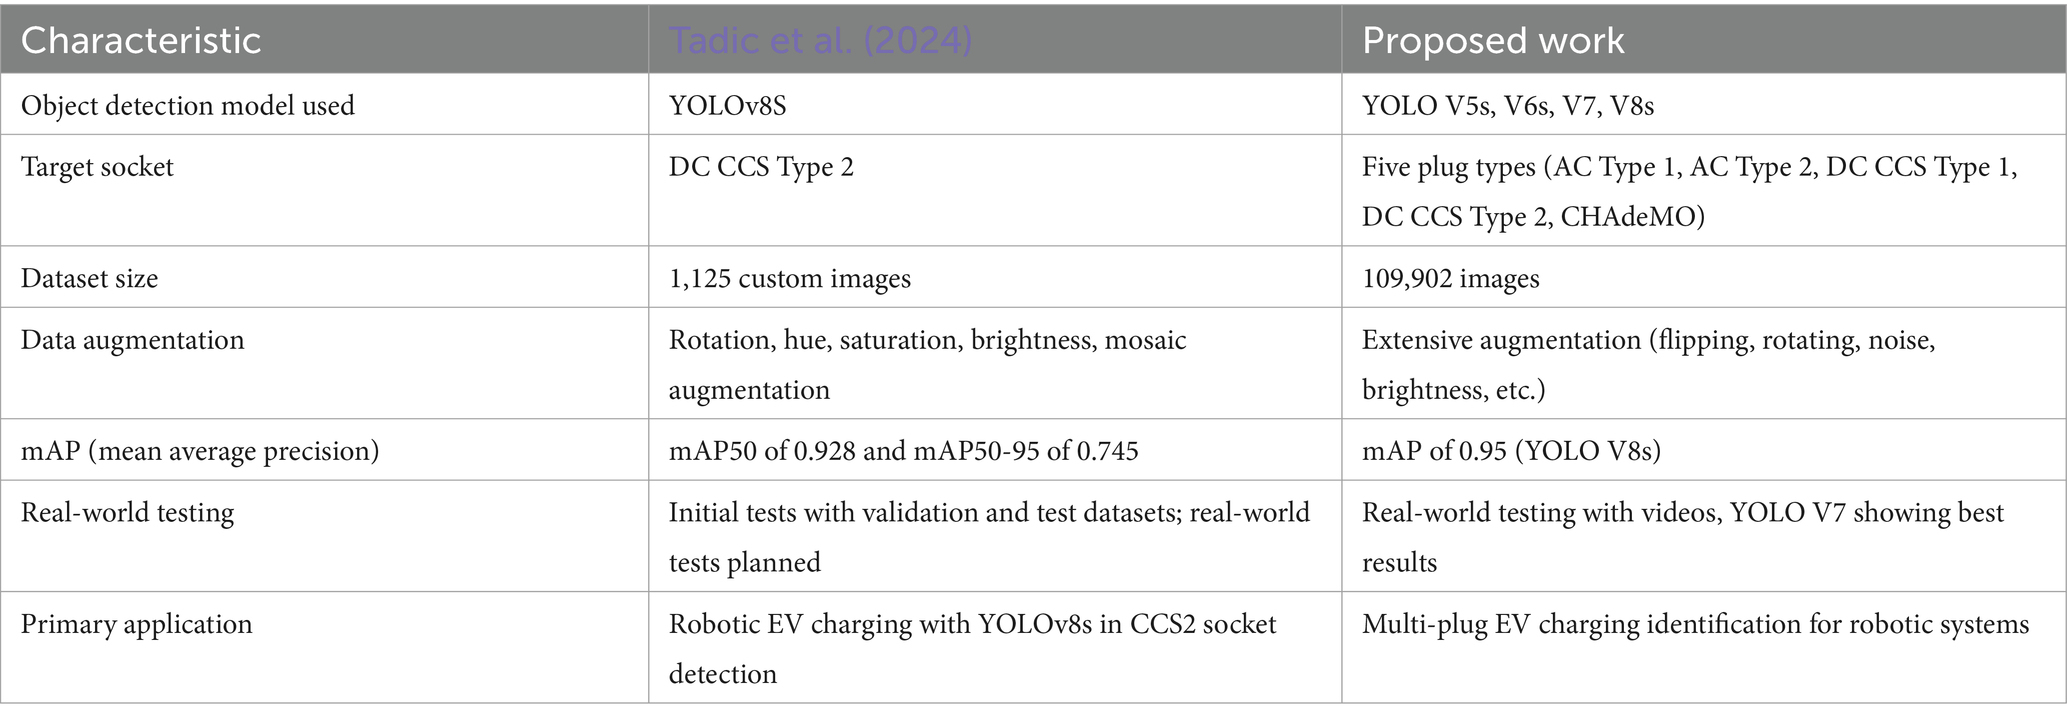
Table 5. The comparison between our proposed method with Tadic et al. (2024).
From Table 6, the confidence score values for all four videos were recorded. The “AVG of Ground Truth” column represents the average of correct predictions only, excluding incorrect ones.
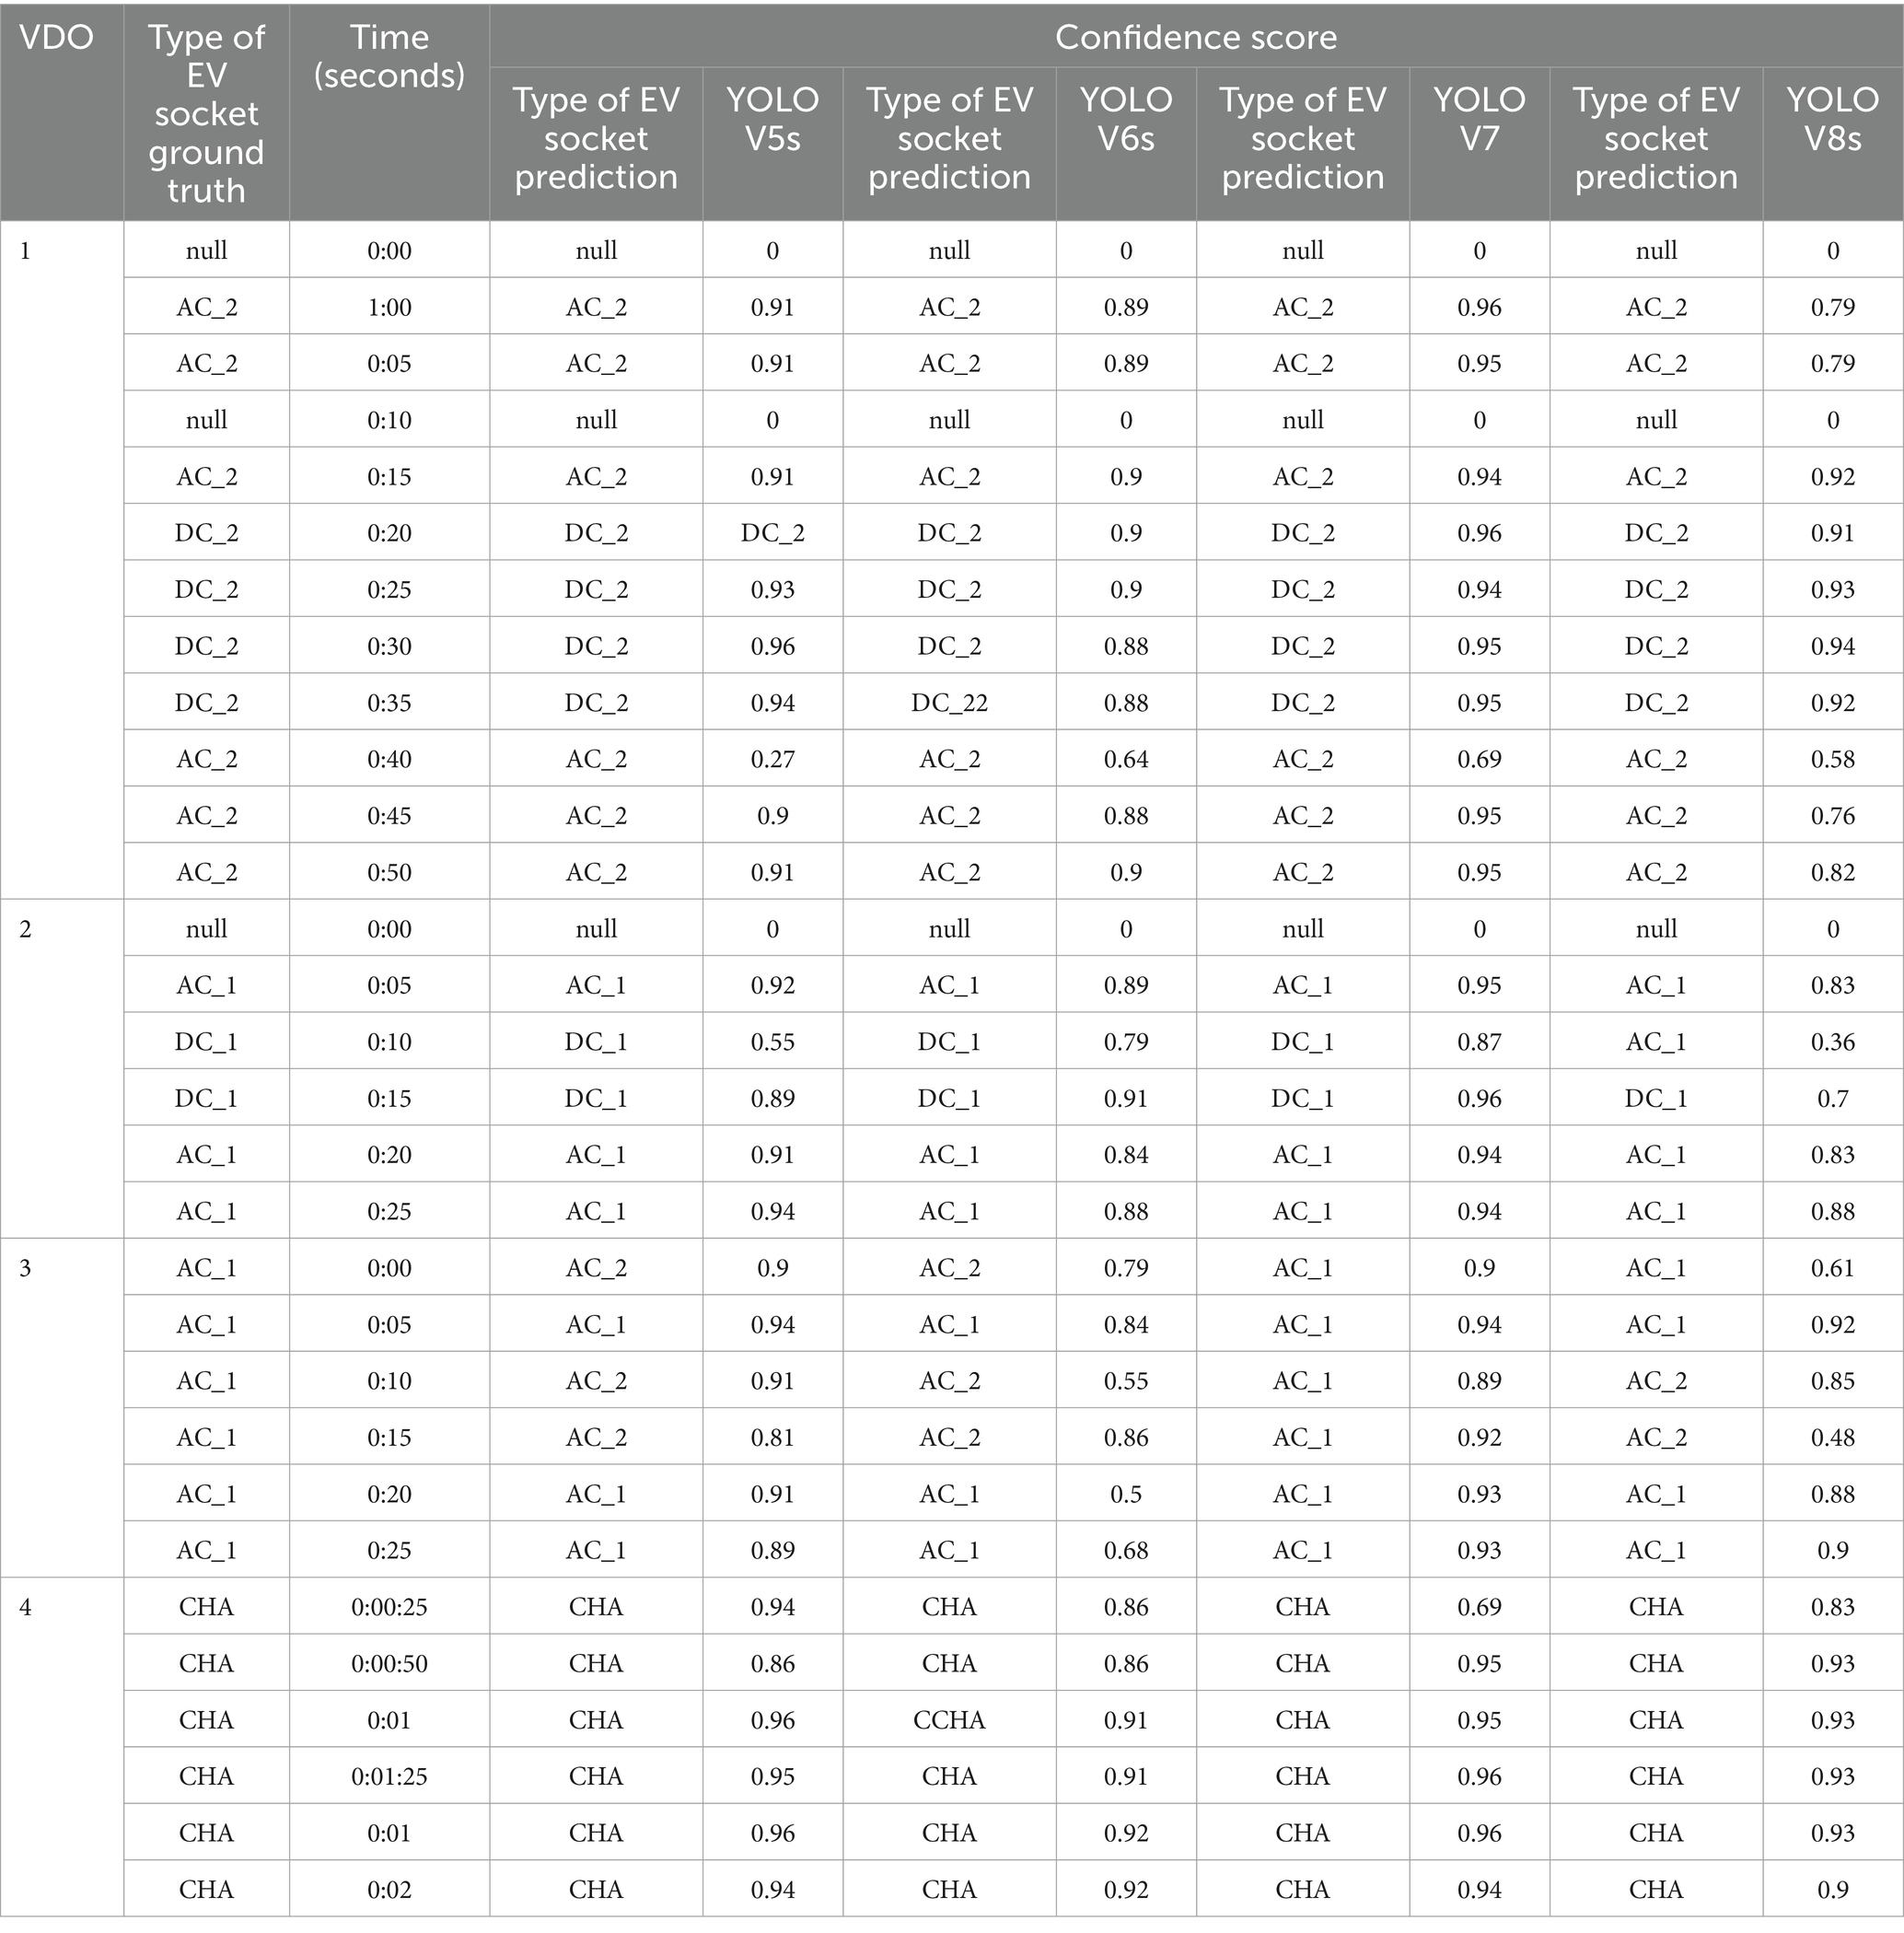
Table 6. Experimental results for all four videos (remark I rename AC_type_1 to AC_1, AC_type_2 to AC_2, DC_type_1 to DC_1, DC_type_2 to DC_2, and CHAdeMO to CHA).
Based on the analysis of Videos 1, 2, and 3, it can be concluded that YOLO V7 generally performs the best compared to YOLO V5s, YOLO V6s, and YOLO V8s. However, there were some specific instances of errors. In Video 2, YOLO V8s misclassified an EV Socket type ‘AC type 1’ as ‘DC CCS1’ at 0:10 s. In Video 3, YOLO V7 made all correct predictions, while YOLO V5s, YOLO V6s, and YOLO V8s made incorrect predictions. Interestingly, YOLO V5s demonstrated the best performance in Video 4 compared to the other models.
Where YOLO V7 has the highest accuracy and has the highest GFLOPS compared to YOLO V5s, YOLO V6s and YOLO V8s. GFLOPS refers to the number of mathematical operations required for the model to complete one iteration. These metrics increase, resulting in an increase in inference speed. The lower the inference speed, the faster the result.
In an experiment to compare performance with other models, we referenced 7/3/24 12:02:00 AM (Tadic et al., 2024). This paper’s approach is similar to ours, with the key difference being that it focuses on detecting only ‘CCS2’ type charging plugs using YOLO V8s.
We obtained the test images (Figure 14) used by Tadic et al. (2024) for performance comparison. This dataset consists of 1,019 images, with Figure 14 showcasing an example. Figure 14 presents the detection results of (Tadic et al., 2024) model on these images. Table 7 records the order, file name, and confidence score for 25 selected images. However, values for images 5, 19, and 23 are missing due to low resolution in Figure 14.

Figure 14. An examples used by Tadic et al. (2024).
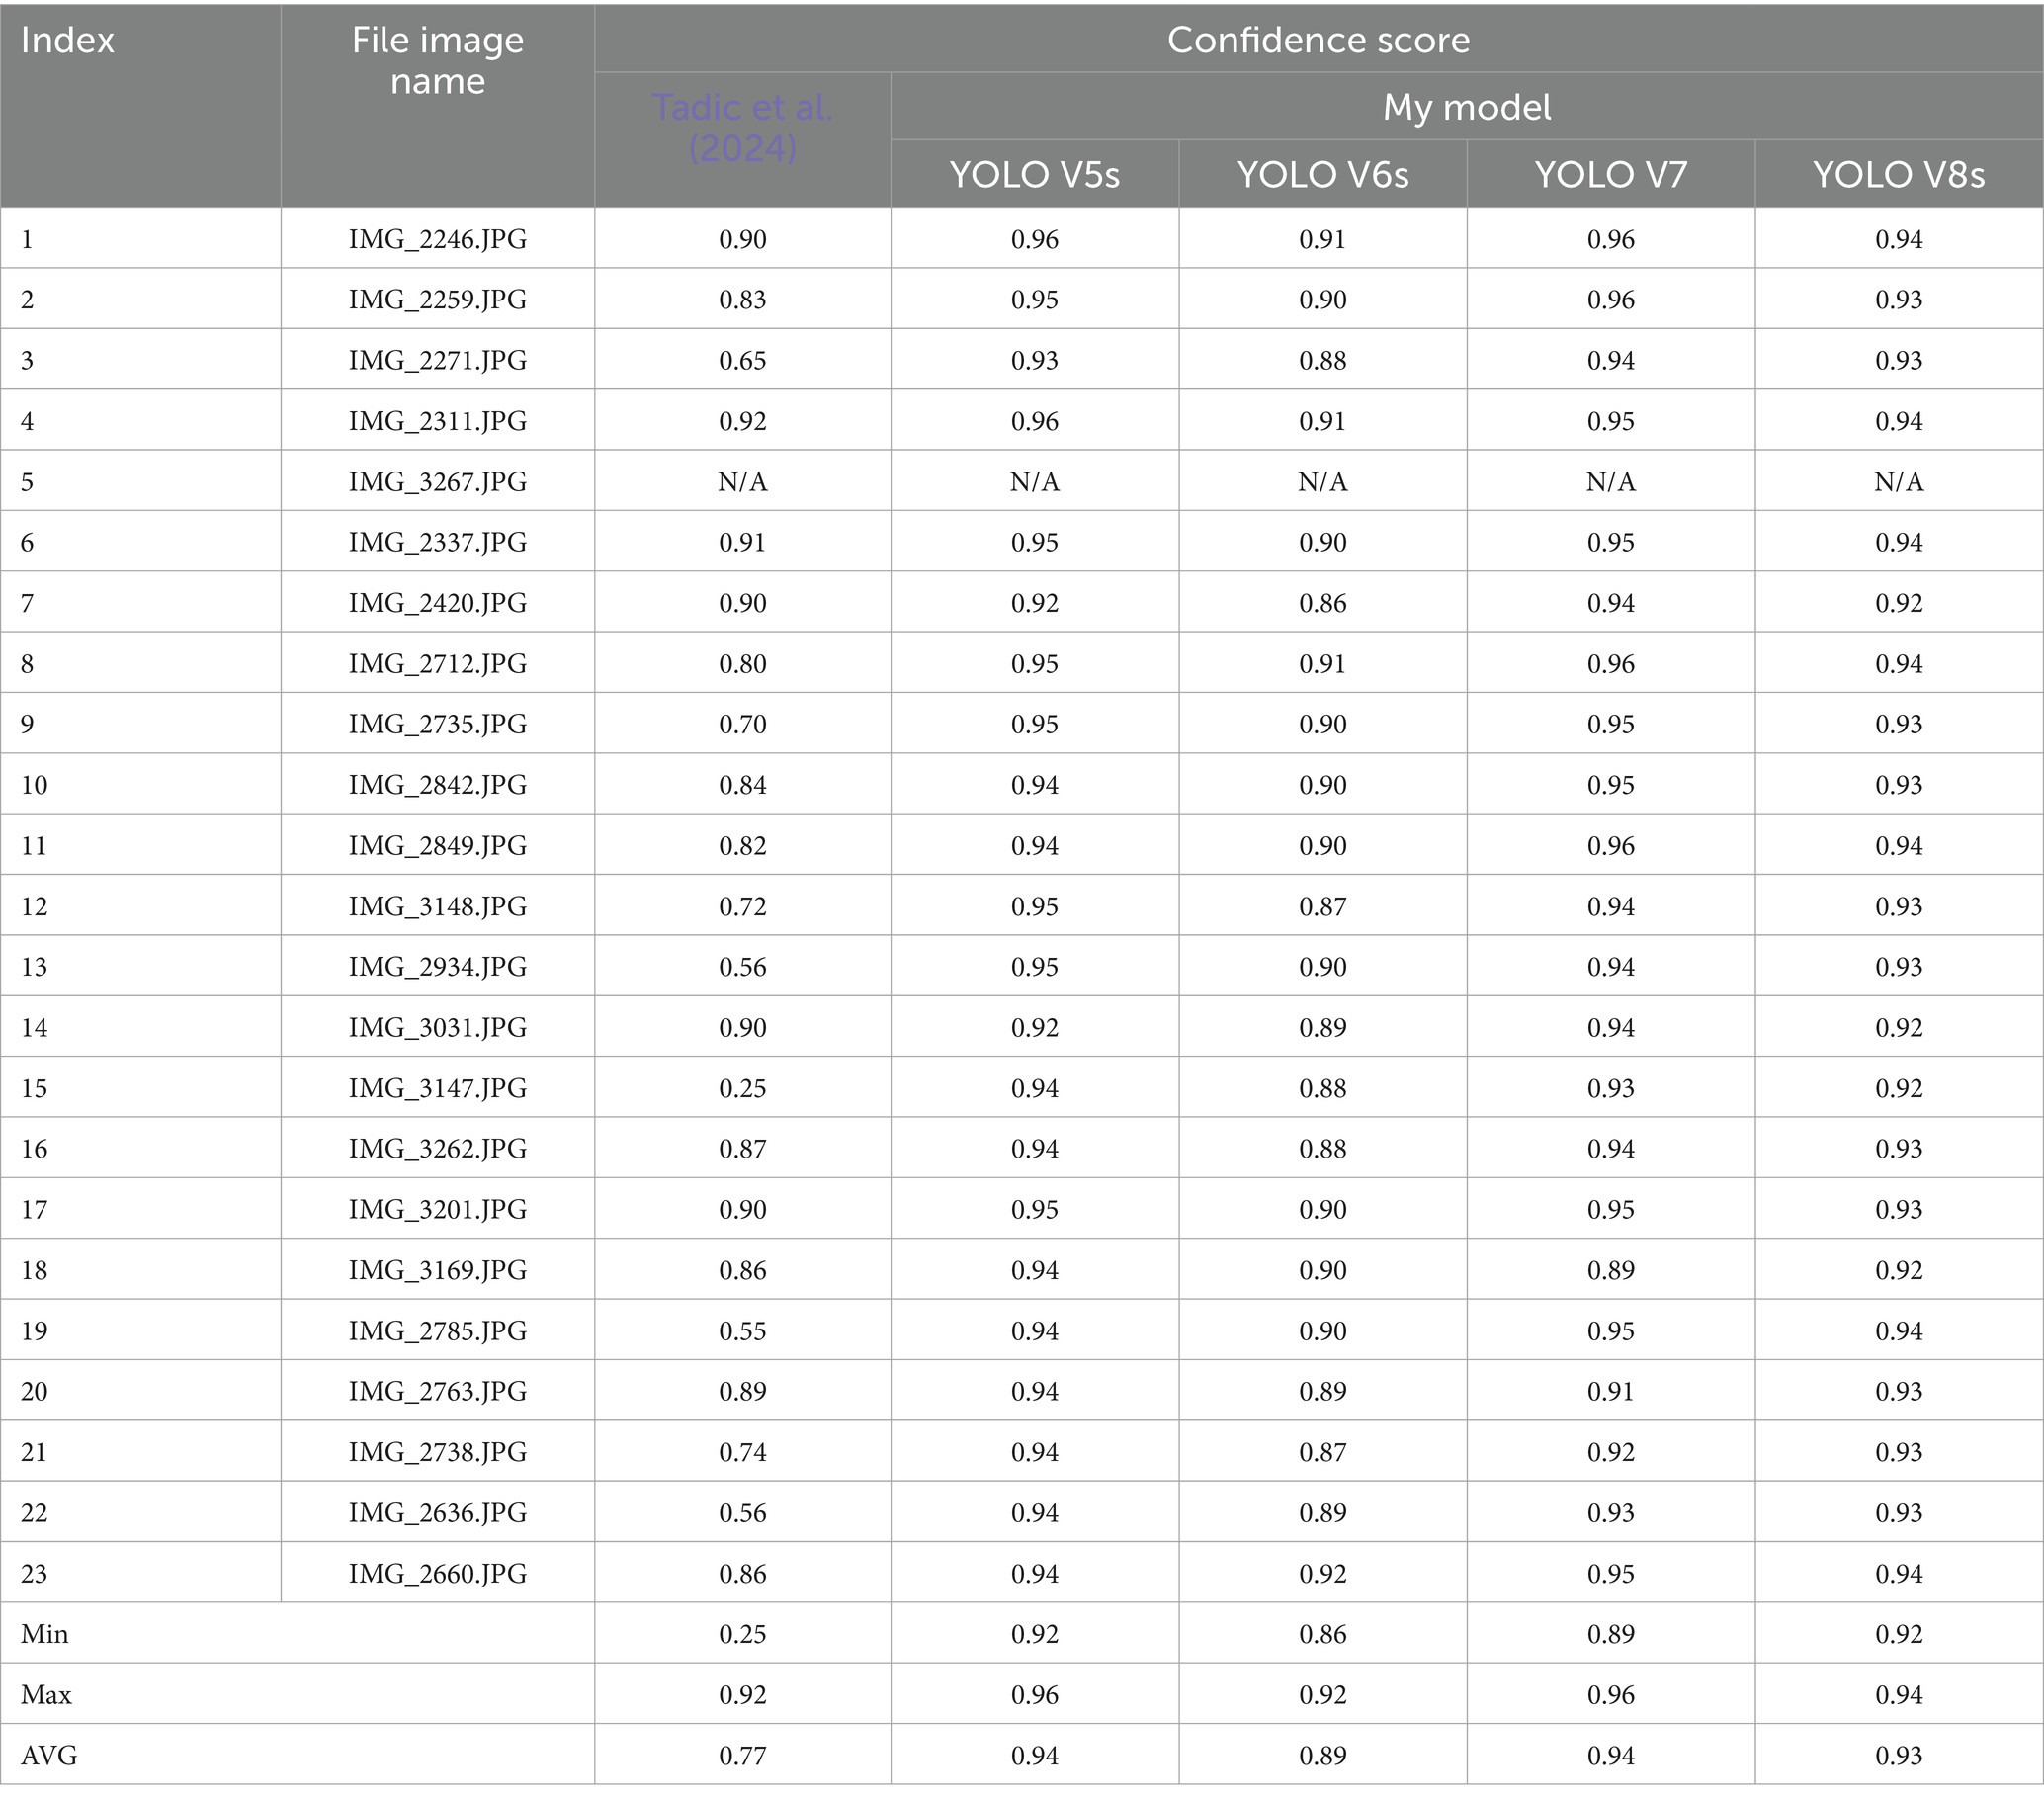
Table 7. The detection results of Tadic et al. (2024) compared with our model.
We tested our models (YOLO V5s, V6s, V7, and V8s) on the same dataset, excluding the unreadable images, using the same parameters as Tadic et al. (2024). The results are presented in Table 7 and Figure 15. The results indicate that our YOLO V5s and YOLO V7 models achieved the best detection performance, with an average score of 0.94. The model by Tadic et al. (2024) had the lowest average performance, with a score of 0.77.
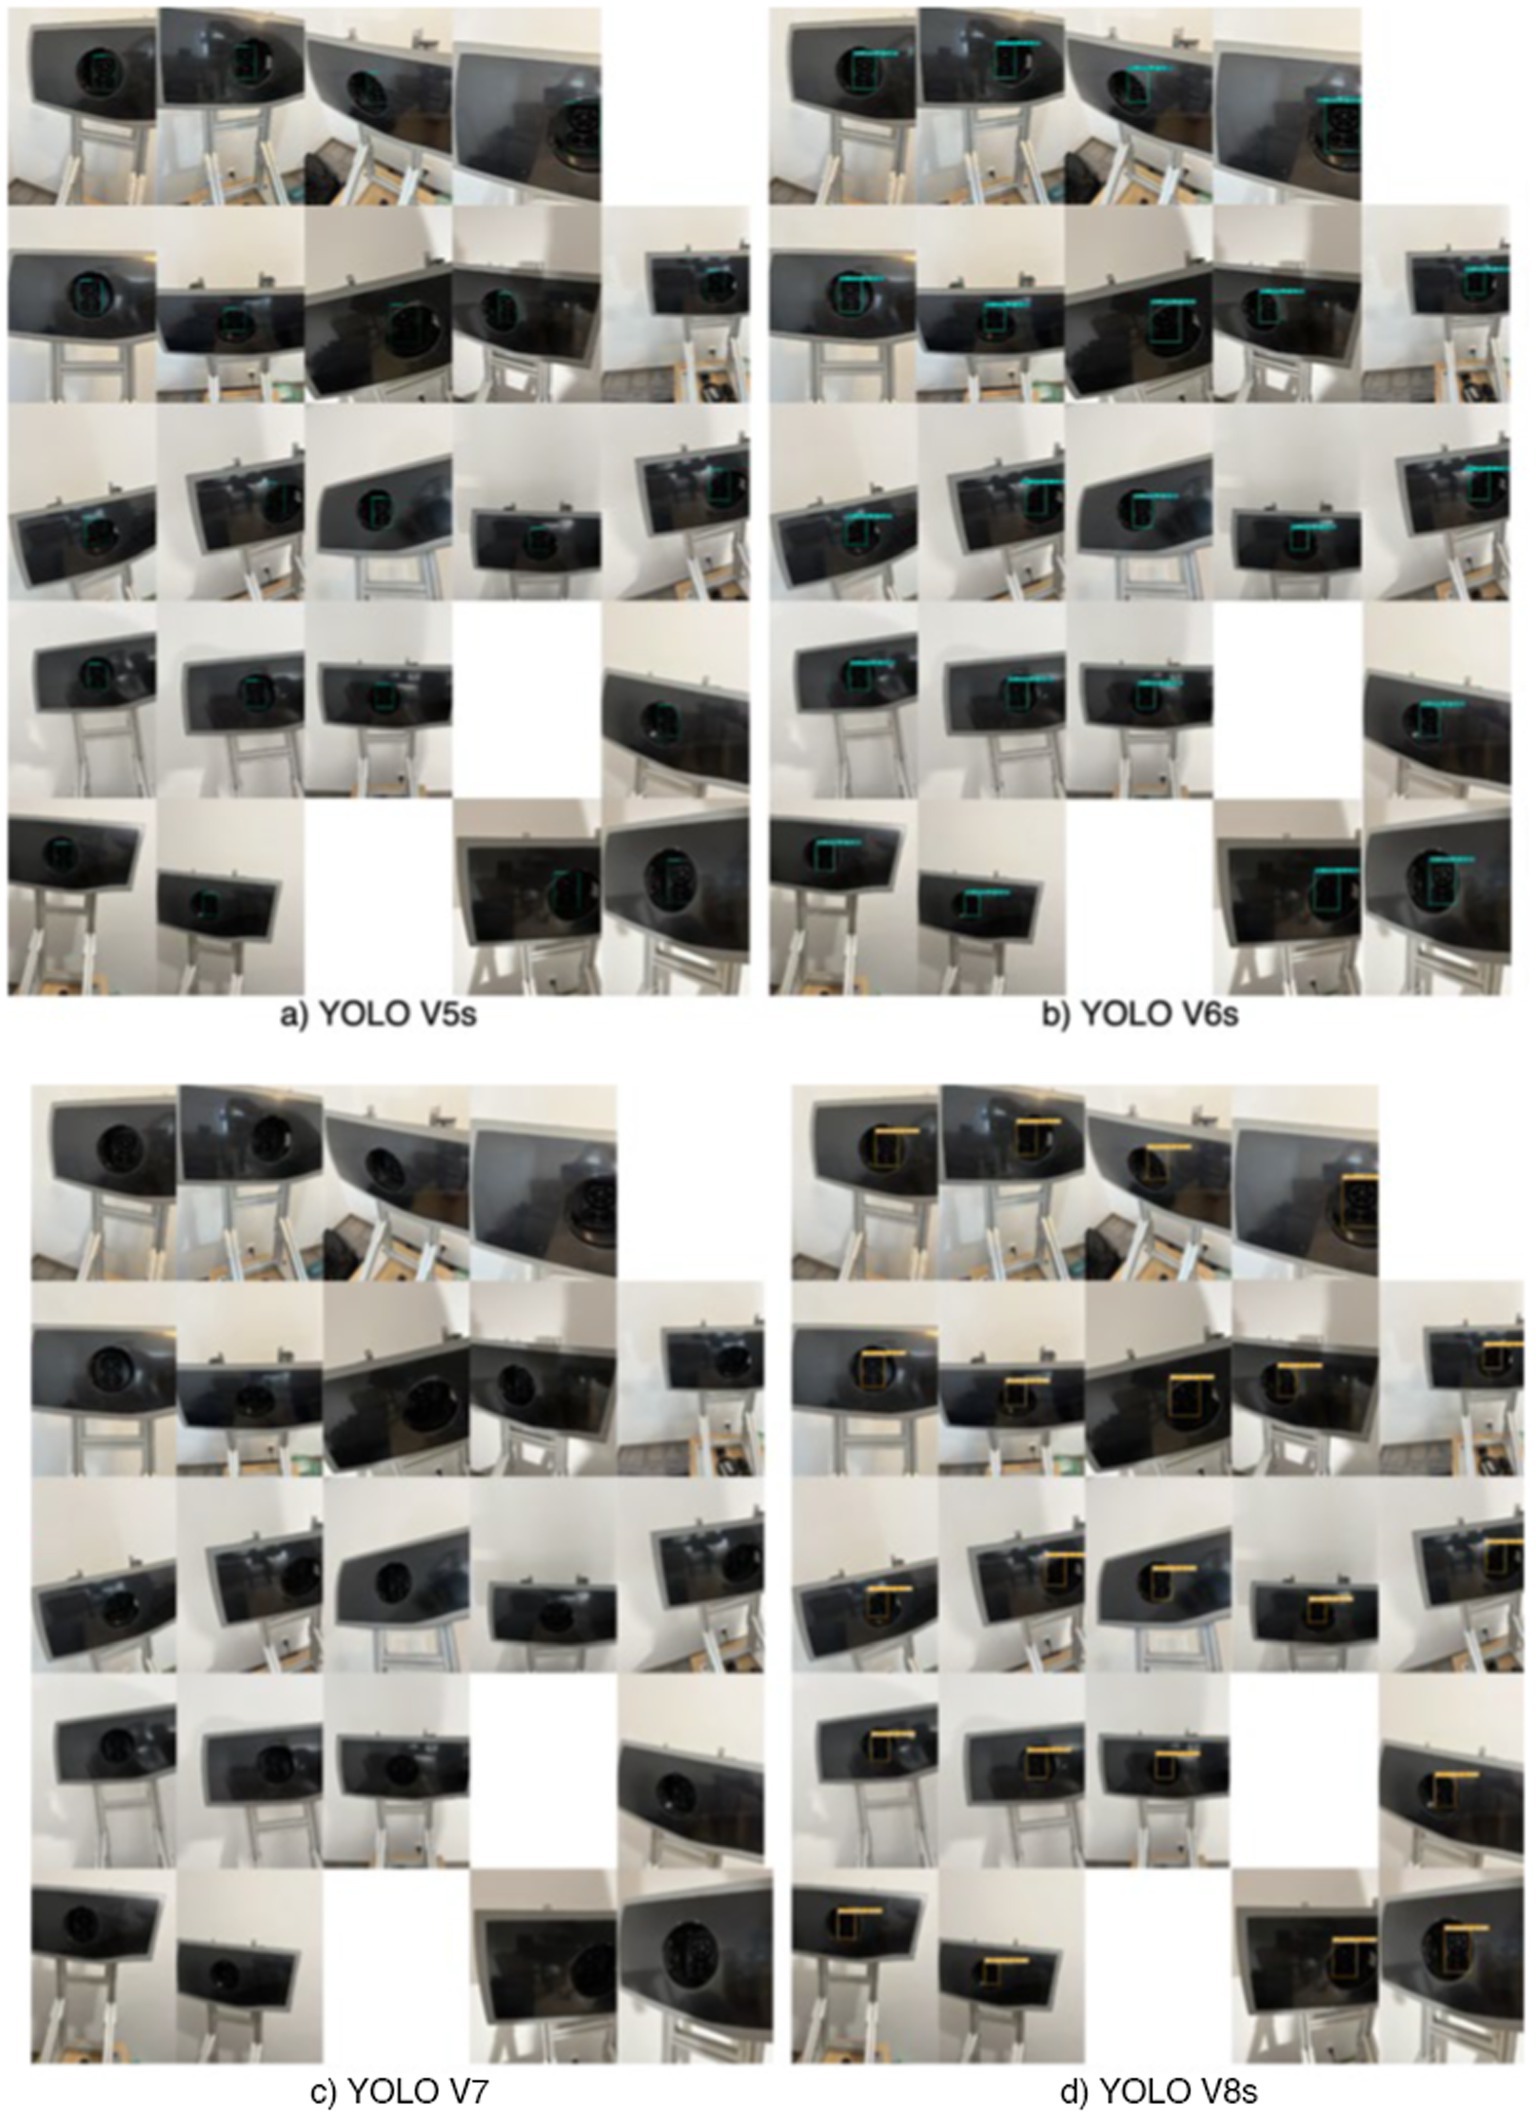
Figure 15. The comparison of efficacy with Tadic et al. (2024).
This research aimed to develop a small model for detecting electric vehicle (EV) charger plug types in Thailand, utilizing YOLO V5s, YOLO V6s, YOLO V7, and YOLO V8s, and comparing their performance. The five EV charger plug types in Thailand are ‘CHAdeMO’, ‘AC type 1’, ‘AC type 2’, ‘DC CCS type 2’, and ‘DC CCS type 1’.
The research objective was to create a model applicable to automatic car charging robots, specifically for detecting these plug types in Thailand. Performance was measured using Precision, Recall, mAP50, mAP50-95, F1 score, and training time (hours) on the same dataset.
Key findings:
• YOLO V8s achieved the highest Precision (0.998), mAP50-95 (0.95), and F1 score (0.997) among the four models.
• YOLO V7 demonstrated the highest Recall (0.997) and mAP50 (0.997).
• YOLO V6s had the shortest training time.
• In real-world video tests, YOLO V7 generally performed best.
• YOLO V7 is not suitable for real-world prediction. The author recommends using YOLO V8s instead of YOLO V7 because it has a GFLOPS value that is about 3.63 times lower than YOLO V7 and has a Recall and m@AP50 value that is close to YOLO V7, approximately 0001, 0.002, respectively. The GFLOPS, Recall, and m@AP5 values can be seen in Table 4.
In summary, YOLOv8 proved to be the most accurate model overall, boasting the highest mAP@0.5:0.95, indicating superior bounding box prediction accuracy across various overlap thresholds. However, YOLOv7 remained competitive due to its impressive mAP@0.5. Yet, YOLO V8s’s faster processing time makes it more suitable for real-world applications with resource constraints.
In an experiment comparing our models’ performance with that of Tadic et al. (2024), we used their test dataset of 1,019 images of ‘CCS2’ charging plugs. Our YOLO V5s and YOLO V7 models outperformed their YOLO V8s model, achieving an average confidence score of 0.94 compared to their 0.77. This suggests that our models, particularly YOLO V5s and V7, offer superior performance in detecting ‘CCS2’ charging plugs compared to the model presented in Tadic et al. (2024).
The datasets presented in this study can be found in online repositories. The names of the repository/repositories and accession number(s) can be found at: https://github.com/phasuwut/_Thesis_Detecting-the-type-of-socket-electric-vehicle-charger-in-Thailand.
PC: Methodology, Software, Visualization, Writing – original draft. PV: Conceptualization, Methodology, Software, Supervision, Writing – review & editing.
The author(s) declare that no financial support was received for the research, authorship, and/or publication of this article.
The authors declare that the research was conducted in the absence of any commercial or financial relationships that could be construed as a potential conflict of interest.
The authors declare that no Gen AI was used in the creation of this manuscript.
All claims expressed in this article are solely those of the authors and do not necessarily represent those of their affiliated organizations, or those of the publisher, the editors and the reviewers. Any product that may be evaluated in this article, or claim that may be made by its manufacturer, is not guaranteed or endorsed by the publisher.
The Supplementary material for this article can be found online at: https://www.frontiersin.org/articles/10.3389/fcomp.2025.1505446/full#supplementary-material
SUPPLEMENTARY FIGURE S1 | The location of electric vehicle charging plugs (Finnerty, 2024).
SUPPLEMENTARY FIGURE S2 | Electric car charging plugs in Thailand (Dini et al., 2023).
SUPPLEMENTARY FIGURE S3 | The architecture of YOLOv5 (Arifando et al., 2023).
SUPPLEMENTARY FIGURE S4 | The architecture of YOLOv6 (Hussain, 2023).
SUPPLEMENTARY FIGURE S5 | The architecture of YOLOv7 (Hussain, 2023).
SUPPLEMENTARY FIGURE S6 | The architecture of YOLOv8 (Rodríguez-Lira et al., 2024).
SUPPLEMENTARY FIGURE S7 | Non-maximum suppression (NMS) (Rodríguez-Lira et al., 2024). (Left) The typical output of an object detection model containing multiple overlapping boxes. (Right) The output after NMS (Terven and Cordova-Esparza, 2023).
SUPPLEMENTARY FIGURE S8 | An architecture of feature pyramid network (FPN) (Lin et al., 2017).
SUPPLEMENTARY FIGURE S9 | Examples of electric car charging plugs (Sangruji, 2021).
SUPPLEMENTARY FIGURE S10 | The standard charging power levels (Ronanki et al., 2019).
SUPPLEMENTARY FIGURE S11 | An example image of an application that provides electric vehicle charging services in Thailand.
A’la, F. Y., Al-Fath, A. A., and Albanna, S. M. (2023). Improving Orange and lemon object detection using YOLOv5 and image augmentation. 2023 10th international conference on advanced informatics: Concept, theory and application (ICAICTA), 1–5. doi: 10.1109/ICAICTA59291.2023.10390446
Aggarwal, A., Kumar, V., and Gupta, R. (2023). Object detection based approaches in image classification: a brief overview. 2023 IEEE Guwahati Subsection Conference (GCON), 1–6. doi: 10.1109/GCON58516.2023.10183609
Arifando, R., Eto, S., and Wada, C. (2023). Improved YOLOv5-based lightweight object detection algorithm for people with visual impairment to detect buses. Appl. Sci. 13:5802. doi: 10.3390/app13095802
Autolifethailand.Tv. (n.d.a). Registration of EV cars in Thailand by year 2023. Available at: https://autolifethailand.tv/total-ev-bev-register-2023-thailand/ (Accessed February 27, 2024).
Autolifethailand.Tv. (n.d.b). Top 10 EV cars in Thailand year 2022. Autolifethailand.Tv. Available at: https://autolifethailand.tv/top-10-register-ev-bev-2022-thailand/ (Accessed February 27, 2024).
Badeka, E., Vrochidou, E., Papakostas, G. A., Pachidis, T., and Kaburlasos, V. G. (2020). Harvest crate detection for grapes harvesting robot based on YOLOv3 model. 2020 Fourth International Conference on Intelligent Computing in Data Sciences (ICDS), 1–5. doi: 10.1109/ICDS50568.2020.9268751
Buslaev, A., Iglovikov, V. I., Khvedchenya, E., Parinov, A., Druzhinin, M., and Kalinin, A. A. (2020). Albumentations: fast and flexible image augmentations. Information 11:125. doi: 10.3390/info11020125
Chalitapanukul, N., and Wongseri, W. (2022). Automated steel surface visual inspection system. KMUTNB.
CVAT. (n.d.). Available at: https://www.cvat.ai/ (Accessed March 15, 2024).
Dini, P., Saponara, S., and Colicelli, A. (2023). Overview on battery charging systems for electric vehicles. Electronics 12:4295. doi: 10.3390/electronics12204295
Electric Vehicle Association of Thailand 2019.pdf. (n.d.). Available at: https://evat.or.th/images/evinfo/directory/pdf/4.pdf (Accessed February 26, 2024).
Electric Vehicle Association of Thailand 2020.pdf. (n.d..). Available at: https://evat.or.th/images/evinfo/directory/pdf/3.pdf (Accessed February 26, 2024).
Electric Vehicle Association of Thailand 2021.pdf. (n.d.). Available at: https://evat.or.th/images/evinfo/directory/pdf/2.pdf (Accessed February 26, 2024).
Electric Vehicle Association of Thailand 2022-2023.pdf. (n.d..). Available at: https://evat.or.th/images/evinfo/directory/pdf/1.pdf (Accessed February 26, 2024).
EV chargers’ station in Thailand. (n.d.). Available at: https://www.eppo.go.th/index.php/th/component/k2/item/17748-ev-station-info (Accessed February 28, 2024).
Everingham, M., Van Gool, L., Williams, C. K. I., and Winn, J., and Zisserman, A. (2010). The Pascal Visual Object Classes (VOC) Challenge. Int J Comput Vis 88, 303–338. doi: 10.1007/s11263-009-0275-4
Felzenszwalb, P. F., Girshick, R. B., McAllester, D., and Ramanan, D. (2010). Object detection with discriminatively trained part-based models, in IEEE Transactions on pattern analysis and machine intelligence, 32, 1627–1645. doi: 10.1109/TPAMI.2009.167
Finnerty, J. (2024). GRIDSERVE | where is the charge port on my electric car? Available at: https://www.gridserve.com/2024/02/26/where-is-the-charge-port-on-my-electric-car/ (Accessed February 04, 2024).
Hussain, M. (2023). YOLO-v1 to YOLO-v8, the rise of YOLO and its complementary nature toward digital manufacturing and industrial defect detection. Mach. Des. 11:677. doi: 10.3390/machines11070677
Khadidos, A. O., Manoharan, H., Selvarajan, S., Khadidos, A. O., Alshareef, A. M., and Altwijri, M. (2024). Distribution of resources beyond 5G networks with heterogeneous parallel processing and graph optimization algorithms. Clust. Comput. 27, 8269–8287. doi: 10.1007/s10586-024-04367-w1.w01.lbu.da.ulcc.ac.uk
Li, S., Huang, H., Meng, X., Wang, M., Li, Y., and Xie, L. (2023). A glove-wearing detection algorithm based on improved YOLOv8. Sensors (Basel) 23. doi: 10.3390/s23249906
Lin, T.-Y., Dollár, P., Girshick, R., He, K., Hariharan, B., and Belongie, S. (2017). Feature pyramid networks for object detection. arXiv. Available at: http://arxiv.org/abs/1612.03144
List Augmentation.Txt. (n.d.) Available at: https://github.com/phasuwut/_Thesis_Detecting-the-type-of-socket-electric-vehicle-charger-in-Thailand/blob/main/File_reference/%5BDataset%5D%20List%20augmentation.txt (Accessed July 03, 2024).
List Source.xlsx. (n.d.). Available at: https://github.com/phasuwut/_Thesis_Detecting-the-type-of-socket-electric-vehicle-charger-in-Thailand/blob/main/File_reference/%5BDataset%5D%20List%20source.xlsx (Accessed July 03, 2024).
MOT Data Catalog, Open Government Data of Thailand. (n.d.). Available at: https://web.dlt.go.th/statistics/index.php (Accessed February 27, 2024).
Olorunshola, O. E., Irhebhude, M. E., and Evwiekpaefe, A. E. (2023). A comparative study of YOLOv5 and YOLOv7 object detection algorithms. J. Comput. Soc. Inf. 2, 1–12. doi: 10.33736/jcsi.5070.2023
Padigela, J., Balla, S. S., Akula, P., and Sravani, K. (2023). Comparison of data augmentation techniques for training CNNs to detect pneumonia from chest X-ray images. 2023 International Conference on Computational Intelligence for Information, Security and Communication Applications (CIISCA), 35–39. doi: 10.1109/CIISCA59740.2023.00017
Rahman, N., and Das, S. K. (2022). A fusion of three custom-tailored deep learning architectures for waste classification. 2022 4th International Conference on Sustainable Technologies for Industry 4.0 (STI), 1–6. doi: 10.1109/STI56238.2022.10103297
Roboflow. (n.d.). Roboflow: Computer vision tools for developers and enterprises. Available at: https://roboflow.com/ (Accessed February 26, 2024).
Rodríguez-Lira, D.-C., Córdova-Esparza, D.-M., Álvarez-Alvarado, J. M., Romero-González, J.-A., Terven, J., and Rodríguez-Reséndiz, J. (2024). Comparative Analysis of YOLO Models for Bean Leaf Disease Detection in Natural Environments. Agric. Eng. 6, 4585–4603. doi: 10.3390/agriengineering6040262
Ronanki, D., Kelkar, A., and Williamson, S. S. (2019). Extreme fast charging technology—prospects to enhance sustainable electric transportation. Energies 12:3721. doi: 10.3390/en12193721
Sangruji, R. (2021). A study on factor affecting internal combustion engine Thailand consumer for selecting electric vehicle charging station in the future. College of Management Mahidol University. Available at: https://archive.cm.mahidol.ac.th/handle/123456789/4212 (Accessed March 02, 2024).
Selvarajan, S., Manoharan, H., Khadidos, A. O., Khadidos, A. O., Alshareef, A. M., and Alsobhi, A. (2024a). Secured 6G communication for consumer electronics with advanced artificial intelligence algorithms. IEEE Trans. Consum. Electron. 70, 5711–5718. doi: 10.1109/TCE.2024.3382779
Selvarajan, S., Manoharan, H., Khadidos, A. O., Shankar, A., Alshareef, A. M., and Alsobhi, A. (2024b). PUDT: plummeting uncertainties in digital twins for aerospace applications using deep learning algorithms. Futur. Gener. Comput. Syst. 153, 575–586. doi: 10.1016/j.future.2023.11.034
Sun, Y., Li, Y., Li, S., Duan, Z., Ning, H., and Zhang, Y. (2023). PBA-YOLOv7: an object detection method based on an improved YOLOv7 network. Appl. Sci. 13:10436. doi: 10.3390/app131810436
Tadic, V., Odry, A., Vizvari, Z., Kiraly, Z., Felde, I., and Odry, P. (2024). Electric vehicle charging socket detection using YOLOv8s model. Acta Polytech. Hung. 21, 121–139. doi: 10.12700/APH.21.10.2024.10.8
Terven, J., and Cordova-Esparza, D. (2023). A comprehensive review of YOLO architectures in computer vision: from YOLOv1 to YOLOv8 and YOLO-NAS. Mach. Learn. Knowl. Extr. 5, 1680–1716. doi: 10.3390/make5040083
Keywords: electric vehicle, object detection, YOLO, charging plug, EV station
Citation: Chunnapiya P and Visutsak P (2025) Enhancing automatic electric vehicle charging: a deep learning approach with YOLO and feature extraction techniques. Front. Comput. Sci. 7:1505446. doi: 10.3389/fcomp.2025.1505446
Edited by:
Sokratis Makrogiannis, Delaware State University, United StatesReviewed by:
Hariprasath Manoharan, Panimalar Institute of Technology, IndiaCopyright © 2025 Chunnapiya and Visutsak. This is an open-access article distributed under the terms of the Creative Commons Attribution License (CC BY). The use, distribution or reproduction in other forums is permitted, provided the original author(s) and the copyright owner(s) are credited and that the original publication in this journal is cited, in accordance with accepted academic practice. No use, distribution or reproduction is permitted which does not comply with these terms.
*Correspondence: Porawat Visutsak, cG9yYXdhdHZAa211dG5iLmFjLnRo
Disclaimer: All claims expressed in this article are solely those of the authors and do not necessarily represent those of their affiliated organizations, or those of the publisher, the editors and the reviewers. Any product that may be evaluated in this article or claim that may be made by its manufacturer is not guaranteed or endorsed by the publisher.
Research integrity at Frontiers
Learn more about the work of our research integrity team to safeguard the quality of each article we publish.