 Jonatan Reyes
 Anil Ufuk Batmaz
 Marta Kersten-Oertel
95% of researchers rate our articles as excellent or good
Learn more about the work of our research integrity team to safeguard the quality of each article we publish.
Find out more
ORIGINAL RESEARCH article
Front. Comput. Sci. , 07 February 2025
Sec. Mobile and Ubiquitous Computing
Volume 7 - 2025 | https://doi.org/10.3389/fcomp.2025.1464348
This article is part of the Research Topic Hybrid Human Artificial Intelligence: Augmenting Human Intelligence with AI View all 8 articles
Introduction: Decision-making based on AI can be challenging, especially when considering the uncertainty associated with AI predictions. Visualizing uncertainty in AI refers to techniques that use visual cues to represent the level of confidence or uncertainty in an AI model's outputs, such as predictions or decisions. This study aims to investigate the impact of visualizing uncertainty on decision-making and trust in AI.
Methods: We conducted a user study with 147 participants, utilizing static classic gaming scenarios as a proxy for human-AI collaboration in decision-making. The study measured changes in decisions, trust in AI, and decision-making confidence when uncertainty was visualized in a continuous format compared to a binary output of the AI model.
Results: Our findings indicate that visualizing uncertainty significantly enhances trust in AI for 58% of participants with negative attitudes toward AI. Additionally, 31% of these participants found uncertainty visualization to be useful. The size of the uncertainty visualization was identified as the method that had the most impact on participants' trust in AI and their confidence in their decisions. Furthermore, we observed a strong association between participants' gaming experience and changes in decision-making when uncertainty was visualized, as well as a strong link between trust in AI and individual attitudes toward AI.
Discussion: These results suggest that visualizing uncertainty can improve trust in AI, particularly among individuals with negative attitudes toward AI. The findings also have important implications for the design of human-AI decision-support systems, offering insights into how uncertainty can be visualized to enhance decision-making and user confidence.
Artificial intelligence (AI), a field where computers are leveraged to mimic or reproduce the problem-solving and decision-making capabilities of the human mind, is having significant impacts on people's work and lives. The adoption of AI models for decision-making is significantly increasing in our daily lives from leisure, entertainment (Kulesza et al., 2012) and serious gaming (Schueller et al., 2020; Jagtap et al., 2023) to more sensitive domains, such as criminal justice, banking, or healthcare (McKay, 2020; Zhang et al., 2021a; Madani et al., 2020).
Until recently, the development of AI systems has mainly been driven by a “technology-centered approach," which focuses on algorithms rather than the development of useful AI systems that meet actual user needs (Shneiderman, 2020; Xu et al., 2023; Zheng et al., 2017). However, neglecting the adoption of a “user-centered design" (Abras et al., 2004), “human-centered design" (Oviatt, 2006) or “human-AI" (Xu et al., 2023) approach, which prioritizes the usability and usefulness of these systems by focusing on users, their needs, and requirements, can lead to limited use and uptake of these systems. One specific aspect of human-AI design is to consider how to display an AI model's information. Yet, few researchers have focused on how best to convey AI information to the user and how different visualizations can impact perception and cognition.
From the user perspective, users often rely on AI models without understanding the confidence of the AI's prediction almost to the point of delegating decisions to the automated systems completely (Araujo et al., 2020; Prabhudesai et al., 2023). This can result in a false sense of confidence, ineffective decision-making and incorrect conclusions. Indeed, a clear interpretation of AI predictions' uncertainty (e.g., recommendation) is not trivial and can pose a challenge for many experts and non-experts, particularly in areas where there is high uncertainty. This is more evident when human factors (e.g., visual perception and cognition) are not considered in the design choices of presenting model results, which can lead to decision errors that can cause adverse effects on the users of those systems.
In this paper, we sought to understand how visualizing an AI model's uncertainty affects decision-making, to identify common traits among people who accept machine judgment as support for their decisions, and to explore the ways humans manage decision-making under the exposure of algorithmic advice. Specifically, we focus on exploring the impact of visualization of uncertainty on people's decisions, trust in AI model's reliability, and confidence in decisions among people with different attitudes toward AI (Schepman and Rodway, 2020). To answer these questions, we conducted a large exploratory study via online surveys using classical games. We designed a number of gaming scenarios, with and without visualization of AI uncertainty, where participants assessed situations to determine a move for a character in a game. We then measured the number of decision changes (when uncertainty visualization was used in a specific scenario versus when it was not used), and fluctuations in trust in AI and confidence in their decisions. In the last part of the study, we evaluated users' perceptions regarding the utility and preference of various visual representations of AI uncertainty, as a way to highlight the limitations of AI model outputs and promote transparency.
This paper makes the following contributions: (1) We provide empirical evaluations on how visualizing AI uncertainty affects human factors, particularly trust in AI, confidence in decisions, and decision changes, considering individuals with varying attitudes toward AI. (2) We use static classic game scenarios as proxies to study human-AI interaction in decision-making, through evaluations about the utility and preference of visual representations of AI uncertainties by using simple visual techniques like size, color saturation, and transparency.
There are a number of research works that investigate new algorithms, improvements, applications, and the influence of AI. Indeed, recent studies have addressed questions about AI-based decision-support systems from the angle of human perceptions, including evaluations of factors such as risk, anxiety, fairness, usefulness, and trustworthiness (Araujo et al., 2020; Liu et al., 2022; Guo et al., 2019; Cai et al., 2019; Kwak et al., 2022). This paper builds upon prior research at the intersection of data visualization, human-AI design, and decision support systems.
Data visualization is a representation technique that transforms datasets into visual components in order to obtain actionable insights. Mackinlay (1986) addressed the importance of leveraging the human visual system and its perceptual capabilities and visual variables to create effective visual expressions of information. In our context, we use different visual representation of the AI model's output and measure people's perception of AI uncertainty as a way to improve decision-making confidence and alleviate the challenge of reasoning with uncertainty.
Previous research studies suggest three main categories for perceiving data uncertainty: color-oriented approaches (hue, saturation, or brightness), focus-based methods (mapping uncertainty to contour crispness, transparency, or resolution), and geometric mapping (e.g., sketchiness in rendering, distorting line marks) (Boukhelifa et al., 2012). Blur has also been used to guide attention to in-focus regions in images, which can be considered to have more certainty. Also, heat maps are a commonly used color-oriented approach that is specifically useful in identifying regions of interest. Generally, the range between blue-green indicates low-interest regions, and the range between yellow-red indicates regions of high interest. Despite the benefits generated by heat maps, several researchers argued that such maps can be confusing due to the lack of perceptual ordering (Borland and Ii, 2007). In addition, according to Breslow et al. (2009), an alternative to color heat maps is to use changes in contrast or luminance in a single hue, which allows one to compare relative values between high and low interest regions or regions with more or less certainty. Based on these previous works, we chose to use size, color saturation, and transparency as means to represent varying levels of uncertainty in AI's outputs.
As described by Jarrahi (2018), human-AI research primarily aims to augment human capabilities and enhance decision-making processes rather than simply replacing humans in those decisions. To support this vision, a substantial body of research has explored the practical use of AI-driven decision support systems across various domains, including healthcare, productivity, performance evaluations, negotiation, law and civic affairs, finance, business, education, leisure and arts (Phillips-Wren, 2012; Malof et al., 2012; Papageorgiou et al., 2011; Monteserin and Amandi, 2011; Taghezout and Zaraté, 2011; Lai et al., 2021; Bellaiche et al., 2023). Although some research has focused on improving human-AI collaboration to support decision-making by building trust in AI, others have integrated visual representations of AI uncertainty.
Trust is defined as the degree to which a person or group of people relies on or has confidence in the dependability of someone or something to fulfill their promise (APA, 2011). Thus, establishing trust in AI is crucial for achieving the adoption of AI systems as decision support systems. While there is no consensus on how the broad conceptualization of trust should be measured, some works either utilize Mayer et al.'s dimensions of trust (Mayer et al., 1995), or build their own self-assessment questions to measure trust.
Online surveys, specific-purpose applications, and simulations have been created as instruments for evaluating trust in AI. For example, Liu et al. (2022) investigated people's perception of trust, experience, and attitudes toward AI with emails written by AI language models. Trust was measured with Mayer et al.'s dimensions of trust (Mayer et al., 1995), and the attitudes toward AI with the General Attitudes toward Artificial Intelligence Scale (GAAIS) (Schepman and Rodway, 2020). Their findings suggested that trust in emails weakens when people are aware of AI's intervention, but it grows stronger when the content of the email involves relations between people. No significant correlations were found between AI attitudes and trust. Similarly, Zhang et al. (2021a) used an online survey to explore user's perceptions of trust, performance expectancy, and intentions regarding the quality of financial advice provided by AI-driven advisors. Trust was measured with a Likert scale for the first part of the study and with a self-assessment based on three dimensions: cognitive trust in competency, cognitive trust in integrity, and emotional trust in the last part. The outcomes of the study suggested that human financial advisors were trusted more than AI-advisors, regardless of their expertise level and sex. Also, no significant differences between human and AI-advisors were found regarding performance expectancy and intention to hire. Participants were assessed based on their trust in AI, perceived utility, workload, and preference between two interfaces were measured. Trust was measured with Mayer et al.'s dimensions of trust (Mayer et al., 1995). The study found a perceived increase in utility, trust in AI, and preference for the AI system over traditional interfaces. In the military domain, Gurney et al. (2022) adapted an online simulation where an AI-agent provided recommendations to wear or not protective gear during reconnaissance missions. Trust was evaluated indirectly through compliance (participants followed the AI's recommendation at early stages of the mission) and directly with a subjective scale for attitudinal trust, namely the inventory (DTI) (McKnight et al., 2002). DTI measures perceptions of users in the AI-agent's abilities, safety promotion, and limitation. The study showed that early human behavior within the mission was a predictor of later compliance and mission success. Notably, none of these research focus on the visualization of AI model's uncertainty.
More recently, Takagi et al. (2024) investigated behavioral trust by examining how participants' trust in human and AI counterparts was influenced by their computational ability and the risk of betrayal. Using a controlled trust game, the study found that participants placed more trust in both human and AI agents compared to a straightforward risk-taking task without a counterpart. Both tasks showed risk of betrayal using discrete probabilities (e.g. 0%–100%), based on previous outcomes. The study showed no significant differences in trust behavior between human and AI counterparts, and no evidence of betrayal aversion toward humans or algorithm aversion toward AI. Also, Zarifis and Cheng (2024) conducted an online survey to investigate how humans build trust in AI-generated financial advice, focusing on two distinct scenarios. In the first scenario, where financial advice questions were specific, the authors found that the lack of human-like characteristics and emotions did not influence trust. In the second scenario, where the questions were more vague, the inclusion of human-like behaviors and emotions in the AI-generated advice was shown to increase trust. Both research studies do not include an evaluation of the uncertainty associated with AI models.
Another line of research focuses on improving decision-making by helping users understand the limits of AI through the visualizing of uncertainty in the predictions. This has been accomplished through interaction with the user interface and with the addition of visual cues into the AI output. Daradkeh and Abul-Huda (2017) developed an interactive system that allows users to explore and compare the uncertainty and risk of AI predictions through adjustable bars. While this work highlights the importance of visualizing uncertainty through interactions, it does not delve into examining users' perceptions. Doula et al. (2022) compared the effect of displaying AI's uncertainty in an augmented reality (AR) environment. In this study, an AI-powered mobile application predicted the locations of sound sources behind walls and participants decided whether or not to follow the AI recommendations. Post-interviews revealed that the majority of participants would trust AI systems more when uncertainty is shown to the user. Marusich et al.'s (2023) study assesses the utility of well-calibrated uncertainty in decision-making. With an online user study, the authors compared participant's accuracy and confidence in decisions, as well as the accuracy of AI predictions using visual representations, such as needles and dotplots. Cassenti et al.'s (2023) study aimed at identify the best ways to represent uncertainty. In an online survey, compliance with the AI recommendations for a convoy to pass or not a risky road were measured. Different representations of verbal and visual uncertainty were presented: text-based with probabilities, with frequencies, and graphical representation using a subjective logic triangle and beta distributions. This study also measured user's perceptions of trust in AI prediction with the Trust in Automation scale (Jian et al., 2000), a tool developed to measure the level of trust in automated systems.
A few additional studies exploring trust in AI through uncertainty-aware outputs were highlighted in the literature review by Afroogh et al. (2024). For instance, Okamura and Yamada (2020) conducted an online experiment involving drone simulations to detect and address trust over-reliance and found that presenting simple cognitive cues adaptively could effectively help calibrate trust during periods of over-trust. Similarly, Tomsett et al. (2020) investigated methods to enhance trust in AI in high-risk scenarios, using simple visual cues. Specifically, the experiment included shaded areas in a 2D projection of the AI model's latent feature space. Their findings suggest that incorporating transparency through interpretability and awareness of uncertainty can improve trust calibration in AI. These studies, which emphasize enabling transparency about the limitations of AI models, align closely with the aims of the current study.
In the context of gaming, uncertainty information has been studied from different perspectives. In Greis et al.'s (2016) work, the authors designed a web-based game to model risky situations in a farm and used four visual representations of the uncertainty in weather prediction probabilities. In their work, the authors conclude that more information presented on the screen leads people to take unnecessary risks. Alternatively, the gamification of real-life events has been used to explore the effects of uncertainty through simulations of natural disasters. Schueller et al. (2020) designed three serious games with the objective of understanding how uncertainty in simulated crisis situations impacts the processing of early warnings and subsequent decision-making. The uncertainty information provided during the simulation was used to make predictions about the time and place of a hurricane touching down. Further, uncertainty in raw data has also been considered in the optimization of gaming applications. Jagtap et al. (2023) designed an uncertainty-based decision support system, where the probability for the selection of the next move in a game increases as the uncertainty of the data is fed as input to the model.
This study was approved by the Office of Research and Ethics and the Human Research Ethics Committee of our institution and complied with all requirements established by the corresponding governmental agencies overseeing research and ethics. The objective is to assess how visualizing AI uncertainty affects individuals with different attitudes toward AI. To achieve this goal, we created an online survey and disseminated it through Amazon Mechanical Turk (MTurk),1 a crowdsourcing marketplace that allows a distributed workforce to perform virtual tasks. We made aware of the purpose of our academic research study as well as their agreement to participate with the following statement: “By clicking on the button below, you consent to participate in this study." Therefore, participants selecting to complete our online survey were consenting to participate in the study. Data was compiled between February 14, 2023 and July 10, 2023.
Prior to describing the study, we define a few key concepts that will remain consistent throughout this study:
• Decision change: a metric indicating whether a participant changes their response when presented with a different visual stimulus (e.g., visualization of uncertainty).
• Trust: refers to the perceived amount of trust in AI solutions. We define solutions as the predictions, recommendations and decisions made by AI-based systems.
• Confidence: refers to the perceived degree of confidence in decisions. Individuals with a higher degree of confidence will find decisions correct or appropriate given the available information.
We were interested in understanding the role of uncertainty visualization in decision-making from the angle of people's attitudes toward AI. As such, this study aimed to answer the following research questions:
• RQ1: Does visualization of uncertainty impact decision-making, trust, and confidence among people with different attitudes toward AI?
• RQ2: Do attitudes toward AI influence decision-making, trust in AI, and confidence in the decisions made differently?
• RQ3: How is the visualization of uncertainty perceived by people when making decisions?
To answer these questions, we developed an online survey where respondents chose the next gameplay move in one of three games (Pac-man, Minesweeper, and Soccer). Participants evaluated a total of 9 sets of gaming scenes with different levels of risk, each with and without uncertainty visualization. The order of games was randomly for each participant. Then, participants rated how visual cues support the perception of uncertainty and their overall experience with the visualization of uncertainty while making decisions. We believed that AI uncertainty information would impact people differently depending on their baseline opinions toward AI, leading to differences in decision-making and trust levels. To assess individual's opinions toward AI, we used the General Attitudes toward Artificial Intelligence Scale (GAAIS) (Schepman and Rodway, 2020). The GAAIS scale is used to measure extreme perspectives on AI systems. The original scale identifies two sub-scales: a positive scale including 20 items and a negative scale with eight items.
The survey was designed in Qualtrics2 and distributed it through MTurk. Qualtrics is a system that facilitates data collection through online surveys. The survey had four parts: (1) Study purpose and consent, (2) a pre-test survey, including demographics and questions pertaining to AI, (3) a testing session with game scenarios visualized with and without uncertainty information, and (4) a post-test questionnaire. Specifically, participants were first informed about the purpose of the study and engaged in a user study where they completed self-reported assessments. To minimize the collection of missing data, we used built-in features on Qualtrics to verify each question was answered before continuing to the next page and set exactly to one answer per question. No time limit was imposed.
We collected information about the demographics of participants (age, gender, current occupation, and level of education), perception of risk as well as their experience with the usage of AI systems and specific arcade games. We also asked questions as to their attitudes toward AI using the General Attitudes toward Artificial Intelligence Scale (GAAIS) (Schepman and Rodway, 2020). Similar to the work in (Liu et al., 2022), we used a short version of the GAAIS scale with two questions that highly correlate to each (positive and negative) attitude in the GAAIS scale and one more question, for each attitude, that is representative of the everyday use of AI. We determine the average for each category, classifying participants as having positive attitudes if their average positive score exceeds their average reversed negative score, and as having negative attitudes if it is the opposite.
Given this categorization, we can clearly distinguishing the impact of AI uncertainty on individuals who are either favorable or unfavorable toward AI. In addition, responses were recorded using a 5-point Likert scale with options in this configuration: left-to-right “strongly disagree; somewhat disagree; neutral; somewhat agree; strongly agree." Table 1 shows the questions in this questionnaire.
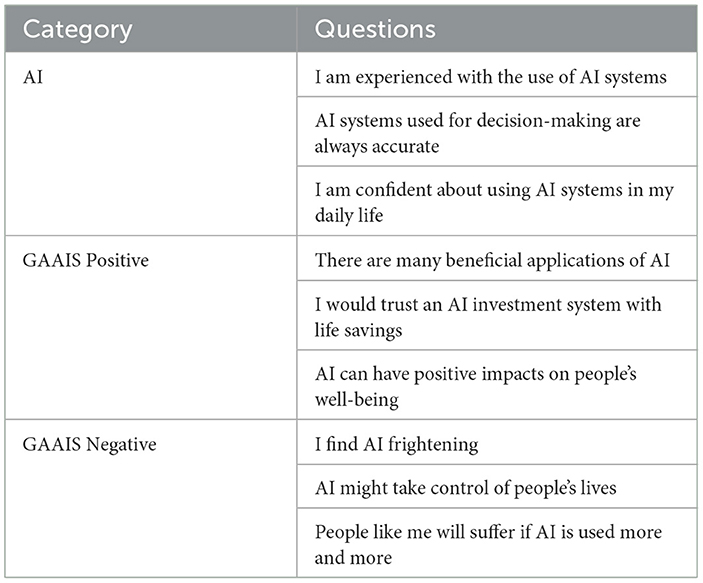
Table 1. Questions in the pre-test questionnaire.
We utilized classic games in the testing session as a proxy to show human-AI interaction in decision making. We conducted experiments involving AI-generated outputs and explored the effect of uncertainty visualization. In this setting, we measured how participants interacted with uncertainty visualizations in AI-based decision-making tasks, isolating the impact of how people perceive and process uncertainty (e.g., how they understand or react to visual cues of uncertainty) apart from how the AI makes its decisions. All gaming scenarios were constructed by humans, but we told participants that were generated by an AI-system. This design choice was motivated by previous works that aimed to control the quality of the output as a potential factor in human evaluations (Liu et al., 2022). As such, we designed gaming scenarios with situations that motivate players to survive or win the game, while considering “the game's AI" probabilities and uncertainties associated with the opponent's actions, rather than suggestions for player's next gameplay moves. As a pre-condition for establishing trust, we informed participants that predictions are as reliable as the systems typically encountered in everyday life, such as movie recommendations, traffic updates, or weather forecasts. We collected gaming experience data using a 5-point Likert scale for each game prior to participants engaging in the gaming scenarios.
Sets of gaming scenarios were configured as follows. First, participants assessed a situation within a designated gaming scenario with the AI's prediction shown in the binary format (without uncertainty information). Subsequently, participants decide their next gameplay move. After this, we presented the same gaming scene with uncertainty information visible on the screen and, based on the additional information, we recorded their next gameplay move. To illustrate uncertainty in the AI's prediction, each scenario used a specific visualization method to signal probabilities. As mentioned above, there are three main categories of visualizing data and their uncertainty: color-oriented approaches, focus-based methods, and geometric mapping (e.g., sketchiness in rendering, distorting line marks) (Boukhelifa et al., 2012). We used a mix of size, color saturation, and transparency as visual representations for uncertainty, a decision motivated by the work of (Guo et al., 2019) (see Figure 1), and conducted an in-the-wild study. We selected 3 different classic games to showcase diverse gameplay styles: Pac-Man demands quick reflexes within a dynamic setting, Minesweeper requires logical deduction, and the Soccer game requires intuitive decision-making rather than prior gaming expertise. Figure 2, shows examples of three sets of gaming scenarios (Pac-Man, Minesweeper, and Soccer).
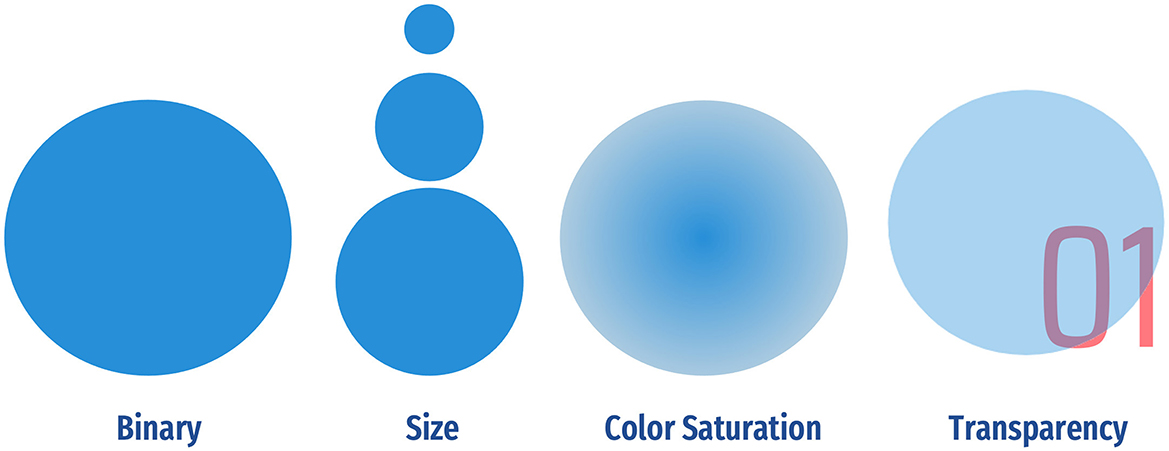
Figure 1. A binary visualization gives a model's output with only one label, number, or output. Alternatively, confidence/probability can be depicted with visuals cues (e.g., size, saturation, or transparency) in a non-binary format.
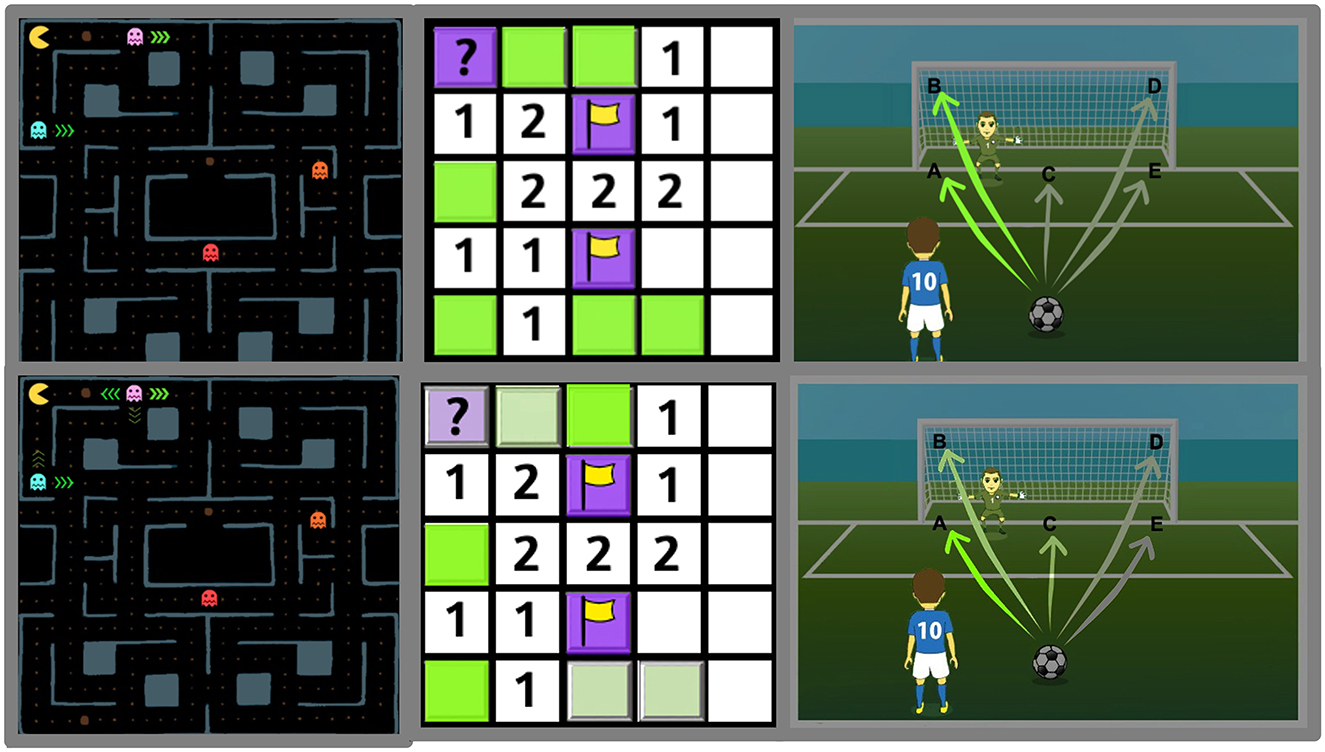
Figure 2. Examples of game scenes shown in the testing session. (Top row) We show the prediction in a binary format; (Bottom row) We convey uncertainty using different visual representations: size, color saturation, and transparency for Pac-Man, soccer game, and Minesweeper, respectively.
Pac-Man: in this game, the player controls the main character, Pac-Man. The ghosts, which try to kill Pac-Man, are controlled by the “computer." In a binary format, the AI shows the path with the highest probability for a ghost to take. Alternatively, when uncertainty is visualized, the AI presents up to four predictions, showing the range of probabilities using size as a visual cue. The thicker the arrows, the higher the probability of ghosts taking that path. We designed four sets of scenarios based on the Pac-Man game. Depending on the grid position, the player is then asked what direction Pac-Man should move in (up, down, left, right).
Minesweeper: in the Minesweeper game, the player needs to identify and avoid the location of mines, which were placed randomly on a static grid-based board. In this version, the “AI agent" suggests safe and dangerous locations. Specifically, the AI will paint the squares using colors representing the likelihood of the presence or absence of a mine. In a binary format, squares are painted with only two colors representing the probable presence (green) or absence (purple) of a mine. In the uncertainty format, transparency is used as a visual cue to identify the confidence level of said prediction. The more vivid the color is, the more confidence the agent has in its prediction. In contrast, the duller the color is, the less confident the agent is about its prediction. We constructed two sets of scenarios.
Soccer game: in the soccer game, the player is the striker and the computer controls the goalkeeper. The player must select one of the six targets (A–F) to attempt a penalty shot. Here, the “AI agent" monitors the goalkeeper's placement and movement in the net and makes predictions on where to kick the ball to have the highest chance to score. In a baseline case, images are shown with two shades of green, bright paths are more likely to score, while darker paths are less likely to score. Uncertainty is visualized with multiple shades of green. The brighter the path of the color is, the higher the chances the player will score. Here, color saturation is used as the visual cue. We designed three soccer scenarios.
After making their selection for the next gameplay move, participants are required to answer three questions related to their decision. Table 2 shows the questions and metrics used in the study: “decision change" is the action of altering a previously made decision based on a different visualization; “trust" relates to the degree of reliability one can possess toward AI systems; “confidence" is the degree of self-assurance in the decision; and “usability," which quantifies whether participants found visual cue informative while performing the task. The questions in this assessment used a 10-point scale.
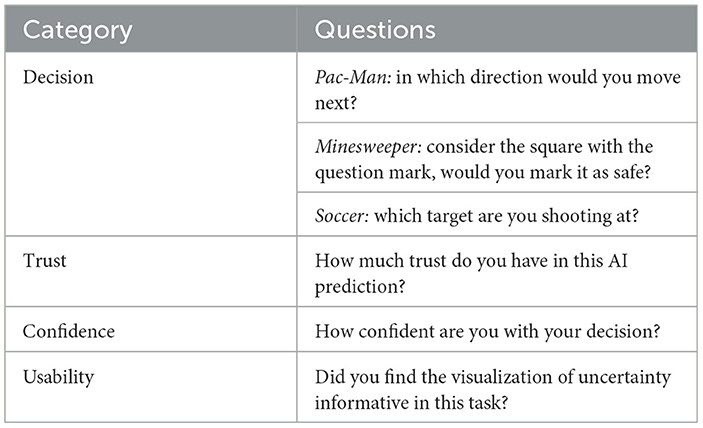
Table 2. Questions measuring decision change, trust in AI, confidence in decisions, and usability of visualization of uncertainty in the testing session.
Lastly, participants were asked about their opinions on the utility, intuition, and impression of the different visual cues. We also asked them to rank their preferred visualization method. With the aim of capturing final impressions with greater precision in the analysis of visual perceptions of AI uncertainty, we designed the questions in this part of the assessment using a 10-point scale, which were averaged to compute the final score for each of these questions. Table 3 shows the questions in the post-test questionnaire.
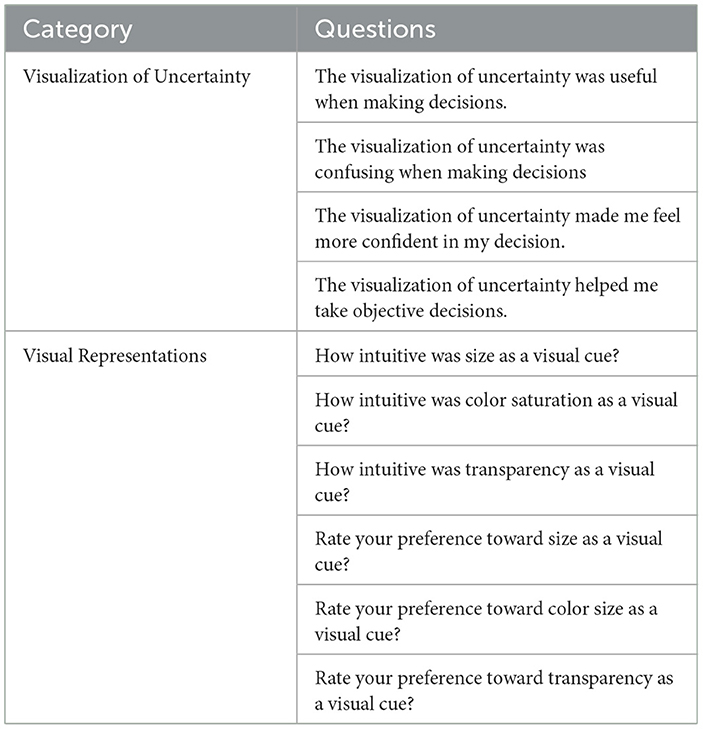
Table 3. Questions in the post-test questionnaire.
Data was compiled using Qualtrics,3 a cloud-based application that allows data collection through online surveys. For the dissemination of invitations of participation, we used our institution's mailing lists and online communication mediums, such as LinkedIn and Twitter. In addition, to get a diverse and random population of users, we recruited workers using MTurk. We paid $1.00 USD for participation after the survey completion. JASP 0.17.2.1 software4 was used to build contingency tables, measure relative frequencies, and report statistical analyses in this study.
We collected data from 277 participants across the United States, Canada, Mexico, Australia, Turkey, Thailand, France, Poland, Norway, Germany and the United Kingdom. To ensure data quality, we removed responses from 86 MTurk participants because they did not pass our validation checkpoints, suggesting that their responses could not be trusted. These checkpoints consisted of age verification according to the provided birth year and visual attention checks located at different points in the survey. An example of a visual attention checkpoint is the scenario where the Pac-Man is surrounded by ghosts with only one way to escape. We also removed 36 records as these did not meet the minimum completion time of 9 minutes, a threshold we set to exclude possible responses lacking careful consideration. Lastly, we removed eight responses with missing values. In total, we analyzed responses from 147 participants, including 93 from MTurk and 54 from other sources. We analyzed participants' general characteristics using frequency analysis and descriptive statistics. Table 4 summarizes the demographics of the participants.
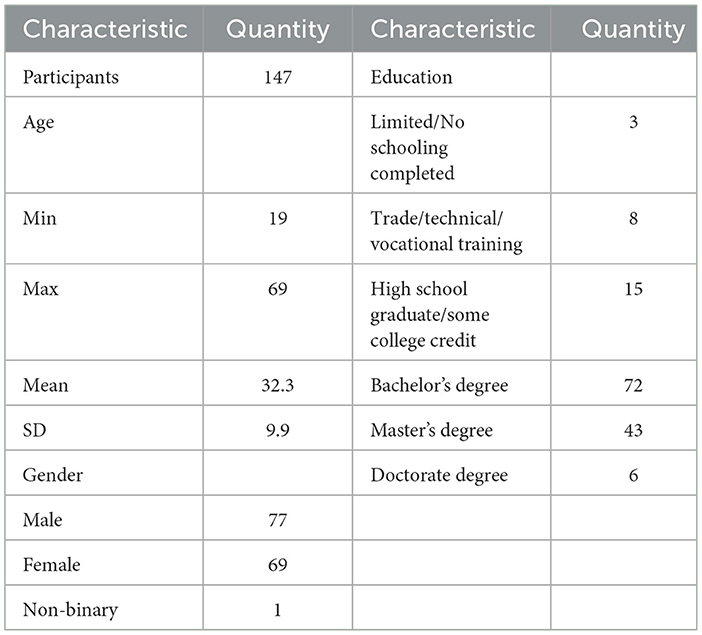
Table 4. Demographics of participants included in the study.
look at decision change, we computed a binary adjustment score that indicates when a person made a change in their decisions in more than half of the scenarios. With this information, we create a contingency table that allows us to quantify and compare participant's who changed or did not change their decisions among attitudes toward AI.
Table 5 shows that 71% of participants hold a positive attitude toward AI (n = 104) and 29% a negative attitude toward AI (n = 43). Also, we noticed that 33% of all participants (n = 48) adjusted their responses after seeing the uncertainty of the AI prediction, among these 21% with a negative GAAIS attitude (n = 10) and 78% a positive GAAIS attitude (n = 38). This tendency was expected as it was believed that the majority of people with a positive attitude toward AI would adhere to the AI model's recommendation, even in the absence of supplementary information. To measure the statistical significance of our findings, we analyze the observed frequencies of our binary data and perform a chi-square (χ2) test. No significant associations were found between participant's attitude toward AI and decision change [χ2(1) = 2.441, p = 0.118].
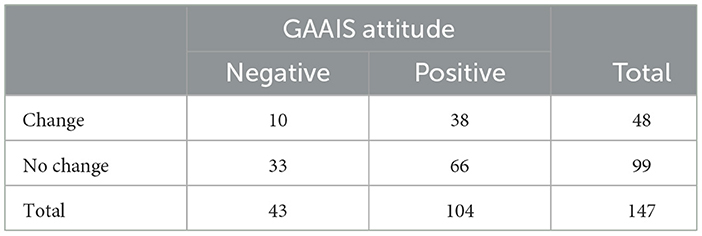
Table 5. Shows the number of people, for each of the examined attitudes, who changed or not their decisions as a response of the visual uncertainty of the AI predictions.
Figure 3 summarizes the impact of the different types of visualization in decision change. Generally, we observe that size and transparency are the visual methods representing AI uncertainty with small number of changes in decisions, 24% and 11% decision change rate respectively, compared to 56% found when the method used was color saturation. Figure 3 (left) shows that 27% individuals with a positive GAAIS attitude and 16% with a negative GAAIS attitude changed their responses with size as the visual cue. Figure 3 (middle) presents higher rates of decision change with color saturation among people with positive attitude toward AI (58%) and individuals with negative attitude toward AI (51%). With Figure 3 (right), we can observe that 13% of participants with positive GAAIS attitude updated their responses and only 5% of the individuals with negative GAAIS attitude also changed their responses after seen the uncertainty with the transparency method. A (χ2) test showed no significant association between size and decision change, [χ2 (1) = 1.359, p = 0.243], between color saturation and decision change [χ2 (1) = 0.294, p = 0.587] and between transparency and decision change [χ2 (1) = 1.611, p = 0.204]. Despite the trend in our results, we did not observe a statistical relationship between the types of representations of uncertainty and changes in decisions among individuals with different opinions toward AI.
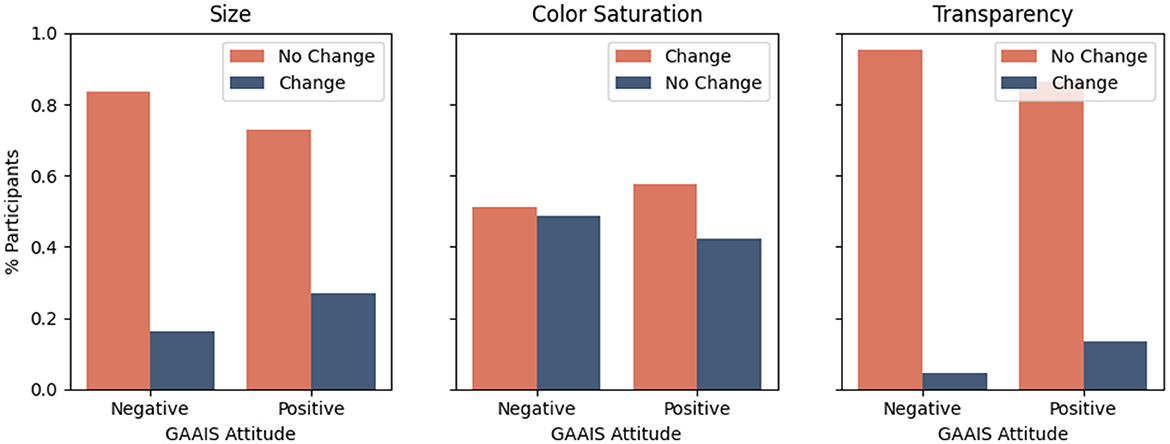
Figure 3. Illustrates the impact of the different types of visualization in decision change among GAAIS attitudes.
To evaluate trust in AI, we compute a trust score, which quantifies the impact strength of trust in AI for each participant based on the average differences observed between the pre- and post-uncertainty conditions.
A contingency table (not shown here) revealed that trust in AI increased for 48% of participants (n = 70) and decrease for 52% of participants (n = 77). Among those whose trust in AI increased, 36% had a negative attitude toward AI, while 64% had a positive attitude. For participants whose trust in AI decreased, 23% held a negative attitude (n = 18), and 77% had a positive attitude toward AI (n = 59). We also compared trust strengths within groups of GAAIS attitudes. Figure 4 (left) demonstrates the impact of visualizing the uncertainty of predictions on trust in AI for each GAAIS attitude. Interestingly, we observe a more prominent impact in trust among those negatively inclined toward AI (M= 0.39, Mdn = 0.33, SD = 0.76) compared to participants with a positive GAAIS attitude (M = 0.05, Mdn = 0.0, SD = 0.56). A Welch two-samples t-test showed that trust in AI was significantly reinforced among participants with a negative GAAIS attitude than those with a positive GAAIS attitude, t(61.291) = 2.651, p < 0.01. Cohen′s d(0.51).
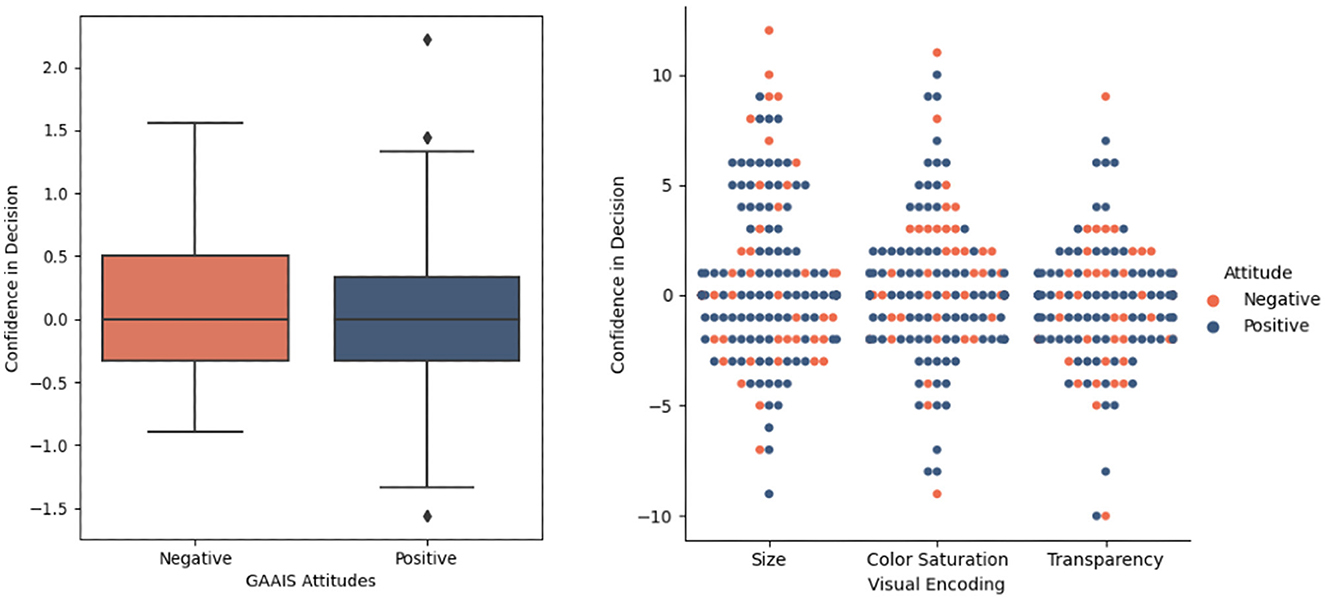
Figure 4. Illustrates the impact of visualization of uncertainty on trust in AI according to GAAIS attitudes (left). We show the impact of the different visual cues of uncertainty on participant's trust in AI (right).
To complement these findings, we further explore the impact of the different visual representations of uncertainty (e.g. size, color saturation, and transparency) on participant's trust in AI. Each point in Figure 4 (right) represents a participant color-coded according to their GAAIS attitude. The point's position indicates whether trust in AI increased (above zero) or not and the magnitude of this change. We observed a greater impact in trust in AI among individuals with a negative GAAIS attitude when size (M = 1.00, Mdn = 0.00, SD = 3.472) and color saturation (M = 0.374, Mdn = 0.00, SD = 3.046) are used as visual representations, compared to transparency (M = –0.020, Mdn = 0.00, SD = 2.696). An independent one-way ANOVA found a statistically significant main effect, . Post-hoc testing using Sheffe's correction revealed that size resulted in a greater impact compared to transparency (p < 0.05). However, there were no significant main effects between color saturation and either size (p = 0.630) or transparency (p = 0.193).
We conclude that using size as an indicator of the uncertainty in AI predictions, significantly impacts trust in AI, particularly among participants with a negative attitude toward GAAIS.
We quantified the number of individuals whose confidence in their decisions changed. We observed that 44% of participants (n = 65) experienced an increase in confidence when the AI agent's uncertainty was displayed, while 56% (n = 82) saw a decrease in confidence. Among those whose confidence increased, 68% (n = 44) had a positive attitude toward AI, while 32% (n = 21) had a negative attitude toward AI. Alternatively, among the participants whose confidence in their decisions decreased, 73% (n = 60) had a positive attitude toward AI, while 27% (n = 22) had a negative attitude. Further, Figure 5 (left) illustrates the overall strength of confidence levels in participant's decisions when uncertainty is visualized. We notice a subtle difference between the means of confidence and GAAIS attitudes, where confidence in decisions has a larger impact on participants with negative attitudes toward AI (M = 0.12, Mdn = 0.0, SD = 0.59) than in the other group (M = 0.03, Mdn = 0.0, SD = 0.65). A Mann–Whitney U-test was used to evaluate the significance of our findings. The results of the statistical analysis suggest that there is no significant differences between the means of the compared groups, U = 2392.5, p = 0.505.
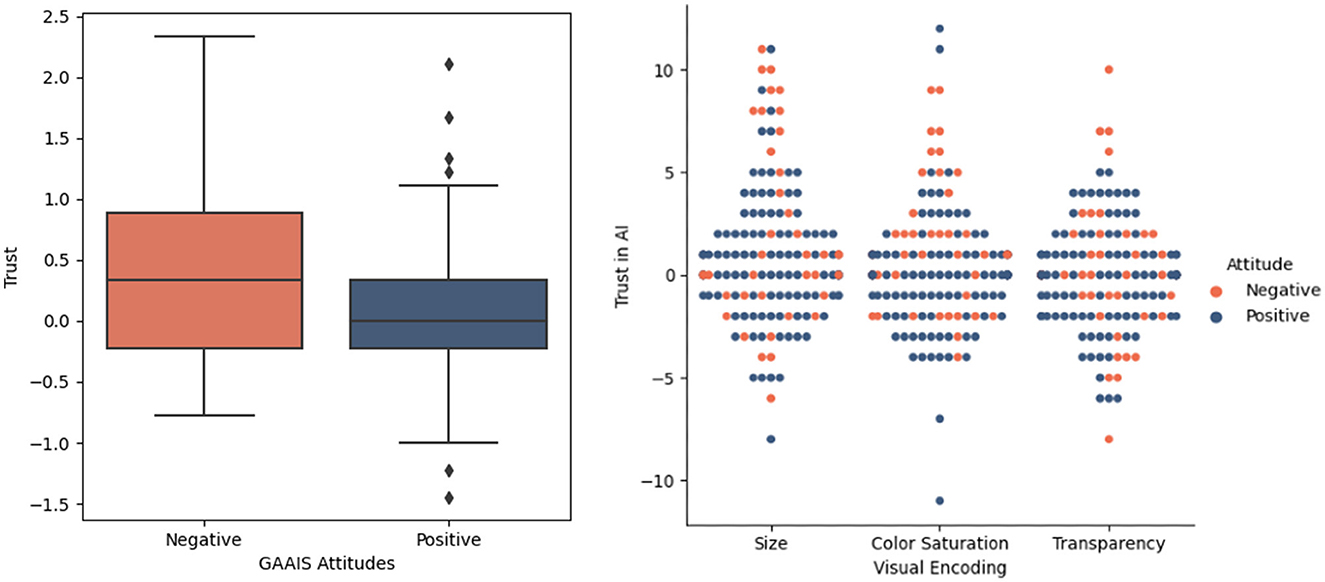
Figure 5. Shows the effect of uncertainty visualization on individuals' decision-making confidence, as influenced by GAAIS attitudes (left). We also show how various uncertainty visual cues affect participant's confidence in their decisions (right).
Alternatively, we investigate the impact of the different types of visualization in confidence in people's decisions. Figure 5 (right) distinguishes differences across visual representations. We observe that confidence in decisions grows weaker (below zero) among participants, regardless of their attitudes toward AI. Specifically, we observe stronger confidence in decisions with size (M = 0.639, Mdn = 0.0, SD = 3.705), and color saturation (M = 0.279, Mdn = 0.0, SD = 3.201), compared to transparency (M = –0.401, Mdn = 0.0, SD = 2.640). An independent one-way ANOVA found a statistically significant main effect []. Post hoc testing using Sheffe's correction revealed that representations with size resulted in significantly greater impact compared to transparency (p < 0.05). However, no significant differences in the strength of confidence in decision were observed between color saturation and either size (p = 0.630) or transparency (p = 0.193).
We conclude that fluctuations in confidence in decisions may be due to different factors rather than the individual's attitudes toward AI. We suspect that gaming experience may have caused the changes in confidence perceived, however this needs to be further explored. Interestingly, we found that certain visual representations of AI uncertainty can lead to more confidence in people's decisions, as we observe that significant stronger decisions were perceived when the uncertainty was represented with size.
Inspired by the experimental design in Liu et al. (2022), we constructed two separate regression models and evaluate each of the following dependent variables: changes in decisions, trust in AI and confidence in participant's decisions. The baseline model includes only demographic aspects (e.g. age, education, and gender). Model 2 introduces two supplementary factor, the GAAIS score and gaming experience. We compute the GAAIS score as the average positive and negative (reverse-coded) GAAIS attitudes and gaming experience was obtained from the pre-test questionnaire.
Table 6 shows the results of the two logistic regression models assessing the effects of GAAIS and gaming experience scores on the likelihood that participants have a change in decisions. For Model 1, the logistic regression was not statistically significant, χ2(143) = 4.444, p = 0.931. However, Model 2 shows to be statistically significant, χ2(141) = 14.313, p < 0.05. It was also found that holding all other predictor variables constant, the odds of change in decision is higher (odds ratio = 1.859, p < 0.01) for those with more gaming experience when uncertainty is available. These results confirm our previous findings about the lack of association between GAAIS attitudes and changes in decisions. More importantly, they highlight a strong association between gaming experience and decision change.
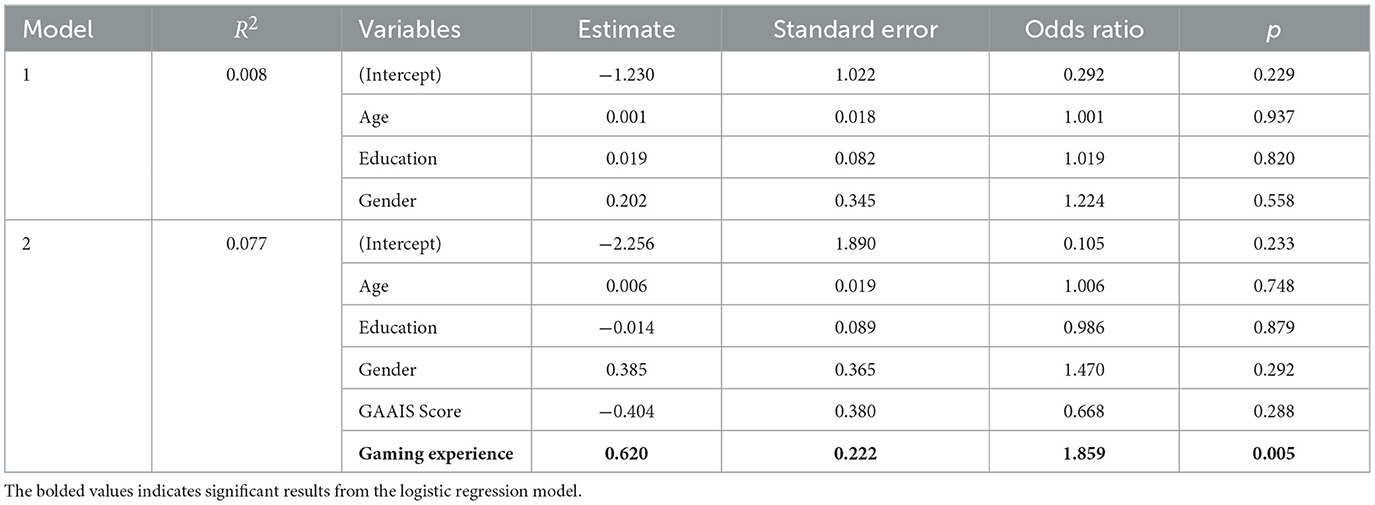
Table 6. Coefficients table from two logistic regression models predicting changes in decision after the uncertainty is visualized.
Table 7 provides the results of the regression models predicting trust in AI. Model 1, was not statistically significant χ2(143) = 1.172, p = 0.760. On the contrary, Model 2 was statistically significant χ2(141) = 12.289, p < 0.05. It was also found that holding all other predictor variables constant, the odds of trust in AI predictions when uncertainty is available was 37% higher (odds ratio = 2.023, p < 0.01) for those with strong overall positive opinions toward AI (agree or strongly agree to the positive items and disagree or strongly disagree to the negative items in the GAAIS scale questions). We conclude that there exists a significant relationship between GAAIS scores, which is positively correlated to the increases of perceived trust in AI.
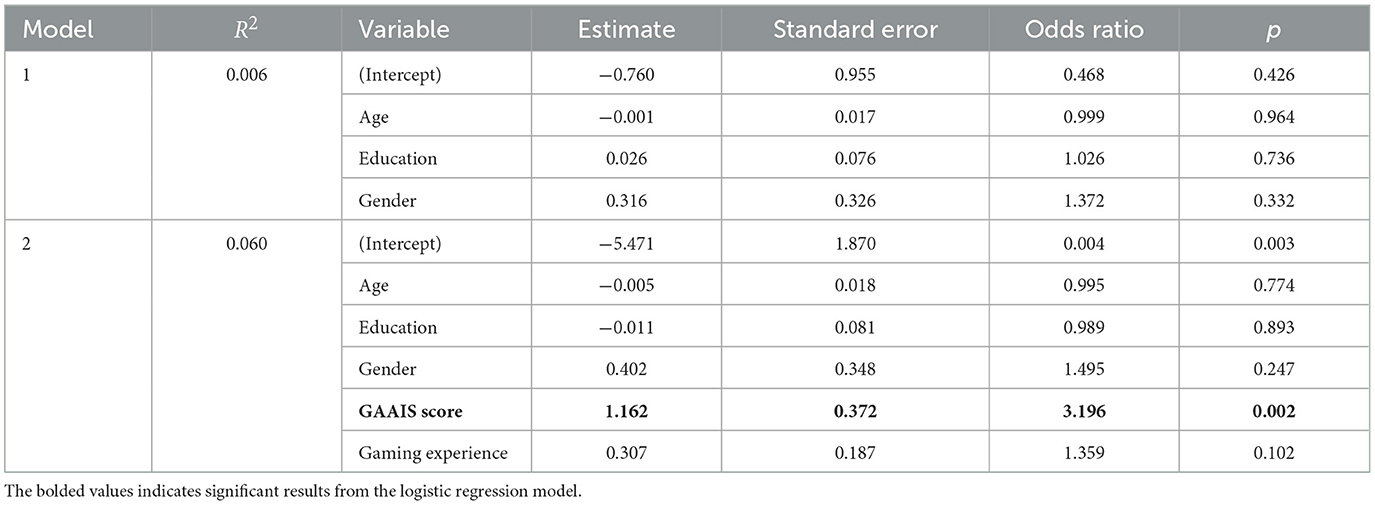
Table 7. Coefficients table showing the results of the logistic regression models predicting trust in AI as a result of the uncertainty visualized.
The results of the logistic regression models predicting confidence in participant's decisions (not shown here) found no significant associations between the variables under investigation in either model. Model 1, χ2(143) = 3.659, p = 0.301, and Model 2, χ2(141) = 7.362, p = 0.195. This absence of correlation suggests that the neither gaming experience nor GAAIS attitudes exhibit a relationship with the apparent trend in people's confidence in decisions.
To assess how AI uncertainty is perceived among individuals with different attitudes toward AI, we created a utility score based on the post-test questionnaire. This score includes the perception of uncertainty as useful, confusing (reverse-coded), and supportive of both objective and confident decisions.
Figure 6 presents the impact of the perceived utility of AI uncertainty among participants. We notice a lower perceived utility for the visualization of uncertainty in participants with a positive attitude toward AI (M = 6.91, Mdn = 6.875, SD = 1.10) compared to those with a negative attitude toward AI (M = 7.25, Mdn = 7.25, SD = 1.36). A Mann–Whitney U-test showed that participants with negative GAAIS attitudes perceive the visualization of uncertainty statistically with greater utility (M = 7.372, Mdn = 8.0, SD = 2.65) than people with a positive GAAIS attitude (M = 5.09, Mdn = 5.00, SD = 2.56), U = 3302.5, p < 0.001. Therefore, we conclude that the visualization of uncertainty in AI's predictions can be of greater utility to people with negative GAAIS attitude.
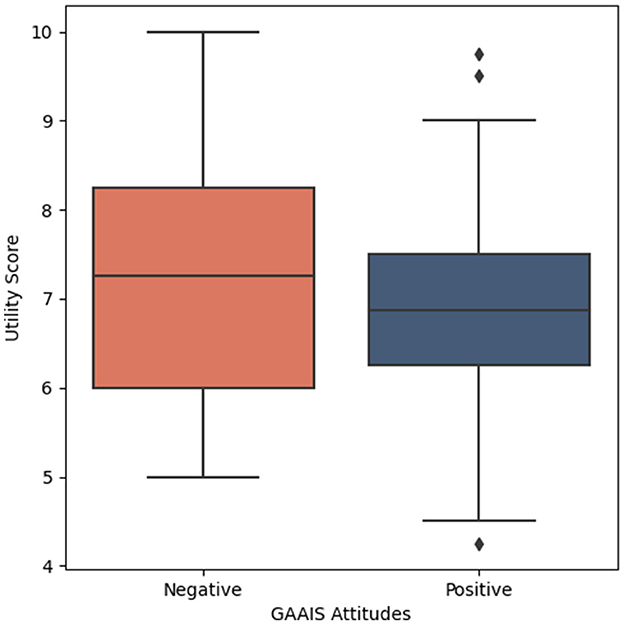
Figure 6. Box plot illustrating the average utility score of participants after seen the uncertainty of the model. This score considers how the uncertainty is perceived as useful, confusing (reverse-coded), and supportive of both objective and confident decisions.
Further, we assessed the perceived value of the different visualization techniques. Table 8 presents our findings based on intuition, preference, and the amount of information perceived given the different GAAIS attitudes. We found that color saturation yielded higher intuition and preference; this is followed by transparency and size. We also observe that participants can perceive more information with size, followed by transparency.
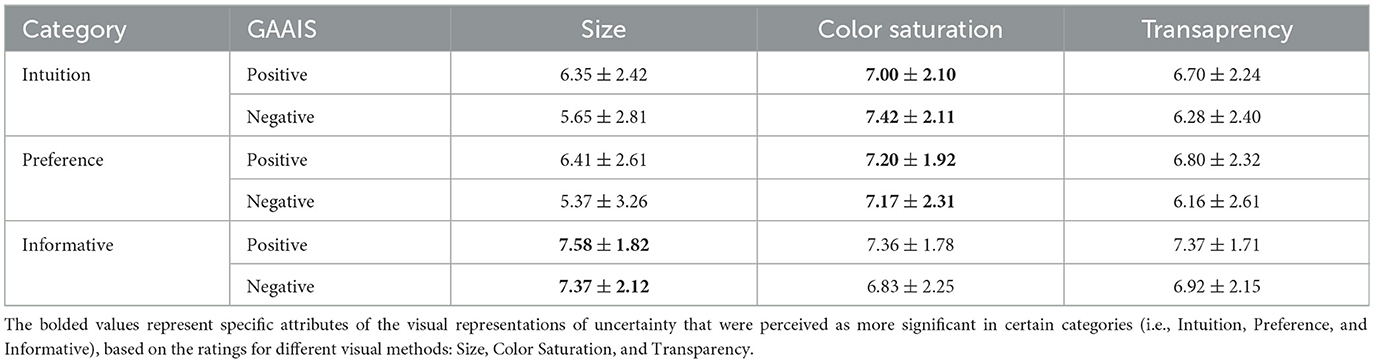
Table 8. Shows how intuitive the different representations of uncertainty were perceived.
We ran three two-way independent ANOVA tests, one for each factor measured. For intuition, we found a significant main effect for the specific visual representation of uncertainty []. No significant difference was found for GAAIS attitudes, or significant interaction between GAAIS attitudes and visual representations. Scheffe's post hoc correction revealed that intuition was significantly higher in the representation of uncertainty with color saturation compared to size (t = 4.059, p < 0.001). Post hoc testing shows no significant difference between transparency and either color saturation or size.
For preference of representations of uncertainty, there were significant main effects for both GAAIS attitudes [] and the types of visual representations of uncertainty []. No significant significant interaction were found between GAAIS attitudes and visual representations. Post hoc testing with Scheffe's correction revealed a statistically significant difference between individuals with positive and negative GAAIS attitudes (t = −2.298, p < 0.05) as well as significant differences between using color saturation and size to represent uncertainty (t = 4.044, p < 0.001). Post hoc testing shows no significant difference between transparency and either color saturation or size.
Lastly, we assessed the level of information perceived with different representations of uncertainty and found a significant main effect for GAAIS Attitude []. No significant difference was found for visual representations, or significant interactions between GAAIS attitudes and visual representations. Scheffe's post hoc correction showed the perceived level of information to be significantly higher for individuals with a positive attitude toward AI compared to those with a negative attitude (t = −1.989, p < 0.05).
This paper investigates human responses to algorithmic advice throughout the decision-making process in classic games, offering insights into how the visual representation of uncertainty impacts decision-making, trust in AI, and confidence in decisions among individuals with different attitudes toward AI. We demonstrated that the consideration of human factors into the representation of AI outputs impacts trust of people differently, but also leads to different outcomes depending on their experience. These findings motivate designers of decision-making systems to communicate AI decision information to users (via visualization of uncertainty) and explore effective visual representations that may bring higher impact to perception and cognition. These efforts will result in AI systems and agents that are not only trustworthy but useful.
To highlight the importance of visualizing uncertainty in human-AI collaboration, a few studies have investigated the effects of uncertainty in games and simulations (Schueller et al., 2020; Jagtap et al., 2023) and the humanistic factors that enable the utility and adoption of AI-based technologies (Araujo et al., 2020; Guo et al., 2019; Cai et al., 2019; Kwak et al., 2022). Our paper expands this line of research by examining participants' attitudes toward uncertainty in AI and its impact on the decision-making process. We utilize classic games as a tool to assess the impact of the visual perception of the uncertainty of AI outputs into decision change, trust and confidence in decisions, using simple techniques such as size, color saturation and transparency. Table 9 summarizes the findings of our study in relation to our research questions.
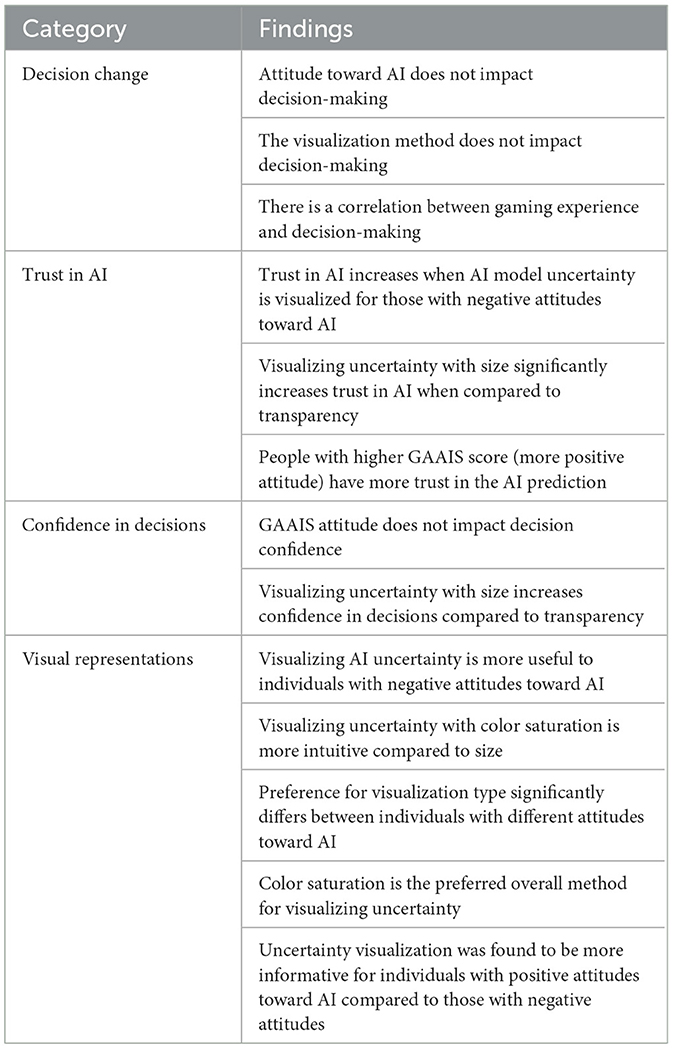
Table 9. Summary of our findings.
According to our findings, the visualization of uncertainty has a noticeable impact on decision-making, leading at least one-fourth of people in each group, regardless of their attitudes toward AI, to make a change. In general, up to 33% of all participants re-evaluated their choices based on the different visual representations. However, with the observed data, we could not verify a significant relationship between these decision changes and individuals' opinions toward AI. The visualization of uncertainty had a significant impact on people's trust in AI. We observed a significant higher impact in trust in AI among people with negative attitude toward AI relative to those with positive attitude toward AI, when size was used to show AI uncertainty. We also observed an apparent impact on confidence in decisions among people with different attitudes toward AI, but could not confirmed a significant effect. Instead, further analysis revealed that significantly more confident decisions can be made when AI uncertainty is represented by size.
Another important finding in our study is the identification of the factors that impact decision-making and trust in AI. We utilized logistic regression algorithms to explore the correlation between demographic information, GAAIS attitudes and gaming experience and each of the variables of interest. Our results indicate that gaming experience is a significant predictor variable for decision change. Increasing gaming experience was positively associated with an increase in decision change when uncertainty is visualized. This suggests that people with higher gaming skills are able to combine the visual information produced by the AI agent and their gaming experience to better recognize behavior patterns in the explored domain and make informed decisions. Alternatively, we observed how personal traits (GAAIS attitudes) influence the way trust can be perceived when the uncertainty in AI predictions is evaluated. We found that high levels of positive opinions toward AI were associated with an increase in trust in AI predictions. These findings are reinforced by the idea that trust in human information interaction is influenced by individual characteristics such as memories, assumptions, perceptions, and heuristics of the trusting individuals (first pillar of trust) (Fell et al., 2020).
Based on feedback regarding the usability of AI's uncertainty representations in decision-making, we found that visual elements were considered helpful by many, particularly those with a negative GAAIS attitude. We discovered that 31% of participants with a negative GAAIS attitude found uncertainty visualization more useful, relative to the groups of people with positive GAAIS attitude. In addition, we examined the perceived value of different visual method to represent uncertainty based on intuition, preference and the amount of information provided. We found that color saturation was the most significantly intuitive and preferred approach, while size was perceived as providing the most information about the degree of uncertainty. We believe that the high percentages of utility observed in the study reflects both the potential of representing uncertainty of AI solutions and people's appreciation of the additional information in their decision-making. This motivates us to perform more in-depth explorations of this research within a specialized domain, where both the scenarios and decisions involve higher risk and complexity.
A limitation of our work is the use of static gaming scenarios as toy experiments. Since, the visual recommendations presented across these gaming scenarios were not generated by AI, a proper calibration of the uncertainty could not be estimated. Despite this, this design choice still allowed us to identify subtle differences between user's perceptions of AI's uncertainty and its effects in decision making. As such, the aforementioned implications might be somewhat limited due to the lack of AI and future research using well-calibrated uncertainty estimates is deemed.
The presence of potential confounders (e.g., prior exposure to AI, individual risk tolerance) is another limitation that may not have been fully controlled in our study. We recognize that these factors could influence participants' responses to the AI's uncertainty visualization. To address this, we collected background information on participants' familiarity with AI, including their general attitudes toward it and past experiences with AI-based systems. While we did not directly measure individual risk tolerance, we acknowledge its significance in decision-making, especially in contexts involving uncertainty. In future research, we aim to incorporate a more direct measure of risk tolerance and more thoroughly control for prior exposure to AI.
We may have unintentionally established a baseline for trust in AI by suggesting that AI recommendations are as reliable as those with which participants are already familiar. We acknowledge that trust in AI is a complex and multifaceted issue, and our study provides only a limited exploration of this topic. Participants' prior experiences with similar types of predictions could influence their trust in AI, particularly if they have had negative experiences, leading to skepticism or distrust of the AI's output. Conversely, participants with positive prior experiences with AI might find such visualizations less useful in a gaming context, though they could be more relevant in more sensitive settings, such as healthcare or finance. Our intention in referencing familiar examples like movie recommendations and weather forecasts was to make the concept AI recommendations and decision support systems more relatable to participants, drawing on their everyday experiences with technology, and to explore how this might impact their trust in the AI within the context of our study.
We acknowledge that psychological and perceptual factors can significantly impact participants' interaction with uncertainty visualizations in decision-making tasks. Since the study was conducted online, various environmental and personal factors could have influenced participants' perception and overall experience, including differences in display quality (e.g., screen size, resolution, brightness) and ambient lighting conditions. Additionally, individual differences in task comprehension, such as prior gaming experience, may also affect how uncertainty visualizations are processed. In light of these considerations, we acknowledge that variations in participant performance could be due to differences in cognitive processing, visual impairments, or other perceptual factors, including neurodiversity. For example, individuals with color blindness may have difficulty interpreting certain color-based visual cues, which could affect their understanding of uncertainty visualizations. To address these potential issues, future studies could conduct experiments in more controlled environments with standardized display conditions, assess task comprehension before participation, and incorporate alternative cues (such as different color combinations, audio, or animations) to ensure that uncertainty is communicated effectively to all individuals, regardless of visual or cognitive differences. This would help mitigate the risk of these factors confounding the results and ensure the inclusivity of the findings for a diverse range of participants.
Another potential limitation of the current study is the use of MTurk as the platform for participant recruitment. Previous research emphasizes the need to carefully evaluate the reliability and quality of data obtained through crowdsourcing platforms. For example, Hauser et al. (2019) caution that MTurk workers may not always devote adequate effort to answering questions, potentially leading to biased or deceptive responses. To address these concerns, we included validation checkpoints at various points throughout the online survey to ensure participants were engaged. As a result, we excluded 86 participants who did not meet the attention criteria. Additionally, to minimize bias related to language comprehension and potential deception, we incorporated open-ended questions at these checkpoints, asking participants to repeat specific information across the survey. This allowed us to screen responses for both comprehension and consistency. Other recent studies, such as in Moss et al. (2023) have also raised ethical issues regarding the possible exploitation of MTurk workers. While these concerns are important, there is limited empirical evidence to support widespread claims of abuse. In our study, we made sure to inform participants about the estimated time required to complete the survey and the compensation offered, allowing them to make an informed decision about their participation.
We also recognize that this study was not specifically designed to examine the misapplication of trust, although we agree that this is an important area for future research. Our findings suggest that a generally favorable perception of AI may predispose individuals to rely on AI recommendations without critically assessing the information provided. This tendency, while indicative of trust, raises concerns about over-reliance or blind trust in AI systems, particularly in scenarios where AI recommendations might be flawed or incomplete.
Lastly, we acknowledge that both the sample size and the diverse backgrounds of participants could be viewed as potential limitations of the study. While the sample size may not be as large as those in some other studies (e.g., Zhang et al., 2021b, n = 3,423; Höddinghaus et al., 2021, n = 333; Takagi et al., 2024, n = 284), it was adequate for capturing trends and providing meaningful insights within the scope of this research. Moreover, our participant count is consistent with prior studies examining factors influencing perceived trust in AI, such as the studies of Liu et al. (2022) (n = 147), Arif (2023) (n = 38), Lee and Rich (2021) (n = 187), and Okamura and Yamada (2020) (n = 116), demonstrating that the sample size was sufficient to yield substantial statistical results. In terms of effect size, our analysis of trust in AI showed a Cohen's d value of 0.51, indicating a medium effect. Additionally, based on Sue (2007), our margin of error is 8.08% for a 95% confidence interval (or 6.75% for a 90% confidence interval), further supporting the robustness of our findings.
These findings have multiple implications for AI designers. First, considering human factors, such as visual perception, to communicate the uncertainty of AI predictions can offer individuals more transparent and informative feedback. This encourages informed decision-making throughout their tasks. For example, this may be of particular relevance to serious and health games. AI designers should pay attention to determine what visual representations maximize the impact in the decision-making process and whether or not a combination of visual representations is necessary to achieve a similar effect. Further, designers can leverage the effectiveness of visualization of uncertainty among the different attitudes toward AI to create unique experiences that encourage engagement and satisfaction. For those individuals with positive attitudes toward AI, the use of visual representations to show the uncertainty associate with the AI prediction can increment trust levels. This is important in health-oriented applications. A person can be persuaded to change their exercise habits to reach their wellness goals given a range of possible outcomes and a confidence level accompanying AI's suggestions. On the other hand, to accommodate people who hold negative attitudes toward AI, designers may need to incorporate additional features to alleviate any skepticism. Lastly, the strong association observed between gaming experience and decision changes highlights the importance of presenting the optimal level of uncertainty to people with different skills levels. By doing this, designers can leverage the adaptive capabilities of AI-based systems to enhance individual's experiences for both expert and non-expert.
It is also important to note that we do not endorse a specific type of visualization technique for communicating uncertainty nor do we intend to convince participants or users to place their trust in AI. Instead, this paper encourages the evaluation of visual factors into the design of AI systems to alleviate the challenge of reasoning with uncertainty. Moreover, the findings from this study provide evidence of the impact of uncertainty visualization on decision-making in everyday situations, highlighting how even low-risk scenarios can influence trust and confidence. While we acknowledge that the risks and decisions in our study are less complex than those encountered in sensitive domains, where decisions are more intricate and the direct application may not be straightforward, we hypothesize that fluctuations in decision-making, trust, and confidence observed in low-risk contexts will likely be even more pronounced in high-risk, complex decisions. In our study, a binary approach was used to simplify the analysis and focus on broad patterns of trust. However, future research could delve deeper into more granular measures of trust, such as domain-specific assessments, such as Mayer et al.'s (1995) dimensions of trust or condition-level evaluations, such as Ashoori and Weisz (2019), to better capture how trust in AI varies depending on attitudes, areas of application, and levels of skepticism across different contexts.
The datasets analyzed for this study can be found in the Applied Perception Lab's repository https://github.com/AppliedPerceptionLab/AIUncertaintyGaming.git.
The studies involving humans were approved by Concordia University Human Research Ethics Committee. The studies were conducted in accordance with the local legislation and institutional requirements. The participants provided their written informed consent to participate in this study. Written informed consent was obtained from the individual(s) for the publication of any potentially identifiable images or data included in this article.
JR: Conceptualization, Data curation, Formal analysis, Investigation, Methodology, Project administration, Validation, Visualization, Writing – original draft, Writing – review & editing. AB: Conceptualization, Validation, Writing – review & editing. MK-O: Conceptualization, Funding acquisition, Project administration, Supervision, Validation, Writing – review & editing.
The author(s) declare financial support was received for the research, authorship, and/or publication of this article. This research was funded through NSERC Discovery Grant RGPIN-2017-06722.
We thank Dominik Ludera for his invaluable contributions to our paper.
The authors declare that the research was conducted in the absence of any commercial or financial relationships that could be construed as a potential conflict of interest.
All claims expressed in this article are solely those of the authors and do not necessarily represent those of their affiliated organizations, or those of the publisher, the editors and the reviewers. Any product that may be evaluated in this article, or claim that may be made by its manufacturer, is not guaranteed or endorsed by the publisher.
1. ^Amazon.com, Inc. Bellevue, Washington, United States.
Abras, C., Maloney-Krichmar, D., and Preece, J. (2004). “User-centered design,” in Encyclopedia of Human-Computer Interaction, Vol. 37, ed. W. Bainbridge (Thousand Oaks, CA: Sage Publications), 445–456.
Afroogh, S., Akbari, A., Malone, E., Kargar, M., and Alambeigi, H. (2024). Trust in AI: progress, challenges, and future directions. Humanit. Soc. Sci. Commun. 11, 1–30. doi: 10.1057/s41599-024-04044-8
Araujo, T., Helberger, N., Kruikemeier, S., and De Vreese, C. H. (2020). In AI we trust? Perceptions about automated decision-making by artificial intelligence. AI Soc. 35, 611–623. doi: 10.1007/s00146-019-00931-w
Arif, A. (2023). Investigating students' attitudes & trust in AI during covid-19. J. Stud. Res. 12:5015. doi: 10.47611/jsrhs.v12i3.5015
Ashoori, M., and Weisz, J. D. (2019). In AI we trust? Factors that influence trustworthiness of AI-infused decision-making processes. arXiv [Preprint] arXiv:1912.02675. doi: 10.48550/arXiv.1912.02675
Bellaiche, L., Shahi, R., Turpin, M. H., Ragnhildstveit, A., Sprockett, S., Barr, N., et al. (2023). Humans versus AI: whether and why we prefer human-created compared to AI-created artwork. Cogn. Res. Princ. Implic. 8, 1–22. doi: 10.1186/s41235-023-00499-6
Borland, D., Ii (2007). Rainbow color map (still) considered harmful. IEEE Comput. Graph. Appl. 27, 14–17. doi: 10.1109/MCG.2007.323435
Boukhelifa, N., Bezerianos, A., Isenberg, T., and Fekete, J.-D. (2012). Evaluating sketchiness as a visual variable for the depiction of qualitative uncertainty. IEEE Trans. Vis. Comput. Graph. 18, 2769–2778. doi: 10.1109/TVCG.2012.220
Breslow, L. A., Ratwani, R. M., and Trafton, J. G. (2009). Cognitive models of the influence of color scale on data visualization tasks. Hum. Factors 51, 321–338. doi: 10.1177/0018720809338286
Cai, C. J., Reif, E., Hegde, N., Hipp, J., Kim, B., Smilkov, D., et al. (2019). “Human-centered tools for coping with imperfect algorithms during medical decision-making,” in Proceedings of the 2019 CHI conference on human factors in computing systems (New York, NY: ACM), 1–14. doi: 10.1145/3290605.3300234
Cassenti, D. N., Kaplan, L. M., and Roy, A. (2023). “Representing uncertainty information from AI for human understanding,” in Proceedings of the Human Factors and Ergonomics Society Annual Meeting, Vol. 67 (Los Angeles, CA: SAGE Publications Sage CA), 177–182. doi: 10.1177/21695067231193649
Daradkeh, M., and Abul-Huda, B. (2017). “Incorporating uncertainty into decision-making: an information visualisation approach,” in Decision Support Systems VII. Data, Information and Knowledge Visualization in Decision Support Systems: Third International Conference, ICDSST 2017, Namur, Belgium, May 29-31, 2017, Proceedings 3 (Cham: Springer), 74–87. doi: 10.1007/978-3-319-57487-5_6
Doula, A., Schmidt, L., Mühlhäuser, M., and Guinea, A. S. (2022). “Visualization of machine learning uncertainty in AR-based see-through applications,” in 2022 IEEE International Conference on Artificial Intelligence and Virtual Reality (AIVR) (IEEE), 109–113. doi: 10.1109/AIVR56993.2022.00022
Fell, L., Gibson, A., Bruza, P., and Hoyte, P. (2020). “Human information interaction and the cognitive predicting theory of trust,” in Proceedings of the 2020 conference on human information interaction and retrieval (New York, NY: ACM), 145–152. doi: 10.1145/3343413.3377981
Greis, M., Agroudy, P. E., Schuff, H., Machulla, T., and Schmidt, A. (2016). “Decision-making under uncertainty: how the amount of presented uncertainty influences user behavior,” in Proceedings of the 9th Nordic Conference on Human-Computer Interaction (New York, NY: ACM), 1–4. doi: 10.1145/2971485.2971535
Guo, S., Du, F., Malik, S., Koh, E., Kim, S., Liu, Z., et al. (2019). “Visualizing uncertainty and alternatives in event sequence predictions,” in Proceedings of the 2019 CHI Conference on Human Factors in Computing Systems (New York, NY: ACM), 1–12. doi: 10.1145/3290605.3300803
Gurney, N., Pynadath, D. V., and Wang, N. (2022). “Measuring and predicting human trust in recommendations from an AI teammate,” in International Conference on Human-Computer Interaction (Cham: Springer), 22–34. doi: 10.1007/978-3-031-05643-7_2
Hauser, D., Paolacci, G., and Chandler, J. (2019). “Common concerns with mturk as a participant pool: evidence and solutions,” in Handbook of research methods in consumer psychology (London: Routledge), 319–337. doi: 10.4324/9781351137713-17
Höddinghaus, M., Sondern, D., and Hertel, G. (2021). The automation of leadership functions: Would people trust decision algorithms? Comput. Human Behav. 116:106635. doi: 10.1016/j.chb.2020.106635
Jagtap, V., Kulkarni, P., and Joshi, P. (2023). Uncertainty-based decision support system for gaming applications. J. Intell. Fuzzy Syst. 44, 3381–3397. doi: 10.3233/JIFS-221611
Jarrahi, M. H. (2018). Artificial intelligence and the future of work: human-AI symbiosis in organizational decision making. Bus. Horiz. 61, 577–586. doi: 10.1016/j.bushor.2018.03.007
Jian, J.-Y., Bisantz, A. M., and Drury, C. G. (2000). Foundations for an empirically determined scale of trust in automated systems. Int. J. Cogn. Ergon. 4, 53–71. doi: 10.1207/S15327566IJCE0401_04
Kulesza, T., Stumpf, S., Burnett, M., and Kwan, I. (2012). “Tell me more? The effects of mental model soundness on personalizing an intelligent agent,” in Proceedings of the Sigchi conference on human factors in computing systems (New York, NY: ACM), 1–10. doi: 10.1145/2207676.2207678
Kwak, Y., Ahn, J.-W., and Seo, Y. H. (2022). Influence of AI ethics awareness, attitude, anxiety, and self-efficacy on nursing students' behavioral intentions. BMC Nurs. 21, 1–8. doi: 10.1186/s12912-022-01048-0
Lai, V., Chen, C., Liao, Q. V., Smith-Renner, A., and Tan, C. (2021). Towards a science of human-AI decision making: a survey of empirical studies. arXiv [Preprint]. arXiv:2112.11471. doi: 10.48550/arXiv.2112.11471
Lee, M. K., and Rich, K. (2021). “Who is included in human perceptions of AI?: trust and perceived fairness around healthcare AI and cultural mistrust,” in Proceedings of the 2021 CHI conference on human factors in computing systems (New York, NY: ACM), 1–14. doi: 10.1145/3411764.3445570
Liu, Y., Mittal, A., Yang, D., and Bruckman, A. (2022). “Will AI console me when I lose my pet? Understanding perceptions of AI-mediated email writing,” in Proceedings of the 2022 CHI conference on human factors in computing systems (New York, NY: ACM), 1–13. doi: 10.1145/3491102.3517731
Mackinlay, J. (1986). Automating the design of graphical presentations of relational information. ACM Trans. Graph. 5, 110–141. doi: 10.1145/22949.22950
Madani, A., Namazi, B., Altieri, M. S., Hashimoto, D. A., Rivera, A. M., Pucher, P. H., et al. (2020). Artificial intelligence for intraoperative guidance: using semantic segmentation to identify surgical anatomy during laparoscopic cholecystectomy. Ann. Surg. 276, 363–369. doi: 10.1097/SLA.0000000000004594
Malof, J. M., Mazurowski, M. A., and Tourassi, G. D. (2012). The effect of class imbalance on case selection for case-based classifiers: an empirical study in the context of medical decision support. Neural Netw. 25, 141–145. doi: 10.1016/j.neunet.2011.07.002
Marusich, L. R., Bakdash, J. Z., Zhou, Y., and Kantarcioglu, M. (2023). Using AI uncertainty quantification to improve human decision-making. arXiv [Preprint]. arXiv:2309.10852. doi: 10.48550/arXiv.2309.10852
Mayer, R. C., Davis, J. H., and Schoorman, F. D. (1995). An integrative model of organizational trust. Acad. Manag. Rev. 20, 709–734. doi: 10.2307/258792
McKay, C. (2020). Predicting risk in criminal procedure: actuarial tools, algorithms, AI and judicial decision-making. Curr. Issues Crim. Justice 32, 22–39. doi: 10.1080/10345329.2019.1658694
McKnight, D. H., Choudhury, V., and Kacmar, C. (2002). Developing and validating trust measures for e-commerce: an integrative typology. Inf. Syst. Res. 13, 334–359. doi: 10.1287/isre.13.3.334.81
Monteserin, A., and Amandi, A. (2011). Argumentation-based negotiation planning for autonomous agents. Decis. Support Syst. 51, 532–548. doi: 10.1016/j.dss.2011.02.016
Moss, A. J., Rosenzweig, C., Robinson, J., Jaffe, S. N., and Litman, L. (2023). Is it ethical to use mechanical Turk for behavioral research? Relevant data from a representative survey of MTurk participants and wages. Behav. Res. Methods 55, 4048–4067. doi: 10.3758/s13428-022-02005-0
Okamura, K., and Yamada, S. (2020). Adaptive trust calibration for human-AI collaboration. PLoS ONE 15:e0229132. doi: 10.1371/journal.pone.0229132
Oviatt, S. (2006). “Human-centered design meets cognitive load theory: designing interfaces that help people think,” in Proceedings of the 14th ACM international conference on Multimedia (New York, NY: ACM), 871–880. doi: 10.1145/1180639.1180831
Papageorgiou, E. I., Markinos, A. T., and Gemtos, T. A. (2011). Fuzzy cognitive map based approach for predicting yield in cotton crop production as a basis for decision support system in precision agriculture application. Appl. Soft Comput. 11, 3643–3657. doi: 10.1016/j.asoc.2011.01.036
Phillips-Wren, G. (2012). Ai tools in decision making support systems: a review. Int. J. Artif. Intell. Tools 21:1240005. doi: 10.1142/S0218213012400052
Prabhudesai, S., Yang, L., Asthana, S., Huan, X., Liao, Q. V., Banovic, N., et al. (2023). “Understanding uncertainty: how lay decision-makers perceive and interpret uncertainty in human-AI decision making,” in Proceedings of the 28th International Conference on Intelligent User Interfaces (New York, NY: ACM), 379–396. doi: 10.1145/3581641.3584033
Schepman, A., and Rodway, P. (2020). Initial validation of the general attitudes towards artificial intelligence scale. Comput. Huma. Behav. Rep. 1:100014. doi: 10.1016/j.chbr.2020.100014
Schueller, L., Booth, L., Fleming, K., and Abad, J. (2020). Using serious gaming to explore how uncertainty affects stakeholder decision-making across the science-policy divide during disasters. Int. J. Disaster Risk Reduct. 51:101802. doi: 10.1016/j.ijdrr.2020.101802
Shneiderman, B. (2020). Bridging the gap between ethics and practice: guidelines for reliable, safe, and trustworthy human-centered AI systems. ACM Trans. Interact. Intell. Syst. 10, 1–31. doi: 10.1145/3419764
Sue, V. (2007). Conducting Online Surveys. London: Sage Publications, Inc. doi: 10.4135/9781412983754
Taghezout, N., and Zaraté, P. (2011). An agent-based simulation approach in an idss for evaluating performance in flow-shop manufacturing system. Intell. Decis. Technol. 5, 273–293. doi: 10.3233/IDT-2011-0111
Takagi, H., Li, Y., Komori, M., and Terada, K. (2024). “Measuring algorithm aversion and betrayal aversion to humans and AI using trust games,” in 2024 33rd IEEE International Conference on Robot and Human Interactive Communication (ROMAN) (Pasadena, CA: IEEE), 357–364. doi: 10.1109/RO-MAN60168.2024.10731215
Tomsett, R., Preece, A., Braines, D., Cerutti, F., Chakraborty, S., Srivastava, M., et al. (2020). Rapid trust calibration through interpretable and uncertainty-aware AI. Patterns 1:100049. doi: 10.1016/j.patter.2020.100049
Xu, W., Dainoff, M. J., Ge, L., and Gao, Z. (2023). Transitioning to human interaction with AI systems: New challenges and opportunities for HCI professionals to enable human-centered AI. Int. J. Hum. Comput. Interact. 39, 494–518. doi: 10.1080/10447318.2022.2041900
Zarifis, A., and Cheng, X. (2024). How to build trust in answers given by generative AI for specific and vague financial questions. J. Electron. Bus. Digit. Econ. 3, 236–250. doi: 10.1108/JEBDE-11-2023-0028
Zhang, L., Pentina, I., and Fan, Y. (2021a). Who do you choose? Comparing perceptions of human vs robo-advisor in the context of financial services. J. Serv. Market. 35, 634–646. doi: 10.1108/JSM-05-2020-0162
Zhang, Z., Genc, Y., Wang, D., Ahsen, M. E., and Fan, X. (2021b). Effect of AI explanations on human perceptions of patient-facing AI-powered healthcare systems. J. Med. Syst. 45:64. doi: 10.1007/s10916-021-01743-6
Keywords: uncertainty visualization, AI uncertainty, decision-making, human-AI, trust, psychology of players, game design
Citation: Reyes J, Batmaz AU and Kersten-Oertel M (2025) Trusting AI: does uncertainty visualization affect decision-making? Front. Comput. Sci. 7:1464348. doi: 10.3389/fcomp.2025.1464348
Received: 13 July 2024; Accepted: 16 January 2025;
Published: 07 February 2025.
Edited by:
Ilaria Tiddi, VU Amsterdam, NetherlandsReviewed by:
Alex Zarifis, University of Southampton, United KingdomCopyright © 2025 Reyes, Batmaz and Kersten-Oertel. This is an open-access article distributed under the terms of the Creative Commons Attribution License (CC BY). The use, distribution or reproduction in other forums is permitted, provided the original author(s) and the copyright owner(s) are credited and that the original publication in this journal is cited, in accordance with accepted academic practice. No use, distribution or reproduction is permitted which does not comply with these terms.
*Correspondence: Jonatan Reyes, al95ZXNAZW5jcy5jb25jb3JkaWEuY2E=
Disclaimer: All claims expressed in this article are solely those of the authors and do not necessarily represent those of their affiliated organizations, or those of the publisher, the editors and the reviewers. Any product that may be evaluated in this article or claim that may be made by its manufacturer is not guaranteed or endorsed by the publisher.
Research integrity at Frontiers
Learn more about the work of our research integrity team to safeguard the quality of each article we publish.