 Dhananjay Joshi
 Bhupesh Kumar Singh
 Kapil Kumar Nagwanshi
 Nitin S. Choubey
94% of researchers rate our articles as excellent or good
Learn more about the work of our research integrity team to safeguard the quality of each article we publish.
Find out more
ORIGINAL RESEARCH article
Front. Comput. Sci., 10 April 2025
Sec. Computer Vision
Volume 7 - 2025 | https://doi.org/10.3389/fcomp.2025.1463006
Introduction: Brain tumor (BT) classification is crucial yet challenging due to the complex and varied nature of these tumors. We present a novel approach combining a Pyramid Vision Transformer (PVT) with an adaptive deformable attention mechanism and Topological Data Analysis (TDA) to address the complexities of BT detection. While PVT and deformable attention have been explored in prior work, we introduce key innovations to enhance their performance for medical image analysis.
Methods: We developed an adaptive deformable attention mechanism that dynamically adjusts receptive fields based on tumor complexity, focusing on critical regions in MRI scans. The approach also incorporates an adaptive sampling rate with hierarchical dynamic position embeddings for context-aware multi-scale feature extraction. Feature channels are partitioned into specialized groups via an offset group mechanism to improve feature diversity, and a hierarchical deformable attention strategy further integrates local and global contexts to yield refined feature representations. Additionally, applying TDA to MRI images extracts meaningful topological patterns, followed by a Random Forest classifier for final BT classification.
Results: The method was evaluated on the Figshare brain tumor MRI dataset. It achieved 99.2% accuracy, 99.35% recall, 98.9% precision, a 99.12% F1-score, a Matthews correlation coefficient (MCC) of 0.98, and a LogLoss of 0.05, with an average processing time of approximately 6 seconds per image.
Discussion: These results underscore the method's ability to combine detailed feature extraction with topological insights, significantly improving the accuracy and efficiency of BT classification. The proposed approach offers a promising tool for more reliable and rapid brain tumor diagnosis.
BT diagnosis is a pivotal and challenging task in medical imaging, playing a crucial role in determining appropriate patient treatment strategies and predicting prognosis (Abdel Razek et al., 2021; Ottom et al., 2022; Rehman et al., 2022; Noreen et al., 2020; Mall et al., 2023). Traditional diagnostic methods involve visual analysis of medical images by radiologists, which can be time-consuming, subjective, and dependent on the expertise of the individual practitioner (Amin et al., 2021; Antoniadi et al., 2021). As technology advances and the amount of medical imaging data grows exponentially, there is a pressing need for automated, accurate, and efficient diagnostic tools to handle this influx of information effectively (Skaf and Laubenbacher, 2022; Songdechakraiwut and Chung, 2020; Clough et al., 2020). Deep learning has recently become a powerful tool for analyzing medical images, with high success in a variety of tasks such as segmentation, object recognition, and disease categorization (Kang et al., 2021). CNNs, a widely adopted category of deep learning models, have demonstrated remarkable capabilities in capturing complex hierarchical features directly from unprocessed medical image data (Aamir et al., 2022; Amin et al., 2021; Mohsen et al., 2018; Kokkalla et al., 2021). The ability of deep learning models to automatically extract complex features without relying on handcrafted feature engineering has led to substantial improvements in the accuracy and efficiency of medical image analysis (Irmak, 2021). Despite their efficiency, some methods, such as CNN and deep learning, are limited in their ability to capture complex and varied information because of their simplicity (Abd El Kader et al., 2021). Other methods although designed to improve data efficiency, face significant challenges in real-time processing due to high computational demands. Methods that rely heavily on pre-trained networks often struggle with adaptability when confronted with novel or diverse data types. Additionally, certain models that are effective with smaller datasets may falter when applied to larger datasets, leading to potential inaccuracies in more challenging cases (Majib et al., 2021). Simplified architectures might not fully capture the complex features required for accurate classification, while resource-intensive models can limit their practicality in real-world scenarios. Furthermore, optimization-dependent frameworks may not generalize well across diverse datasets, and even efficient methods often require significant fine-tuning to achieve optimal performance (Urbanos et al., 2021). These limitations highlight the ongoing need for more flexible, adaptable, and computationally efficient approaches in BT classification.
In this context, TDA offers a complementary approach to address these challenges. TDA provides a powerful mathematical framework to analyze and characterize the underlying topological properties and structures present in complex data (Majib et al., 2021). By representing the data in a topological space, TDA enables a deeper understanding of the data's geometric and structural aspects, capturing essential features that might be overlooked by traditional numerical or statistical methods (Saeedi et al., 2023).
The need for integrating TDA with deep learning arises from the unique strengths of both approaches. While deep learning excels in learning intricate patterns and features, TDA complements this by providing a principled approach to understand the topology and geometry of the data. Integrating deep learning with TDA offers a synergistic advantage, combining the feature learning capability of deep learning with the topological insights provided by TDA (De Benedictis et al., 2024). This integration can potentially enhance the robustness, interpretability, and generalizability of BT diagnosis models, ultimately improving patient care and outcomes. In this work, we propose a novel framework for BT classification that integrates the adaptive deformable attention mechanism within the PVT with TDA through Giotto-TDA. This combination results in an advanced methodology for medical image analysis improving the accuracy, interpretability, and robustness of BT detection. The key contributions of the proposed Adaptive Deformable Attention PVT with Giotto-TDA framework are as follows:
• We introduce an adaptive deformable attention mechanism into the PVT architecture, which dynamically adjusts receptive fields based on tumor complexity. This mechanism enhances the model's ability to focus on crucial regions within MRI images, improving feature extraction and classification accuracy. This dynamic approach overcomes the limitations of traditional fixed attention methods, enabling better handling of intricate and diverse tumor structures.
• The framework uniquely integrates TDA using Giotto-TDA, a tool that transforms preprocessed MRI images into point clouds and calculates persistent homology. This process extracts topological features that capture enduring structural patterns of the tumor, providing insights beyond those available through conventional CNNs or transformers. The TDA component significantly enhances the model's interpretability and robustness, offering a deeper understanding of the spatial and structural relationships within the tumor.
• The combination of deformable attention and TDA extends the model's feature extraction capabilities beyond traditional methods. By using persistence diagrams and multi-scale point cloud representations, the framework improves classification performance across key metrics, including accuracy, precision, recall, MCC, logloss, and f1-score. This approach ensures that the model can capture both detailed local features and global structural information, making it particularly well-suited for real-time clinical applications.
This section presents a review of existing research in the field of BT detection and classification, emphasizing various methodologies and their contributions. We identify the strengths and limitations of these approaches and highlight the specific research gaps that our proposed method seeks to address.
Kesav and Jibukumar (2022) introduced a Region-based Convolutional Neural Network (RCNN) with a two-channel structure for BT classification. This model reduces the number of parameters while improving feature extraction quality by using a two-channel CNN as a feature extraction layer in the RCNN. To prevent overfitting, the model incorporates L2 regularization and ten-fold cross-validation. While this approach is efficient in terms of speed, it may not capture the diverse and complex features present in BT images due to the simplicity of the RCNN architecture.
Bodapati et al. (2021) proposed a Two-Channel Deep Neural Network (DNN) for BT classification, utilizing transfer learning with pre-trained CNN models like InceptionResNetV2 and Xception. Their model benefits from the knowledge learned on large-scale datasets, improving performance on BT classification tasks. Additionally, an attention mechanism is used to distinguish between tumor and non-tumor regions. However, reliance on pre-trained models can limit the adaptability of the approach to new data types and may not perform optimally on smaller or less diverse datasets.
Abd El-Wahab et al. (2023) introduced a Fast CNN for Multi-class BT Classification (BTC-fCNN) model, focusing on reducing computational costs and learning time through simplified architecture and transfer learning. The model uses five-fold cross-validation to enhance generalization and mitigate overfitting. Despite these improvements, the simplified architecture may not capture the intricate features of BTs as effectively as more complex models, leading to potential accuracy trade-offs.
Ferdous et al. (2023) presented the Linear Complexity Data-Efficient Image Transformer (LCDEiT) model for BT classification. This model leverages a vision transformer architecture to address challenges such as inductive bias and parameter dependency, which are commonly faced in texture-based image classification. Additionally, LCDEiT focuses on data efficiency, making it particularly useful for medical image tasks with limited data. However, despite its effectiveness in handling complex patterns, LCDEiT faces challenges related to computational complexity, making it less suitable for real-time applications.
Wang et al. (2024) introduced the RanMerFormer, a novel method for BT classification using MRI images. Built on a pre-trained Vision Transformer (ViT), RanMerFormer incorporates a token merging algorithm (TMA) to reduce redundant tokens, improving computational efficiency without sacrificing accuracy. This approach demonstrates faster processing times, but it may still require fine-tuning for optimal performance across diverse datasets, particularly in medical imaging, where the variability of tumor types is high.
Aboussaleh et al. (2024) proposed a hybrid deep learning approach for BT segmentation, combining the strengths of 3DU-Net and V-Net architectures. The 3DUV-NetR+ model integrates 3D convolutional layers and a transformer block, leveraging the attention mechanism to capture both localized and contextual information. Although this hybrid model provides significant improvements in segmentation accuracy, it is computationally intensive and may be impractical for real-time clinical applications due to its resource demands.
Aljohani et al. (2024) combined pre-trained CNNs with meta-heuristic optimization algorithms, specifically the Manta Ray Foraging Optimization (MRFO) algorithm, to classify BTs in MRI and X-ray images. This hybrid framework effectively enhances classification accuracy through optimization of CNN hyperparameters. However, the reliance on optimization methods like MRFO may not generalize well across diverse datasets, limiting its flexibility in varied clinical settings.
Deepak and Ameer (2021a) proposed a hybrid model that combines CNN features with SVM for BT classification. This model addresses the challenge of limited training data, achieving improved performance while reducing computational complexity. The CNN-SVM model outperforms many traditional approaches by effectively leveraging deep learning and machine learning techniques, making it promising for applications in medical image classification. However, it may face limitations when dealing with larger datasets, where the combination of CNN and SVM could lead to longer training times and higher computational costs.
Deepak and Ameer (2021b) also introduced a method using Siamese Neural Networks (SNN) and neighborhood analysis for BT classification. By extracting features through a 3-layer fully connected SNN and incorporating neighborhood analysis, this approach reduces model complexity while improving accuracy. However, one limitation is the potential for erroneous predictions, particularly in the classification of grade III tumors, which could undermine the reliability of the method in more challenging cases. The summary of the above works is provided in Table 1.
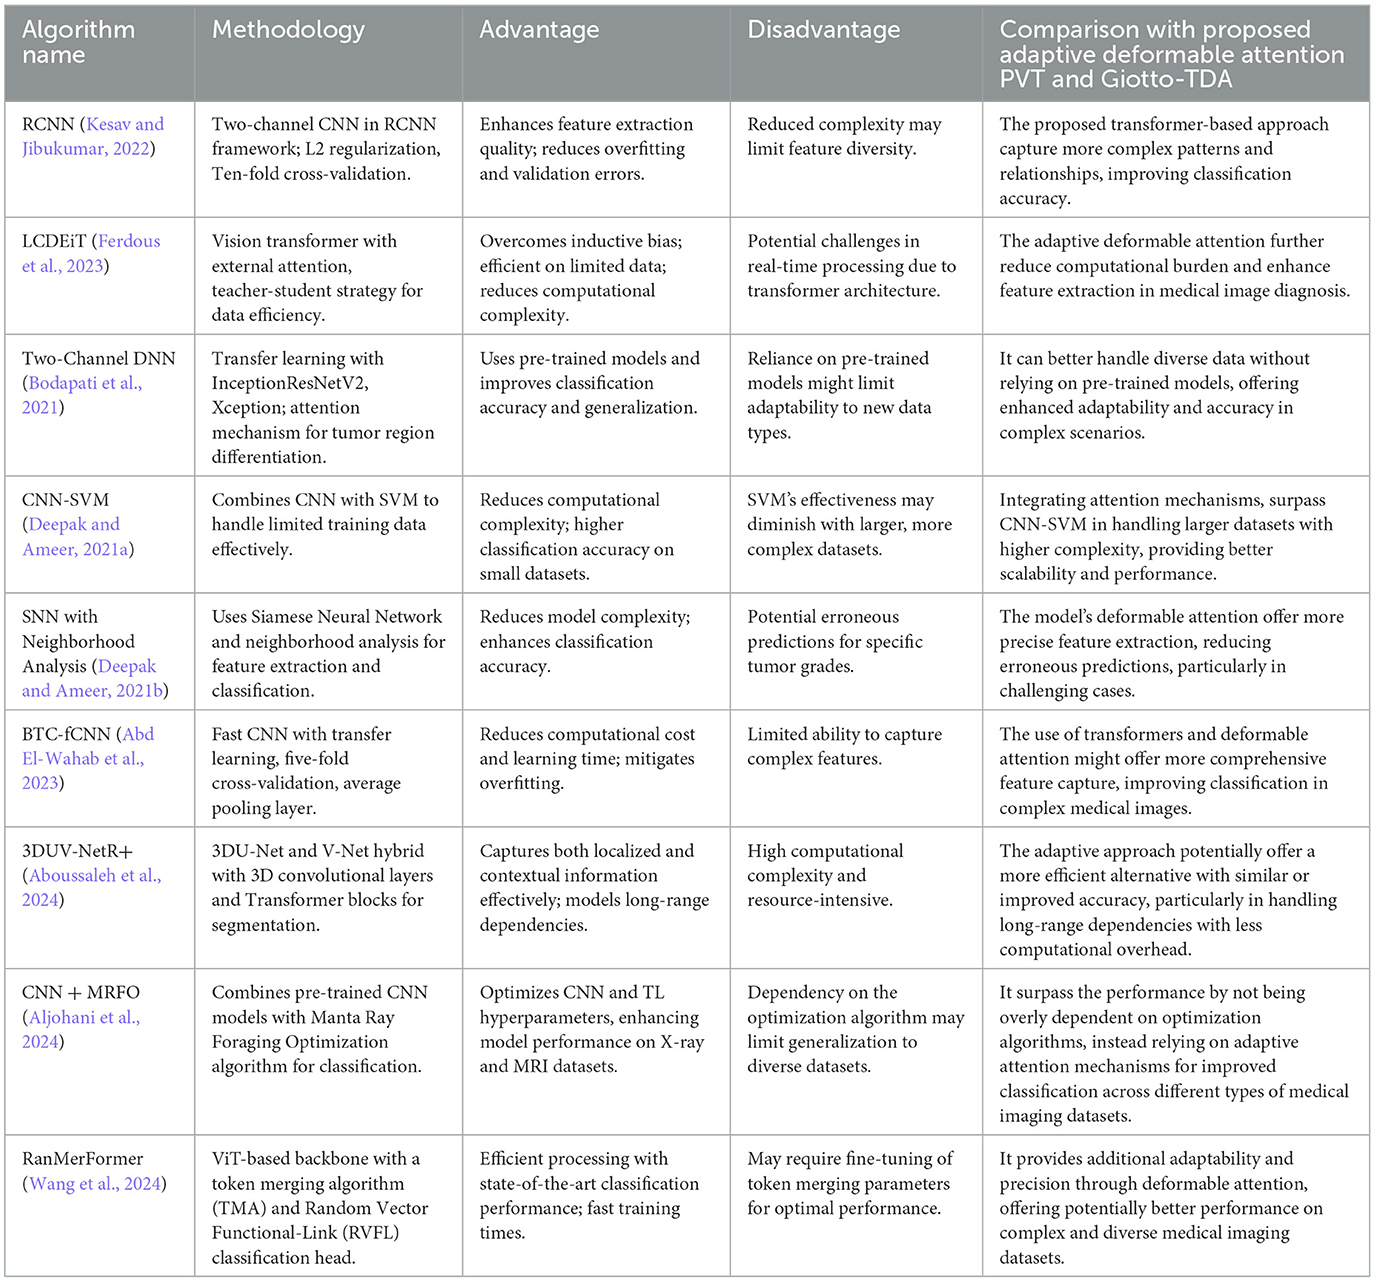
Table 1. Summary of the related works.
While these studies demonstrate significant advancements in BT classification, several key limitations remain. CNN-based approaches, such as those proposed by Kesav and Jibukumar (2022) and Bodapati et al. (2021), are efficient in terms of speed but often fail to capture the diverse and complex features of BTs. Transformer-based models, such as LCDEiT and RanMerFormer, provide significant improvements in data efficiency and computational efficiency, respectively, but still face challenges with computational demands and real-time applicability. Hybrid models like 3DUV-NetR+ (Aboussaleh et al., 2024) and optimization-based approaches (Aljohani et al., 2024) show promise but are resource-intensive and may struggle with generalization across diverse datasets. Finally, transfer learning and machine learning integration, as seen in the CNN-SVM (Deepak and Ameer, 2021a) and SNN (Deepak and Ameer, 2021b) approaches, address issues of data scarcity but may fail when faced with large datasets or complex tumor types.
These limitations highlight the need for more flexible, computationally efficient methods capable of handling diverse tumor characteristics while maintaining high accuracy and generalizability. The proposed methodology addresses the limitations and research gaps identified in existing BT classification approaches by combining the adaptive deformable attention PVT with Giotto-TDA. While CNN-based models struggle to capture complex tumor features and transformer-based models face challenges in computational demands, the adaptive deformable attention mechanism in PVT allows dynamic adjustment of receptive fields, efficiently capturing both local and global features. This enhances feature extraction without overburdening computational resources. Additionally, by integrating TDA through Giotto-TDA, the methodology incorporates topological features, offering a deeper understanding of tumor structures that traditional methods overlook. This combination of computational efficiency, feature complexity, and the ability to handle diverse tumor characteristics directly addresses the gaps in real-time applicability, generalization, and adaptability, making the proposed system a more robust and efficient solution for BT classification.
This research work proposes a novel methodology for robust BT classification by seamlessly integrating the strengths of PVT with adaptive deformable attention and TDA. In the data pre-processing phase, the images from the Figshare BT dataset go through essential process, including noise reduction, image enhancement through histogram equalization and contrast stretching, resizing, normalization, and data splitting. Subsequently, the PVT with an adaptive deformable attention mechanism is employed for feature extraction. The architecture of the proposed PVT with an adaptive deformable attention mechanism and Giotto-TDA for BT classification is presented in Figure 1.
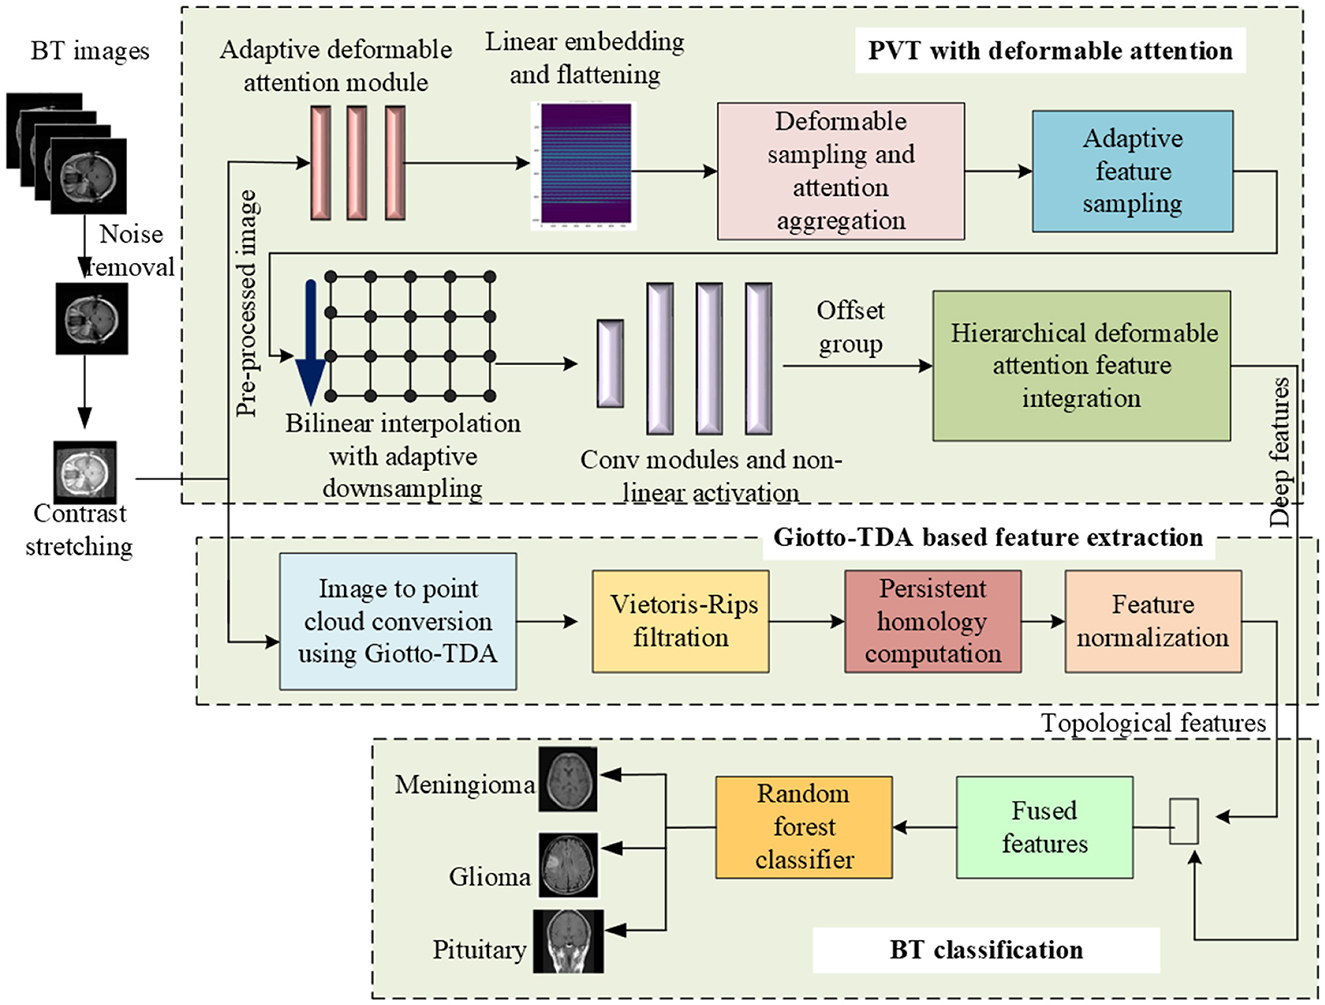
Figure 1. Proposed framework for BT classification using adaptive deformable attention PVT and Giotto-TDA.
This approach combines patch-based processing and global contextual understanding, allowing dynamic adjustment of receptive fields for focused exploration of informative regions. The system also integrates TDA using Giotto-TDA, transforming pre-processed BT images into point clouds to capture spatial relationships. The proposed deformable attention mechanism involves adaptive sampling and hierarchical dynamic position embeddings, enhancing the model's ability to attend to contextually relevant positions. The extracted features, both deep and topological, undergo fusion for a comprehensive representation. Finally, a Random Forest classifier facilitates accurate classification of glioma, meningioma, and pituitary tumors. This integrative system showcases a synergistic approach, leveraging both deep learning and topological insights for improved BT classification.
In this step, the images from BT dataset are prepared for subsequent analysis, ensuring that it is in a suitable format and quality for machine learning and image analysis tasks.
Here, we denote the BT dataset as D, where D = {X, Y}. In this, X is a set of medical images X = {x1, x2, x3, ...xn}, where xi represents an individual medical image. Y is the corresponding labels indicating the presence or absence of the BT such that Y = {y1, y2, y3, ...yn} where yi is the label of the i-th image (yi ∈ {0, 1}) for binary classification. To begin with, the dataset from Figshare is first prepared by applying noise reduction techniques such as Gaussian filtering (Bharati et al., 2021) to ensure high-quality images.
Augmentation techniques are crucial for improving model generalization and handling potential class imbalances. Various transformations, such as rotation, flipping, scaling, and cropping, are applied to simulate different imaging conditions and increase the dataset's diversity. Additionally, contrast adjustments and resolution enhancements are used to standardize the images and highlight key features relevant to tumor classification. To stabilize the training process, images are normalized. Histogram equalization (Cenggoro and Pardamean, 2023) is applied to adjust the contrast and ensure consistent pixel intensity distribution across the dataset, which helps the model learn more effectively from the images. Once the images are pre-processed, they are split into training, validation, and test sets. This ensures that the model is exposed to a wide range of data scenarios, enabling robust, and reliable classification performance.
The proposed framework builds on established methods while introducing several key innovations that enhance performance in BT classification. While the PVT architecture (Wang et al., 2021) and deformable attention mechanisms (Xia et al., 2022) are inspired by prior works, this study adapts and extends them through novel contributions tailored to the unique challenges of medical image analysis. Specifically, we introduce an adaptive deformable attention mechanism that dynamically adjusts receptive fields based on tumor complexity, improving the focus on critical regions within MRI images. Unlike traditional methods with fixed downsampling factors, our framework incorporates an adaptive sampling rate with hierarchical dynamic position embeddings, enabling context-aware feature extraction at multiple scales. Additionally, the offset group mechanism partitions feature channels into specialized groups, enhancing diversity in deformed feature representations and ensuring robust feature learning. Furthermore, we propose a hierarchical deformable attention feature integration strategy, combining local and global contexts across scales for more comprehensive feature representation. These innovations are complemented by a refined adaptive bilinear interpolation function, which introduces a learnable parameter to modulate interpolation importance based on input features. Together, these contributions distinguish the proposed framework from existing methods, offering significant advancements in adaptive feature extraction and classification accuracy for BT analysis.
In this step, we utilize the PVT augmented with a Deformable Attention mechanism to extract discriminative features from pre-processed BT images. The PVT architecture, known for its patch-based processing and global contextual understanding, is enhanced by deformable attention, which dynamically adjusts receptive fields to focus on informative regions within the image. This approach enables the model to capture a diverse set of deep features essential for differentiating gliomas, meningiomas, and pituitary tumors. These features include image intensity, texture, shape, size, location, enhancement patterns, DTI features such as FA and MD, and radiomics features. Gliomas, with their high water content, appear hyperintense on T2-weighted MRI images, whereas meningiomas are typically isointense or slightly hypointense. Irregular tumor shapes and locations, such as gliomas being found anywhere in the brain, meningiomas near the meninges, and pituitary tumors at the base of the brain, further distinguish the tumor types. Gliomas often show gadolinium enhancement, while meningiomas may not, and pituitary tumors typically do not enhance. DTI features also play a critical role, as gliomas typically display lower FA and higher MD, meningiomas show higher FA and lower MD, and pituitary tumors exhibit varying FA and MD. The deformable attention mechanism, with adaptive sampling and hierarchical dynamic position embeddings, enables the model to focus on relevant regions and better fuse features, improving the model's ability to classify complex tumor types with higher accuracy. The Gadolinium contrast and DTI features in an MRI image is depicted in Figure 2.
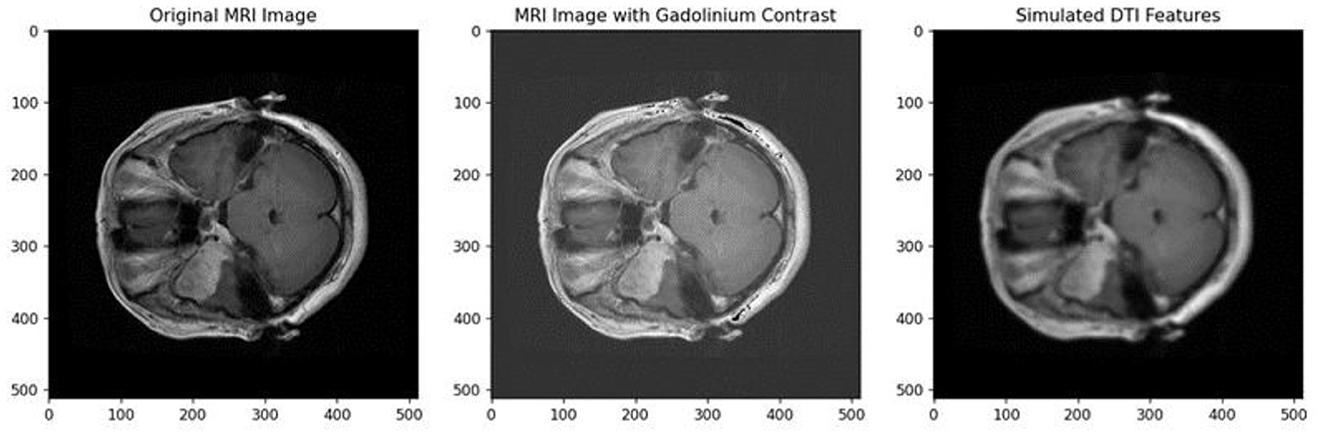
Figure 2. Gadolinium contrast and DTI features in an MRI image.
This mechanism allows the model to dynamically adjust its focus on different regions of the MRI images based on the tumor's complex structure. This adaptability enhances feature extraction and improves classification accuracy.
In this step, the image x is denoted as 2D tensor with dimensions L×W×N, where, L is the height, W denotes the width and the number of channels is N. Here, the dimension of the patches is P×P×N, and P is the patch size. To this, the linear embedding and flattening are done to extract the flattened feature map x ∈ ℝO×N. For this, the formulation of MHA block is, done using the projection matrices of query Mq, key Mk, value Mv and concatenated Mo for x such that,
In this Equation (2), specifies the output obtained by concatenating all the heads.
For the feature map, x ∈ ℝL×W×N, grid points are generated uniformly as references. The grid size is adaptively determined based on the size of x, where and . Reference points are linearly spaced 2D coordinates normalized to the range [−1, +1], indicating the top-left and bottom-right corners. The query tokens are obtained by linearly projecting the feature maps Qu = x×Mq. These query tokens are passed through a lightweight sub-network φoffs(.) to generate offsets Δt = offs(Qu). To introduce adaptability, the scaling factor s(x) is dynamically determined based on the input features, such that,
In this step, we introduce adaptive feature sampling in the context of the Adaptive Deformable Attention module. The goal is to dynamically adjust the sampling of features based on learned offsets and input features. This mechanism enhances the flexibility of the attention module to capture complex patterns in the data. Adaptive sampling occurs at key and value locations, corresponding to deformed points and considering offsets from the lightweight sub-network. This dynamic sampling mechanism enables the attention module to concentrate on pertinent areas within the input feature map. While conventional deformable attention often employs a fixed downsampling factor (k), our approach introduces adaptability in determining this factor based on the input image size. However, for enhanced adaptability, we introduce a learnable parameter to dynamically determine the downsampling factor based on the input image size. The adaptive downsampling parameter is calculated as,
Here, f(x) is the function that takes into account of the features of x into account to dynamically adjust the downsampling factor. Using this the sampling is done at the adaptively deformed points of Mk and Mv. Thus, the deformed results are,
To guarantee differentiability, the sampling function ∂(, ;.) is configured as a bilinear interpolation. However, for adaptability, we introduce an additional parameter, that dynamically determines the importance of the interpolation. The refined adaptive bilinear interpolation function is expressed as,
In this, w(x) is a function that adapts based on the input features x, x(u, v) = max(0, 1−|u−v|) is the bi-linear interpolation function. rv, ru, indicates all locations on x ∈ ℝL×W×N. The formulation of the attention head's output Y(s) is expressed as follows.
The output of the attention head is formulated as,
In this, D~ is an adapted position embedding. δ(D~; R), corresponds to the adaptive bilinear interpolation.
To improve the recognition of local features and acquire meaningful offsets, the sub-network responsible for offset generation incorporates two convolution modules and a non-linear activation function. Here, we apply a 7 × 7 depth wise convolution to the input features, capturing local information effectively. Then, the GELU activation function is introduced for non-linearity and capture complex patterns in the local features. In this step, a 2 × 2 convolution is utilized to derive 2D offsets from the processed local features. To eliminate bias-induced shifts for all locations, the bias term in the 2 × 2 convolution is excluded, ensuring more controlled and accurate offset generation. The feature extraction using adaptive deformable attention is presented in Figure 3.
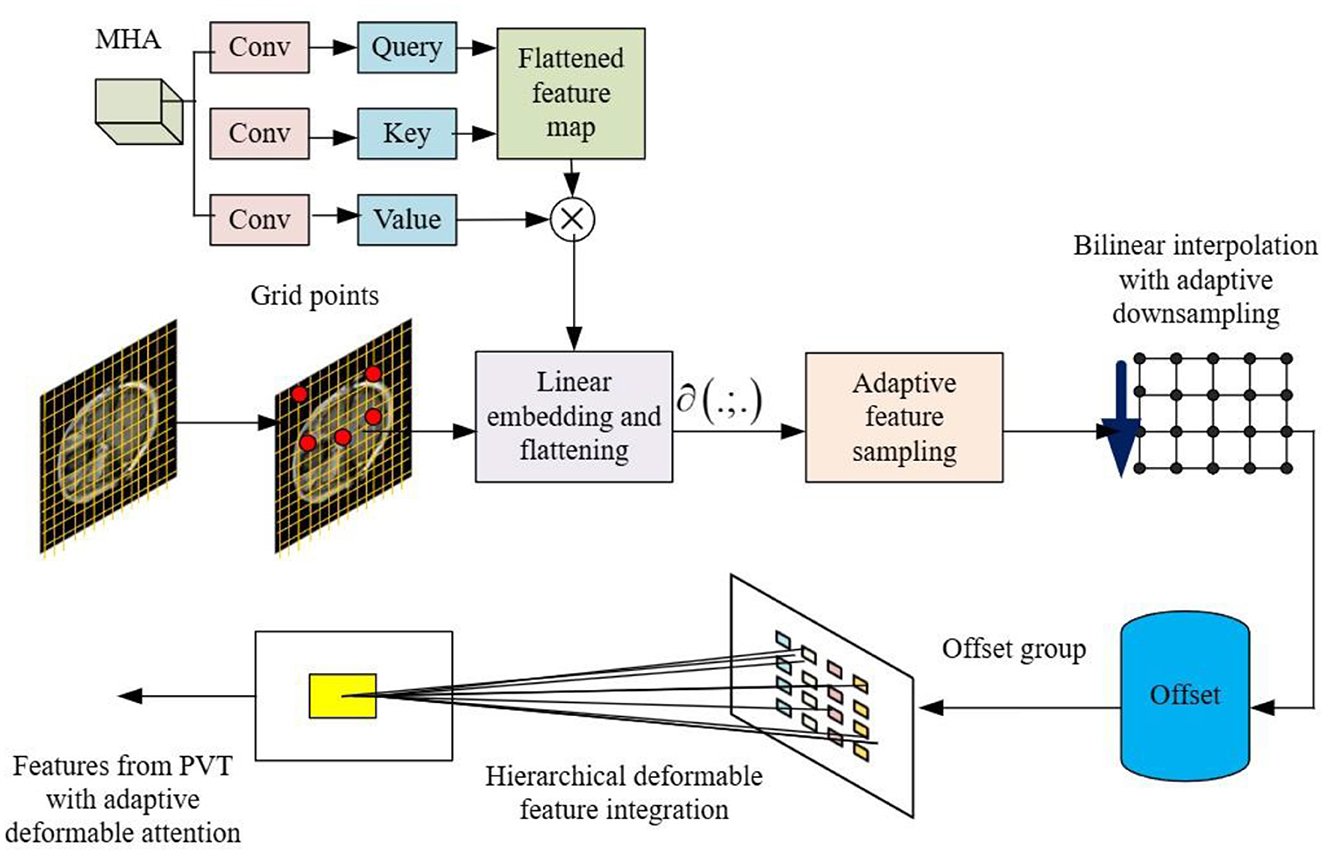
Figure 3. Feature extraction using PVT with adaptive deformable attention.
To enhance diversity among deformed points, a mechanism for splitting feature channels into P groups is implemented. This innovative strategy allows for specialized processing within each group, ensuring that distinct characteristics are captured, thus enriching the representation of the feature space. Within the Offset Groups framework, each feature group benefits from a shared sub-network responsible for generating corresponding offsets. By sharing this sub-network, we enable consistent and coherent learning within each group, fostering the extraction of specific features and patterns relevant to the assigned deformed keys and values. An essential element in the design of our model entails setting the head number (s) for the attention module. Here, (s) is a multiple of the offset group's size P. This intentional modification efficiently assigns multiple attention heads to each group of deformed keys and values, optimizing the overall performance.
This is the last step in PVT, in which the local context lc(s) and global context gc(s) information of the features are extracted at different scales s. These deformable attentions at multiple scales are integrated to achieve the final deep feature map.
Simultaneously, we transform the preprocessed BT images into point clouds using the ImageToPointCloud method from Giotto-TDA (Garin and Tauzin, 2019) a critical step for integrating TDA into BT analysis. This transformation preserves the spatial relationships between pixels, representing them as points in a cloud, with each point encapsulating the two-dimensional spatial information of the original image. This geometric representation is essential for subsequent TDA operations, such as computing persistent homology, which uncovers topological features like connected components, loops, and voids-elements often overlooked by traditional image analysis techniques. By using Giotto-TDA to convert MRI images into point clouds and analyzing their topological properties, this approach provides understanding of the complex structural characteristics of tumors, significantly enhancing the diagnostic process.
The novel contribution here lies in the use of Giotto-TDA to transform MRI images of BTs into point clouds, enabling the computation of persistent homology. This approach goes beyond traditional image analysis methods by capturing topological features such as connected components, loops, and voids-that are often overlooked by conventional techniques. By representing the image as a point cloud and applying TDA, this method uncovers deeper insights into the complex structural characteristics of tumors, offering a richer, more nuanced understanding of their underlying topology. This transformation provides a new way to explore and analyze the spatial complexities of BT images, significantly enhancing the diagnostic process.
The starting point is the preprocessed BT image x, which is a two-dimensional array representing the distribution of brightness values across the image. The ImageToPointCloud method is applied to each pixel of the image. This method converts the pixel's spatial coordinates (m, n) into a point pi in a point cloud. The result is a collection of points forming a point cloud P = {p1, p2, p3, ..pn}. Each point in the point cloud corresponds to a pixel in the original image. The point cloud encapsulates the spatial information of the image in a geometric representation of pi = (m, n). The ImageToPointCloud method is captured by the function F, which maps each pixel of the image to a point in the point cloud such that P = F(x ).
The Vietoris-Rips filtration is a key method in persistent homology, used to analyze the topological features of point clouds across different spatial scales. By constructing simplicial complexes at each scale, it captures the evolution of connected components, loops, and voids. The resulting sequence of complexes reveals persistent topological features, such as enduring connected components and loops, which offer insights into the underlying structure of the data. Persistence diagrams, derived from this filtration, provide a detailed representation of the data's persistent homological characteristics, aiding in the understanding of its topological landscape.
Once the point cloud representations (P) of the images are obtained, the subsequent step involves computing the persistent homology. This is achieved by applying the modified form of the Vietoris-Rips filtration technique (Garin and Tauzin, 2019) which captures topological features at various spatial scales. The process begins with various filtrations, including voxel value, height, radial, and density filtrations. Features are then extracted using methods such as Betti curves, persistence landscapes, heat kernel, Wasserstein amplitude, Bottleneck distance, and persistent entropy. Normalization ensures consistency in the amplitude of diagrams, and feature selection is performed using the random forest algorithm, considering feature importance and correlation. The final set of uncorrelated features is obtained for subsequent machine learning applications.
At first, the voxel values are used directly as a filtration. Using voxel values directly allows the incorporation of the image's inherent structure as a filtration, providing a foundational representation for topological analysis. Let Vvoxel be the set of voxel values.
Here, tv is the threshold value for voxel filtration.
Height and radial filtrations capture information about the geometric structure of the image from different perspectives. For height filtration, various directions and centers cover possible directions uniformly. For each direction (θi) and center (ci), the height filtration is computed as , where is the point cloud representing the height filtration for the i-th direction and center. The filtration parameter r represents the scale.
For radial filtration, filtration is applied in each direction (ϕj) and center (cj) thus,
The radial filtration captures topological features related to the radial structure of the image, providing a distinct perspective from height filtration. This representation emphasizes the radial nature of the filtration process, focusing on emanating from different radial directions and centers to comprehensively analyze the geometric characteristics of the image.
Subsequently, density filtration is carried out. In the context of a specified radius parameter r, the adapted density filtration De(p) allocates a value to each point within the point cloud, considering the count of neighbors within a defined distance. Using the L-1 norm, the equation is defined as,
here, De(p) is the modified density value assigned to point p in the point cloud. # denotes the count of point in the set, q represents a point in the point cloud P. ||p−q||1 is the L1-norm, representing the distance between point p and q. Given a point cloud P the Vietoris-Rips filtration at a scale r, denoted as VR(P; r) constructs a sequence of simplicial complexes capturing the topological features at different scales. The Vietoris-Rips complex at scale r includes a simplex if and only if all its vertices have pairwise distances ≤ r.
Here, σ represents a simplex in the complex. ||p−q||, denotes the distance between point p and q. According to Equation (13), the persistence diagram D provides a record of the emergence and cessation of topological features, including connected components (dimension 0) and 1-cycles (dimension 1). The persistence diagram is a set of points (bi, di) representing the birth bi and di of each topological feature such that,
From this, the Betti curves are computed (Garin and Tauzin, 2019), and then the persistence landscape λk:ℝ → 0, 1) of a barcode with standard deviation σ is computed as,
The heat kernel of the persistence diagram with standard deviation σ is computed as,
The Wasserstein amplitude of order p for a persistence diagram is calculated as the Lp norm of point distances to the diagonal:
The bottleneck distance for a persistence diagram and is given by,
The persistent entropy for persistence diagram is computed as,
Consider D as the initial persistence diagram, and let ABmax represent the amplitude with maximum observed bottleneck across the diagrams acquired through identical filtrations for all images. The normalized diagram Dnormalized is obtained by rescaling each point (b, d) in D by the maximal bottleneck amplitude,
This operation ensures that the amplitudes of persistence diagrams are consistent across different images and filtrations, allowing for meaningful comparisons. The random forest algorithm is used to assign importance scores to each feature. Let F denote the collection of all features, and I represent the indices associated with the selected features based on their assigned importance scores. The feature selection process can be represented as:
The set Fs contains the selected features based on their importance from Equations (9)–(20), as determined by the random forest algorithm. To check for correlation among features and select only uncorrelated features, the Pearson correlation matrix (Rahadian et al., 2023) is utilized. The process of selecting the final set of features FTDA based on correlation is represented as follows.
Here, ρ(fi, fj) represents the Pearson correlation coefficient between features fi and fj and the threshold is a predefined value to determine the maximum allowed correlation. The final set FTDA includes only those features that are uncorrelated within the specified threshold.
Feature fusion involves combining features from different sources to provide a more comprehensive representation for downstream tasks. Here, we combine the deep features obtained from adaptive deformable attention PVT in Equation (8) with the final feature set obtained by Giotta-TDA in Equation (22). The resultant fused feature is represented as,
A novel contribution is the innovative fusion of deep features extracted by the PVT with topological insights derived from TDA. This dual feature integration leverages both the discriminative power of the adaptive deformable attention mechanism in PVT and the topological representations captured by Giotto-TDA, resulting in a more holistic and comprehensive feature set for BT classification. By combining these complementary feature sources, the proposed framework enhances the robustness and accuracy of the classification system, enabling the model to capture both fine-grained local image details and the global topological structure of the tumor, leading to more precise and reliable diagnostic outcomes.
The classification of BT images into different types (glioma, meningioma, and pituitary) using a Random Forest classifier involves training the model on the extracted features Ffused and then predicting the class labels. The corresponding class labels is denoted as y in which y can take a value in the set (glioma, meningioma, pituitary). Assuming that the training dataset with N samples, the training process involves fitting a random forest classifier into Ffused. For training, consider Ffused−train is the set of fused features for training and ytrain is the corresponding set of class labels. Here, the feature-matrix xtrain is formed by stacking the feature vectors row-wise.
Here, represents the i-th feature of the j-th sample. The vector ytrain represents the class label for each sample.
Each can take one of three values:
= glioma: Denotes that the o-th sample is classified as belonging to the glioma class.
= meningioma: Denotes that the o-th sample is classified as belonging to the meningioma class.
= pituitary: Denotes that the o-th sample is classified as belonging to the pituitary class.
The rfc.fit method trains the Random Forest model using the provided training data. Therefore,
During the training process, the Random Forest algorithm builds multiple decision trees using different subsets of the training data and features. These decision trees are then combined to make predictions. After training, the trained model is used to predict the class labels for a new set of fused features Ffused<uscore>test. Here, the feature-matrix xtest is formed by stacking the feature vectors row-wise.
Here, K denotes the quantity of samples in the test set. Finally, the BT is predicted using the rfc.predict
Following this stage, the Random Forest model is prepared to make predictions on novel, unseen data, utilizing the collective insights derived from its individual decision trees. This integrative framework enhances understanding and diagnosis of BTs, offering a valuable contribution to medical image analysis.
The Section 4 encompasses a comprehensive strategy to evaluate the proposed methodology's efficacy in BT classification. The BT dataset serves as the foundation for experimentation, with details provided to elucidate the nature and characteristics of the images involved. To assess the system's performance, a set of carefully chosen metrics is employed, reflecting various aspects of classification accuracy and robustness. Simulated outcomes are generated based on the proposed methodology, and these outcomes undergo rigorous performance assessment against ground truth labels.
The experiment was successfully conducted on a computer system equipped with 32 GB RAM and an Intel Xeon CPU E3-1245-v6 @3.70GHz. The simulations were conducted using the Jupyter notebook, a popular open-source web application that allows for the creation and sharing of documents containing live code, equations, visualizations, and narrative text.
The BT images are collected from the Figshare database (Athisayamani et al., 2023), and the authors in Cheng (2017) and Cheng et al. (2015) used the Figshare dataset in their research. The author in Cheng et al. (2016) also used same dataset in their research. Figshare serves as a valuable repository for BT datasets, facilitating research in machine learning and related fields. The Brain MRI Dataset stands out with its extensive collection of over 7,000 human brain MRI images, categorized into glioma, meningioma, no tumor, and pituitary classes. This dataset offers a robust foundation for training machine learning models focused on BT classification. Additionally, the BT Dataset on Figshare provides over 3,000 T1-weighted contrast-enhanced images of BTs. These images are classified into glioma, meningioma, and pituitary categories.
In this paper, we applied a four-fold image augmentation process to increase the variability of the dataset and improve the model's robustness and generalization capabilities. This augmentation includes transformations such as rotation, flipping, scaling, and cropping, effectively generating four different versions of each image. With this four-fold augmentation, the Brain MRI Dataset increases from over 7,000 images to ~28,000 augmented images, and the BT Dataset grows from over 3,000 to around 12,000 images. These expanded datasets are split into training, validation, and test sets to ensure that the model encounters a variety of data during training. This comprehensive augmentation not only improves model accuracy but also strengthens its ability to generalize, making it more effective in classifying BTs in diverse clinical scenarios.
The different metrics used to evaluate the performance of the BT classification is listed as follows.
Accuracy: It measures the overall correctness of the classification by computing the ratio of correctly classified instances to the total number of instances.
Precision (positive predictive value): It explains how the model works when it predicts a BT (positive class).
Recall (sensitivity or true positive rate): It helps evaluates identification of actual cases of BTs by the model.
F1-score: It provides a balanced measure of a model's performance in binary classification tasks.
AUC-ROC: It quantifies the model's ability to distinguish between classes (e.g., glioma, meningioma, pituitary tumor) based on predicted probabilities.
Logarithmic loss (LogLoss): It evaluates how the model predicts the probabilities of glioma, meningioma, and pituitary tumor classes.
Balanced accuracy: It accounts for the imbalanced distribution of classes by averaging the recall of each class.
Specificity: It measures the proportion of actual negative cases that are correctly identified as negative.
Inference time: It refers to the time taken by the model to make a prediction for a single input instance during the testing phase, after the model has been trained.
Execution time: It refers to the total time required to complete the entire process of running the model, including loading the model, preprocessing the input, making predictions (inference), and any post-processing needed to output the result.
In the depicted Figure 4, a comprehensive representation of the pre-processing stages is showcased through a sequence of Figures 4a–c, each corresponding to a distinct BT case. The initial input Image reflects the raw state of the medical images before any processing. The subsequent Gaussian filtered image demonstrates the efficacy of Gaussian filtering, a step crucial for noise reduction and the elimination of unwanted variations in the images. Following this, the enhanced image illustrates the outcomes of histogram equalization and contrast stretching, emphasizing the improved visual quality and clarity of critical features. The final contrast stretched output image presents the refined result after contrast stretching, further enhancing image contrast for effective feature extraction. This progression highlights the success of the proposed pre-processing steps in preparing the BT images for advanced analysis, including feature extraction using PVT and TDA.

Figure 4. Pre-processing stages for different inputs. (a) Glioma. (b) Meningioma. (c) Pituitary.
The presented Figure 5 provides a details of the advanced stages of the proposed methodology for BT classification, specifically focusing on images enhanced with gadolinium contrast and incorporating DTI features. The image with gadolinium contrast and DTI features encapsulates crucial diagnostic information, showcasing the distinctive enhancement achieved through gadolinium contrast, a hallmark of certain BT types. This enhancement aids in emphasizing specific characteristics, such as increased vascularity crucial for accurate classification. Additionally, the incorporation of DTI features, including FA and MD, further enriches the feature set. These features play a pivotal role in capturing nuances related to tissue microstructure and water diffusion within the brain. The normalized output complements this by illustrating the refined and standardized representation of these enhanced features, ensuring consistency and facilitating robust feature extraction.
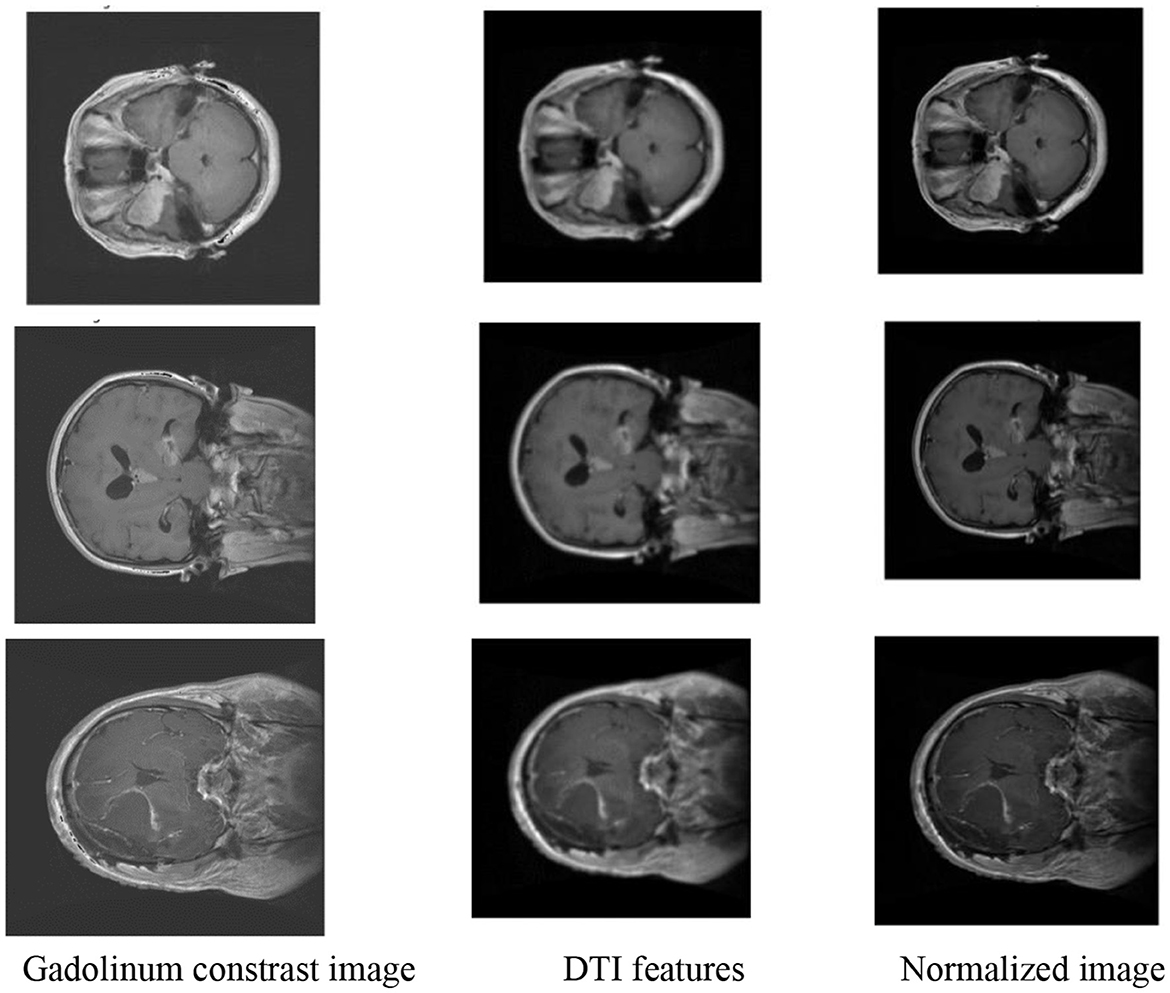
Figure 5. Feature extraction and normalization.
Figure 6 illustrates the partitioning of the enhanced and preprocessed BT images into smaller patches. This process involves the systematic partitioning of the preprocessed BT images into smaller patches, each serving as a localized input for subsequent analysis. The use of patches is a strategic approach, aligning with the PVT architecture employed in the methodology. By breaking down the images into smaller, manageable units, the PVT model can efficiently process and extract discriminative features from distinct regions. This patch-based strategy allows for a more nuanced understanding of the intricate details within the BT images, capturing variations in intensity, texture, and spatial relationships. The patched image output signifies the amalgamation of these localized inputs, forming a comprehensive representation that preserves both global and local contextual information. This approach, coupled with advanced feature extraction techniques, contributes to the robustness and efficacy of the overall BT classification system.
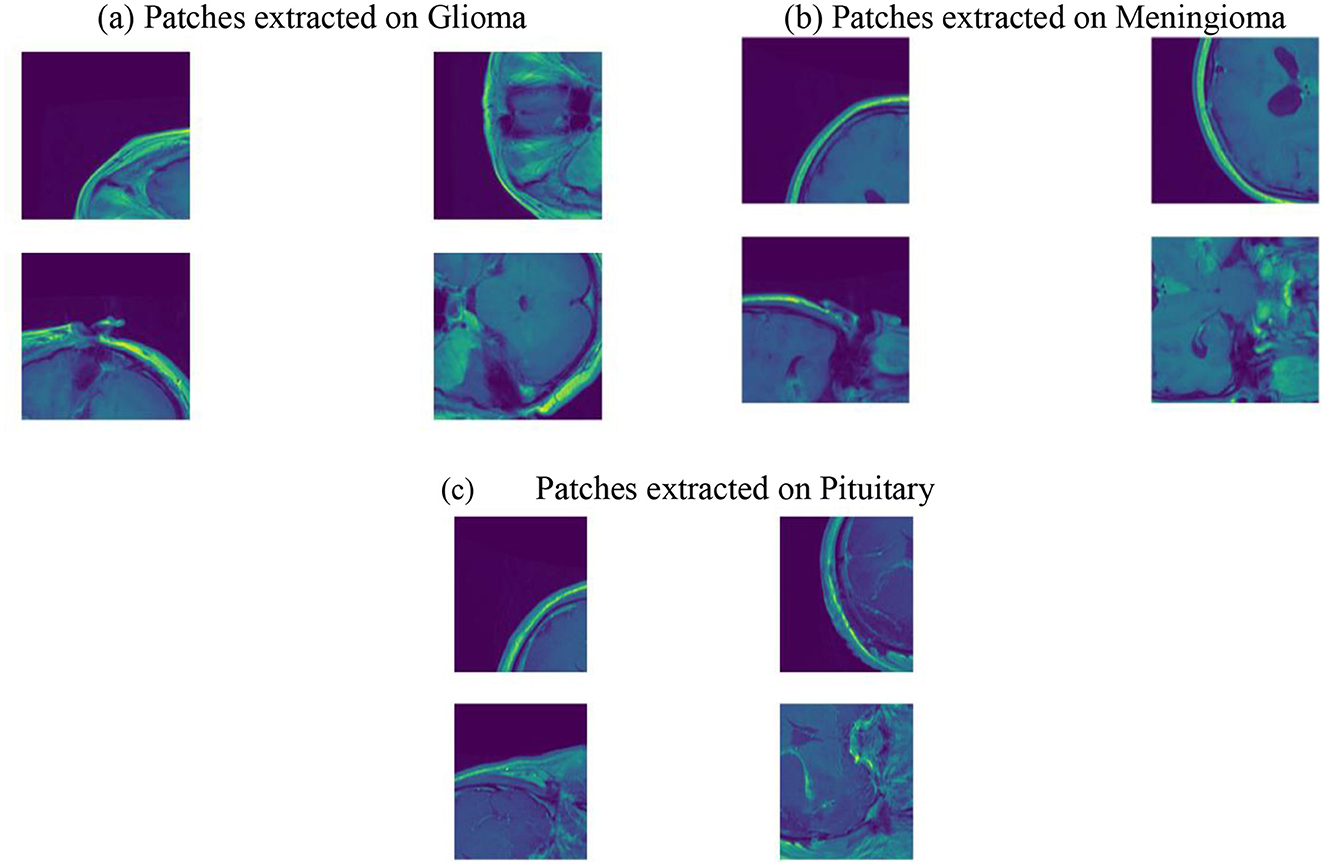
Figure 6. Patched images. (a) Patches extracted on Glioma. (b) Patches extracted on Meningioma. (c) Patches extracted on Pituitary.
Figure 7 depicts the transformation of preprocessed BT images into point clouds at two scale factors (1 and 2). This step is integral to the application of TDA using the Giotto-TDA framework. In the context of TDA, converting the preprocessed BT images into point clouds is paramount for capturing and analyzing their topological features. The images are transformed into point clouds using the ImageToPointCloud method, where each pixel's spatial coordinates are mapped to points in a cloud. The point-to-scale conversion depicted in the figure represents the adaptation of spatial features at different scales, a crucial aspect of understanding the hierarchical and persistent topological structures inherent in the BT data. At scale factors 1 and 2, the conversion process unveils the nuanced spatial relationships between points, contributing to the subsequent computation of persistent homology. This step enriches the representation of the BT images in a format conducive to extracting meaningful topological insights, ultimately enhancing the sophistication and accuracy of the classification system.
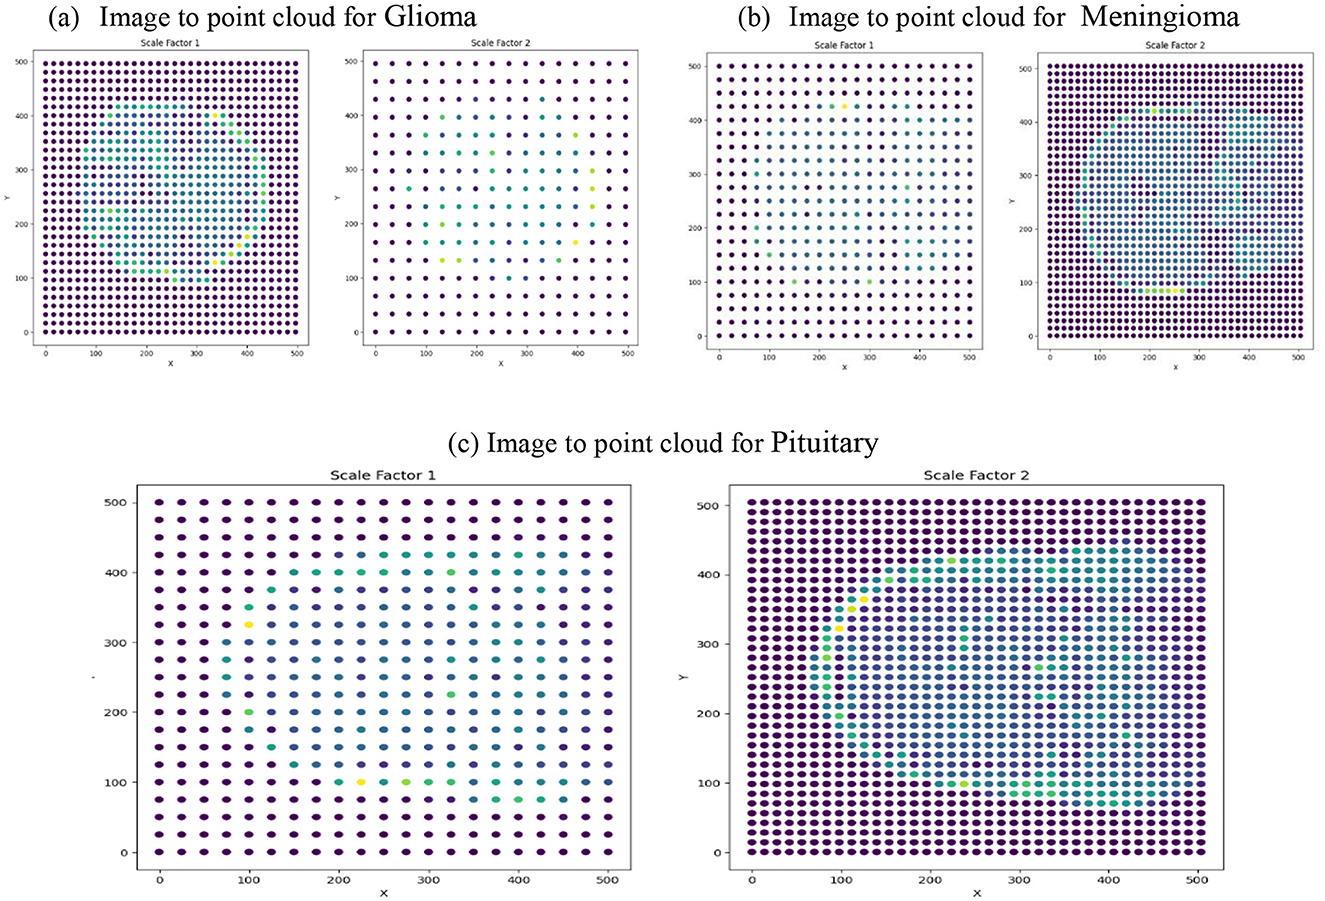
Figure 7. Image to point cloud conversion for different images at different scale factors. (a) Image to point cloud for Glioma. (b) Image to point cloud for Meningioma. (c) Image to point cloud for Pituitary.
Figure 8 presents a 3D scatter plot mapping image intensity values to pixel coordinates. This step is integral to the feature extraction process, specifically focusing on the spatial distribution of image intensities across the pixel coordinates. In the proposed methodology, the extraction of discriminative features involves a comprehensive analysis of various aspects, including image intensity, texture, shape, and size. The 3D scatter plot provides a visual representation of the variation in image intensity values across different pixel positions, contributing to the understanding of the spatial characteristics inherent in the BT images. The distribution of image intensities in a 3D space allows for the identification of patterns and trends that might be indicative of different tumors. This information, captured through the scatter plot, serves as a foundational element in the subsequent stages of feature fusion and classification. By comprehensively examining the spatial relationships of image intensities, the proposed methodology leverages this data-driven approach to enhance the classification accuracy, ultimately leading to more informed and reliable predictions of BT types based on their unique spatial characteristics.
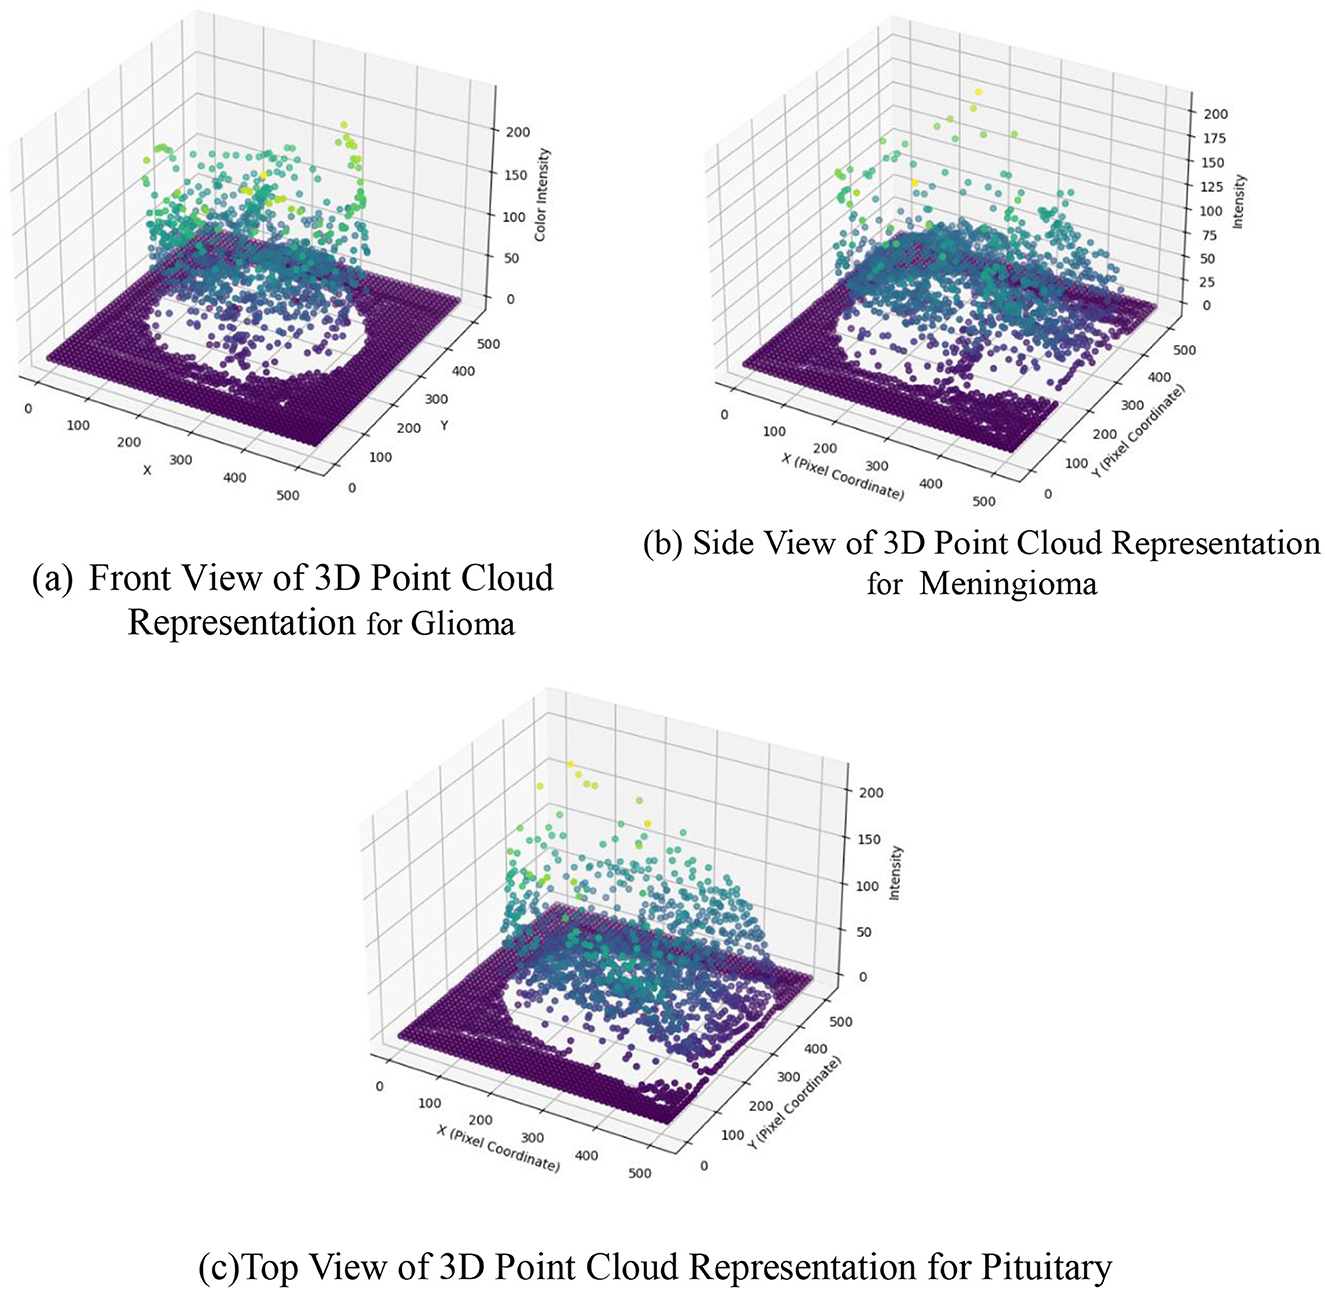
Figure 8. 3D scatter plot for image intensity in image to point cloud conversion. (a) Front view of 3D point cloud representation for Glioma. (b) Side view of 3D point cloud representation for Meningioma. (c) Top view of 3D point cloud representation for Pituitary.
The Figure 9 displaying the persistence diagram representation for the three input images encapsulates a crucial step in the proposed BT classification methodology. This method integrates TDA through Giotto-TDA, transforming preprocessed BT images into point clouds and subsequently computing persistent homology. The persistence diagram is a visual representation of the topological features revealed by the Vietoris-Rips filtration technique at various spatial scales. Here, each point in the persistence diagram represents the birth and death of a topological feature, revealing the persistent properties of the BT data at various sizes. Connected components (dimension 0) and 1-cycles (dimension 1) are represented, offering insights into the complex spatial relationships present in the BT images. The persistent homology computation allows the methodology to capture essential topological information, contributing to a nuanced understanding of the structural and spatial aspects of the BT data. By incorporating persistent homology, the proposed methodology not only considers traditional image features but also explores the inherent topological features that might be indicative of specific tumor types. This enriched representation enhances the discriminative power of the model, leading to more robust and accurate classification results.
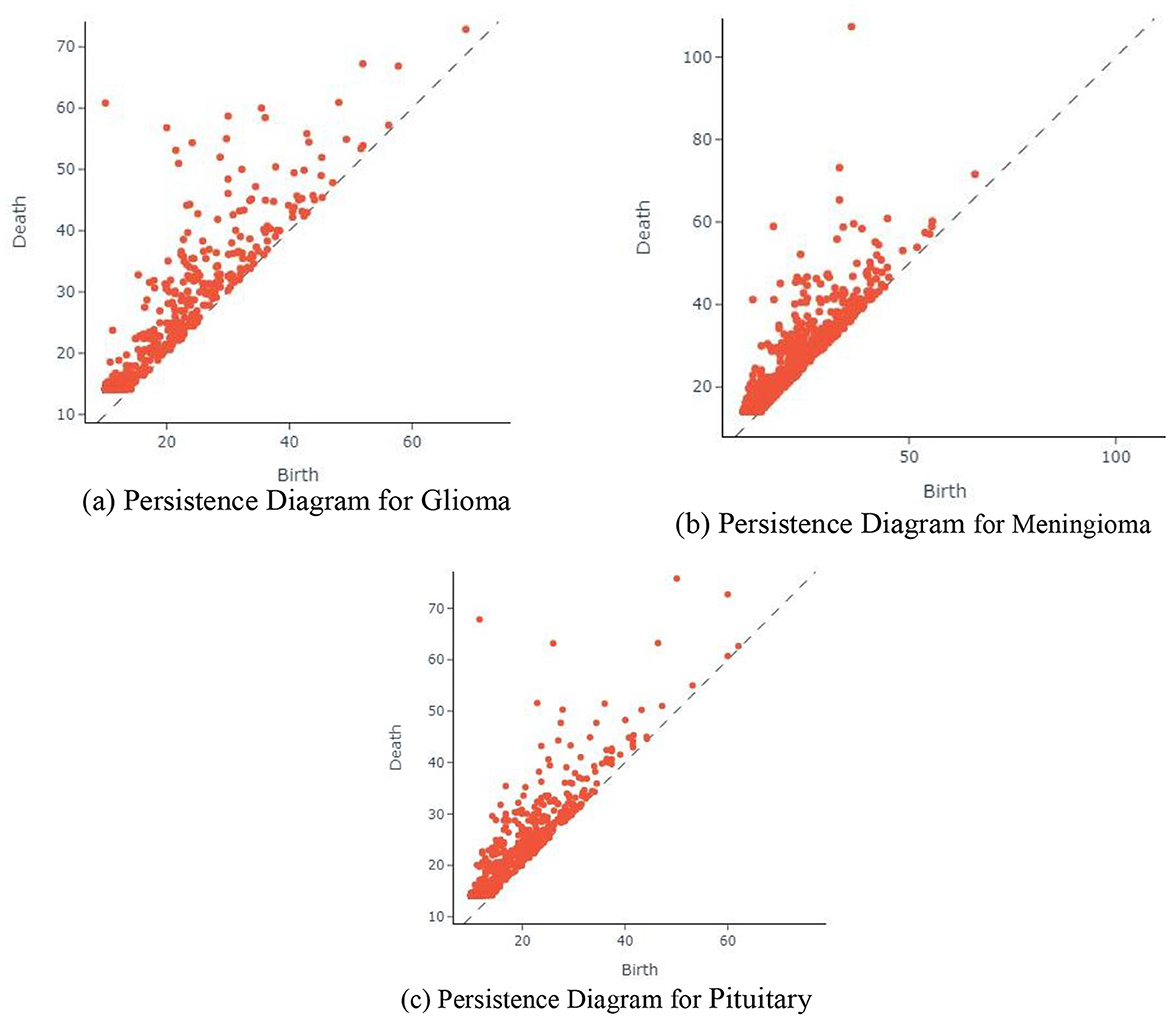
Figure 9. Persistence diagram for different input images. (a) Persistence diagram for Glioma. (b) Persistence diagram for Meningioma. (c) Persistence diagram for Pituitary.
The presented Figure 10 portraying the glioma, meningioma, and pituitary BT classification images is a direct outcome of the comprehensive BT classification methodology proposed earlier. This methodology incorporates advanced techniques, including PVT with adaptive deformable attention and TDA through Giotto-TDA. The categorized images in the classification showcase the models proficiency in distinguishing and classifying various BT types using a wide range of intricate features. The PVT with adaptive deformable attention plays a pivotal role in extracting discriminative features from preprocessed BT images, combining the strengths of CNNs and Transformer models. Moreover, the integration of TDA through Giotto-TDA adds a layer of sophistication to the classification process. By transforming preprocessed BT images into point clouds and computing persistent homology, the methodology captures essential spatial relationships and topological features inherent in the data. This nuanced understanding contributes to the accurate and nuanced classification of BTs. The classification images presented in the figure are the visual manifestation of the model's ability to distinguish between different tumor types, showcasing the effectiveness of the proposed methodology. The enriched representation, encompassing both traditional image features and topological insights, results in a more informed and precise classification, crucial for advancing medical image analysis in the context of BT diagnosis.
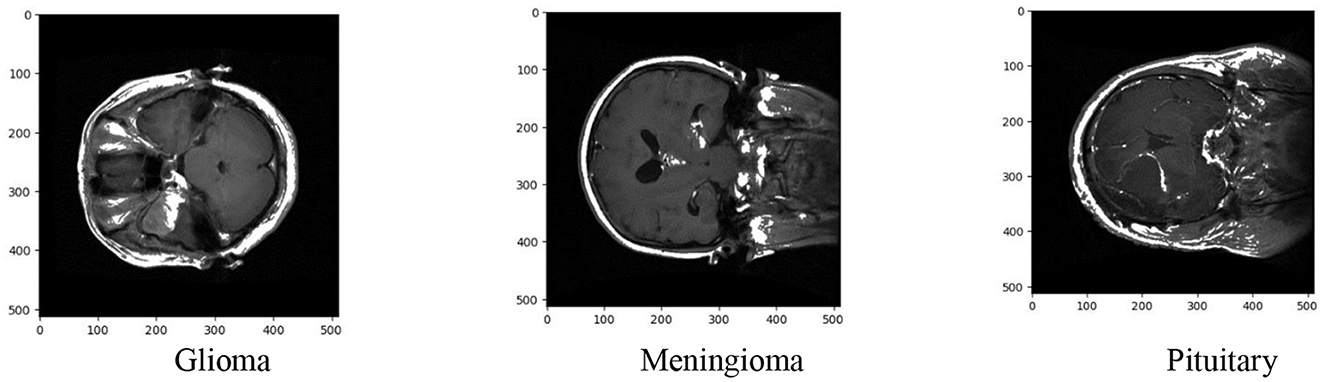
Figure 10. BT classification.
The performance comparison is done for the different methods like RCNN (Kesav and Jibukumar, 2022), LCDEiT (Ferdous et al., 2023), two channel DNN (Bodapati et al., 2021), CNN+SVM (Deepak and Ameer, 2021a), SNN (Deepak and Ameer, 2021b), BTC-FCNN (Abd El-Wahab et al., 2023), and proposed method. The Table 2 presents a comprehensive comparison of performance metrics for various BT classification methods, including PDCNN, RCNN, LCDEiT, Two channel DNN, CNN+SVM, SNN, BTC-FCNN, RanMerFormer, and the proposed approach. Each method is evaluated based on accuracy, precision, recall and F1-score. The proposed methodology achieves exceptional performance in BT classification due to several key innovations. The PVT with deformable attention dynamically focuses on relevant regions of MRI images, enhancing feature extraction. Adaptive feature sampling and TDA capture complex patterns and uncover topological features, providing richer insights into tumor structure. Additionally, the fusion of deep features from PVT with topological features from TDA improves model robustness. The use of a Random Forest classifier ensures reliable predictions, resulting in superior accuracy (99.2%), precision (98.9%), recall (99.35%), and F1-score (99.12%) compared to other methods.
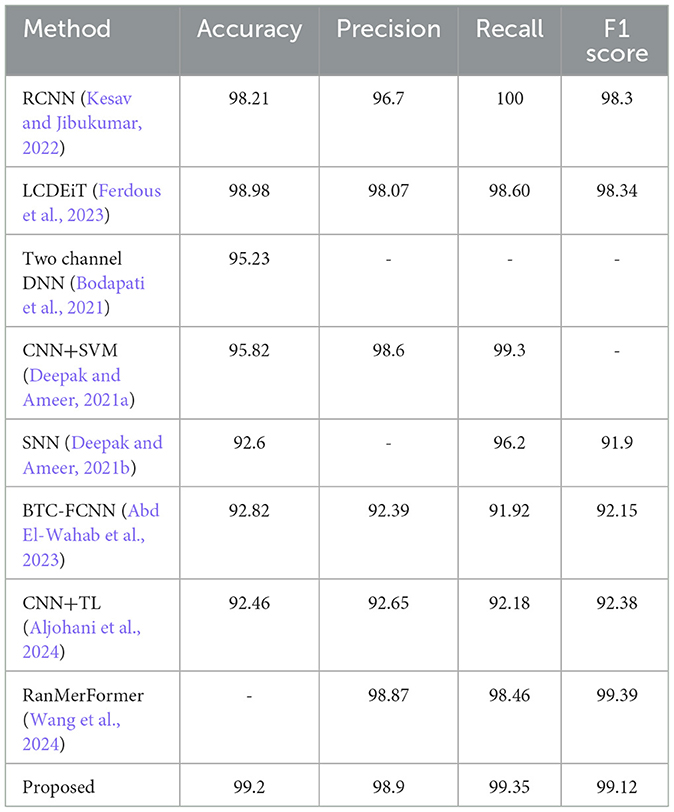
Table 2. Analysis of performance evaluation.
The PVT+TDA methodology achieves results with an accuracy of 99.2%, marginally outperforming RanMerFormer. While the differences in precision, recall, and F1-score are within a margin of error, the proposed framework introduces novel contributions such as the integration of topological features using TDA and adaptive deformable attention mechanisms within the PVT architecture. These innovations enhance interpretability and robustness, providing a unique advantage despite closely matched performance metrics.
The proposed method has the highest accuracy at 99.2% and holds a high score in precision (98.9%), recall (99.35%), and F1 score (99.12%) as well, showing robustness and better performance. LCDEiT (Ferdous et al., 2023) achieved an accuracy of 98.98% and balanced precision (98.07%), recall (98.60%), and F1 scores (98.34%). RCNN (Kesav and Jibukumar, 2022) achieves an accuracy at 98.21% but lower precision at 96.7%. Methods such as CNN+SVM (Deepak and Ameer, 2021a) achieve a precision of 98.6% and RanMerFormer (Wang et al., 2024) achieve a precision of 98.87%. While BTC-FCNN (Abd El-Wahab et al., 2023) achieves 98.82% accuracy and CNN+TL (Aljohani et al., 2024) yield 92.46% accuracy but their performance is surpassed by the proposed PVT+TDA method. The proposed method's superiority is attributed to the integration of advanced techniques in deep feature extraction, leveraging the PVT with adaptive deformable attention. This architecture facilitates efficient patch-based processing and global contextual understanding of the model. Additionally, the incorporation of TDA through Giotto-TDA further elevates the proposed methodology. The transformation of preprocessed BT images into point clouds, coupled with Vietoris-Rips filtration for persistent homology computation, allows for the capture of essential spatial relationships and topological features. This holistic approach, integrating spatial and topological information, contributes to a nuanced understanding of the underlying structure of BT images, resulting in more informed and accurate classifications. The proposed method's impressive scores across multiple metrics underscore its efficacy and potential for advancing BT classification methodologies. The classification results for meningioma, pituitary, and glioma tumors are graphically shown by the confusion matrix in Figure 11.
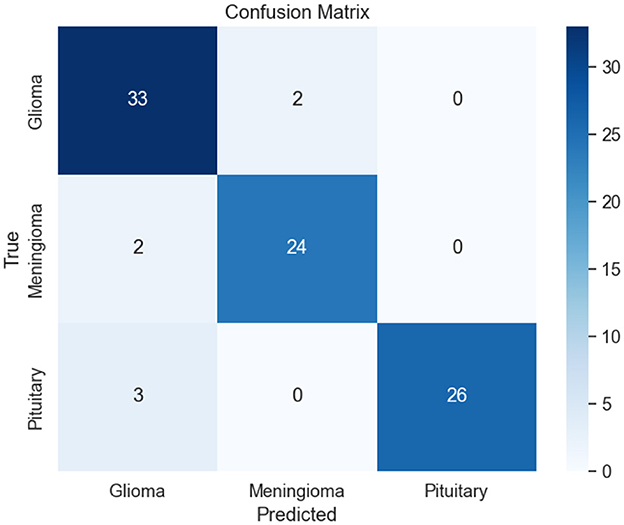
Figure 11. Confusion matrix.
In the context of glioma classification, 33 images are correctly identified as glioma, demonstrating the model's accuracy in recognizing this tumor type. Nevertheless, two images are erroneously categorized as meningioma, suggesting cases where the model mislabeled glioma images as meningioma. Regarding meningioma classification, the model correctly recognizes 24 images as meningioma. However, there are 2 instances where images are misclassified as glioma, suggesting some confusion between these two tumor types. In the case of pituitary tumor classification, the model successfully classifies 26 images as pituitary. Unfortunately, there are 3 instances where images are misclassified as glioma, highlighting potential challenges in distinguishing between these tumor types.
The ROC-AUC curve presented in the Figures 12a–c illustrates the classification performance for three types of BTs. The AUC values associated with each tumor type provide a quantitative measure of the model's ability to distinguish between positive and negative instances for that specific class for different methods such as RCNN (Kesav and Jibukumar, 2022), CNN+SVM (Deepak and Ameer, 2021a), 3DUV-NetR+ (Aboussaleh et al., 2024), CNN+TL (Aljohani et al., 2024), and the proposed method. For glioma (class 0), the AUC value is 0.96. This indicates that the model has a high discriminatory power in distinguishing between true positive and false positive instances for glioma classification. A higher AUC value suggests a better performance in terms of sensitivity and specificity. In the case of meningioma (class 1), the AUC value is 0.99. This exceptionally high value signifies an excellent ability of the model to differentiate between meningioma and non-meningioma cases. A model's discriminatory performance is deemed better when the AUC value approaches 1. For pituitary tumors (class 2), the AUC value is 0.97. This indicates a strong performance in distinguishing pituitary tumors from other types.
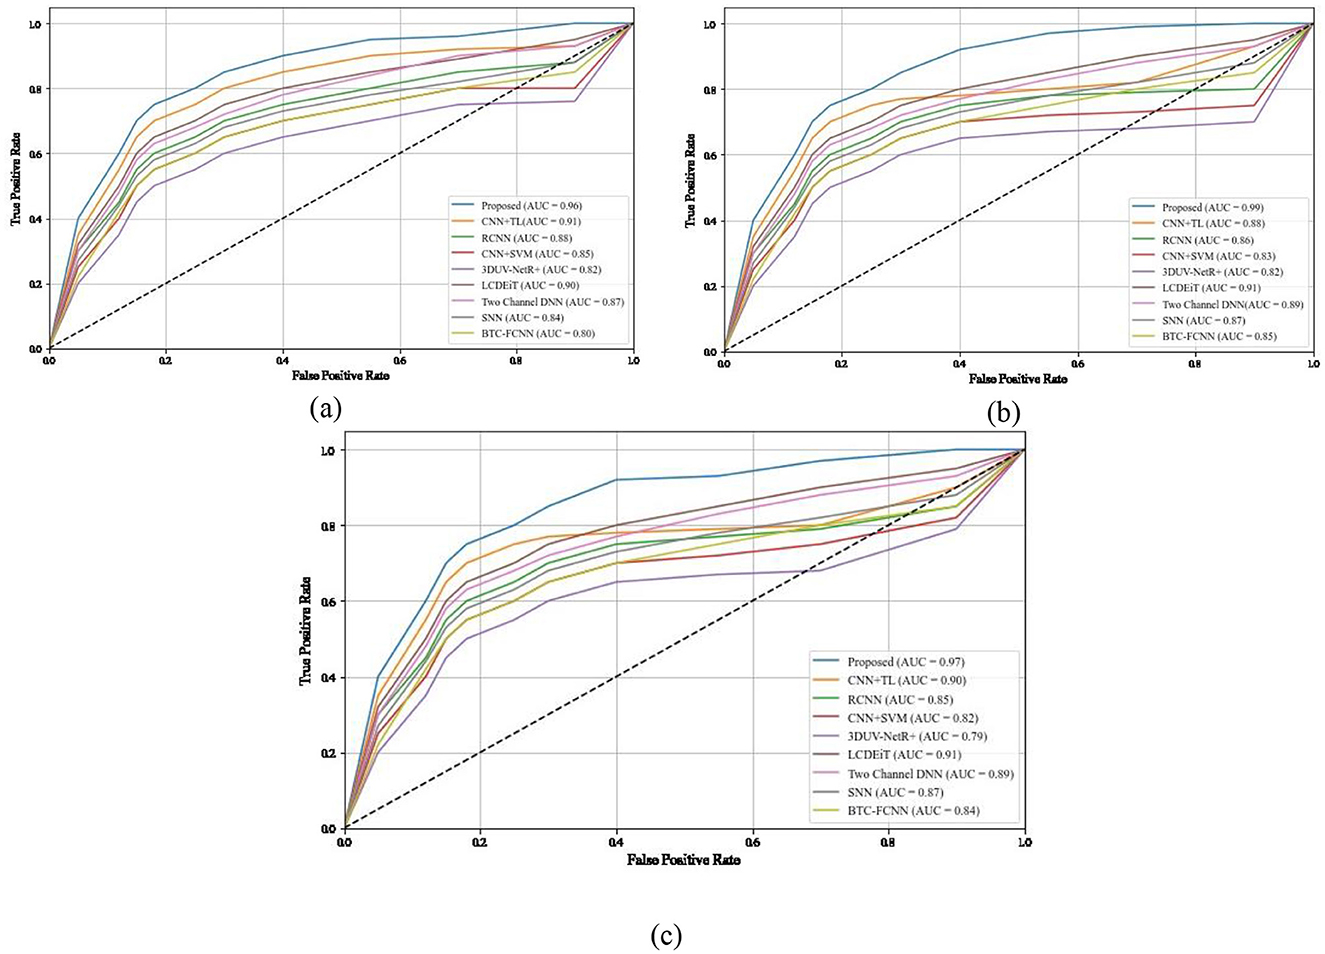
Figure 12. ROC and AUC comparison of different methods for different classes (a) class 0, (b) class 1, (c) class 2.
The high ROC-AUC values in the proposed methodology are due to several key factors. The PVT with deformable attention captures relevant features by dynamically focusing on important regions of MRI images, improving classification accuracy. Adaptive feature sampling refines these features, while the integration of TDA adds topological insights, enhancing the model's ability to distinguish between tumor types. Additionally, the Random Forest classifier efficiently handles complex decision boundaries, further boosting the model's performance. These combined approaches contribute to the model's excellent discriminatory power across glioma, meningioma, and pituitary tumors.
The depicted Figure 13 provides a comprehensive overview of the execution times for diverse BT classification methods, including RCNN (Kesav and Jibukumar, 2022), LCDEiT (Ferdous et al., 2023), Two channel DNN (Bodapati et al., 2021), CNN+SVM (Deepak and Ameer, 2021a), SNN (Deepak and Ameer, 2021b), BTC-FCNN (Abd El-Wahab et al., 2023),3DUV-NetR+ (Aboussaleh et al., 2024), CNN+TL (Aljohani et al., 2024) and our proposed methodology combining Giotta-TDA with PVT featuring adaptive deformable attention. Notably, CNN+SVM exhibits a relatively prolonged execution time of 20 s. In comparison, the SNN requires 18 s, and the RCNN takes 15 s. LCDEiT, emphasizing long-range context understanding, achieves a more efficient execution time at 8 s.
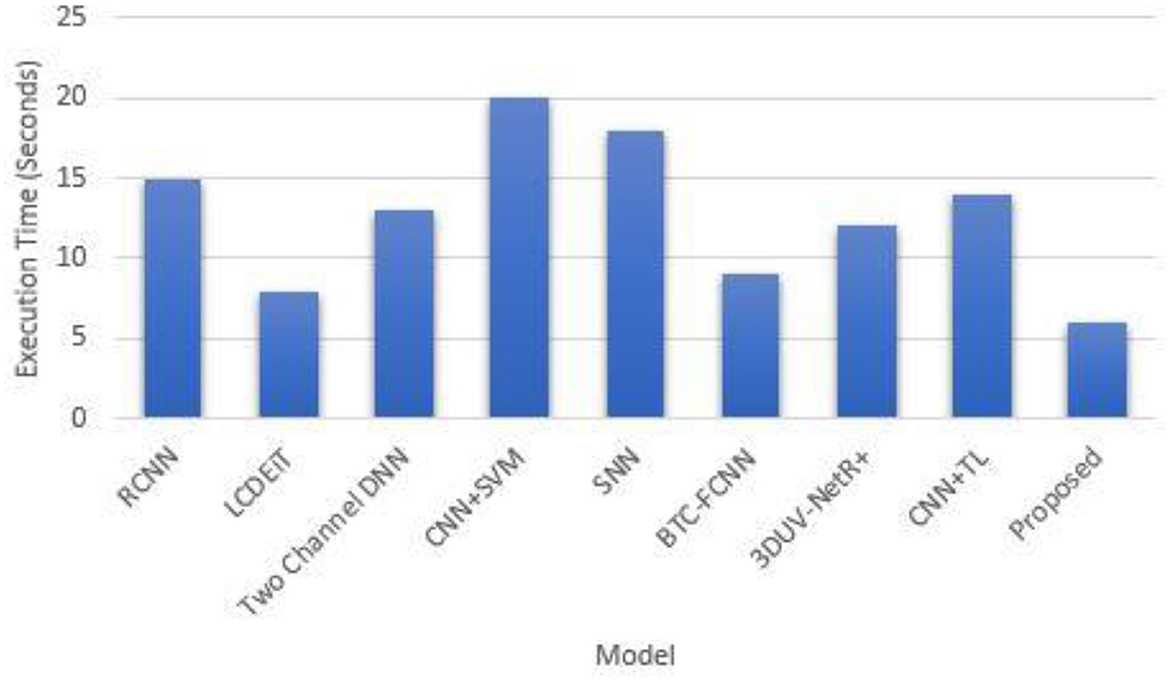
Figure 13. Execution time comparison.
The relatively faster execution time of the proposed methodology, which combines Giotto-TDA with PVT featuring adaptive deformable attention, can be attributed to several factors. First, the use of the PVT model with deformable attention allows the network to dynamically focus on the most relevant regions of the MRI images, thereby reducing the computational burden by processing only important features. Additionally, the adaptive sampling mechanism optimizes feature extraction, leading to more efficient processing. Giotto-TDA, which transforms the image data into point clouds, captures essential topological features without introducing significant computational overhead. Together, these components enable the model to achieve high performance with relatively low execution time compared to other methods like CNN+SVM, RCNN, and SNN, which rely on more computationally intensive operations. Table 3 presents the performance comparison for Matthew's correlation coefficient, LogLoss, balanced accuracy and specificity.
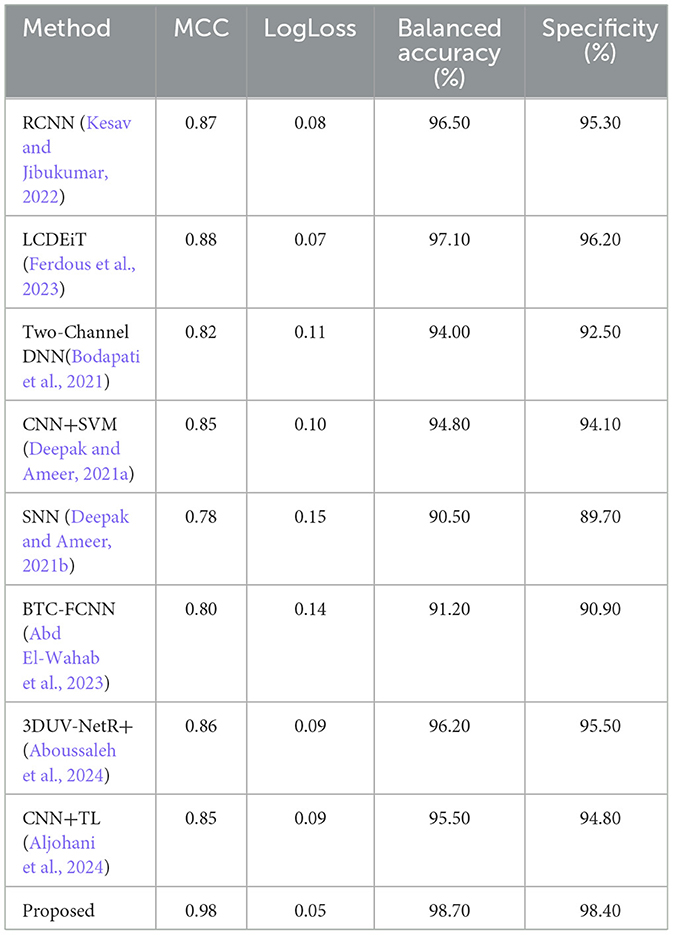
Table 3. Performance comparison for Matthew's correlation coefficient, LogLoss, balanced accuracy, and specificity.
Figure 14 presents the Matthew's correlation coefficient for different methods such as RCNN (Kesav and Jibukumar, 2022), LCDEiT (Ferdous et al., 2023), two channel DNN (Bodapati et al., 2021), CNN+SVM (Deepak and Ameer, 2021a), SNN (Deepak and Ameer, 2021b), BTC-FCNN (Abd El-Wahab et al., 2023), 3DUV-NetR+ (Aboussaleh et al., 2024), CNN+TL (Aljohani et al., 2024), and our proposed methodology combining Giotta-TDA with PVT featuring adaptive deformable attention. The MCC is a widely used performance metric that provides a balanced assessment of a model's ability to classify both positive and negative instances, ranging from −1 to 1, where 1 indicates a perfect classification, 0 indicates a random classification, and −1 indicates a completely inverse classification. The proposed methodology achieves the highest MCC value of 0.98, indicating that it has the best overall classification performance among the models compared. The LCDEiT (Ferdous et al., 2023) model has the second-highest MCC value of 0.88, followed by the 3DUV-NetR+ (Aboussaleh et al., 2024) model with 0.86. The Two channel DNN (Bodapati et al., 2021) have an MCC value of 0.82 and BTC-FCNN (Abd El-Wahab et al., 2023) have an MCC value of 0.80, while the CNN+TL (Aljohani et al., 2024) model has an MCC value of 0.85. The SNN (Deepak and Ameer, 2021b) model has an MCC value of 0.76, and the CNN+SVM (Deepak and Ameer, 2021a) model has the MCC value of 0.85. This graph provides a clear visual comparison of the MCC values for the different models, allowing for easy identification of the best-performing model in this particular study. The superior Matthew's Correlation Coefficient (MCC) of 0.98 achieved by the proposed methodology can be attributed to its effective integration of Giotto-TDA and PVT with adaptive deformable attention. The Giotto-TDA technique helps capture topological features that enhance the model's ability to distinguish between both positive and negative instances. Meanwhile, the PVT with adaptive deformable attention dynamically focuses on relevant areas of the BT images, improving classification accuracy.
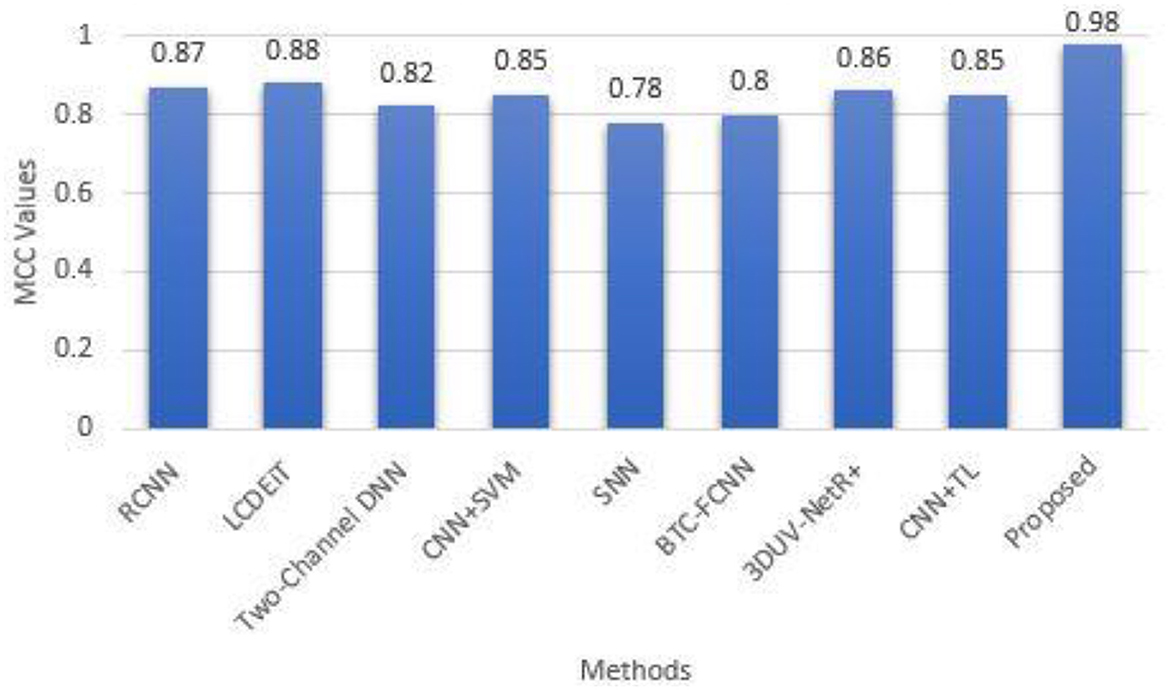
Figure 14. Matthew's correlation coefficient for different methods.
Figure 15 presents a comparison of the LogLoss metric across different classification methods. The LogLoss metric is a measure of the performance of a classification model, where a lower value indicates better performance. The methods compared and their corresponding LogLoss values are: RCNN (Kesav and Jibukumar, 2022) (0.08), LCDEiT (Ferdous et al., 2023) (0.07), Two-Channel DNN (0.11), CNN+SVM (Deepak and Ameer, 2021a) (0.10), SNN (Deepak and Ameer, 2021b) (0.15), BTC-FCNN (Abd El-Wahab et al., 2023) (0.14), 3DUV-NetR+ (Aboussaleh et al., 2024) (0.09), CNN+TL (Aljohani et al., 2024) (0.09), and a proposed PVT+TDA method (0.05). The key finding from the graph is that the PVT+TDA method outperforms all the other methods, with the lowest LogLoss value of 0.05, indicating the best classification performance among the methods compared. The other methods have varying levels of performance, with LCDEiT (Ferdous et al., 2023) performing the best among the non-Proposed methods, followed by RCNN (Kesav and Jibukumar, 2022), 3DUV-NetR+ (Aboussaleh et al., 2024), and CNN+TL (Aljohani et al., 2024). The Two-Channel DNN, CNN+SVM (Deepak and Ameer, 2021a), SNN (Deepak and Ameer, 2021b), and BTC-FCNN (Abd El-Wahab et al., 2023) methods have higher LogLoss values, indicating poorer performance compared to the top-performing methods. The proposed method achieves the lowest LogLoss value of 0.05 due to its effective combination of Giotto-TDA and PVT with adaptive deformable attention. Giotto-TDA enhances the model's ability to capture critical topological features from the BT images, allowing for more accurate and confident predictions. The PVT with adaptive deformable attention optimizes the focus on relevant image areas, leading to more precise classifications.
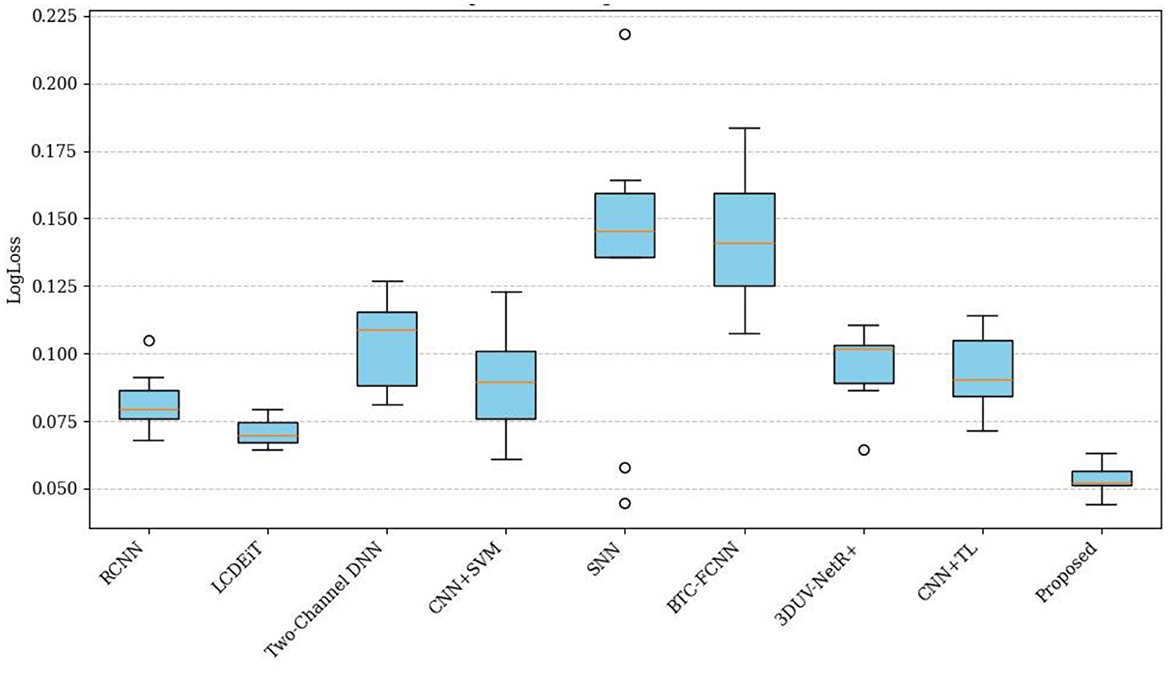
Figure 15. Comparison of LogLoss across different methods.
Figure 16 presents a comparison of the balanced accuracy (%) across different classification methods. The proposed PVT+TDA achieving the highest balanced accuracy of 98.70%, indicating the best classification performance. The LCDEiT (Ferdous et al., 2023) method also performs well, with a balanced accuracy of 97.10%, followed by RCNN (Kesav and Jibukumar, 2022) and 3DUV-NetR+ (Aboussaleh et al., 2024) which have balanced accuracies of 96.50 and 96.20%, respectively. The remaining methods, including Two-Channel DNN (94.00%), CNN+SVM (Deepak and Ameer, 2021a) (94.80%), SNN (Deepak and Ameer, 2021b) (90.50%), and BTC-FCNN (Abd El-Wahab et al., 2023) (91.20%), have lower balanced accuracy values, indicating poorer performance compared to the top-performing methods. The proposed method achieves the highest balanced accuracy of 98.70% due to its innovative use of Giotto-TDA for extracting complex topological features, combined with the PVT that adapts to different spatial contexts through deformable attention. This combination ensures the model effectively captures both global and local patterns in BT images, leading to superior classification performance. The adaptability and precision of the proposed methodology allow it to achieve a balanced accuracy that outperforms all other methods, demonstrating its robustness and reliability in distinguishing tumor types.
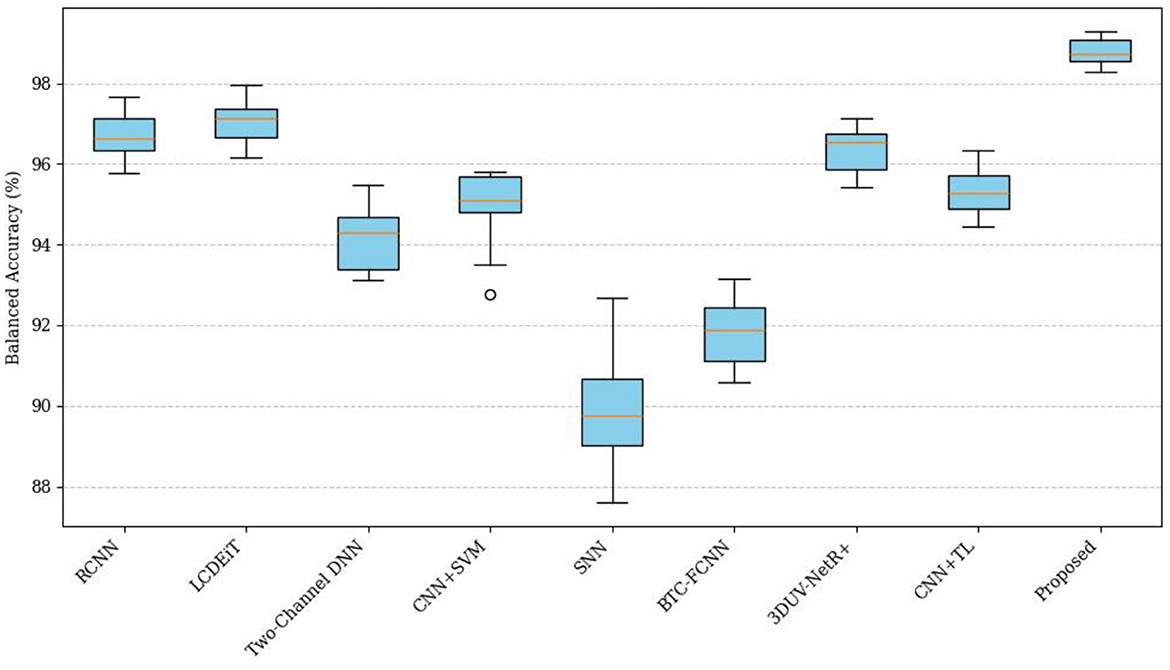
Figure 16. Comparison of balanced accuracy across different methods.
Figure 17 presents a comparison of the specificity (%) across different classification methods. The comparative analysis of Specificity (%) across various methods reveals significant performance differences. The Proposed PVT+TDA achieves the highest specificity at 98.40%, demonstrating its superior ability to correctly identify negative instances compared to the other methods. This is closely followed by LCDEiT (Ferdous et al., 2023) at 96.20% and 3DUV-NetR+ (Aboussaleh et al., 2024) at 95.50%, which also show robust performance. RCNN (Kesav and Jibukumar, 2022) and CNN+TL (Aljohani et al., 2024) achieve specificity values of 95.30 and 94.80%, respectively, indicating competitive results. In contrast, methods such as Two-Channel DNN and CNN+SVM (Deepak and Ameer, 2021a) exhibit moderate specificity values of 92.50 and 94.10%, respectively. SNN (Deepak and Ameer, 2021b) and BTC-FCNN (Abd El-Wahab et al., 2023) display the lowest specificity scores at 89.70 and 90.90%, suggesting need for improvement in their negative instance classification. The performance of the proposed method is due to its advanced approach, combining Giotto-TDA for extracting topological features with the PVT that utilizes adaptive deformable attention. This integration allows the model to capture both fine-grained local details and global spatial context, resulting in more specific robust classifications.
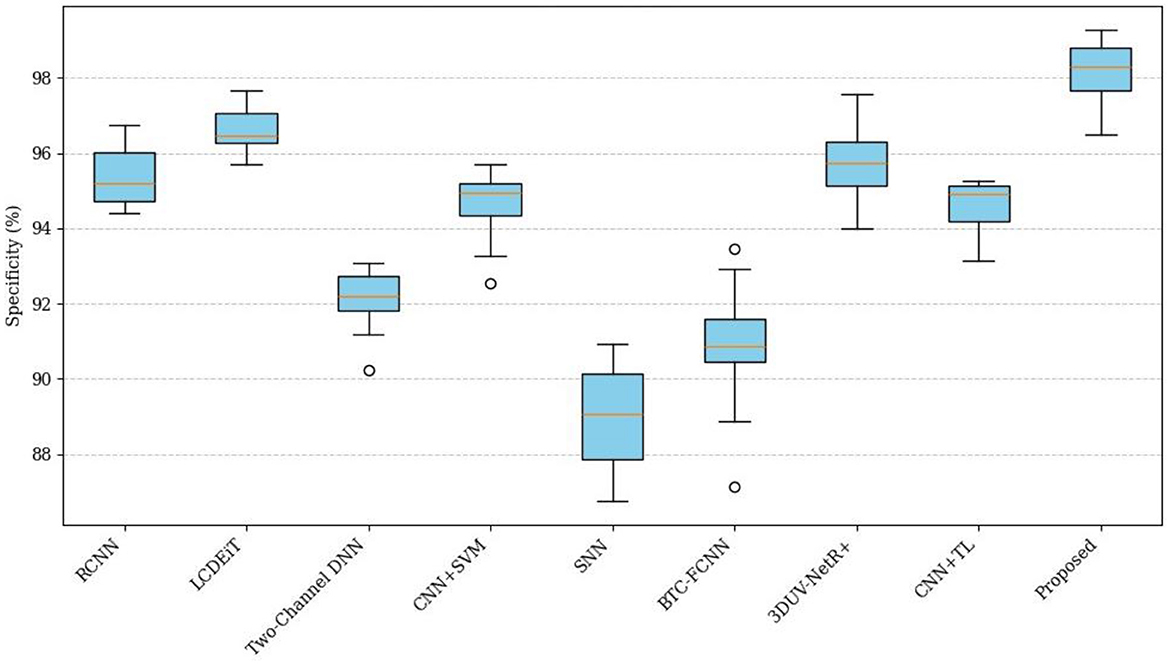
Figure 17. Comparison of specificity across different methods.
The ablation study provided compares the performance of different configurations of the model, which utilizes a PVT in combination with various attention mechanisms. The goal is to assess how different components, such as DA and TDA, contribute to the model's overall performance. The proposed methodology achieves its exceptional performance through the strategic integration of PVT with DA and TDA. The baseline PVT model demonstrates strong results, but the addition of DA improves spatial attention, allowing the model to focus on relevant features more flexibly, enhancing accuracy and efficiency. The further integration of TDA helps capture temporal dependencies, boosting overall performance. The full model, combining both DA and TDA, achieves the highest metrics, including a remarkable accuracy of 99.2%, due to its ability to effectively extract and process complex features from the input data while maintaining computational efficiency.
The baseline model, which consists of the PVT alone, already demonstrates strong performance with an accuracy of 95.3%, a precision of 94.8%, a recall of 95.1%, and an F1-score of 94.9%. The MCC, which balances the influence of true and false positives and negatives, is 0.87, indicating solid model performance. The base model achieves an execution time of 8 s and an inference time of 30 ms per sample. Despite its efficiency, there is potential for improvement through enhanced attention mechanisms.
Introducing Deformable Attention improves the performance, with accuracy rising to 97.6%, precision to 97.2%, recall to 97.8%, and the F1-score to 97.5%. The MCC increases to 0.92, reflecting a better balance in handling both positive and negative classifications. Deformable Attention enhances the model by focusing on relevant spatial locations with more flexibility, allowing the network to capture intricate features in data. The execution time decreases to 7 s, and the inference time slightly reduces to 28 ms, suggesting that the additional attention mechanism does not significantly impact computational efficiency.
Further integration of TDA with the PVT boosts performance even further. The accuracy increases to 98.1%, with precision at 97.9%, recall at 98.2%, and an F1-score of 98.0%. The MCC reaches 0.93, reflecting stronger performance in both positive and negative classification. While the execution time slightly increases to 7.5 s, the inference time increases to 32 ms, indicating that the addition of temporal attention mechanisms may demand slightly more computational resources. However, the improvements in accuracy and other metrics justify this trade-off.
The most effective configuration is the Full Model, which combines both DA and TDA with PVT. This configuration achieves the highest performance across all metrics: an accuracy of 99.2%, precision of 98.9%, recall of 99.35%, and an F1-score of 99.12%. The MCC reaches a near-perfect value of 0.98, signaling that the model excels in correctly classifying both positive and negative samples. Additionally, this configuration achieves the fastest execution time of 6 s and an inference time of 29 ms, striking a balance between accuracy and computational efficiency. Table 4 presents the ablation study for the proposed methodology.
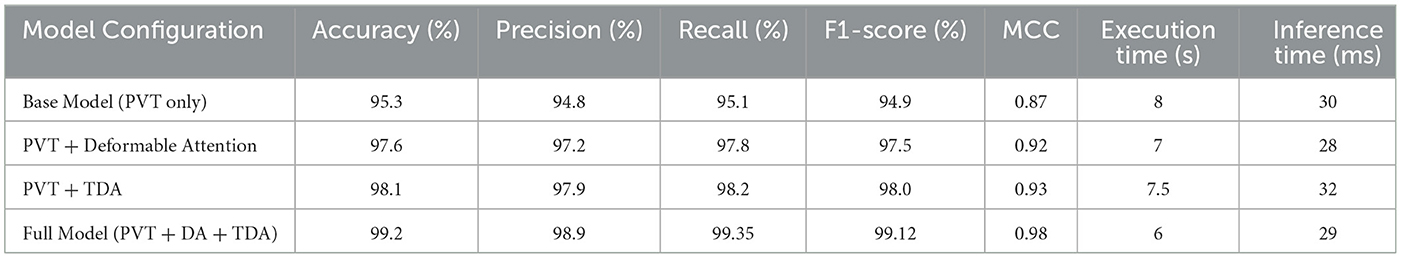
Table 4. Ablation study.
The integration of PVT with TDA in the proposed BT classification framework addresses critical limitations found in existing methodologies, enhancing both classification accuracy and efficiency. Traditional models, such as those by Kesav and Jibukumar (2022) and Bodapati et al. (2021), primarily rely on CNNs, which are adept at local feature extraction but face challenges in capturing global contextual information and handling complex spatial relationships. These limitations often lead to suboptimal performance when classifying intricate tumor structures. Similarly, vision transformer-based models like LCDEiT (Ferdous et al., 2023) and RanMerFormer (Wang et al., 2024), though effective in improving data efficiency and reducing computational complexity, can still be hindered by their high computational demands and limited adaptability to diverse data types. Furthermore, approaches that depend on pre-trained networks, such as the Two-Channel DNN by Bodapati et al. (2021), or simplified models like the BTC-fCNN (Abd El-Wahab et al., 2023), often fall short in capturing complex tumor features or fail to scale well with large datasets.
The PVT, however, offers a significant improvement with its hierarchical structure and adaptive deformable attention mechanism. This combination enables the model to capture both local and global features dynamically, addressing the shortcomings of CNNs and traditional vision transformers. Yet, PVT alone does not fully capture the topological aspects of the data, which are vital for understanding tumor structures in their entirety. This is where Giotto-TDA, a powerful tool for Topological Data Analysis, enhances the framework. TDA introduces a novel perspective by transforming MRI images into point clouds and calculating persistent homology, which reveals crucial topological features such as connected components and holes. These topological insights are often overlooked by traditional image analysis methods but are essential for a deeper understanding of tumor morphology.
The fusion of deep features extracted by PVT with the topological insights derived from TDA significantly improves the classification system's robustness and accuracy. By combining the strengths of both approaches, this integrated framework overcomes the limitations of existing methods and offers a more comprehensive solution for BT classification.
The specific advantages of this integrated approach include:
• Enhanced Feature Representation: The combined use of PVT and TDA enables the model to capture both low-level pixel information and high-level topological structures, improving classification accuracy by offering a richer set of features.
• Improved Adaptability and Generalization: The adaptive attention mechanism in PVT, along with the topological perspective from TDA, enhances the model's ability to adapt to varying tumor shapes, sizes, and characteristics, making it more robust and generalizable across different datasets.
• Reduced Computational Complexity: The deformable attention mechanism in PVT dynamically focuses on relevant regions within the image, reducing unnecessary computations. TDA complements this by providing succinct, computationally efficient topological features that capture essential tumor structures without overwhelming the model's resources.
Thus, the integration of PVT with TDA is not only a novel approach but also a strategic choice that addresses the specific limitations of previous methods.
The proposed methodology for BT classification, integrating PVT with adaptive deformable attention and TDA, has demonstrated exceptional performance in terms of accuracy, precision, and computational efficiency. While the results highlight the robustness of the approach, a critical examination reveals several aspects warranting further consideration:
• The adaptive deformable attention mechanism within the PVT dynamically adjusts receptive fields, enhancing the model's ability to capture both local and global features. This overcomes limitations of conventional fixed-attention approaches and enables nuanced feature extraction for varied tumor structures.
• The integration of TDA via Giotto-TDA brings a novel dimension to feature representation by incorporating topological features. This improves interpretability and robustness, offering insights beyond conventional numerical analysis.
• The approach is appropriate for real-time applications since it strikes a balance between execution and inference times.
• Superior metrics such as accuracy (99.2%), recall (99.35%), and F1-score (99.12%) underscore the system's efficacy in addressing diverse and complex tumor datasets.
• Despite being large, the experiments were carried out on a particular dataset, which might not fully represent the range of MRI imaging differences found in the real world. The generalizability of the model must be verified through testing on bigger, more varied datasets.
• Although computational efficiency is emphasized, the system's reliance on advanced components like deformable attention and TDA could present challenges in resource-constrained environments.
To build on the strengths of this work and address its limitations, several directions for future research are proposed:
• Evaluate the framework using multi-center, multi-modal datasets that include variations in scanner types, imaging protocols, and demographic factors to ensure robustness and generalizability.
• Incorporate additional imaging modalities, such as CT scans and PET imaging, to enhance diagnostic comprehensiveness.
• Develop end-to-end systems integrating segmentation, classification, and visualization tools for seamless integration into clinical workflows.
• Include explainable AI components to assist radiologists in interpreting model decisions, especially with topological features derived from TDA.
• Introduce self-supervised learning techniques to improve feature extraction from unlabeled datasets, addressing data scarcity challenges.
• By addressing these areas, the proposed methodology can evolve into a more versatile and clinically impactful system, advancing the field of automated medical imaging analysis and contributing to improved patient outcomes.
In conclusion, this paper introduces a novel methodology for BT classification that effectively combines deep learning techniques and TDA to tackle challenges in medical image analysis. The key contribution lies in integrating a PVT with an adaptive deformable attention mechanism, which dynamically adjusts receptive fields based on tumor complexity, leading to improved capture of both global context and local features in MRI images. This enables the model to better handle diverse tumor types and variations. Additionally, the use of TDA through Giotto-TDA transforms preprocessed images into point clouds, providing topological insights that improve the model's understanding of spatial relationships, thereby enhancing feature extraction. The adaptive deformable attention mechanism, with its ability to adjust sampling rates and utilize hierarchical dynamic position embeddings, enhances the model's context-awareness and robustness. These innovations, supported by a Random Forest classifier, result in a highly efficient and accurate brain tumor classification system. The novelty of this work lies in the effective fusion of deep learning and TDA, leading to significant improvements in classification performance. The methodology's potential to improve diagnostic accuracy and contribute to better patient outcomes is underscored by its superior performance in comparison to existing methods. Experimental results show that the proposed methodology achieves outstanding performance metrics, including an accuracy of 99.2%, precision of 98.9%, recall of 99.35%, and F1-score of 99.12%. The model also demonstrates an efficient execution time of 6 s, making it both accurate and computationally feasible for practical applications.
Publicly available datasets were analyzed in this study. This data can be found here: https://figshare.com/articles/dataset/brain_tumor_dataset/1512427.
The study involving human participants was reviewed and approved by the local institutional board/ethics committee. The participants provided their written informed consent to participate in this study.
DJ: Conceptualization, Methodology, Validation, Writing – original draft. BS: Supervision, Validation, Writing – review & editing. KN: Supervision, Writing – review & editing. NC: Supervision, Writing – review & editing.
The author(s) declare that no financial support was received for the research and/or publication of this article.
The authors declare that the research was conducted in the absence of any commercial or financial relationships that could be construed as a potential conflict of interest.
All claims expressed in this article are solely those of the authors and do not necessarily represent those of their affiliated organizations, or those of the publisher, the editors and the reviewers. Any product that may be evaluated in this article, or claim that may be made by its manufacturer, is not guaranteed or endorsed by the publisher.
Aamir, M., Rahman, Z., Dayo, Z. A., Abro, W. A., Uddin, M. I., Khan, I., et al. (2022). A deep learning approach for brain tumor classification using MRI images. Comput. Electr. Eng.g. 101:108105. doi: 10.1016/j.compeleceng.2022.108105
Abd El Kader, I., Xu, G., Shuai, Z., Saminu, S., Javaid, I., Salim Ahmad, I., et al. (2021). Differential deep convolutional neural network model for brain tumor classification. Brain Sci. 11:352. doi: 10.3390/brainsci11030352
Abd El-Wahab, B. S., Nasr, M. E., Khamis, S., and Ashour, A. S. (2023). BTC-fCNN: fast convolution neural network for multi-class brain tumor classification. Health Inform. Sci. Syst. 11:3. doi: 10.1007/s13755-022-00203-w
Abdel Razek, A. A., Alksas, A., Shehata, M., AbdelKhalek, A., Abdel Baky, K., El-Baz, A., et al. (2021). Clinical applications of artificial intelligence and radiomics in neuro-oncology imaging. Insights Into Imag. 12, 1–7. doi: 10.1186/s13244-021-01102-6
Aboussaleh, I., Riffi, J., el Fazazy, K., Mahraz, A. M., and Tairi, H. (2024). 3DUV-NetR+: a 3D hybrid semantic architecture using transformers for brain tumor segmentation with MultiModal MR images. Results Eng. 21:101892. doi: 10.1016/j.rineng.2024.101892
Aljohani, M., Bahgat, W. M., Balaha, H. M., AbdulAzeem, Y., El-Abd, M., Badawy, M., et al. (2024). An automated metaheuristic-optimized approach for diagnosing and classifying brain tumors based on a convolutional neural network. Results Eng. 23:102459. doi: 10.1016/j.rineng.2024.102459
Amin, J., Sharif, M., Haldorai, A., Yasmin, M., and Nayak, R. S. (2021). Brain tumor detection and classification using machine learning: a comprehensive survey. Compl. Intellig. Syst. 8, 1–23. doi: 10.1007/s40747-021-00563-y
Antoniadi, A. M., Du, Y., Guendouz, Y., Wei, L., Mazo, C., Becker, B. A., et al. (2021). Current challenges and future opportunities for XAI in machine learning-based clinical decision support systems: a systematic review. Appl. Sci. 11:5088. doi: 10.3390/app11115088
Athisayamani, S., Antonyswamy, R. S., Sarveshwaran, V., Almeshari, M., Alzamil, Y., Ravi, V., et al. (2023). Feature extraction using a residual deep convolutional neural network (ResNet-152) and optimized feature dimension reduction for MRI brain tumor classification. Diagnostics. 13:668. doi: 10.3390/diagnostics13040668
Bharati, S., Khan, T. Z., Podder, P., and Hung, N. Q. (2021). A comparative analysis of image denoising problem: noise models, denoising filters and applications. Cogn. Internet Med. Things Smart Healthc. Serv. Appl. 311, 49–66. doi: 10.1007/978-3-030-55833-8_3
Bodapati, J. D., Shaik, N. S., Naralasetti, V., and Mundukur, N. B. (2021). Joint training of two-channel deep neural network for brain tumor classification. Signal Image Video Proc. 15, 753–760. doi: 10.1007/s11760-020-01793-2
Cenggoro, T. W., and Pardamean, B. (2023). A systematic literature review of machine learning application in COVID-19 medical image classification. Proc. Comp. Sci. 216, 749–756. doi: 10.1016/j.procs.2022.12.192
Cheng, J., Huang, W., Cao, S., Yang, R., Yang, W., Yun, Z., et al. (2015). Enhanced performance of brain tumor classification via tumor region augmentation and partition. PLoS ONE 10:0140381. doi: 10.1371/journal.pone.0140381
Cheng, J., Yang, W., Huang, M., Huang, W., Jiang, J., Zhou, Y., et al. (2016). Retrieval of brain tumors by adaptive spatial pooling and fisher vector representation. PLoS ONE 11:0157112. doi: 10.1371/journal.pone.0157112
Clough, J. R., Byrne, N., Oksuz, I., Zimmer, V. A., Schnabel, J. A., King, A. P., et al. (2020). A topological loss function for deep-learning based image segmentation using persistent homology. IEEE Trans. Pattern Anal. Mach. Intellig. 44, 8766–8778. doi: 10.1109/TPAMI.2020.3013679
De Benedictis, S. G., Gargano, G., and Settembre, G. (2024). Enhanced MRI brain tumor detection and classification via topological data analysis and low-rank tensor decomposition. J. Comput. Mathem. Data Sci. 13:100103. doi: 10.1016/j.jcmds.2024.100103
Deepak, S., and Ameer, P. M. (2021a). Automated categorization of brain tumor from mri using cnn features and svm. J. Amb. Intellig. Human. Comput. 12, 8357–8369. doi: 10.1007/s12652-020-02568-w
Deepak, S., and Ameer, P. M. (2021b). Brain tumour classification using siamese neural network and neighbourhood analysis in embedded feature space. Int. J. Imag. Syst. Technol. 31, 1655–1669. doi: 10.1002/ima.22543
Ferdous, G. J., Sathi, K. A., Hossain, M. A., Hoque, M. M., and Dewan, M. A. (2023). LCDEiT: A linear complexity data-efficient image transformer for MRI brain tumor classification. IEEE Access. 11, 20337–20350. doi: 10.1109/ACCESS.2023.3244228
Garin, A., and Tauzin, G. (2019). “A topological “reading” lesson: classification of MNIST using TDA,” in 2019 18th IEEE International Conference On Machine Learning And Applications (ICMLA) (Boca Raton, FL: IEEE), 1551–1556.
Irmak, E. (2021). Multi-classification of brain tumor MRI images using deep convolutional neural network with fully optimized framework. Iran. J. Sci. Technol. Trans. Elect. Eng. 45, 1015–1036. doi: 10.1007/s40998-021-00426-9
Kang, J., Ullah, Z., and Gwak, J. (2021). Mri-based brain tumor classification using ensemble of deep features and machine learning classifiers. Sensors. 21:2222. doi: 10.3390/s21062222
Kesav, N., and Jibukumar, M. G. (2022). Efficient and low complex architecture for detection and classification of Brain Tumor using RCNN with two channel CNN. J. King Saud Univ. Comp. Inform. Sci. 34, 6229–6242. doi: 10.1016/j.jksuci.2021.05.008
Kokkalla, S., Kakarla, J., Venkateswarlu, I. B., and Singh, M. (2021). Three-class brain tumor classification using deep dense inception residual network. Soft Comput. 25, 8721–8729. doi: 10.1007/s00500-021-05748-8
Majib, M. S., Rahman, M. M., Sazzad, T. S., Khan, N. I., and Dey, S. K. (2021). Vgg-scnet: a vgg net-based deep learning framework for brain tumor detection on mri images. IEEE Access. 9, 116942–116952. doi: 10.1109/ACCESS.2021.3105874
Mall, P. K., Singh, P. K., Srivastav, S., Narayan, V., Paprzycki, M., Jaworska, T., et al. (2023). A comprehensive review of deep neural networks for medical image processing: Recent developments and future opportunities. Healthcare Analyt. 4:100216. doi: 10.1016/j.health.2023.100216
Mohsen, H., El-Dahshan, E. S., El-Horbaty, E. S., and Salem, A. B. (2018). Classification using deep learning neural networks for brain tumors. Fut. Comput. Inform. J. 3, 68–71. doi: 10.1016/j.fcij.2017.12.001
Noreen, N., Palaniappan, S., Qayyum, A., Ahmad, I., Imran, M., Shoaib, M., et al. (2020). A deep learning model based on concatenation approach for the diagnosis of brain tumor. IEEE Access. 8, 55135–55144. doi: 10.1109/ACCESS.2020.2978629
Ottom, M. A., Rahman, H. A., and Dinov, I. D. (2022). Znet: deep learning approach for 2D MRI brain tumor segmentation. IEEE J. Transl. Eng. Health Med. 10, 1–8. doi: 10.1109/JTEHM.2022.3176737
Rahadian, H., Bandong, S., Widyotriatmo, A., and Joelianto, E. (2023). Image encoding selection based on Pearson correlation coefficient for time series anomaly detection. Alexandria Eng. J. 82, 304–322. doi: 10.1016/j.aej.2023.09.070
Rehman, A., Naz, S., and Razzak, I. (2022). Leveraging big data analytics in healthcare enhancement: trends, challenges and opportunities. Multimedia Syst. 28, 1339–1371. doi: 10.1007/s00530-020-00736-8
Saeedi, S., Rezayi, S., Keshavarz, H., and Niakan Kalhori, R. S. (2023). MRI-based brain tumor detection using convolutional deep learning methods and chosen machine learning techniques. BMC Med. Inform. Decis. Mak. 23:16. doi: 10.1186/s12911-023-02114-6
Skaf, Y., and Laubenbacher, R. (2022). Topological data analysis in biomedicine: a review. J. Biomed. Inform. 130:104082. doi: 10.1016/j.jbi.2022.104082
Songdechakraiwut, T., and Chung, M. K. (2020). “Dynamic topological data analysis for functional brain signals,” in 2020 IEEE 17th International Symposium on Biomedical Imaging Workshops (ISBI Workshops) (Lowa City, IA: IEEE), 1–4.
Urbanos, G., Martín, A., Vázquez, G., Villanueva, M., Villa, M., Jimenez-Roldan, L., et al. (2021). Supervised machine learning methods and hyperspectral imaging techniques jointly applied for brain cancer classification. Sensors. 21:3827. doi: 10.3390/s21113827
Wang, J., Lu, S. Y., Wang, S. H., and Zhang, Y. D. (2024). RanMerFormer: Randomized vision transformer with token merging for brain tumor classification. Neurocomputing. 573:127216. doi: 10.1016/j.neucom.2023.127216
Wang, W., Xie, E., Li, X., Fan, D. P., Song, K., Liang, D., et al. (2021). “Pyramid vision transformer: a versatile backbone for dense prediction without convolutions,” in Proceedings of the IEEE/CVF International Conference on Computer Vision (Montreal, QC), 568–578.
Keywords: adaptive PVT, BT classification, brain tumor, deep feature extraction, Giotto-TDA, Random Forest classifier
Citation: Joshi D, Singh BK, Nagwanshi KK and Choubey NS (2025) Integrating pyramid vision transformer and topological data analysis for brain tumor. Front. Comput. Sci. 7:1463006. doi: 10.3389/fcomp.2025.1463006
Received: 11 July 2024; Accepted: 11 March 2025;
Published: 10 April 2025.
Edited by:
Yee Kai Tee, Tunku Abdul Rahman University, MalaysiaReviewed by:
Shahzad Ashraf, DHA Suffa University, PakistanCopyright © 2025 Joshi, Singh, Nagwanshi and Choubey. This is an open-access article distributed under the terms of the Creative Commons Attribution License (CC BY). The use, distribution or reproduction in other forums is permitted, provided the original author(s) and the copyright owner(s) are credited and that the original publication in this journal is cited, in accordance with accepted academic practice. No use, distribution or reproduction is permitted which does not comply with these terms.
*Correspondence: Dhananjay Joshi, ZGo0cXVlcnlAZ21haWwuY29t
Disclaimer: All claims expressed in this article are solely those of the authors and do not necessarily represent those of their affiliated organizations, or those of the publisher, the editors and the reviewers. Any product that may be evaluated in this article or claim that may be made by its manufacturer is not guaranteed or endorsed by the publisher.
Research integrity at Frontiers
Learn more about the work of our research integrity team to safeguard the quality of each article we publish.