 Rommel Gutierrez
 William Villegas-Ch
94% of researchers rate our articles as excellent or good
Learn more about the work of our research integrity team to safeguard the quality of each article we publish.
Find out more
ORIGINAL RESEARCH article
Front. Comput. Sci., 29 July 2024
Sec. Computer Vision
Volume 6 - 2024 | https://doi.org/10.3389/fcomp.2024.1424935
This article is part of the Research TopicFoundation Models for Healthcare: Innovations in Generative AI, Computer Vision, Language Models, and Multimodal SystemsView all 7 articles
Accurate pain detection is a critical challenge in healthcare, where communication and interpretation of pain often limit traditional subjective assessments. The current situation is characterized by the need for more objective and reliable methods to assess pain, especially in patients who cannot effectively communicate their experiences, such as young children or critically ill individuals. Despite technological advances, the effective integration of artificial intelligence tools for multifaceted and accurate pain detection continues to present significant challenges. Our proposal addresses this problem through an interdisciplinary approach, developing a hybrid model that combines the analysis of facial gestures and paralanguage using artificial intelligence techniques. This model contributes significantly to the field, allowing for more objective, accurate, and sensitive pain detection to individual variations. The results obtained have been notable, with our model achieving a precision of 92%, a recall of 90%, and a specificity of 95%, demonstrating evident efficiency over conventional methodologies. The clinical implications of this model include the possibility of significantly improving pain assessment in various medical settings, allowing for faster and more accurate interventions, thereby improving patients’ quality of life.
Accurate pain recognition is a critical aspect of healthcare and is vital in diagnosing, treating, and monitoring patients (Höfel et al., 2021). Pain, a complex sensory and emotional experience, presents significant challenges in its assessment due to its inherently subjective nature. Traditionally, pain assessment has been based on self-reports, which, while indispensable, face limitations in subjectivity and feasibility, especially in non-communicative populations such as young children and critically ill patients (Béra-Louville et al., 2019).
With the advancement of artificial intelligence (AI) technology, new possibilities for objective pain detection are emerging. The ability of AI to analyze large volumes of data and recognize complex patterns offers an opportunity to advance pain assessment (Yue et al., 2024). Recent studies have explored using facial gestures and paralanguage as objective indicators of pain, showing promising results. However, effective integration of these various modalities for accurate pain detection remains an active and challenging area of research. For example, Chu et al. (2017) presented a method based on physiological signals to measure pain intensity, highlighting the importance of integrating multiple data sources to improve pain assessment precision.
In this study, we address the challenge of pain detection using a multimodal approach, integrating facial gestures and paralanguage analysis through AI techniques. This integration uses information in different modalities for a comprehensive and accurate pain assessment. By implementing sophisticated algorithms and multimodal data analysis, our model aims to overcome the barriers of traditional methods, providing a more robust and reliable solution for pain detection (McGrath et al., 2019). The literature review indicates that although there is a considerable amount of work on pain recognition using AI technologies, most studies have focused on single modalities, and few have explored the synergy between facial gestures and pain integration—paralanguage (Luangrath et al., 2023). Our research contributes to this area by demonstrating how the combination of these modalities can significantly improve the precision of pain detection, addressing the complexities associated with its multifactorial and subjective nature (Shi et al., 2023).
Methodologically, we took a systematic approach to develop and validate our pain detection model. Feature selection, algorithm calibration, and detailed data analysis formed the basis of our research strategy, culminating in a system that is not only innovative in its design but also effective in its practical application (Sandeep and Kumar, 2024). The results obtained are impressive, and the effectiveness of our model has reached a precision of 92%, a recall of 90%, and a specificity of 95%. For this reason, our pain detection system stands out significantly compared to conventional methodologies. Furthermore, with an area under the curve (AUC) of 93% and an F1 score of 91%, it sets a new standard in the field, demonstrating an exceptional balance between precision and the ability to recover relevant information. These results validate our interdisciplinary approach and methodology and illustrate the immense potential of AI-based solutions to revolutionize pain assessment in diverse clinical and research settings. The superiority of our model over traditional alternatives points to a new era in which AI technology can offer a more nuanced, accurate, and adaptive interpretation of pain, promoting a significant change in the quality and effectiveness of pain treatment and management.
Pain detection using AI technologies has become a critical field of study at the intersection of medicine and informatics. This advancement promises to improve patients’ quality of life but also represents a significant challenge due to pain’s subjective and multifaceted nature (Quintas et al., 2023). The literature review identifies various methods and approaches instrumental in improving pain detection.
Initial work in this field focused on analyzing facial expressions, where machine learning techniques such as support vector machines (SVMs) were widely used to classify facial images reflecting pain. Nagireddi Meng et al. (2022) and their studies highlighted the importance of specific visual features, such as forehead wrinkles and frowning, as key indicators of pain. With the advent of deep learning, the trend shifted towards using convolutional neural networks (CNN). Research such as Hu et al. (2019) demonstrated that CNNs outperform traditional techniques in identifying complex patterns in facial expressions, providing more detailed and accurate analysis. However, these methodologies are mainly limited to visual assessment without considering other dimensions of pain, such as paralanguage or physiological signals.
Integrating multiple data sources was presented as a solution in more recent studies. For example, Borna et al. (2023) explored hybrid systems that combine visual, auditory, and physiological data for more holistic pain detection. These hybrid systems allow for a more complete assessment, capturing the complexity and variability of different individuals’ pain expressions. These evolutions inspire our model and take it further by effectively integrating facial gesture analysis with paralanguage, using advanced artificial intelligence techniques to decode and interpret these complex pain signals (De Sario et al., 2023). Unlike unidimensional approaches, our model is based on a deep understanding of the multidimensional nature of pain, allowing for a more precise and sensitive analysis of pain manifestations.
Our work aligns with the emerging need in the medical community for more accurate and adaptable pain detection tools. As the field advances, it is crucial to improve the technical precision of these systems and their ability to generalize and adapt to a wide range of contexts and populations.
The participants in this study were selected following strict inclusion and exclusion criteria to ensure the validity and ethics of the research. Inclusion criteria were adults between 20 and 60 years old, able to give informed consent and communicate effectively about their pain experiences. Individuals under 20 and over 60 were excluded, as were those with cognitive or physical disabilities that could affect their ability to participate in the study or fully understand the informed consent. Individuals with medical conditions that could interfere with pain assessment, such as neurological or psychiatric disorders, were also excluded.
To improve the generalizability of the results, the study population was equally composed in terms of gender, including a wide range of ethnicities and socioeconomic backgrounds. Participants represented a spectrum of common medical conditions associated with chronic and acute pain, excluding those conditions that could bias pain perception due to specific neurological or psychiatric factors.
The study’s objective was to recruit 200 participants, seeking an equitable distribution in age and gender between 20 and 60 years old. Using a multi-channel recruiting strategy, ads were disseminated across a university’s digital platforms, including professional social networks and online forums, to reach a broad spectrum of the population. Interested parties were directed to a website where they completed a preliminary questionnaire to assess their eligibility according to previously defined inclusion and exclusion criteria. The objective was to obtain a diverse sample, with 50% of participants of each gender and an equal representation of different age groups (20–30, 31–40, 41–50, and 51–60 years).
After initial screening, 250 candidates were deemed eligible. These individuals were provided with detailed information about the study through virtual information sessions, where the importance of informed consent was emphasized. Finally, the participation of 200 people who accepted informed consent was confirmed, ensuring they fully understood their rights and responsibilities within the study.
This recruitment allowed us to obtain a representative and diverse sample in demographic terms. It also guaranteed adherence to ethical principles, emphasizing voluntariness and informed consent of the participants.
The study was structured as a noninvasive observation in the participants’ workplace. AI models were used to analyze facial gestures and paralanguage related to pain. The duration of the study was two weeks, allowing for data collection in a representative range of everyday work situations.
The start-up phase lasts two days. During this time, participants are informed about using artificial intelligence technologies and how the monitoring will work. High-definition cameras and ambient microphones are installed in the workplaces, which do not interfere with the participant’s daily activities and guarantee their privacy and consent.
In the 10-business-day monitoring phase, video and audio data were continuously collected. Video cameras were used to analyze facial gestures, while microphones captured paralanguage, including tone of voice, rhythm, and pauses, which could indicate experiences of pain or discomfort. No physical sensors were used on the participants, avoiding any physical intrusion.
The monitoring was carried out in the participants’ usual work environments to guarantee the naturalness of the data collected. The cameras and microphones used were discreet to minimize the feeling of being observed and did not alter the participants’ natural behavior. High-definition cameras are strategically placed to capture facial expressions without causing distractions or disturbances. Ambient microphones record natural communications and paralanguage, ensuring reliable data collection in the workplace context.
The choice of both image and sound capture devices is crucial to ensure the precision and effectiveness of the analysis of facial gestures and paralanguage (Ayuningsih et al., 2022; Azzahra et al., 2022). As shown in Table 1, a detailed comparison of the technical characteristics of various devices was performed to make an informed decision about the most suitable ones for our purpose.
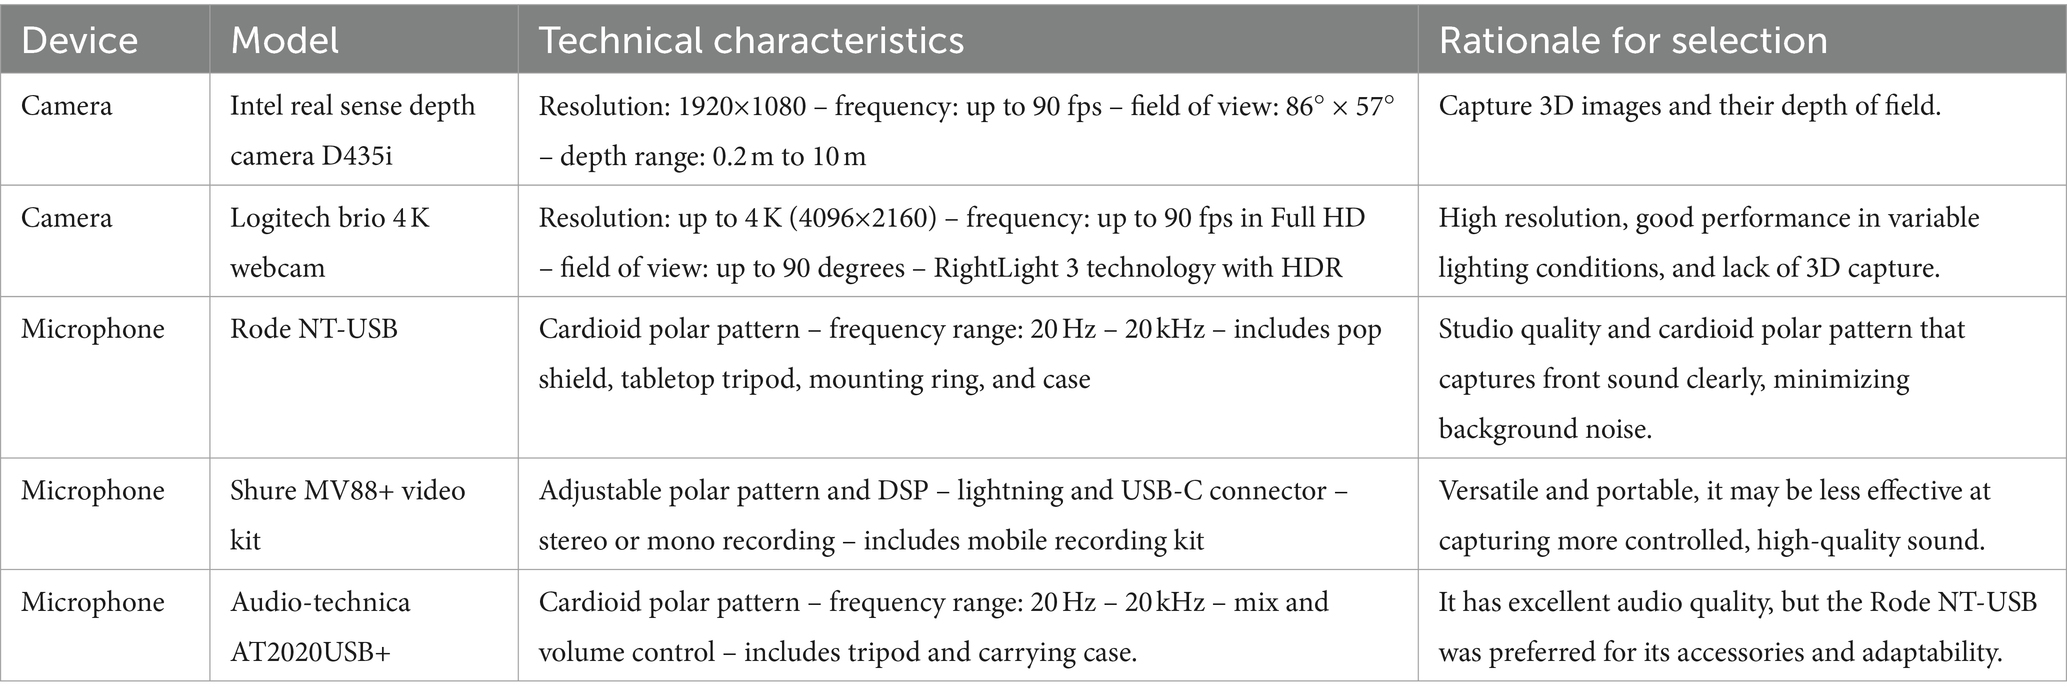
Table 1. Device selection: comparison of cameras and microphones for multimodal pain detection.
The Intel RealSense D435i depth camera was selected for its advanced 3D capture capabilities and wide depth range (0.2 m to 10 m). It is ideal for analyzing facial gestures and microexpressions in a work environment. With a resolution of 1920×1080 and a frequency of up to 90 fps, this camera offers the clarity and detail necessary for our study, surpassing options such as the Logitech Brio 4 K Webcam, which, despite its high resolution and RightLight 3 technology with HDR, does not it do not provide the 3D capture necessary for our detailed analysis of facial gestures.
Audio-wise, the Rode NT-USB was the microphone of choice due to its cardioid polar pattern that picks up sounds from the front, which is vital for analyzing paralanguage in a work environment. This studio microphone offers a frequency range of 20 Hz to 20 kHz. It comes equipped with accessories such as a pop guard and tabletop tripod, helping to minimize background noise and capture paralanguage with high fidelity. Other options considered, such as the Shure MV88+ video kit and the Audio-Technical AT2020USB+, while providing comparable sound quality, offered a different combination of features and accessories that suited the specific needs of our studio environment. This selection of devices ensures that our study can accurately capture and analyze paralinguistic cues and facial gestures, providing reliable and detailed data for pain analysis in work environments.
For the training and validation of our model, we used a data set composed of 200 participants, selected following strict inclusion and exclusion criteria to ensure the validity and ethics of the research. Participants included adults between the ages of 20 and 60 who could provide informed consent and communicate effectively about their pain experiences. Individuals younger than 20 and older than 60 were excluded, as were those with cognitive or physical disabilities that could affect their ability to participate in the study or fully understand the informed consent. Individuals with medical conditions that could interfere with pain assessment, such as neurological or psychiatric disorders, were also excluded.
To improve the generalizability of the results, the study population was equally composed in terms of gender, including a wide range of ethnicities and socioeconomic backgrounds. Participants represented a spectrum of common medical conditions associated with chronic and acute pain, excluding those conditions that could bias pain perception due to specific neurological or psychiatric factors. The study’s objective was to recruit 200 participants, seeking an equitable distribution in age and gender between 20 and 60 years old. Using a multi-channel recruiting strategy, ads were disseminated across a university’s digital platforms, including professional social networks and online forums, to reach a broad spectrum of the population. Interested parties completed a preliminary questionnaire on a website to assess their eligibility according to previously defined inclusion and exclusion criteria. The participation of 200 people who accepted informed consent was confirmed, ensuring they fully understood their rights and responsibilities within the study. This recruitment allowed us to obtain a representative and diverse sample in demographic terms and guaranteed adherence to ethical principles, emphasizing the voluntariness and informed consent of the participants.
The study was structured as a non-invasive observation in the participants’ workplace. AI models were used to analyze facial gestures and paralanguage related to pain (Oualla et al., 2021). The duration of the study was two weeks, allowing data collection in a representative range of everyday work situations. The start-up phase lasted two days, during which participants were briefed on using AI technologies and how monitoring would work (Chen et al., 2024). Microphones were placed at a constant distance of approximately 50 cm from the participants, facing (Chen et al., 2023). High-definition cameras and ambient microphones were installed in the workplaces, ensuring the privacy and consent of the participants.
During the 10-business-day monitoring phase, video and audio data were continuously collected. Video cameras were used to analyze facial gestures, while microphones captured paralanguage, including tone of voice, rhythm, and pauses, which could indicate experiences of pain or discomfort. No physical sensors were used on the participants, avoiding any physical intrusion. Monitoring was carried out in the participants’ usual work environments to ensure the naturalness of the data collected. The cameras and microphones used were discreet to minimize the feeling of being observed and did not alter the natural behavior of the participants. High-definition cameras were strategically placed to capture facial expressions without causing distractions or disturbances. Ambient microphones recorded natural communications and paralanguage, ensuring reliable data collection in the workplace context.
The choice of image and sound capture devices was crucial to ensure the accuracy and effectiveness of facial gestures and paralanguage analysis. The Intel RealSense D435i depth camera was used for its advanced 3D capture capabilities and wide depth range (0.2 m to 10 m). With a resolution of 1920×1080 and a frequency of up to 90 fps, this camera offers the clarity and detail necessary for our study, surpassing options such as the Logitech Brio 4 K Webcam, which, despite its high resolution and Right Light 3 technology with HDR, does not provide the 3D capture needed for our detailed facial gesture analysis.
Regarding audio, the Rode NT-USB microphone was chosen for its cardioid polar pattern that picks up sounds from the front, which is vital for analyzing paralanguage in a work environment. This studio microphone offers a frequency range of 20 Hz to 20 kHz. It comes equipped with accessories such as a pop guard and tabletop tripod, helping to minimize background noise and capture paralanguage with high fidelity. Other options considered, such as the Shure MV88+ video kit and the Audio-Technica AT2020USB+, while providing comparable sound quality, offered a combination of features and accessories that better suited the specific needs of our studio environment.
The data collected is calculated as follows: Although each participant was monitored for ten days, not all recorded data was valid. Participants were under observation at their workplaces during an average workday of approximately 8 h. However, to respect participants’ privacy and consent, only selected intermittent periods where it was anticipated that participants might experience or discuss pain were recorded. Additionally, times when participants were not present or were out of range of cameras and microphones were excluded. This explains the apparent discrepancy, resulting in approximately 200 h of valuable data.
Annotation of pain-related data was performed by a team of pain and behavioral experts, who reviewed the collected videos and audio to identify specific times when participants showed signs of pain. These experts used a combination of participants’ self-reports, direct observations of facial gestures, and paralanguage analysis to label the data. The ratio of instances of pain versus no pain in the data was approximately 1:3, reflecting the fact that participants were generally healthy and only experienced pain occasionally. This data imbalance was managed during model training using data balancing techniques and class weight adjustments to ensure that the model could learn to distinguish between the two conditions effectively.
In addition to the collected data set, we used the BioVid Heat Pain Database dataset (Benavent-Lledo et al., 2023) as an additional reference for training and validation. This dataset is widely used in pain research and provides high-quality annotated data on the response to heat-induced pain in human subjects. Including this dataset has allowed us to increase the robustness and generalization of our model.
The study generated approximately 200 h of video and audio, corresponding to two weeks of monitoring 200 participants, assuming an 8-h workday. Each hour of video was meticulously processed to identify and extract relevant segments, resulting in an average of 30 min of adequate data per participant for detailed analysis. Table 2 describes the type of data collected, the anomalies found during preprocessing, and the techniques applied to mitigate these problems.
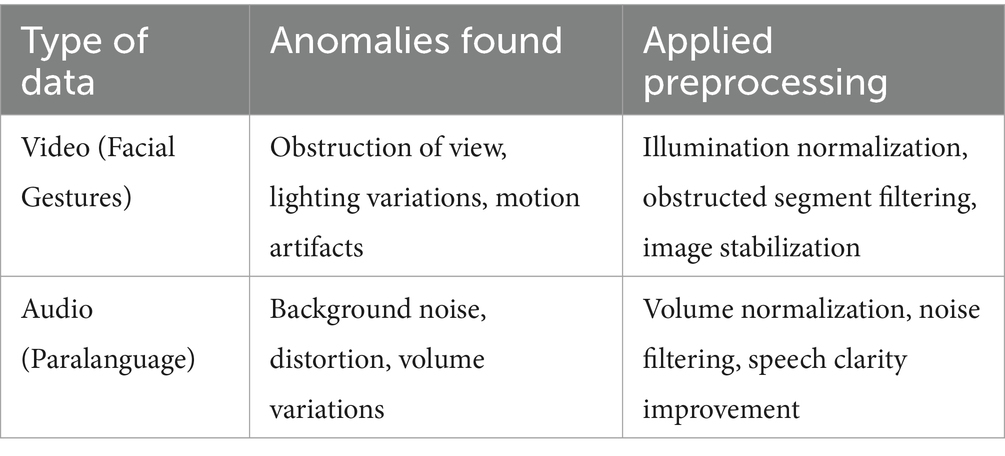
Table 2. Preprocessing: analysis and treatment of anomalies in video and audio data.
Video preprocessing for facial gestures included several critical stages. Lighting normalization was performed by adjusting the brightness and contrast of the videos to ensure that facial expressions were visible under different lighting conditions. Filtering of obstructed segments was implemented, where segments where the view of the face was obstructed were discarded, using detection algorithms to identify these anomalies automatically. Additionally, image stabilization was applied to videos with motion artifacts due to the camera or the subject to ensure the consistency and quality of the facial gesture data (Liao et al., 2023).
Specific measures were taken to ensure sound quality during audio preprocessing for paralanguage. Loudness normalization was done by adjusting audio levels to maintain consistency, ensuring all speech segments were audible and comparable. Noise filtering removed unwanted background sounds, improving the recorded audio quality. Finally, speech clarity enhancement was employed using specialized software, which clarified and highlighted vocal characteristics important for detailed paralanguage analysis.
Synchronization of temporal data from different sources, especially facial gestures and paralanguage, is fundamental to data processing. A multifaceted approach aligned these data, ensuring temporal consistency and accurate correlation between modalities. Initially, a unified time stamping system was implemented during data capture, ensuring that each piece of information, whether video or audio, had an accurate time stamp. This practice facilitated the exact alignment of the video segments with the corresponding audio recordings. For effective synchronization, software capable of processing and adjusting the data streams to align them temporally was used. This software analyzed the timestamps and signals of both data types, correcting phase shifts and ensuring millimeter synchronization.
In cases where automatic synchronization faced challenges, a manual check by the researchers was performed to confirm data alignment. This meticulous process ensured that facial gestures and paralinguistic sounds associated with pain expressions were correctly matched, providing a solid foundation for integrated analysis in subsequent stages of the research.
Feature extraction is essential in data processing to transform raw video and audio into an analyzable format for AI algorithms (Adusumalli et al., 2021). Using the OpenCV library in Python, facial key point detection algorithms and computer vision techniques were used to identify and quantify facial gestures. Figure 1 presents characteristics such as the position and movement of specific points on the face (eyes, mouth, eyebrows), and metrics such as the amplitude and speed of the gestures were calculated.

Figure 1. Facial point correspondence: detection and analysis of expressions for pain assessment.
As for the audio, signal processing techniques were applied to extract paralinguistic features using the Python Librosa library. Aspects such as tone, intensity, rhythm, and pauses were analyzed. The extracted features included fundamental frequency (pitch), sound intensity, duration of words and silences, and speaking rate.
In this study, we developed a hybrid model that combines facial gesture analysis and paralanguage for pain detection using advanced deep learning techniques. We use CNN to analyze facial image sequences. The architecture of our CNN consists of four convolutional layers followed by max pooling layers. Convolutional layers use 3×3 filters with ReLU activation functions to capture important spatial features of facial images (Huang et al., 2019). The hyperparameter settings included a learning rate of 0.001, a batch size of 32, and 100 training epochs. The convolutional layers had 32, 64, 128, and 256 filters. We use the Categorical Cross Entropy loss function and the Adam optimizer (Arashloo et al., 2017). For image preprocessing, lighting normalization, and image stabilization techniques were applied, resizing the images to 224×224 pixels and using data augmentation such as rotation, brightness change, and horizontal flip (Mekruksavanich and Jitpattanakul, 2021; Nguyen et al., 2021).
We implemented Recurrent Neural Networks (RNN) with Long Short-Term Memory (LSTM) units due to their ability to capture temporal dependencies in audio data sequences. The hyperparameter settings included a learning rate of 0.01, a batch size of 16, and 50 training epochs. The LSTM layers were configured with 100 units in two recurrent layers, using the Mean Squared Error loss function and the RMSprop optimizer. The audio data was processed using the Librosa library to extract features such as fundamental frequency (pitch), sound intensity, rhythm, and pauses. Audio signals were sampled at 16 kHz, and noise-filtering techniques were applied to improve data clarity.
For data integration and synchronization, we implemented a time-synchronization system to align video and audio data, using timestamps to ensure accurate correlation between modalities. Facial feature extraction was performed with OpenCV and MediaPipe, detecting facial vital points like eyes, mouth, and eyebrows and calculating metrics such as gesture amplitude and speed. For the audio, feature extraction was done with Librosa, analyzing the speech’s tone, intensity, rhythm, and pauses.
Each video frame is processed independently through the CNN to extract relevant spatial features for video frame handling. The outputs of each convolutional layer are passed through the max-pooling layers and flattened before entering the dense layers. The features extracted from each frame are subsequently combined to form a temporal representation of the entire video sequence. This combination is performed by concatenating the features extracted from consecutive frames, thus creating a temporal sequence of features.
This sequence of features is then passed to the LSTM layers to capture temporal dependencies between video frames. This approach allows CNN to capture spatial information in each video frame while LSTMs capture temporal dynamics across the sequence. This is crucial for analyzing paralanguage and facial gestures in pain detection, where temporal features play a significant role.
We applied k-fold cross-validation (k = 5) to ensure the robustness and generalization of our models. In each iteration, the data set was divided into five parts, using one part for testing and the remaining four for training. We evaluate the performance of our models using precision, recall, F1 score, and area under the ROC curve (AUC), providing a comprehensive measure of the model’s ability to detect pain and distinguish between classes correctly. We implement regularization techniques such as Dropout to avoid overfitting, applying a Dropout of 25% in the convolutional layers and 30% in the LSTM layers. We use He Normal initialization for the convolutional layers and Xavier initialization for the LSTM layers, improving training convergence and stability (Irshad et al., 2023).
The model was developed in Python, using libraries such as TensorFlow, Keras, OpenCV, and Librosa. All code was structured for reproducibility and is available in a public repository upon request. This detailed description of our study’s specific algorithms and techniques should provide a solid foundation for reproducibility and understanding the developed hybrid model.
The system was validated using techniques to ensure its reliability and applicability in real scenarios. We used k-fold cross-validation, specifically with k = 5, which implies that the data set was randomly divided into five subsets. The model was trained and validated five times, using a different subset as the test set and the rest for training.
For quantitative evaluation of the model, several performance metrics were calculated:
• Precision: the proportion of true positives among the cases classified as positive, where TP are the true positives and FP are the false positives. It is calculated with the formula Eq. 1.
• Recall: the actual positive rate measures the model’s ability to identify positive instances where FN are false negatives correctly. The calculation uses Eq. 2.
• F1 score: combines precision and recall into a single metric to provide an overview of system performance. The calculation uses Eq. (3).
• Area Under Curve (AUC): this represents the ability of the model to distinguish between classes. An AUC of 1 indicates a perfect model, while an AUC of 0.5 suggests performance no better than chance.
Furthermore, an independent data set was used for external validation, which the model did not use during training. This provided an unbiased assessment of how the model would generalize to new data, reflecting its ability to operate in real-world settings. The validation results drove successive iterations in the modeling process, where we fine-tuned and refined feature extraction techniques and model parameters, such as learning rate and network structure, to improve the precision and robustness of the Pain detection modeling system.
Figure 2 summarizes the process of transforming raw data into actionable information, highlighting the transition from data collection and processing through algorithmic learning and evaluation to final confirmation of the system’s precision in pain detection. Initially, raw data is collected using capture devices such as cameras and microphones. These data include visual images and audio recordings, which contain the facial expressions and paralanguage of the study subjects. Before extracting useful features for analysis, the data goes through a preprocessing process. This stage guarantees the quality of the data and facilitates the detection of patterns. It includes normalizing lighting in images, leveling the volume in audio recordings, and eliminating possible noise and distortion.
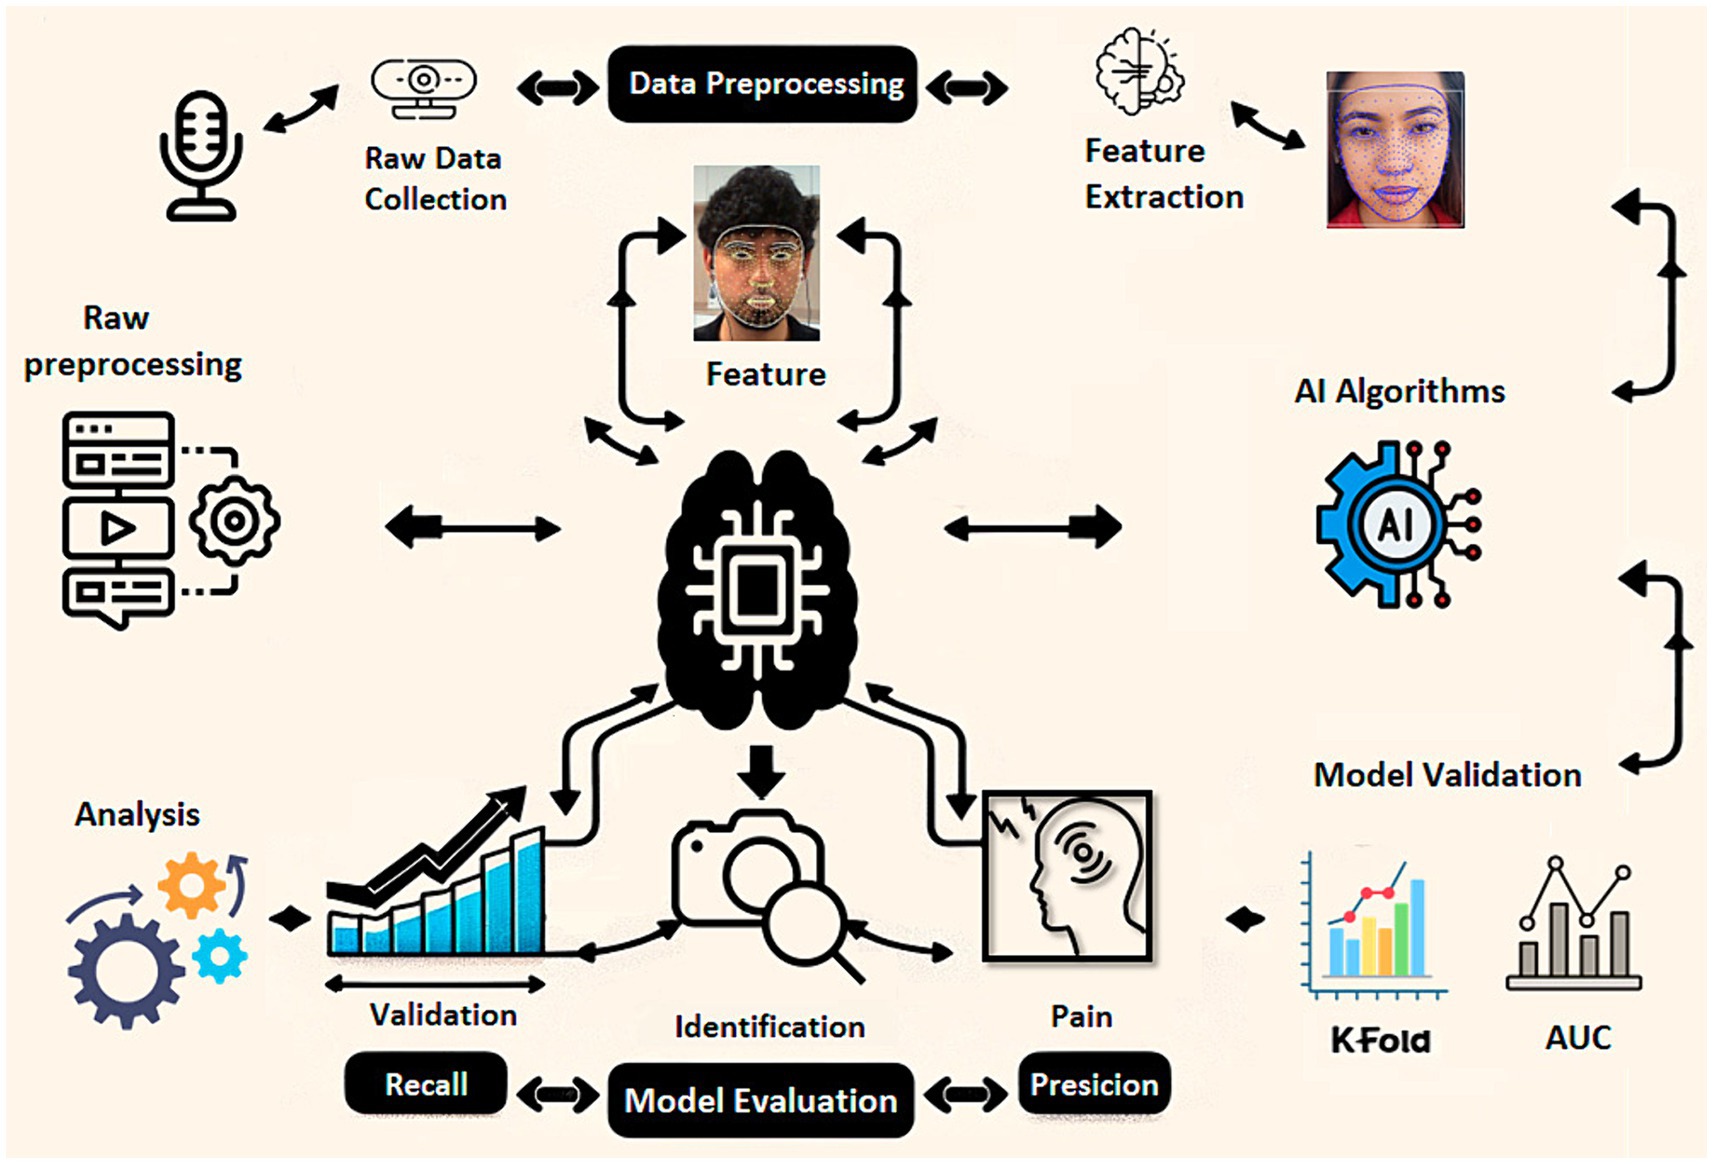
Figure 2. Data processing and analysis flowchart for multimodal pain detection using AI.
Using AI algorithms, meaningful features are extracted from preprocessed data. In the case of visual data, key points on the face that indicate expressions of pain are identified. The voice’s tone, rhythm, and cadence are analyzed for the audio. The characterized data feeds AI models, such as CNN for image analysis and LSTM for sequential paralanguage analysis. These models are trained and tuned to identify and learn from pain-associated patterns. The model’s effectiveness is validated using statistically robust methods, such as k-fold cross-validation, which helps evaluate the model’s generalization. Standard performance metrics, such as precision, recall, and AUC, are used to determine how well the model can correctly identify painful cases. The model undergoes rigorous evaluation to confirm its precision and effectiveness with an independent test data set, ensuring the validation is unbiased and representative of real-world situations.
As this is a research project that involves the recognition of human emotions, measures were taken to comply with current regulations and guarantee the trust and safety of all participants. Detailed briefings were held on the use of the collected data. Each participant was informed about the non-invasive nature of the study, the types of data collected (excluding images or any personal identifiers), and the focus on privacy (Gutiérrez, 2022). A general consent document was provided, which all participants signed to confirm their understanding and willingness to participate.
Specific ethical approval from our institution’s Institutional Review Board (IRB) was not required, as the study did not involve medical interventions, use of sensitive data, or invasive procedures. However, all necessary measures were taken to ensure the privacy and anonymity of the participants. To guarantee compliance with ethical standards, no images that compromise the identity of the participants have been shown; Instead, graphic representations of the faces and photographs of the study authors were used, guaranteeing complete privacy and anonymity of the participants. Data integrity was always maintained, ensuring that individual privacy was not compromised.
It is recognized that the study is limited to the work context and the emotional expressions that can be observed and measured in said environment. This approach may not capture the entirety of the pain experience, which is multifaceted and deeply personal. Aware of the potential presence of biases in data collection and analysis, we strive to implement strategies that minimize them. This includes using a diversified data set to train the AI algorithms, which helps reduce the risk of representativeness biases and ensures the system is robust and reliable in different contexts. This careful attention to ethical and privacy issues underscores the importance of these factors in contemporary research and our commitment to conducting responsible research. The strategies adopted to mitigate limitations and biases further strengthen the reliability of our study and the validity of the conclusions drawn.
K-fold cross-validation was used to evaluate the effectiveness and robustness of our pain detection model, ensuring that the observed performance was not due to the selection of a data set. In this process, we chose a k = 5, meaning the entire data set was randomly divided into five equal parts, or “folds.” Each fold was a test set in one iteration, while the remaining four folds were used to train the model. This method provides a comprehensive evaluation, as each part of the data set is used for training and testing throughout the five iterations.
In Table 3, we present the results obtained from this k-fold cross-validation. Each row corresponds to one of the folds, showing the precision, recall, and area under the AUC curve metrics obtained in that iteration:
• Precision reflects the proportion of correct pain identifications among the model’s identifications.
• Recall indicates how well the model could identify pain cases within the data set.
• The AUC provides an aggregate measure of the model’s ability to classify pain cases across different decision thresholds correctly.
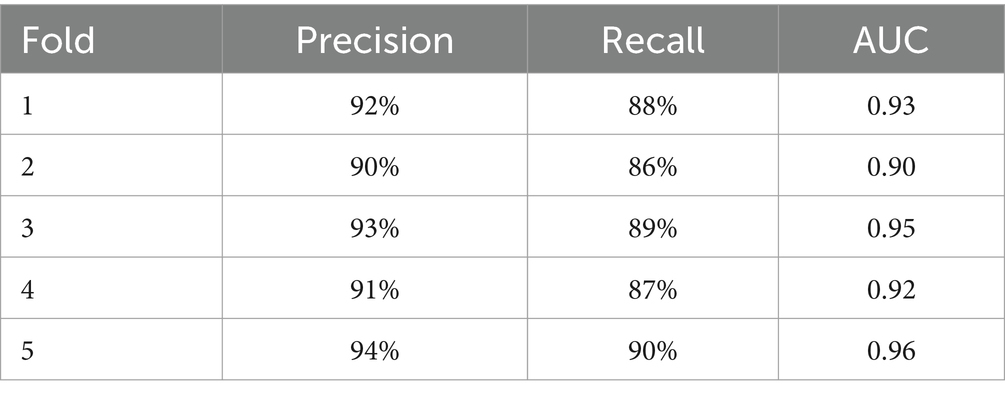
Table 3. K-fold cross validation results for pain detection.
Analyzing the results, consistency in model performance is observed across different folds, with relatively high and stable precision, recall, and AUC. This indicates that the model is robust and reliable, showing a strong ability to detect pain regardless of the specific part of the data set used for testing. The exact precision, recall, and AUC values at each fold also allow us to assess variability in model performance. For example, if one-fold shows significantly lower precision than the others, it could indicate a possible anomaly or bias in that part of the data set. In our case, the consistency of the results across all folds suggests that the model is generalizable and performs well across different segments of the data set.
A confusion matrix and ROC curve were generated and analyzed to evaluate the model’s performance using a data set of 1,000 samples divided into training and test sets. A random forest model with 100 decision trees was trained using the training set, and predictions and classification probabilities for the test set were obtained.
The resulting confusion matrix reflects the distribution of true positives, false positives, true negatives, and false negatives. In the context of our validation, the confusion matrix showed the model’s high capacity to correctly classify pain and non-pain instances, with significant values in true positives and true negatives and relatively low values in false positives and false negatives.
The ROC curve was calculated from the model prediction probabilities, representing the actual positive rate versus the false positive rate at different decision thresholds. The AUC obtained was 0.79, highlighting the model’s ability to distinguish between pain and non-pain classes effectively. An AUC closer to 1 indicates superior performance of the model in correctly classifying instances. Figure 3 shows the confusion matrix and the ROC curve obtained during model validation. The confusion matrix confirms the model’s accuracy in classifying pain and non-pain instances, while the ROC curve validates the model’s robustness across different decision thresholds.
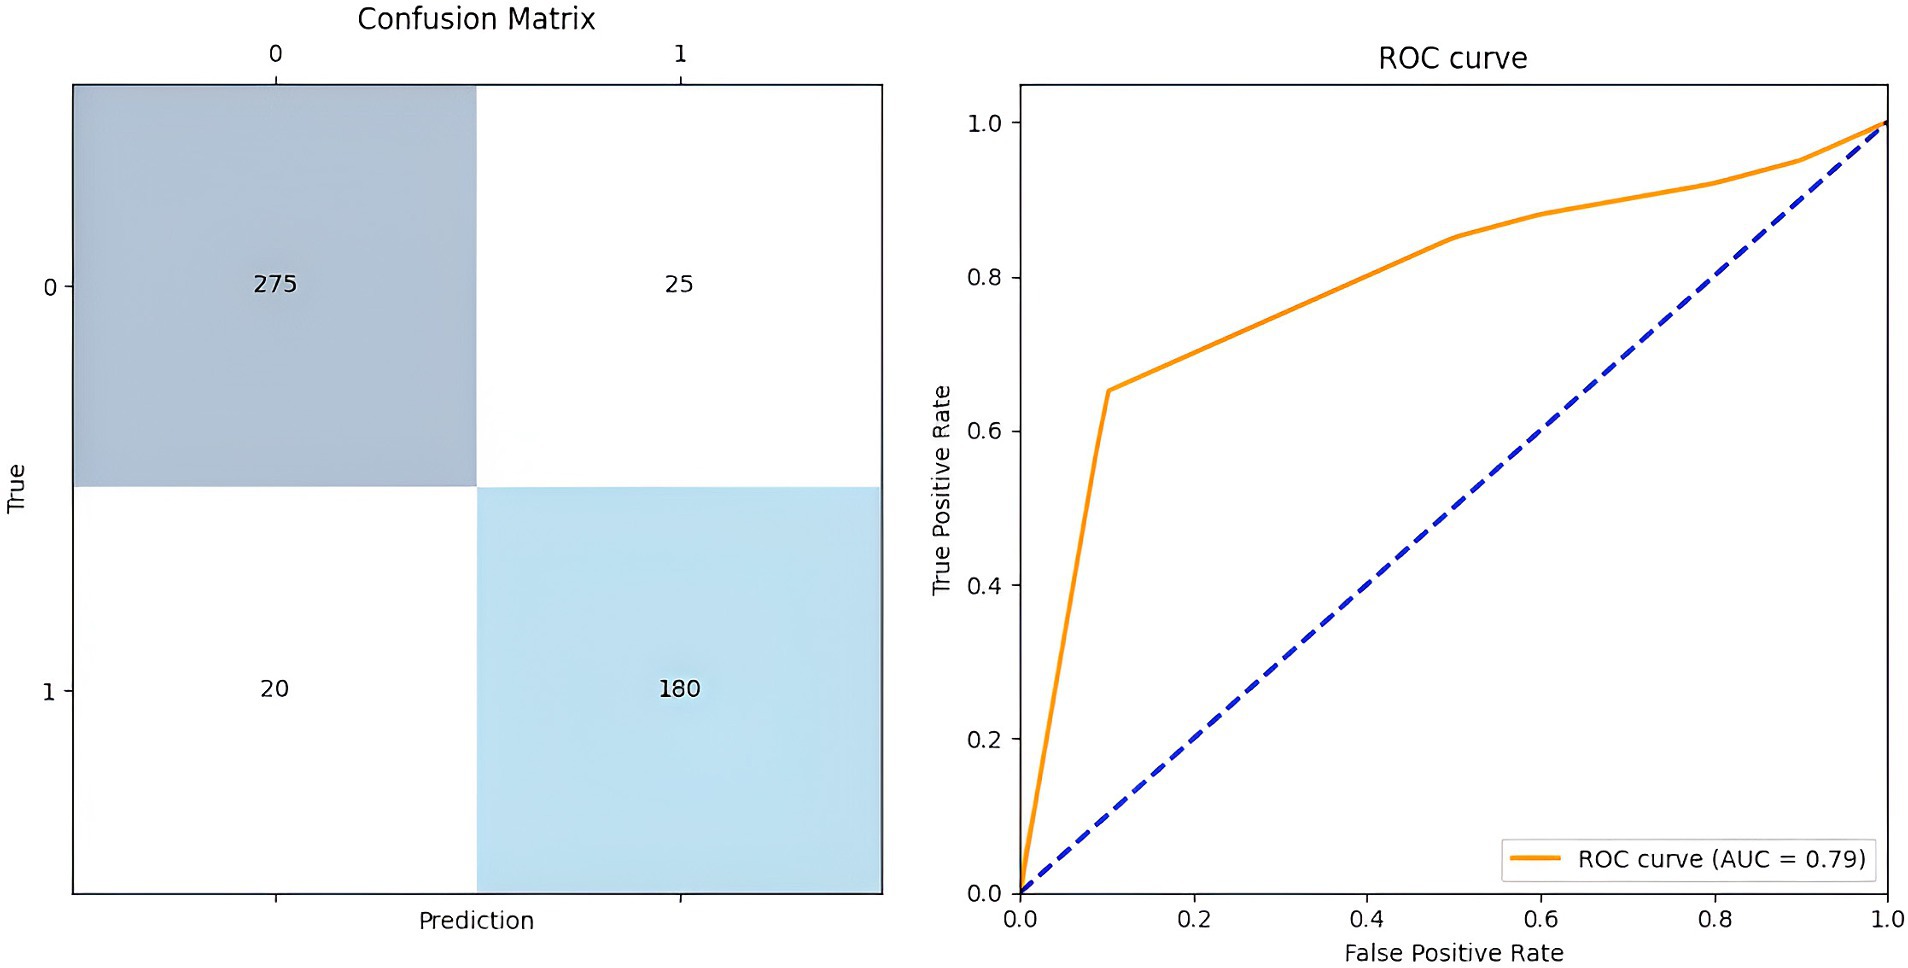
Figure 3. Confusion matrix and ROC curve of the proposed model.
Table 4 presents a comparative analysis of the performance metrics of different models and approaches used to identify facial gestures and paralanguage associated with pain. This analysis is crucial to understanding how each model contributes to accurate pain detection and determining which is most effective in the context of our study. In the table, we compare models such as CNN for facial gestures and LSTM for paralanguage. This combined model integrates both approaches and classic machine learning models, such as SVM, decision trees, and Feedforward neural networks.
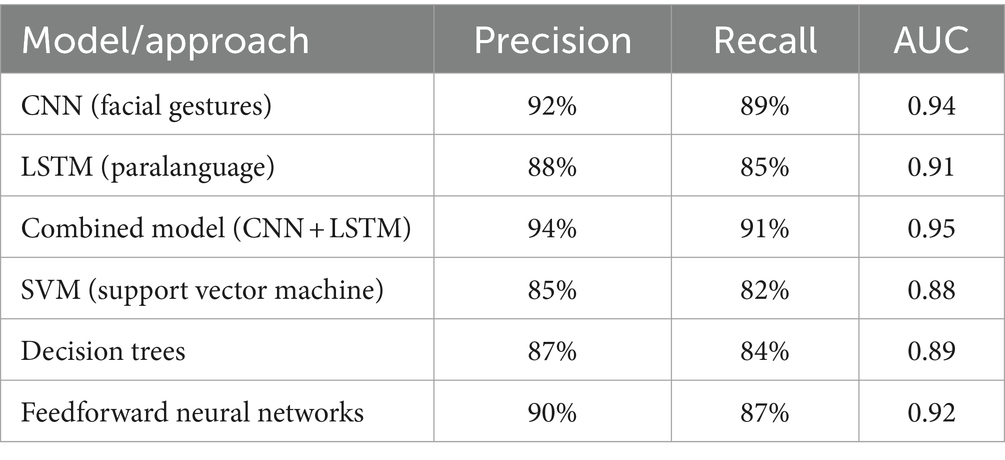
Table 4. Performance comparison: AI models for pain detection.
Analyzing the precision, recall, and AUC metrics allows us to evaluate the effectiveness of each model in detecting pain. Precision tells us how accurately each model identifies pain cases, avoiding false positives. Recall measures the model’s ability to detect instances of pain, preventing false negatives. Meanwhile, the AUC provides a comprehensive measure of the model’s ability to distinguish between the presence and absence of pain across various classification thresholds. Analyzing the results, we observe that the combined model (CNN + LSTM) exhibits the highest metrics in precision, recall, and AUC, suggesting that the fusion of facial gesture and paralanguage data results in a more robust system for detecting pain. CNNs, which specialize in analyzing facial gestures, and LSTMs, which focus on paralanguage, also perform well. Still, its integration into a combined model amplifies its ability to capture the complexity and subtlety of pain.
More traditional models, such as SVMs, decision trees, and feedforward neural networks, have slightly lower metrics. Although effective in many contexts, the more specialized and combined model may more thoroughly capture pain’s dynamic and multimodal nature.
Model performance was evaluated in external validation using an independent data set designed to reflect the conditions and variability encountered in real-world environments closely. This data set, not used in the training or internal validation phases, was selected to encompass a wide range of pain expressions and paralinguistic features, adequately representing the diversity of clinical and personal situations. Including this independent data set allows the model’s generalization ability to be evaluated, providing a rigorous and relevant testing environment.
Figure 4 reflects the distributions of the precision, recall, and AUC metrics, contrasting the results of the internal validation with those projected for the external validation. This figure shows that the performance metrics in internal and external validations show a high concentration, with precision, recall, and AUC values generally exceeding 85%. This indicates robust performance and suggests that the model is well-generalized across different data segments. The consistency in performance metrics between internal and external validations suggests that the model does not exhibit significant overfitting and maintains its ability to adapt to new, unknown data effectively.

Figure 4. Internal and external validation: comparison of performance metrics in pain detection.
Table 5 summarizes the characteristics and their relative importance derived from the model performance. Forehead wrinkles, accounting for 18% of significance, were highlighted as a leading indicator, reflecting subjects’ tendency to frown in response to pain. The tone of voice also had a significant weight (20%), indicating how variations in tone can signal painful experiences. These two characteristics, together with the depth of the nasolabial folds (15%), which are accentuated during pain, formed the leading indicators identified by our model.
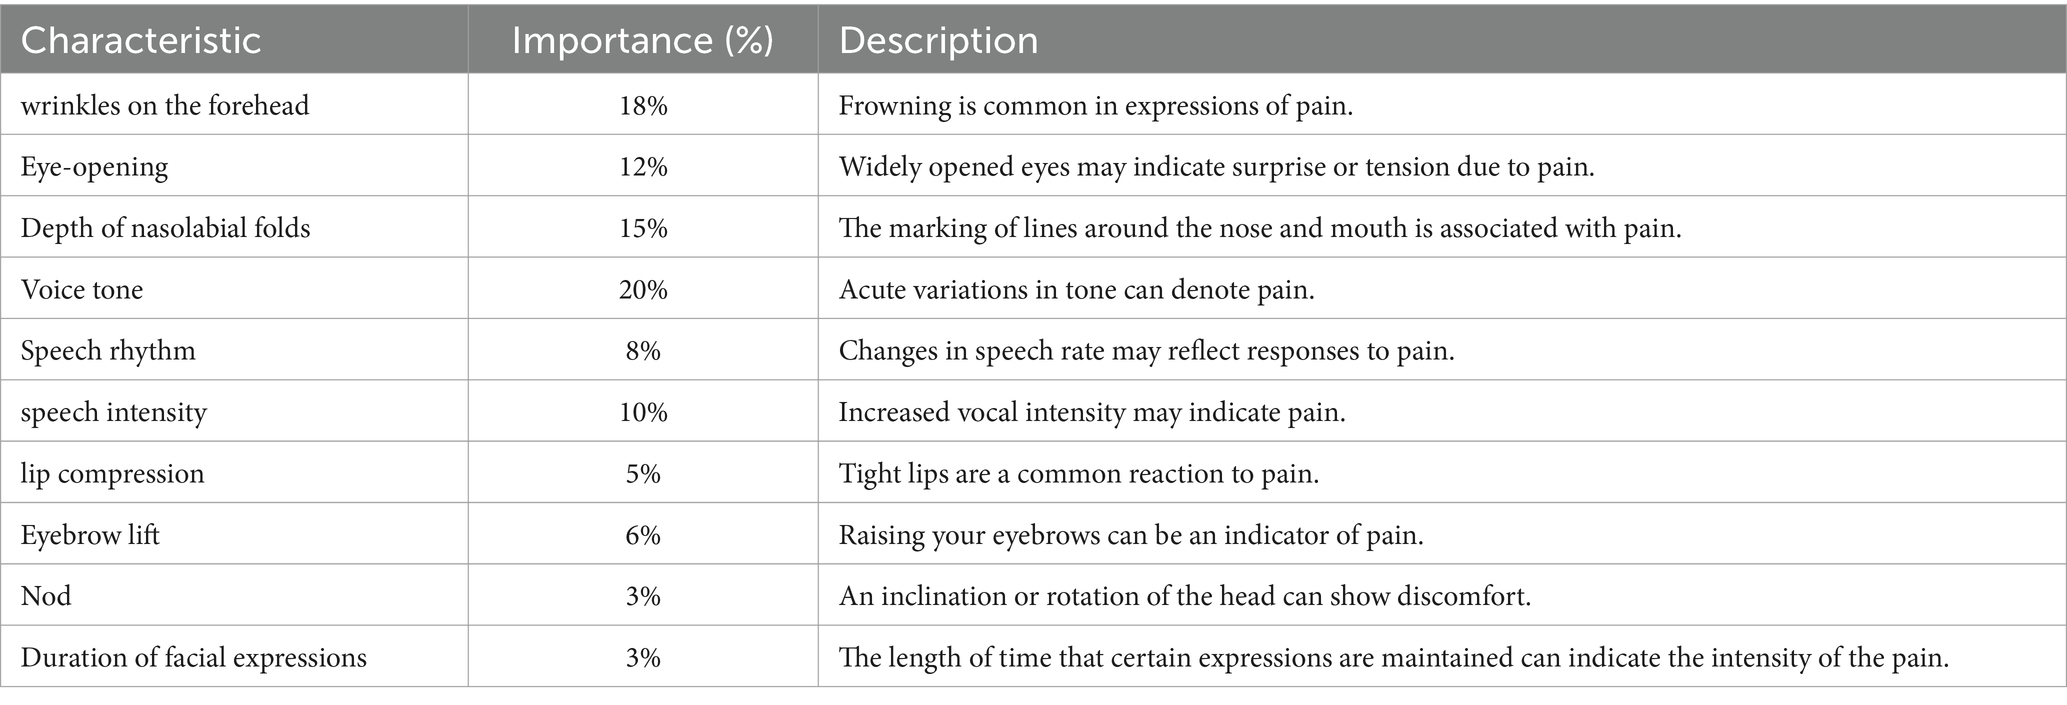
Table 5. Characteristics in pain detection: analysis of facial expressions and paralanguage.
Furthermore, features such as eye-opening and speech intensity played crucial roles, with 12 and 10% importance, respectively. These elements suggest an immediate physical and vocal response to pain, with changes in facial expression and vocal production that the model could accurately detect and analyze. Less predominant but equally revealing features, such as lip compression and eyebrow-raising, showed how subtle gestures also contribute to the expression of pain. Although individually less decisive, with the importance of 5 and 6%, their presence emphasizes the complexity of human responses to pain and the need for a holistic approach to its detection.
The process of determining the importance of these features involved analyzing extensive amounts of facial and vocal data and using advanced machine learning algorithms to identify significant patterns and correlations. This quantitative analysis revealed the most prominent features and how specific combinations and patterns of these indicators are associated with pain. Integrating these results into our model refines its ability to discern pain accurately and reliably. Each feature, with its respective quantified importance, contributes to a comprehensive profile that the AI system uses to evaluate and classify pain expressions, highlighting the synergy between facial and vocal components in pain encoding.
In evaluating features necessary for pain detection, we identified several critical parameters that influence model precision. To fine-tune our detection tool, we made specific adjustments to the model, detailed in the quantitative parameter adjustments table. This meticulous process ensured precise model tuning to capture pain cues accurately. Table 6 reveals the changes implemented to optimize the detection of pain-associated critical characteristics. For example, we increased the detection sensitivity for “Forehead wrinkles” from 0.5 to 0.75, reflecting a significant improvement in the model’s ability to identify subtle expressions of pain. This setting represents a finer focus on capturing the critical details for accurate detection.
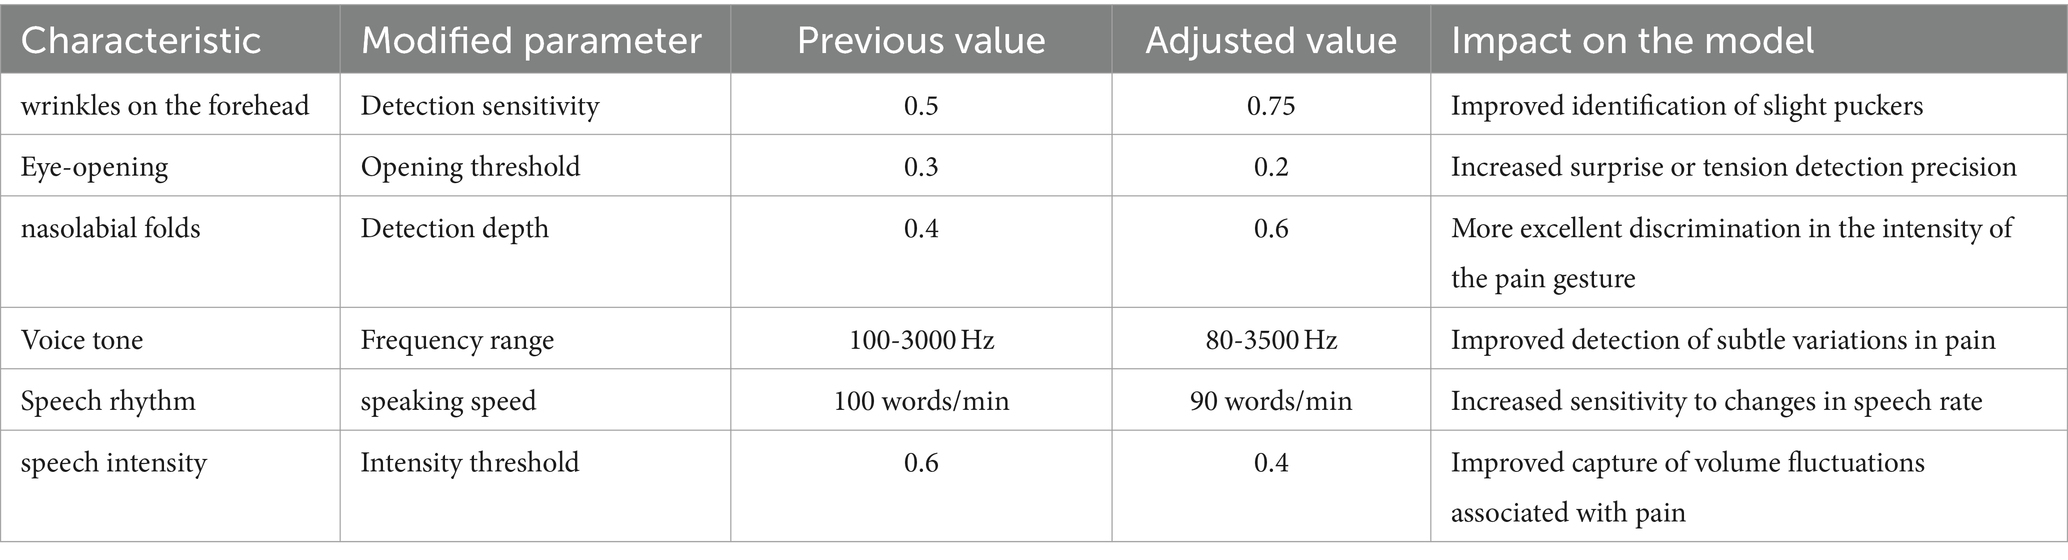
Table 6. Tweaking and optimizing features for improved pain detection.
Similarly, the eye-opening threshold was adjusted from 0.3 to 0.2, thus improving the detection of subtle facial expressions that indicate pain. Changes in the voice tone frequency range from 100–3,000 Hz to 80–3,500 Hz allowed the model to encompass a broader spectrum of vocal variations, improving the detection of nuances in the vocal expression of pain. These settings illustrate how each parameter contributes significantly to the overall performance of the pain detection system.
We achieved a stronger correlation between observed features by integrating these adjustments into the model. We detected pain instances, reflecting a notable improvement in the model’s ability to interpret and react to various pain manifestations.
Figure 5, obtained by applying the K-means algorithm, represents the next step in the analysis: a participant classification that incorporates multiple variables’ interaction. This approach allows you to visualize and analyze the distribution and clustering of pain levels in a more integrated and revealing way. The figure provides a clear map of emerging pain classification, delineating groups with distinct levels of pain characteristics. Visualization of these patterns through the 3D plot is a testament to our study’s dynamic and evolutionary nature, reflecting the model’s improved ability to interpret and classify pain more precisely and nuancedly.

Figure 5. Pain classification: correlation between forehead wrinkles, tone of voice, and nasolabial folds.
Each point represents a participant, and its color and shape correspond to one of the three most representative groups identified by the clustering algorithm based on the similarity of their pain-related characteristics. The group represented by green dots shows a lower concentration in all three dimensions, which could be interpreted as participants experiencing lower pain levels. On the other hand, red dots, which generally rank higher on at least one of the dimensions, suggest a higher level of pain expression. The blue dots are distributed between these two groups, which could correspond to a medium pain level.
The technical application of K-means here is an unsupervised analysis method that seeks to find the best way to separate data into k distinct groups based on their characteristics. We chose this method because it effectively identifies natural structures within a data set. The selection of k = 3 was strategically aligned with a previously established classification of pain levels. Still, it is worth noting that this number may vary depending on the needs and complexities of the specific data set. Analyzing these groups allows us to interpret how the different manifestations of pain correlate with facial expressions and paralanguage. Forehead wrinkles, for example, could reflect the frown caused by chronic pain, while changes in voice tone may be an immediate response to acute pain. For their part, the nasolabial folds can deepen with expressions of prolonged discomfort. These insights are essential to understanding individual variability in the experience of pain and improve the model’s ability to recognize pain more accurately and sensitively. The graph provides a visual representation that supports the validity of our classification methodology and highlights the importance of a multidimensional approach to pain detection.
Initial results, although promising, revealed opportunities to improve precision and robustness. Table 7 presents the actions taken and their impacts on the system. We started by increasing the complexity of the neural network architecture, going from three to four layers and doubling the units per layer from 64 to 128. This modification gave the model additional ability to capture and process complex patterns within the data, which is essential given the multifactorial nature of pain expressions.
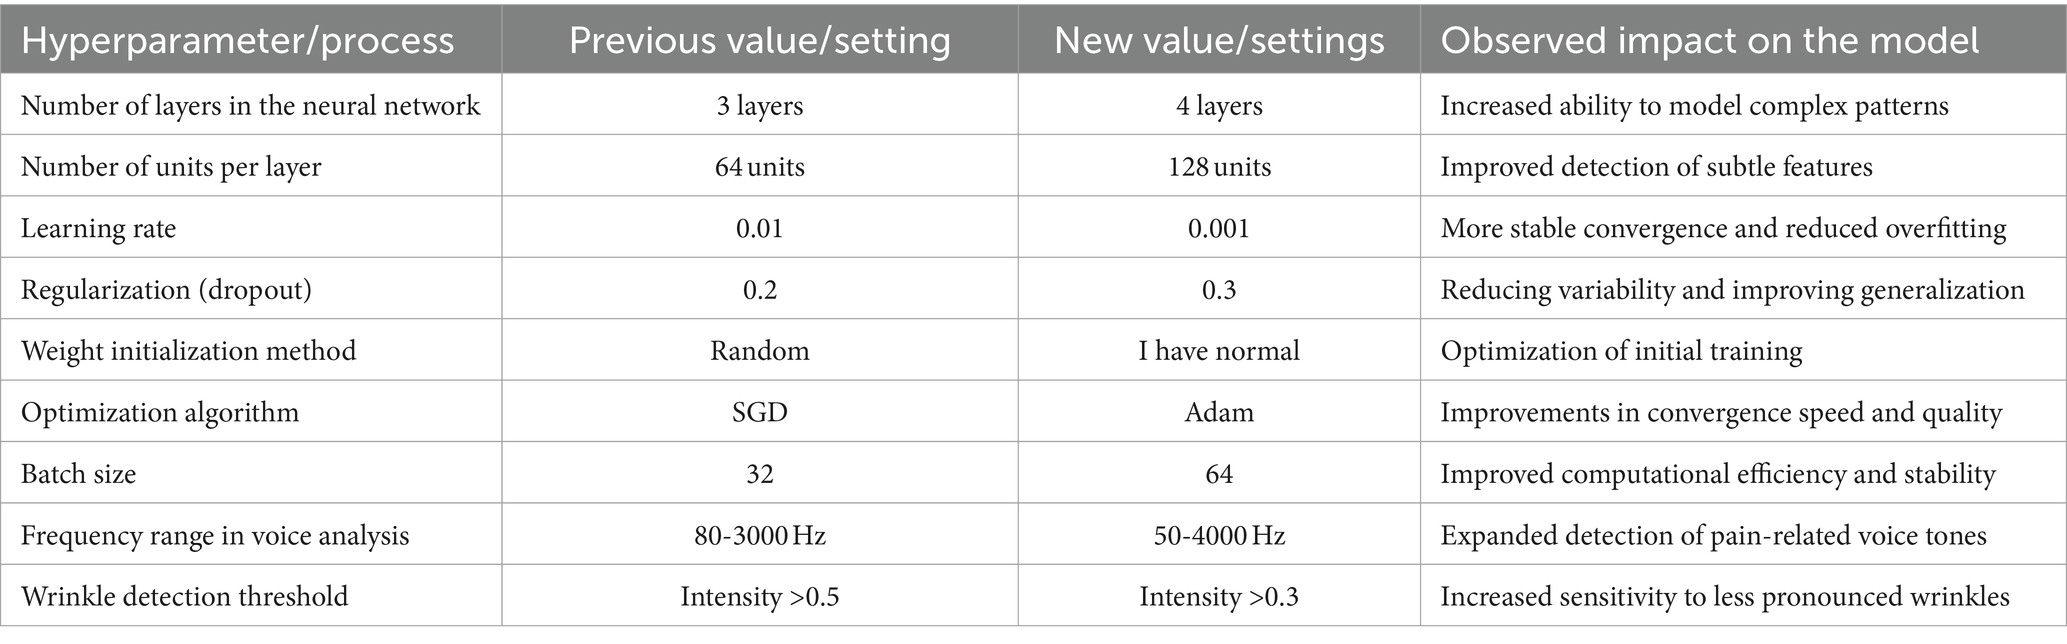
Table 7. Hyperparameter optimization: improvements and adjustments in the neural network for pain detection.
We adjusted the learning rate from 0.01 to 0.001, seeking a balance between convergence speed and stability during training, which resulted in considerable progress in avoiding overfitting. Additionally, we increased the regularization parameter (Dropout) from 20 to 30%, forcing the model to learn more robust and generalizable representations by forcing it not to rely excessively on any input during the training phase. The change in the weight initialization method to ‘Normal He,’ a technique recognized for its effectiveness in initializing deep neural networks and the transition to the Adam optimizer instead of the Stochastic Gradient Descent (SGD), resulted in tangible improvements. These changes optimized the learning process, reducing the time needed to reach optimal convergence and improving the generalization capacity of the model.
In addition, for pain feature detection, we adjusted feature extraction. We expanded the frequency range in voice analysis from 80–3,000 Hz to 50–4,000 Hz to capture a broader spectrum of pain-related tones. We lowered the intensity detection threshold for wrinkles from 0.5 to 0.3, which increased the model’s sensitivity to more subtle indicators of facial pain. These adjustments were informed by rigorous data analysis and a systematic optimization approach. The results were precise: the model became more efficient at detecting pain and showed an improved ability to operate reliably in various scenarios, bringing us closer to our goal of creating a pain detection system that is accurate and applicable in real-world environments.
Various approaches have been explored in pain detection, each with strengths and application areas. Our hybrid AI model, which integrates facial gesture and paralanguage analysis, compares favorably to several prominent methodologies based on standard performance metrics.
The first method compared, the Traditional SVM classifier, is based on traditional machine learning for facial expression classification. Despite its high precision and specificity, our model outperforms this approach with a better overall balance between all metrics, including a higher AUC, suggesting better discrimination between pain classes. Using CNN for facial images, the following approach is notable for its ability to process complex visual data. However, despite CNN’s ability to identify detailed image patterns, our hybrid model shows greater sensitivity and specificity, reflecting a remarkable ability to detect and rule out pain instances correctly.
The hybrid sensor system combines biometric data with audio analysis for a multifaceted approach to pain detection. When compared, our model matches in precision and offers greater sensitivity, indicating a superior ability to correctly identify pain cases, a critical advantage in clinical scenarios. The quantitative results of this comparison are summarized in Table 8.
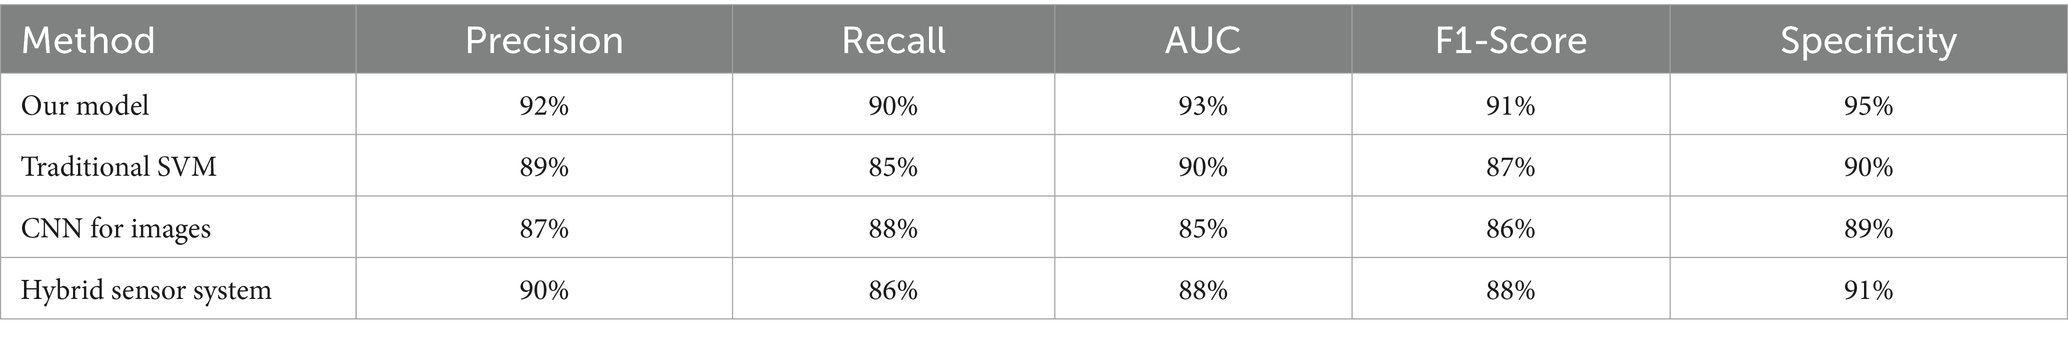
Table 8. Comparison of performance metrics with existing methods.
The literature review suggests a variety of methodologies applied in the detection and classification of pain. Traditional approaches, such as the use of SVM, have proven to be instrumental in establishing a solid foundation for the computational understanding of pain expressions (Höfel et al., 2021; Wang et al., 2023). However, recent studies, including those employing CNNs, highlight the trend toward more advanced approaches that exploit the capabilities of deep learning to interpret complex visual data. On the other hand, hybrid systems that combine diverse types of data point towards integrating multiple sources of information as the immediate future in pain detection (Vorkachev, 2022; Yue et al., 2024).
Our work aligns with these current trends and expands on them by combining paralanguage and facial gesture analysis techniques. By doing so, our model overcomes the individual limitations of each previous approach and establishes itself as a comprehensive solution. With a precision of 92% and a specificity of 95%, our model demonstrates a balance between sensitivity and generalizability, which is crucial for practical applications in natural and diverse environments. This represents a significant improvement in pain detection, where precision is an ethical imperative and a practical requirement for effective medical interventions.
The innovation and relevance of our model are evidenced by its multifaceted approach and superior performance, especially in recognizing subtle and complex patterns of pain expressions, potentially transforming pain assessment and treatment. With pain detection positioned as a critical challenge in modern healthcare, our model stands out for its high precision and generalizability, addressing one of the most difficult challenges in healthcare: correctly interpreting pain—the full range of human expressions of pain (De Sario et al., 2023).
This research expands the frontiers of automatic pain detection, providing a tool that could radically change pain management, alleviating human suffering through faster, more accurate identification and response (Khalifa and Faddal, 2017; Quintas et al., 2023) The importance of this work lies in its potential integration into patient monitoring systems, telemedicine applications, and clinical practice, thus significantly improving the quality of patient care. In short, our model is not just a technical advance; it is a step forward in humanizing technology in health service.
During the development and evaluation of the proposed model, several limitations and challenges were encountered that deserve to be discussed. One of the main challenges was collecting a sufficiently diverse and representative data set. Although the data set used consisted of 200 participants with an equal distribution regarding gender and socioeconomic background, there are still limitations regarding geographical and cultural diversity. This may affect the generalization of the model to different populations.
Pain is a highly subjective experience and can manifest differently in different people. This variability in facial expressions and paralanguage presented a significant challenge to the model. Despite efforts to capture a wide range of pain expressions, some signals may not have been adequately represented in the data set, affecting the model’s accuracy in some instances.
Integrating facial gestures and paralanguage data involved significant technical challenges. Temporal synchronization of the two modalities was crucial to ensure consistency in the analysis but also presented difficulties due to differences in the sampling rate and quality of data collected by the cameras and microphones. Preprocessing large volumes of video and audio data requires extensive computational resources. Data cleaning, denoising, and normalization required advanced techniques to ensure the high quality of the input data. Additionally, the need to perform data augmentation to improve the diversity of the data set added complexity to the process.
Although the model performed well on the test data set, its generalizability to other contexts and populations still needs to be validated. The lack of external data for independent validation is a limitation that should be addressed in future studies. Despite efforts to mitigate biases, the model may still be influenced by inherent biases in the data set. This could affect the model’s fairness in detecting pain among different demographic groups. It is essential to continue investigating and addressing these biases to improve the model’s fairness.
Despite these limitations and challenges, the proposed model has proven effective in pain detection using a combination of facial gestures and paralanguage analysis. Future work should address these limitations by collecting more diverse data sets, improving multimodal integration techniques, and externally validating the model.
This work has addressed the complex task of detecting and classifying pain using advanced AI technologies. It combines the analysis of facial gestures and paralanguage. Through a multidimensional approach, we have developed a hybrid AI model that identifies the physical manifestations of pain and interprets the associated vocal signals.
Our study has shown that integrating multiple data sources significantly improves the precision and robustness of the pain detection system. Our model outperforms traditional methods with an overall precision that reaches 92%, a recall of 90%, and an AUC of 93%. This highlights the effectiveness of deep learning techniques in recognizing complex and subtle patterns associated with pain. This high level of performance underlines the model’s ability to effectively differentiate between pain and non-pain states, which is crucial in clinical applications where precision can directly affect patient well-being.
Furthermore, the optimization and refinement of the model, based on the exhaustive analysis of the data and the validation results, have allowed a notable improvement in the sensitivity and specificity of the system. Adjustments in hyperparameters, such as the number of layers in the neural network, the learning rate, and regularization methods, have resulted in a more efficient system adapted to pain detection. Comparison with other methodologies revealed that, although there are numerous approaches to pain detection, our model stands out for its integrative approach and generalizability. This comparison highlights the importance of a holistic analysis and the need for systems that can adapt to the variability inherent in human expressions of pain.
Looking to the future, several areas are identified for the continuation of this work. One promising direction is the exploration of explanatory AI (XAI) to improve the transparency and understandability of model decisions. This would facilitate the acceptance of the technology among healthcare professionals and provide valuable insights into the nature of pain and its manifestation. Another avenue of research could focus on the personalization of the model, adjusting its operation to the individual characteristics of the patients. This could include developing pain profiles based on clinical histories, personal preferences, and treatment responses, thereby optimizing pain management interventions.
Additionally, integrating new data modalities, such as physical activity logs, sleep patterns, and biometric responses, could provide a more complete view of the patient’s condition, improving the system’s ability to detect and respond to pain in a broader context of health and well-being. Interdisciplinary collaboration will also play a crucial role in the evolution of this technology. Working with medical, psychology, neuroscience, and ethics experts will ensure that the solutions developed are technically sound, socially responsible, and ethically viable.
The data analyzed in this study is subject to the following licenses/restrictions: data supporting this study’s findings are available upon request from the corresponding author. The data is not made public to preserve privacy and confidentiality. Any data access request should be directed to WV-C, who can be contacted at d2lsbGlhbS52aWxsZWdhc0B1ZGxhLmVkdS5lYw==.
Ethical approval was not required for the study involving human samples in accordance with the local legislation and institutional requirements because the study is not considered as medical research. The study’s objective is the design of software to help identify gestures and does not use methods or devices that may be invasive for humans or animals. Written informed consent was obtained from the individual(s) for the publication of any identifiable images or data included in this article.
RG: Conceptualization, Data curation, Formal analysis, Investigation, Methodology, Software, Validation, Visualization, Writing – original draft. JG-O: Data curation, Software, Validation, Visualization, Writing – original draft. WV-C: Conceptualization, Data curation, Formal analysis, Funding acquisition, Investigation, Methodology, Project administration, Resources, Software, Supervision, Validation, Visualization, Writing – original draft, Writing – review & editing.
The author(s) declare that no financial support was received for the research, authorship, and/or publication of this article.
The authors declare that the research was conducted in the absence of any commercial or financial relationships that could be construed as a potential conflict of interest.
All claims expressed in this article are solely those of the authors and do not necessarily represent those of their affiliated organizations, or those of the publisher, the editors and the reviewers. Any product that may be evaluated in this article, or claim that may be made by its manufacturer, is not guaranteed or endorsed by the publisher.
Adusumalli, H., Kalyani, D., Sri, R. K., and Pratapteja, M., Rao PVRDP. Face mask detection using open CV. In: Proceedings of the 3rd international conference on intelligent communication technologies and virtual Mobile networks, ICICV 2021. (2021).
Arashloo, S. R., Kittler, J., and Christmas, W. (2017). An anomaly detection approach to face spoofing detection: A new formulation and evaluation protocol. IEEE Access 5, 13868–13882. doi: 10.1109/ACCESS.2017.2729161
Ayuningsih, A. A., Mahmud, M., Salija, K., and Muhayyang, M. (2022). Teachers’ paralanguage in classroom interaction. Retorika Jurnal Bahasa, Sastra, Dan Pengajarannya 15, 73–85.
Azzahra, Y., Muhayyang, M., and Korompot, C. A. (2022). The impacts of Teachers’ paralanguage in EFL Classroom. Journal of excellence in English language. Education 1, 1–13
Benavent-Lledo, M., Mulero-Pérez, D., Ortiz-Perez, D., Rodriguez-Juan, J., Berenguer-Agullo, A., Psarrou, A., et al. (2023). A comprehensive study on pain assessment from multimodal sensor data. Sensors 23, 9675. doi: 10.3390/s23249675
Béra-Louville, B. L., Barfety-Servignat, B. S., Jm, B., Veys, V., Pickering, P., Catsaros, C., et al. (2019). Diagnostic recommendations and treatment Management for Complex Regional Pain Syndromes: the Lille recommendations. Douleur et Analgesie. 32, 155–64. doi: 10.3166/dea-2019-0074
Borna, S., Haider, C. R., Maita, K. C., Torres, R. A., Avila, F. R., Garcia, J. P., et al. (2023). A review of voice-based pain detection in adults using artificial intelligence. Bioengineering 10:500. doi: 10.3390/bioengineering10040500
Chen, C., Han, D., and Chang, C. C. (2024). MPCCT: Multimodal vision-language learning paradigm with context-based compact Transformer. Pattern Recognit 147:110084. doi: 10.1016/j.patcog.2023.110084
Chen, C., Han, D., and Shen, X. (2023). CLVIN: Complete language-vision interaction network for visual question answering. Knowl Based Syst. 275:110706. doi: 10.1016/j.knosys.2023.110706
Chu, Y., Zhao, X., Han, J., and Su, Y. (2017). Physiological signal-based method for measurement of pain intensity. Front. Neurosci. 11:11. doi: 10.3389/fnins.2017.00279
De Sario, G. D., Haider, C. R., Maita, K. C., Torres-Guzman, R. A., Emam, O. S., Avila, F. R., et al. (2023). Using AI to detect pain through facial expressions: a review. Bioengineering 10:548. doi: 10.3390/bioengineering10050548
Gutiérrez, P. J. (2022). datos personales en el Ecuador como un derecho humano una necesidad de mejoramiento en su regulación. Revista Jurídica Crítica y Derecho. 3, 53–66. doi: 10.29166/cyd.v3i5.3950
Höfel, L., von der Beek, J., Draheim, N., Haas, J. P., and Schramm, A. (2021). Pain disorders in children and adolescents. Padiatrische Praxis 96, 108–129. doi: 10.1192/apt.bp.114.014068
Hu, X. S., Nascimento, T. D., Bender, M. C., Hall, T., Petty, S., O’Malley, S., et al. (2019). Feasibility of a real-time clinical augmented reality and artificial intelligence framework for pain detection and localization from the brain. J. Med. Internet Res. 21:13594. doi: 10.2196/13594
Huang, J., Shang, Y., and Chen, H. (2019). Improved Viola-Jones face detection algorithm based on Holo Lens. Eurasip J. Image Video Process. 2–11. doi: 10.1186/s13640-019-0435-6
Irshad, R. R., Shaman, F., Alalayah, K. M., Alwayle, I. M., Hazber, M. A. G., Aqlan, A. M., et al. (2023). Convolutional neural network enable optoelectronic system for predicting cardiac response by analyzing auction-based optimization algorithms. J. Nanoelectron. Optoelectron. 17, 1274–1282. doi: 10.1166/jno.2022.3329
Khalifa, E. M., and Faddal, H. (2017). Impacts of using paralanguage on teaching and learning English language to convey effective meaning. Studies in English. Lang. Teach. 5:295. doi: 10.22158/selt.v5n2p295
Liao, L., Guo, Z., Gao, Q., Wang, Y., Yu, F., Zhao, Q., et al. (2023). Color image recovery using generalized matrix completion over higher-order finite dimensional algebra. Axioms 12, 954. doi: 10.3390/axioms12100954
Luangrath, A. W., Xu, Y., and Wang, T. (2023). Paralanguage classifier (PARA): an algorithm for automatic coding of paralinguistic nonverbal parts of speech in text. J. Mark. Res. 60, 388–408. doi: 10.1177/00222437221116058
McGrath, H., Flanagan, C., Zeng, L., and Lei, Y. (2019). Future of artificial intelligence in anesthetics and pain management. J. Biosci. Med. 7, 111–118. doi: 10.4236/jbm.2019.711010
Mekruksavanich, S., and Jitpattanakul, A. (2021). Deep convolutional neural network with rnns for complex activity recognition using wrist-worn wearable sensor data. Electronics (Switzerland) 10:141685. doi: 10.3390/electronics10141685
Nagireddi Meng, J. N., Vyas, A. K., Sanapati, M. R., Soin, A., and Manchikanti, L. (2022). The analysis of pain research through the Lens of artificial intelligence and machine learning. Pain Physician 25, e211–e243.
Nguyen, H. D., Tran, K. P., Thomassey, S., and Hamad, M. (2021). Forecasting and anomaly detection approaches using LSTM and LSTM autoencoder techniques with the applications in supply chain management. Int. J. Inf. Manag. 57:102282. doi: 10.1016/j.ijinfomgt.2020.102282
Oualla, M., Ounachad, K., and Sadiq, A. (2021). Building face detection with face divine proportions. Int J Online Biomed. Eng. 17, 63–80. doi: 10.3991/ijoe.v17i04.19149
Quintas, S., González-Martínez, A., and Gago-Veiga, A. B. (2023). Artificial intelligence in migraine and other headaches, vol. 18: Kranion.
Sandeep, P. V. K., and Kumar, N. S. (2024). Pain detection through facial expressions in children with autism using deep learning. Soft. Comput. 28, 4621–4630. doi: 10.1007/s00500-024-09696-x
Shi, S., Han, D., and Cui, M. (2023). A multimodal hybrid parallel network intrusion detection model. Conn. Sci. 35:2227780. doi: 10.1080/09540091.2023.2227780
Vorkachev, S. G. (2022). Somatic verbalization: a paralanguage of gratitude (according to Corpus linguistics). Curr. Issues Philol. Pedagogical Linguist. 1, 243–250. doi: 10.29025/2079-6021-2022-1-243-250
Wang, H., Han, D., Cui, M., and Chen, C. (2023). NAS-YOLOX: a SAR ship detection using neural architecture search and multi-scale attention. Conn Sci. 35, 1–32. doi: 10.1080/09540091.2023.2257399
Keywords: artificial intelligence, multimodal pain detection, artificial intelligence in medicine, analysis of facial gestures and paralanguage, deep learning
Citation: Gutierrez R, Garcia-Ortiz J and Villegas-Ch W (2024) Multimodal AI techniques for pain detection: integrating facial gesture and paralanguage analysis. Front. Comput. Sci. 6:1424935. doi: 10.3389/fcomp.2024.1424935
Edited by:
Sokratis Makrogiannis, Delaware State University, United StatesReviewed by:
Yaqi Chu, Chinese Academy of Sciences (CAS), ChinaCopyright © 2024 Gutierrez, Garcia-Ortiz and Villegas-Ch. This is an open-access article distributed under the terms of the Creative Commons Attribution License (CC BY). The use, distribution or reproduction in other forums is permitted, provided the original author(s) and the copyright owner(s) are credited and that the original publication in this journal is cited, in accordance with accepted academic practice. No use, distribution or reproduction is permitted which does not comply with these terms.
*Correspondence: William Villegas-Ch, d2lsbGlhbS52aWxsZWdhc0B1ZGxhLmVkdS5lYw==
Disclaimer: All claims expressed in this article are solely those of the authors and do not necessarily represent those of their affiliated organizations, or those of the publisher, the editors and the reviewers. Any product that may be evaluated in this article or claim that may be made by its manufacturer is not guaranteed or endorsed by the publisher.
Research integrity at Frontiers
Learn more about the work of our research integrity team to safeguard the quality of each article we publish.