 Hua Qian
 Yu Chen2
 Yelu Jiang
- 1School of Digital Arts, Suzhou Art and Design Technology Institute, Suzhou, Jiangsu, China
- 2School of Computer Science and Technology, Soochow University, Suzhou, Jiangsu, China
The experiments involving protein denaturation and refolding serve as the foundation for predicting the three-dimensional spatial structures of proteins based on their amino acid sequences. Despite significant progress in protein structure engineering, exemplified by AlphaFold2 and OmegaFold, there remains a gap in understanding the folding pathways of polypeptide chains leading to their final structures. We developed a lightweight tool for protein unfolding visualization called PUV whose graphics design is mainly implemented by OpenGL. PUV leverages principles from molecular biology and physics, and achieves rapid visual dynamics simulation of protein polypeptide chain unfolding through mechanical force and atom-level collision detection and elimination. After a series of experimental validations, we believe that this method can provide essential support for investigating protein folding mechanisms and pathways.
1 Introduction
The biological functions of proteins are determined by their three-dimensional structures, which arise from specific folding mechanisms dictated by their amino acid sequences. The sequence information of a protein molecule determines its three-dimensional structure, and the relationship between sequence and folding is a focal point in structural biology (Anfinsen, 1973; Branden and Tooze, 2012). Under certain conditions, protein unfolding can be seen as the reverse process of protein folding (Ferina and Daggett, 2019). In nature, it is difficult to obtain a naturally unfolded protein, using thermodynamic or mechanical means to unfold and refold proteins is a feasible and effective approach for folding observations (McCully et al., 2008; Mayor et al., 2000). Hence, the study on visualization based on simulations for protein unfolding is important to understand protein folding process since visualizing the protein unfolding process offers a cost-effective means of generating valuable reference data for folding (Dinner and Karplus, 1999). Additionally, thermal unfolding assays for protein characteristics assist in studying protein function and interactions (Kotov et al., 2021). The folding and unfolding processes of the protein are shown in Figure 1.
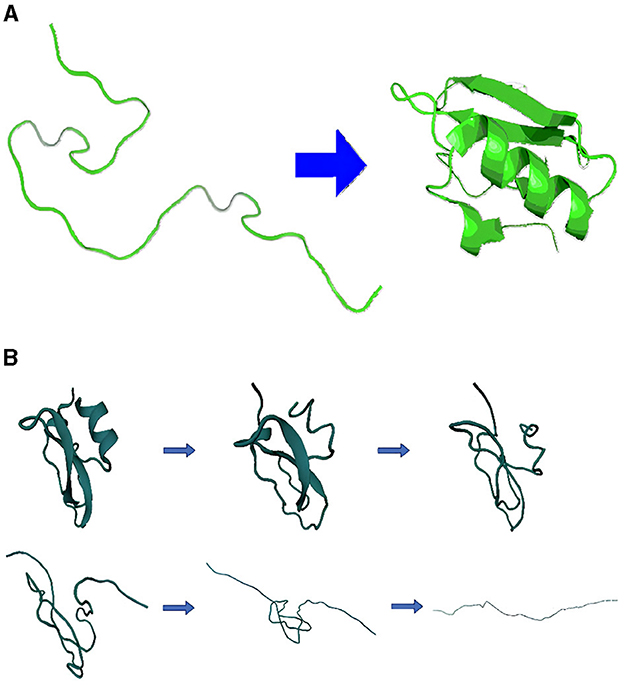
Figure 1. Schematic of protein folding and unfolding process. (A) Folding process and (B) unfolding process.
In order to study the stability of proteins, many researchers performed biological folding/unfolding experiments on proteins in the past few decades. At the earliest stage, researchers obtained a denatured protein through thermodynamic methods, e.g., high temperatures, low temperatures, or high pressures, to induce proteins to lose their native structure and study the relationship of thermodynamics parameters and protein structures (Brandts, 1964; Swint and Robertson, 1993; Griko et al., 1994; Wintrode et al., 1994; Greenfield, 2006; Puglisi et al., 2020). In the past century, researchers used optical tweezers to manipulate single molecules to perform unfolding process for denatured proteins (Kellermayer et al., 1997; Tskhovrebova et al., 1997). After that, many more detailed studies related to mechanical force on single molecule emerged one after another (Raschke and Marqusee, 1997; Cecconi et al., 2005; Shank et al., 2010; Stigler et al., 2011; Guinn et al., 2015; Bustamante et al., 2021). The application of mechanical force has numerous advantages, such as directly determining the energy of states with poor quality, etc. (Bustamante et al., 2020).
When observing or recording the protein unfolding process using biochemical experimental methods (such as NMR and X-RAY), it's crucial to note that these folding events happen within an extremely brief time frame (Mortensen and Williams, 2015; Eaton et al., 1996; Bustamante et al., 2020). This necessitates stringent experimental conditions, which in turn, pose challenges in obtaining reliable data and achieving high-resolution temporal characterization (Dill et al., 2008; Ferina and Daggett, 2019). The emergence of computational methods such as molecular dynamics (MD) simulation (Thompson et al., 2022; Van Der Spoel et al., 2005; Eastman et al., 2017) filled this gap. These approaches can simulate the trajectory of folding/unfolding under different denaturing conditions, e.g., high temperature or mechanical force, and output amount of data (Levitt et al., 1995; Ackbarow et al., 2007; Keten and Buehler, 2008; McCully et al., 2008; Childers and Daggett, 2018; Ferina and Daggett, 2019). Moreover, Ackbarow et al. (2007) and Keten and Buehler (2008) simulated the ultimate strength through stretching to unfold. Although MD has provided great convenience for studying protein folding, its simulation of all ideal atoms still requires huge computational resources and consumption (Ferina and Daggett, 2019), such as the calculation of the interactions between the physical or chemical forces of all atoms. Consequently, these experiments are tailored to specific proteins, further complicating the process. In addition, the accuracy and reliability of its simulation results are still questionable (Ackbarow et al., 2007; Ferina and Daggett, 2019). Therefore, it's important to acknowledge that conducting these experiments, as well as MD simulations, can incur substantial costs and can easily be substituted by simpler models with efficient sampling techniques (Barducci et al., 2011; Holdijk et al., 2023).
Recently, AI-based methods have emerged and received great success in protein structure engineering, including structure prediction (Senior et al., 2020; Cramer, 2021; Baek et al., 2021; Wu R. et al., 2022) or protein structure design (Wu K. E. et al., 2022; Ni et al., 2023). Protein structure prediction involves end-to-end prediction from sequence to structure, while protein design is to accurately obtain protein sequences by regularly observing the expected structure. Specially, FoldingDiff (Wu K. E. et al., 2022) simulates the folding process with angle-level diffusion to design unknown proteins and ForceGen (Ni et al., 2023) considers the nanomechanical response during the unfolding process when designing the proteins. However, they all target the final stable structure which means the precise of folding/unfolding process is not really considered, e.g., collision detection.
Scientific computational visualization represents a fundamental research domain within computer graphics. This approach leverages computer graphics principles and techniques to convert extensive datasets stemming from scientific and engineering computations into visual representations, encompassing graphics, images, animations, and more. The goal is to present complex data in an easily comprehensible manner. This multidisciplinary field spans computer graphics, image processing, computer vision, computer-aided design, and graphical user interfaces. One prevalent research application of computational visualization involves the exploration of protein structures. Experienced biochemists can often extract crucial patterns and insights from these visual representations. Pymol (DeLano et al., 2002), Chimera (Pettersen et al., 2004) and Discovery Studio (2008) are classical biological visualization tools with users friendly interfaces.
The unfolding process of a peptide is governed by two fundamental constraints. Firstly, the atoms within the peptide must avoid colliding with each other. Secondly, the bonds connecting these atoms must remain intact. This thesis adopts a representation of the folded peptide chain as a linear structure, striking a balance between rigidity and flexibility. Within this chain, each atom has the freedom to rotate around its neighboring atom while adhering to the constraints imposed by the bonds that connect them. These bonds signify the connections between bonded atoms. By applying an external force to both ends of the chain and employing a dynamics simulation engine, the peptide chain gradually elongates, ultimately revealing the primary structure of the protein. This approach allows for a meticulous tracking of the entire protein unfolding process and the simulation helps to predict the mechanical properties of protein unfolding (Ni et al., 2024).
By employing the unfolding simulation, we have developed and put into operation a visualization system, known as the Protein Unfolding Visualization system (PUV), which is based on constraint dynamics. This system aims to play the entire protein unfolding process through 3D animations. The unfolding process is both rapid and intricate, exhibiting variability under diverse conditions. While PUV may not elucidate the underlying nature of this process, it is capable of offering a plausible potential pathway for investigation. Experimental findings demonstrate that the system can unfold and animate a native protein with fewer than 130 residues in less than an hour. Due to its close integration with protein unfolding and reduced emphasis on other functionalities, PUV stands as a more lightweight tool when compared to PyMOL (DeLano et al., 2002). The contributions of this paper encompass:
1. Introduction of an innovative visualization technique for macromolecules, including proteins, through the use of a rigid body representation.
2. Establishment of close integration with the solution for protein unfolding through a straightforward dynamics approach. It can assist any unfolding method in validating the unfolding path.
3. Implementation of effective collision detection and resolution methods.
2 Methods
This section will concentrate on the design and implementation of PUV, including the algorithms and technical intricacies inherent in its development. It encompasses several key components: the analysis and encapsulation of protein data files, the visualization of the protein's three-dimensional structure, as well as the detection and resolution of collisions among protein atoms in space.
2.1 Overview of the algorithm
The PUV system has been developed using an object-oriented approach, with data encapsulated within classes to ensure excellent scalability. The workflow of PUV is depicted in Figure 2. It begins with obtaining the relevant standard PDB file from the RCSB PDB database (Bank, 1971), which is then input into the PUV system. After passing through the protein data encapsulation module, the protein molecular 3D structure display module, and the dynamics simulation computation module, the protein unfolding process is recorded in the form of sequential slice images. Finally, these slice images are played in sequence to illustrate the protein unfolding process.

Figure 2. The workflow of PUV.
2.2 The visualization of PDB file
The initial step in PUV involves importing protein data. The primary objective is to accurately model and visualize the three-dimensional structure of the protein. PUV primarily works with protein data files in the PDB format which are standard data files used in the RCSB Protein Data Bank. To enable precise visualization and simulation computations, it's essential to encapsulate this protein structure data. Standard PDB files contain spatial location information for individual atoms within proteins, which we consider as the three-dimensional structural data for the proteins. PUV offers various rendering graphics for protein three-dimensional structures using OpenGL's API interfaces, including wireframe model (Line), VDW model, backbone model (Backbone), and tube model (Tube).
2.2.1 Line model
Rendering protein wireframe models primarily involves drawing bonds, which can be accomplished by iterating through all the bonds. However, to achieve improved display effects and distinguish between different atoms, we divide the bonds into two segments. For instance, in a C-O bond, one half of the line near the C atom is colored green, while the end near the O atom is colored red. This technique enhances atom differentiation and contributes to the visual representation of the protein structure.
2.2.2 VDW model
Rendering in VDW (van der Waals) mode primarily involves representing atoms as spheres centered at their positions, with the van der Waals radius serving as the sphere's radius. With the coordinates for all the atoms, and the van der Waals radii are known data: carbon (C) atoms have the van der Waals radius of 1.7 Å, oxygen (O) atoms have the radius of 1.52 Å, nitrogen (N) atoms have a radius of 1.55 Å, and hydrogen (H) atoms have a radius of 1.20 Å, users can draw spheres of the corresponding colors at the centers of the atoms to represent them in VDW mode.
2.2.3 Backbone and tube models
The backbone and tube models for proteins both represent the peptide chain structure by connecting the Cα atoms of each residue to each other. In our protein structural system, referencing the central positions of the Cα atoms is very convenient. The difference lies in their visualization: the backbone is typically represented using lines, while the tube model uses pipe-like or band-like structures. For the backbone model, a simple straight line drawing function can be employed to sequentially connect the Cα atoms. Similarly, for the tube model, a pipe drawing function can be used instead of a straight line drawing function to create the tube-like representation.
2.3 Rigid body representation
In the representation of protein peptide chains, atoms are depicted as rigid spheres, and they are connected by chemical bonds. During actual simulation computations, it's common to omit disulfide bridges (SS bonds) after importing PDB data. Biochemically, this means breaking the SS bonds, thereby avoiding cyclic structures within the peptide chain.
Each atomic rigid body in the simulation possesses the following attributes: position, orientation, linear velocity, angular velocity and mass. These data values are all represented as vectors. When an atom is connected to two or more other atoms, it becomes a joint node. This joint node can be considered as a rotational axis, and its rotational amplitude must satisfy constraints such as dihedral angles of the residues. Other atoms connected to this joint atom must move (rotate) around this joint atom during their motion. The joint nodes of the atomic rigid bodies are shown in Figure 3. The relative distance between the atoms of chemical bonds remains constant to ensure that the primary structure of the protein does not break. In addition, when the simulation involves a complex with multiple chains, we simply split the complex by chain and then perform experiments on the specified chain.
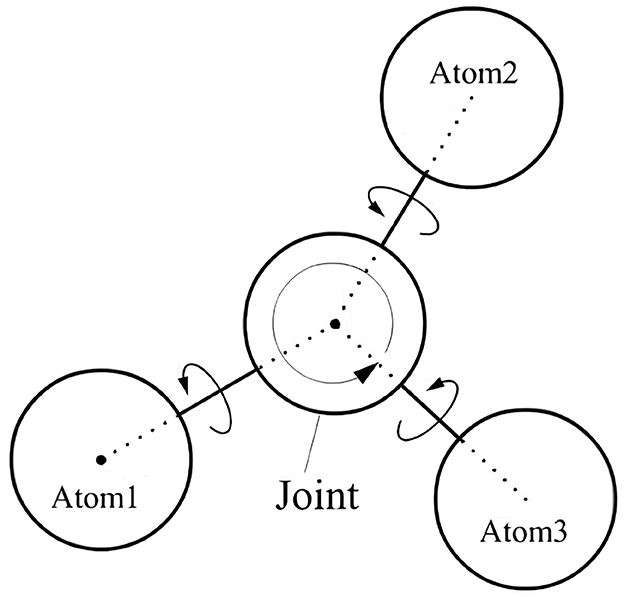
Figure 3. Atomic rigid representation.
The atomic mass is currently set to 1 unit, and all atoms are assumed to be identical. When the simulation begins, PUV applies a random force in a random direction to each atom, resulting in initial linear velocities and angular velocities relative to the joint nodes. For the centroid of the atomic body (Position), it is represented using a 3 × 1 matrix vector:
where px, py, pz are the three coordinate components representing the centroid of the atomic body in space.
The linear velocity of an object is the derivative of its position with respect to time. Similarly, we can represent the linear velocity of an object with just a variable of the vector type. It is represented with a 3 × 1 vector as follows:
The angular velocity of an object is represented by a 3 × 1 vector as shown in the following formula:
If vector á represents the offset of a point on the atomic sphere relative to its center of mass, then the corresponding relative velocity and global velocity of this point are:
where R is the rotation matrices to the global coordinates.
For the situation shown in Figure 3, the constraint formed by the atomic body, joint, with the connected atoms Atom1 and Atom2 can be described as:
where p1 is the centroid position of atom1 and p2 is the centroid position of atom2, á1 is the offset of atom1 relative to joint and á2 is the offset of atom2 relative to joint. R1 and R2 are the rotation matrices of atom1 and atom2, respectively, relative to the global coordinates.
Then differentiate Equation 1 with respect to time t:
where Ṙ is the derivative of R with respect to dt.
where is the antisymmetric matrix of ω.
Finally, we obtain a constraint Equation 2 regarding linear velocity and angular velocity. Two atoms connected by the same joint should satisfy this constraint.
2.4 Collision detection algorithm of the PUV system
Collision detection is a commonly used technology in 3D graphics processing systems, playing a significant role in enhancing the realism of simulation systems. Given that proteins are composed entirely of spherical atoms, we have employed the bounding sphere algorithm to manage atom collisions (Jiménez et al., 2001). This method boasts advantages such as ease of implementation, minimal storage requirements, and low complexity in intersection tests.
Given that our subject of study is spherical, which is quite unique, we don't need to consider the compactness of the bounding in our case. In the PUV system, the atomic spheres are fully and tightly bounded. In our experiments, based on the properties of the atoms, the radius of the bounding sphere is set at a fixed value of 0.45 Å.
Let the center of atomic body A be CA with radius rA, the center of atomic body B be CB with radius rB, and the permissible surface contact distance be δ, then:
Due to the spherical collision, the type of collision contact is point contact. Let be the unit vector of , PA be the collision point of atomic body A, and PB be the collision point of atomic body B, then we have:
To accelerate the collision detection performance and reduce the computational load, we use the dynamic octree for spatial hierarchical division. Collision detection is only performed for atomic bounding spheres located within the same octree leaf node. This greatly reduces the number of pairwise intersection checks in space, thus speeding up the simulation process.
The construction of the dynamic octree adopts a top-down approach. Firstly, an evaluation system is established: specifying the maximum depth of the tree and a threshold Kmax for the number of objects contained in a leaf node. The establishment of this evaluation system serves two purposes: (1) To prevent stack overflow that may arise from excessively deep tree depths during the recursive construction of the octree; (2) To limit the maximum number of pairwise collision detection in a leaf node through Kmax. If the number of atomic bodies contained in a node exceeds Kmax and its depth is less than the maximum depth, the node will undergo further spatial subdivision, forming eight child nodes.
This process continues until the specified evaluation system criteria are met. When the position of an active atomic body changes, the octree leaf node it originally belonged to no longer suits it. At this point, it will be removed from its original leaf node and inserted into a new one. This operation requires knowledge of the leaf node that the atomic body originally belonged to. A full-tree search for this would inevitably result in efficiency loss. To solve this problem and more quickly locate the leaf node, after establishing the spatial octree, a pointer must be added to each atomic body pointing to the octree leaf node containing it.
When the position of an active object changes, the pseudocode for updating the spatial octree is as the following Algorithm 1:
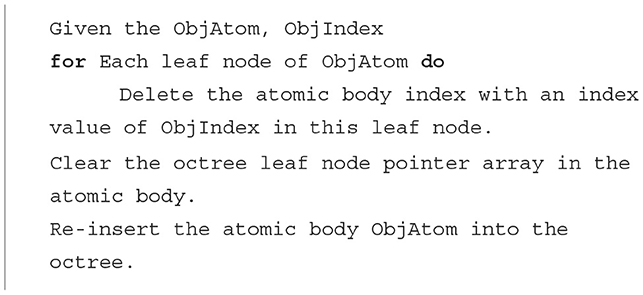
Algorithm 1. The update algorithm for the spatial octree.
When protein molecules, composed of a vast array of atoms, undergo collisions between their atomic components, the post-collision interactions become notably complex, resulting in intricate interplay among the colliding entities. To enhance collision detection efficiency, PUV utilizes octree spatial division to manage colliding atomic bodies. The pseudocode for this algorithm is provided in Algorithm 2.
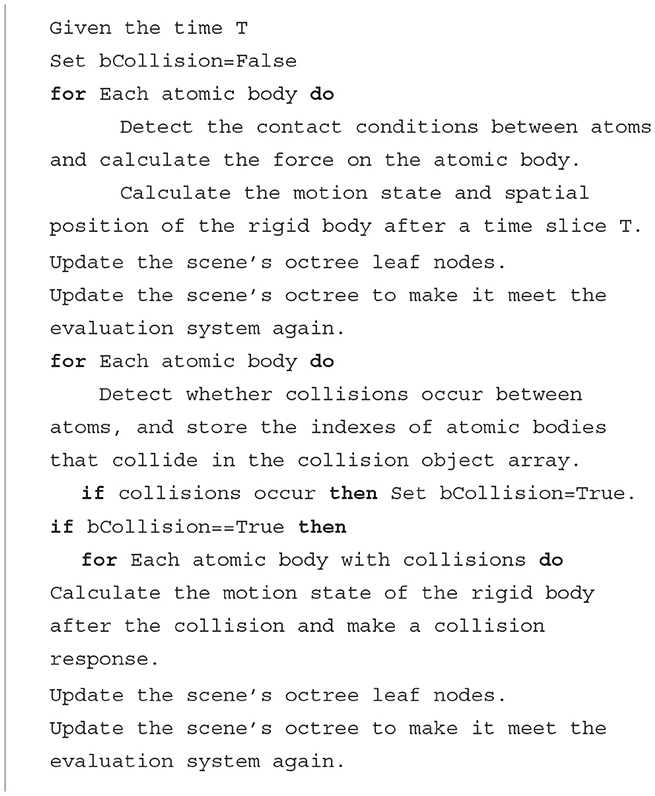
Algorithm 2. The algorithm of managing collision atomic bodies.
2.5 The overall simulation algorithm of PUV
During the unfolding process, the polypeptide chain must adhere to two fundamental constraints: Firstly, there should be no overlapping or penetration between the effective volumes of the atoms. Secondly, the chemical bonds between the atoms within the polypeptide chain and the residues should not break, meaning that there are distance constraints between atoms.
We represent the polypeptide chain as a rigid linear chain with specific degrees of freedom in motion. The atoms on the peptide chain are visualized as rigid spheres capable of free rotation, while atoms connected to each other are constrained by joint nodes. Using this representation, we generate data for simulating protein unfolding, as depicted in Figure 4. The simulation algorithm for PUV is outlined in Algorithm 3.

Figure 4. Reconstruct the polypeptide chain using rigid spheres and joint nodes.
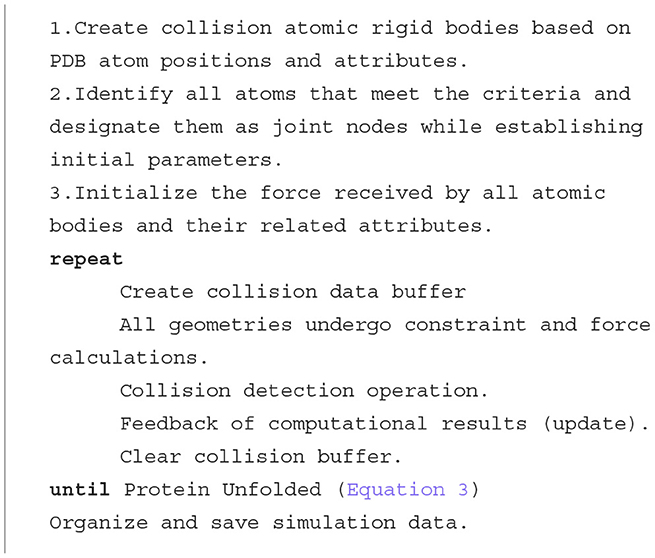
Algorithm 3. PUV simulation.
During the simulation process, we apply external forces in random directions to all protein atoms using the Monte-Carlo method. On the N-terminus and C-terminus of the polypeptide chain, we apply opposite, relatively large constant forces to purposefully stretch the polypeptide chain in both directions (Rief et al., 1997). Considering the possibility that the N-terminus and C-terminus may knot with the loops in the complex polypeptide chain during the stretching process; when initializing the system, based on the structure of the protein, we prioritize the application of traction forces on the N-terminus and C-terminus that move away from the center of the protein structure, i.e., away from the center position of the protein structural body.
Simply, stop the simulation when the spatial distance between the N-terminus and C-terminus Cα atoms satisfies the following formula.
here R is a scaling factor, where 0 < R < 1. This means that when the distance between the N-terminus and C-terminus Cα atoms reaches a certain proportion of the theoretical straightened distance of the peptide chain, we consider that the peptide chain has extended, and the unfolding simulation process is terminated.
3 Performance evaluation
As mentioned above. We have designed a system for visualizing protein unfolding simulations, named the Protein Unfolding Visualization (PUV) system. This section will primarily showcase the results and performance of our system.
3.1 PUV system
When using the PUV system to visualize protein unfolding simulations, users can select the protein molecule PDB file they want to simulate through the “Open” command in the file menu. PUV utilizes STRIDE (Frishman and Argos, 1995) for classifying protein secondary structures, which provides information about hydrogen bonds, dihedral angles, and more. This data is used to define biochemical condition constraints during protein unfolding simulations. Moreover, STRIDE is a widely used tool for identifying protein secondary structure elements, such as α-helix and β-sheet, and it offers valuable insights into hydrogen bonds and dihedral angles. This information is crucial for simulating protein structure and dynamics. In the context of protein unfolding simulations, this data is employed to constrain the protein's structure and secondary structure, enabling a more realistic simulation of protein unfolding under biochemical conditions. Once PUV loads the desired protein molecule file for simulation, users can access the settings menu to adjust various simulation parameters, such as simulation step size, simulation process tolerance control coefficient, system background color, and more. If no adjustments are made, the system will proceed with its default parameters. The visual display effect after opening a PDB file with the PUV system is shown in Figure 5.

Figure 5. Pdb displayed by PUV. Green spheres represent the Cα atoms on the backbone, while gray tubular lines represent the contacts.
3.2 PUV's display of protein 3D structure
Through the “Representation” button, PUV provides users with multiple options for visualizing protein 3D structures, including colored dot particles, colored line forms, ball-and-stick models, and tubular representations. These diverse representations offer excellent display performance for static protein 3D structures. The visual effects of PUV for the protein 3EE7 are illustrated in Figure 6.
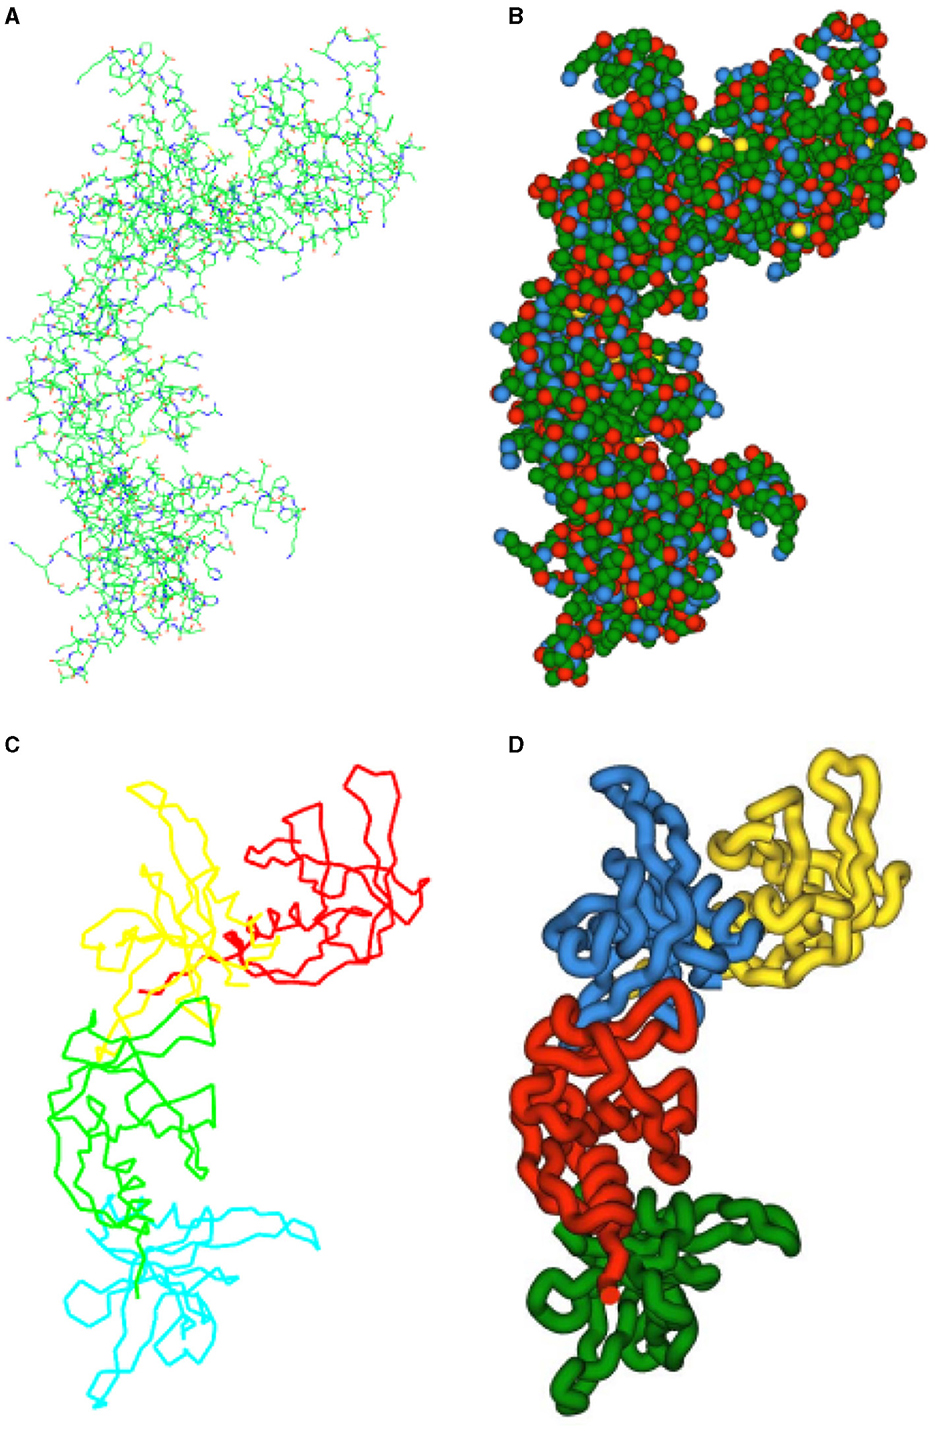
Figure 6. PUV displays the 3D structure of protein 3EE7: (A) Line model. The chemical bonds are distinguished by two colors. The half that is close to the carbon atom is rendered in green, while the half that is close to the other atom interacting with the carbon is painted red. (B) VDW model. Different atoms are represented as spheres of different colors centered at their positions, with the radius of the spheres being equal to the van der Waals radius. The (C) Backbone skeletal model and (D) Tubular model utilize lines and tubes to represent the protein's backbone, respectively. (C, D) Employ distinct color segments to highlight the substructures of the protein for better visualization.
3.3 Protein unfolding simulation
We use PUV to conduct unfolding simulation tests on various protein peptide chains. The tests were divided into two groups:
1. Experiments with varying protein peptide chain lengths.
2. Experiments with consistent protein peptide chain lengths but different structures.
The experiments were conducted on a PC with the following specifications: Intel Core2 dual-core 2.6GHZ CPU, 2GB RAM, running on the Vista SP1 operating system. The protein structure files were all sourced from the RCSB protein database. The steps used for the protein unfolding simulation were consistent, yielding results at the same simulation step size.
3.3.1 Test on proteins with different numbers of residues
The comparative test results for the unfolding simulation of protein peptide chains with varying numbers of residues are presented in Table 1.
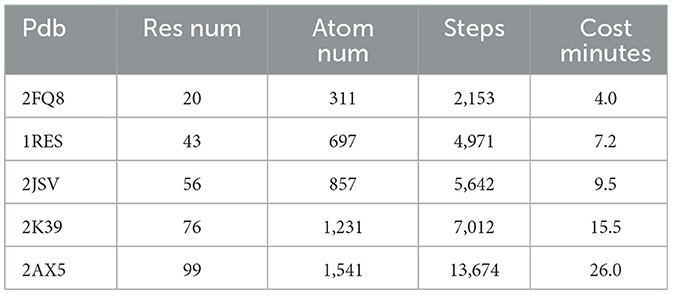
Table 1. Test results for proteins with varying numbers of residues.
The simulation results clearly indicate that as the number of residues increases, the computational load in the all-atom mode also significantly increases. Consequently, each simulation step requires substantially more computation. With the same step size, the number of simulation steps and the time required for peptide chain expansion also increase noticeably.
3.3.2 Unfolding tests for proteins with the same number of residues but different structures
For the unfolding simulation of proteins with the same number of residues, the comparative test results are shown in Table 2.
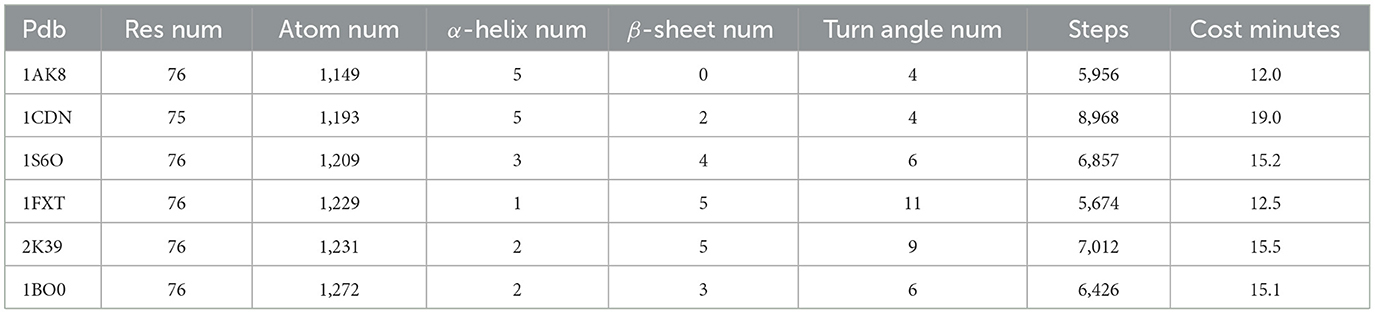
Table 2. Test results for proteins with same number of residues but different structures.
The simulation results suggest that protein peptides with the same number of residues exhibit varying unfolding times, which are closely related to the spatial folding structure of the protein. When the protein's spatial structure is relatively simple, the peptide chain unfolds in less time and simulation steps. For example, 1CDN, with fewer atoms, requires the longest simulation time, while 1FXT, with more atoms, consumes more simulation time. The 3D structures of these two proteins are depicted in Figure 7.
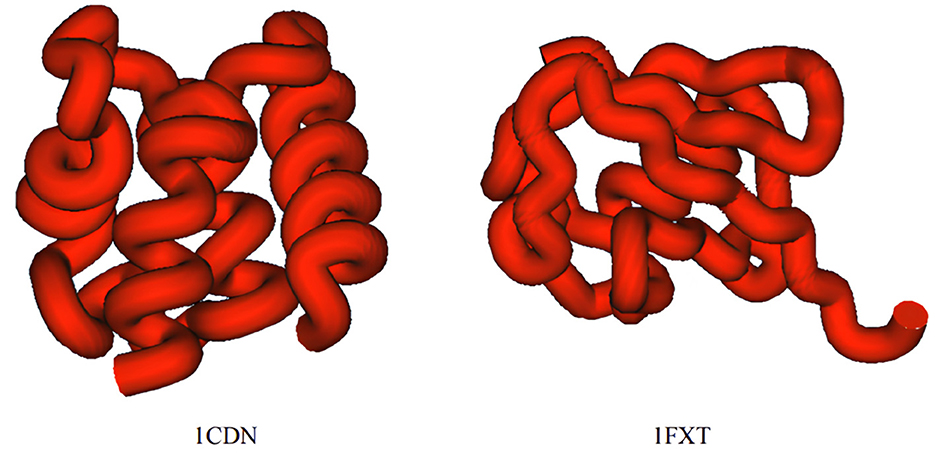
Figure 7. Comparison of the 3D structures of protein peptide chain 1CDN and protein peptide chain 1FXT.
As depicted in the figure above, the structure of the 1CDN protein appears to be slightly more complex than that of the 1FXT protein. Upon manual examination, it's noticeable that the peptide chain of 1CND is more tightly packed compared to that of 1FXT. A more compact structure suggests stronger internal connections within the protein. Further analysis of the proteins' secondary structure information used in this simulation experiment revealed that peptide chains with a greater number of α-helix unfold more slowly, requiring a longer simulation time. Although the number of β-sheet also influences the unfolding simulation speed, its impact is less significant compared to that of the α-helix. The presence of turn structures has minimal impact on the unfolding simulation.
3.3.3 Display of the unfolding process of protein 2JSV
We selected protein 2JSV as an example for the unfolding simulation test. Protein 2JSV consists of 56 residues and 857 atoms. During its unfolding simulation, we used PUV's real-time screenshot feature to capture the unfolding process of its peptide chain. The effects of the 2JSV unfolding simulation process are shown in Figure 8. Here, we've chosen four representative images. Figure 8A shows the protein in its natural structure, Figures 8B, C depict intermediate stages of the peptide chain's unfolding process, and Figure 8D displays the final simulated result of the protein's unfolding. The complete video of two examples can be found at: github.com/yelujiang/PUVDisplay
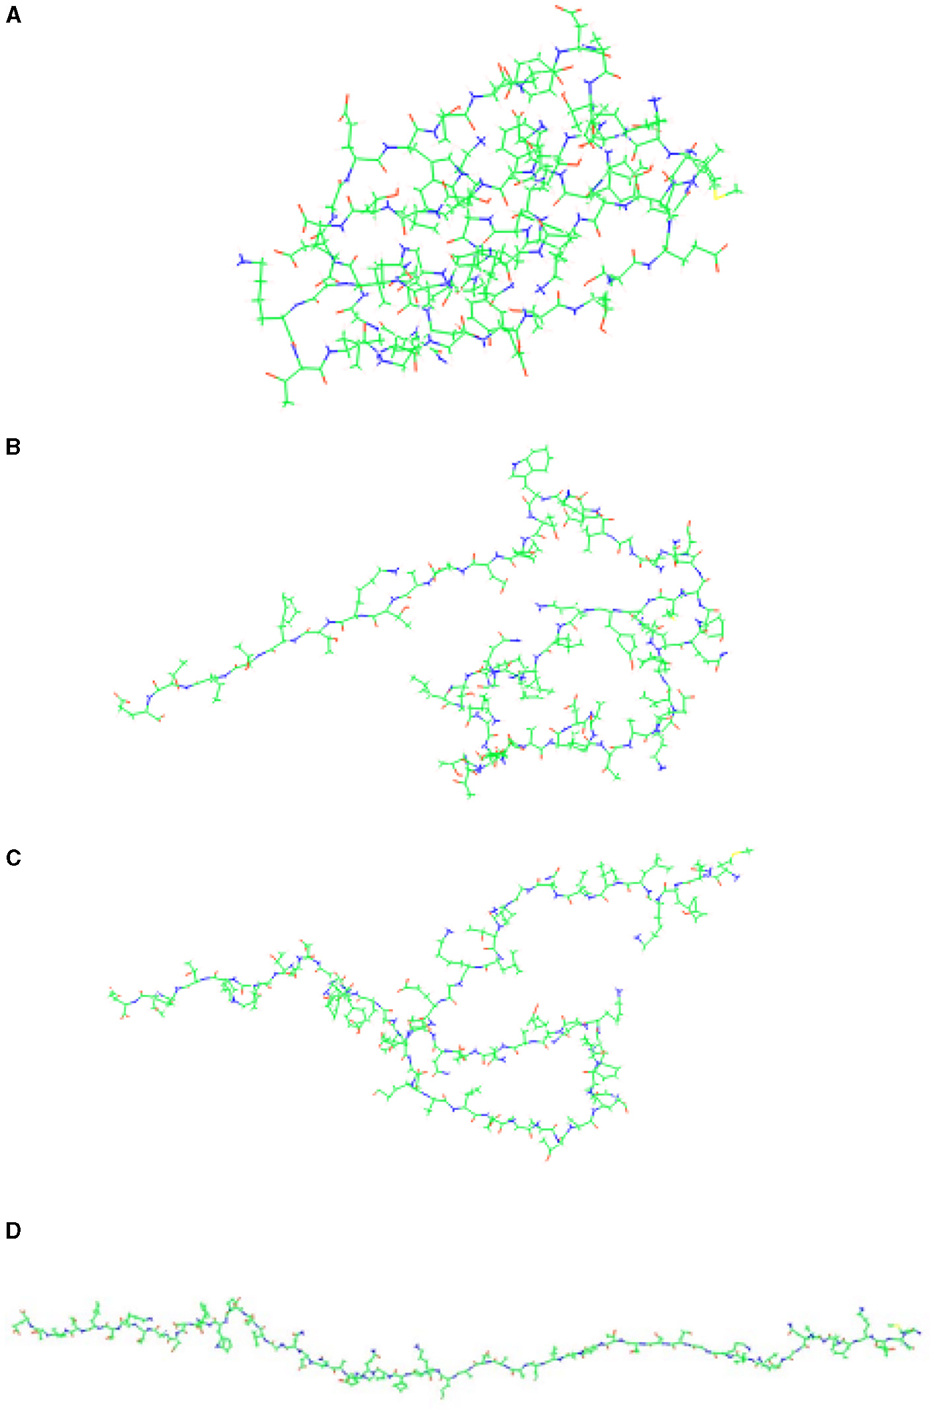
Figure 8. Visualization of the unfolding simulation process for protein 2JSV. (A–D) Illustrate the step-by-step unfolding process of the protein.
3.3.4 Comparison on chignolin protein
As previously stated, the process of protein unfolding is swift and subject to variation. Capturing the full and precise trajectory of this process for various proteins poses a considerable challenge. The advantage of PUV is its ability to quickly provide potential unfolding pathways. We compared it with the latest method combining Molecular Dynamics (MD) with deep learning and stochastic optimal control, known as PIPS (Holdijk et al., 2023), and presented the pathway results on chignolin protein. PIPS aims to sample transition pathways (TPS) between an initial state and a final state. For PIPS, we set the unfolded state as the initial state and the folded state as the final state. We then use the reverse process of its sampling as the unfolding process. As shown in Figure 9, PIPS, after extensive computation, provided potential low-energy pathways. Obviously, the pathways generated by the two methods are similar to a certain extent.
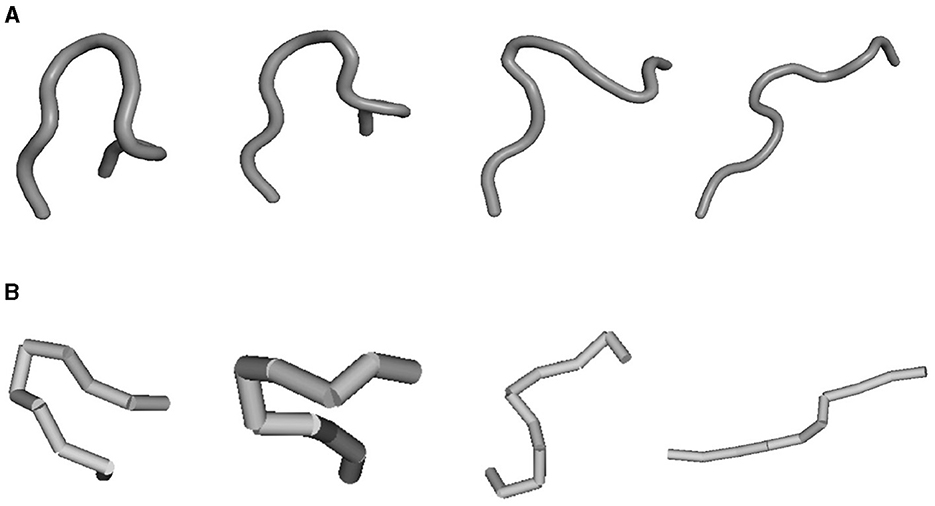
Figure 9. Unfold comparison on chignolin protein and PIPS results were from the source code. (A) For PIPS and (B) for PUV.
4 Conclusion
We have developed and deployed a protein unfolding visualization simulation system named PUV. The unfolding data generated during these simulations can be employed as a valuable dataset for reverse protein folding prediction processes. However, we need to claim that there is no silver bullet for unfolding regardless of the method used due to the complex structure of various proteins. The value proposition of our paper is developing a visualization system that can assist any unfolding method in validating the unfolding path.
To simulate the process of protein unfolding, PUV first prepares the necessary data for the simulation. Then, it randomly applies forces to all atoms on the polypeptide chains using the Monte-Carlo method. Additionally, substantial external forces in opposite directions are applied to the two Cα atoms at both ends of the polypeptide chain. During the stretching process, care is taken to ensure that the existing chemical bonds between atoms do not break, and they do not penetrate each other. By continuously stretching, the naturally three-dimensional stable structure of the polypeptide chain is gradually extended from these two endpoints to a fully unfolded state.
The simulation results demonstrate that PUV's visualization unfolding simulation process exhibits good performance. For protein polypeptide chains with up to 130 residues, the simulation can fully extend the natural protein polypeptide chain in three-dimensional space, achieving the primary protein structure state. The simulation process typically takes < 1 h.
Unfold process is so rapid that experimental or simulation data is quite scarce. Moreover, due to various conditions, the unfolding process of the same protein is complex and variable. Therefore, current research mainly focuses on improving the optimization algorithms of molecular dynamics, including reducing time consumption and improving simulation accuracy. Our method aims primarily to reduce time consumption and provide a potential analysis of the unfolding process that is quick and easy to obtain. Furthermore, natural protein unfolding processes are influenced by a variety of environmental factors, including water molecules, ions, and pH levels, and are regulated by specific thermodynamic ensembles. However, when modeling protein unfolding, the PUV approach solely considers the protein itself. Consequently, the performance of PUV is constrained due to the absence of these critical environmental factors in its simulations. A generative method for protein unfolding is a tough problem and PUV cannot solve it completely. We hope this system will assist any unfolding method in validating its unfolding path.
Data availability statement
The data analyzed in this study was obtained from github.com/yelujiang/PUV_Display. Requests to access this data should be directed to the corresponding author.
Author contributions
HQ: Writing – original draft, Writing – review & editing. YC: Resources, Validation, Visualization, Writing – review & editing. YJ: Supervision, Writing – review & editing.
Funding
The author(s) declare that no financial support was received for the research, authorship, and/or publication of this article.
Acknowledgments
We have used ChatGPT3.5 (openai.com) and KIMI (https://kimi.moonshot.cn/) to enhance the quality of English writing, and we appreciate their support.
Conflict of interest
The authors declare that the research was conducted in the absence of any commercial or financial relationships that could be construed as a potential conflict of interest.
Publisher's note
All claims expressed in this article are solely those of the authors and do not necessarily represent those of their affiliated organizations, or those of the publisher, the editors and the reviewers. Any product that may be evaluated in this article, or claim that may be made by its manufacturer, is not guaranteed or endorsed by the publisher.
References
Ackbarow, T., Chen, X., Keten, S., and Buehler, M. J. (2007). Hierarchies, multiple energy barriers, and robustness govern the fracture mechanics of α-helical and β-sheet protein domains. Proc. Nat. Acad. Sci. U. S. A. 104, 16410–16415. doi: 10.1073/pnas.0705759104
Anfinsen, C. B. (1973). Principles that govern the folding of protein chains. Science 181, 223–230. doi: 10.1126/science.181.4096.223
Baek, M., DiMaio, F., Anishchenko, I., Dauparas, J., Ovchinnikov, S., Lee, G. R., et al. (2021). Accurate prediction of protein structures and interactions using a three-track neural network. Science 373, 871–876. doi: 10.1126/science.abj8754
Barducci, A., Bonomi, M., and Parrinello, M. (2011). Metadynamics. Wiley Interdiscip. Rev. 1, 826–843. doi: 10.1002/wcms.31
Brandts, J. F. (1964). The thermodynamics of protein denaturation. I. The denaturation of chymotrypsinogen. J. Am. Chem. Soc. 86, 4291–4301. doi: 10.1021/ja01074a013
Bustamante, C., Alexander, L., Maciuba, K., and Kaiser, C. M. (2020). Single-molecule studies of protein folding with optical tweezers. Annu. Rev. Biochem. 89, 443–470. doi: 10.1146/annurev-biochem-013118-111442
Bustamante, C. J., Chemla, Y. R., Liu, S., and Wang, M. D. (2021). Optical tweezers in single-molecule biophysics. Nat. Rev. Methods Prim. 1:25. doi: 10.1038/s43586-021-00021-6
Cecconi, C., Shank, E. A., Bustamante, C., and Marqusee, S. (2005). Direct observation of the three-state folding of a single protein molecule. Science 309, 2057–2060. doi: 10.1126/science.1116702
Childers, M. C., and Daggett, V. (2018). Validating molecular dynamics simulations against experimental observables in light of underlying conformational ensembles. J. Phys. Chem. B 122, 6673–6689. doi: 10.1021/acs.jpcb.8b02144
Cramer, P. (2021). Alphafold2 and the future of structural biology. Nat. Struct. Mol. Biol. 28, 704–705. doi: 10.1038/s41594-021-00650-1
DeLano, W. L. (2002). Pymol: an open-source molecular graphics tool. CCP4 Newsl. Prot.Crystallogr. 40, 82–92.
Dill, K. A., Ozkan, S. B., Shell, M. S., and Weikl, T. R. (2008). The protein folding problem. Annu. Rev. Biophys. 37, 289–316. doi: 10.1146/annurev.biophys.37.092707.153558
Dinner, A. R., and Karplus, M. (1999). Is protein unfolding the reverse of protein folding? A lattice simulation analysis. J. Mol. Biol. 292, 403–419. doi: 10.1006/jmbi.1999.3051
Eastman, P., Swails, J., Chodera, J. D., McGibbon, R. T., Zhao, Y., Beauchamp, K. A., et al. (2017). Openmm 7: rapid development of high performance algorithms for molecular dynamics. PLoS Comput. Biol. 13:e1005659. doi: 10.1371/journal.pcbi.1005659
Eaton, W. A., Thompson, P. A., Chan, C.-K., Hage, S. J., and Hofrichter, J. (1996). Fast events in protein folding. Structure 4, 1133–1139. doi: 10.1016/S0969-2126(96)00121-9
Ferina, J., and Daggett, V. (2019). Visualizing protein folding and unfolding. J. Mol. Biol. 431, 1540–1564. doi: 10.1016/j.jmb.2019.02.026
Frishman, D., and Argos, P. (1995). Knowledge-based protein secondary structure assignment. Prot. Struct. Funct. Bioinf. 23, 566–579. doi: 10.1002/prot.340230412
Greenfield, N. J. (2006). Using circular dichroism collected as a function of temperature to determine the thermodynamics of protein unfolding and binding interactions. Nat. Protoc. 1, 2527–2535. doi: 10.1038/nprot.2006.204
Griko, Y. V., Makhatadze, G. I., Privalov, P. L., and Hartley, R. W. (1994). Thermodynamics of barnase unfolding. Prot. Sci. 3, 669–676. doi: 10.1002/pro.5560030414
Guinn, E. J., Jagannathan, B., and Marqusee, S. (2015). Single-molecule chemo-mechanical unfolding reveals multiple transition state barriers in a small single-domain protein. Nat. Commun. 6:6861. doi: 10.1038/ncomms7861
Holdijk, L., Du, Y., Hooft, F., Jaini, P., Ensing, B., and Welling, M. (2023). “Stochastic optimal control for collective variable free sampling of molecular transition paths,” in Advances in Neural Information Processing Systems, Vol. 36, eds. A. Oh, T. Naumann, A. Globerson, K. Saenko, M. Hardt, and S. Levine (Curran Associates, Inc.), 79540–79556. doi: 10.48550/arXiv.2207.02149
Jiménez, P., Thomas, F., and Torras, C. (2001). 3D collision detection: a survey. Comp. Graph. 25, 269–285. doi: 10.1016/S0097-8493(00)00130-8
Kellermayer, M. S., Smith, S. B., Granzier, H. L., and Bustamante, C. (1997). Folding-unfolding transitions in single titin molecules characterized with laser tweezers. Science 276, 1112–1116. doi: 10.1126/science.276.5315.1112
Keten, S., and Buehler, M. J. (2008). Asymptotic strength limit of hydrogen-bond assemblies in proteins at vanishing pulling rates. Phys. Rev. Lett. 100:198301. doi: 10.1103/PhysRevLett.100.198301
Kotov, V., Mlynek, G., Vesper, O., Pletzer, M., Wald, J., Teixeira-Duarte, C. M., et al. (2021). In-depth interrogation of protein thermal unfolding data with moltenprot. Prot. Sci. 30, 201–217. doi: 10.1002/pro.3986
Levitt, M., Hirshberg, M., Sharon, R., and Daggett, V. (1995). Potential energy function and parameters for simulations of the molecular dynamics of proteins and nucleic acids in solution. Comput. Phys. Commun. 91, 215–231. doi: 10.1016/0010-4655(95)00049-L
Mayor, U., Johnson, C. M., Daggett, V., and Fersht, A. R. (2000). Protein folding and unfolding in microseconds to nanoseconds by experiment and simulation. Proc. Nat. Acad. Sci. U. S. A. 97, 13518–13522. doi: 10.1073/pnas.250473497
McCully, M. E., Beck, D. A., and Daggett, V. (2008). Microscopic reversibility of protein folding in molecular dynamics simulations of the engrailed homeodomain. Biochemistry 47, 7079–7089. doi: 10.1021/bi800118b
Mortensen, D. N., and Williams, E. R. (2015). Investigating protein folding and unfolding in electrospray nanodrops upon rapid mixing using theta-glass emitters. Anal. Chem. 87, 1281–1287. doi: 10.1021/ac503981c
Ni, B., Kaplan, D. L., and Buehler, M. J. (2023). Generative design of de novo proteins based on secondary-structure constraints using an attention-based diffusion model. Chem 9, 1828–1849. doi: 10.1016/j.chempr.2023.03.020
Ni, B., Kaplan, D. L., and Buehler, M. J. (2024). Forcegen: end-to-end de novo protein generation based on nonlinear mechanical unfolding responses using a language diffusion model. Sci. Adv. 10:eadl4000. doi: 10.1126/sciadv.adl4000
Pettersen, E. F., Goddard, T. D., Huang, C. C., Couch, G. S., Greenblatt, D. M., Meng, E. C., et al. (2004). Ucsf chimera—a visualization system for exploratory research and analysis. J. Comput. Chem. 25, 1605–1612. doi: 10.1002/jcc.20084
Puglisi, R., Brylski, O., Alfano, C., Martin, S. R., Pastore, A., and Temussi, P. A. (2020). Quantifying the thermodynamics of protein unfolding using 2d NMR spectroscopy. Commun. Chem. 3:100. doi: 10.1038/s42004-020-00358-1
Raschke, T. M., and Marqusee, S. (1997). The kinetic folding intermediate of ribonuclease H resembles the acid molten globule and partially unfolded molecules detected under native conditions. Nat. Struct. Biol. 4:298–304. doi: 10.1038/nsb0497-298
Rief, M., Gautel, M., Oesterhelt, F., Fernandez, J. M., and Gaub, H. E. (1997). Reversible unfolding of individual titin immunoglobulin domains by AFM. Science 276, 1109–1112. doi: 10.1126/science.276.5315.1109
Senior, A. W., Evans, R., Jumper, J., Kirkpatrick, J., Sifre, L., Green, T., et al. (2020). Improved protein structure prediction using potentials from deep learning. Nature 577, 706–710.
Shank, E. A., Cecconi, C., Dill, J. W., Marqusee, S., and Bustamante, C. (2010). The folding cooperativity of a protein is controlled by its chain topology. Nature 465, 637–640. doi: 10.1038/nature09021
Stigler, J., Ziegler, F., Gieseke, A., Gebhardt, J. C. M., and Rief, M. (2011). The complex folding network of single calmodulin molecules. Science 334, 512–516. doi: 10.1126/science.1207598
Swint, L., and Robertson, A. D. (1993). Thermodynamics of unfolding for turkey ovomucoid third domain: thermal and chemical denaturation. Prot. Sci. 2, 2037–2049. doi: 10.1002/pro.5560021205
Thompson, A. P., Aktulga, H. M., Berger, R., Bolintineanu, D. S., Brown, W. M., Crozier, P. S., et al. (2022). Lammps - a flexible simulation tool for particle-based materials modeling at the atomic, meso, and continuum scales. Comput. Phys. Commun. 271:108171. doi: 10.1016/j.cpc.2021.108171
Tskhovrebova, L., Trinick, J., Sleep, J., and Simmons, R. (1997). Elasticity and unfolding of single molecules of the giant muscle protein titin. Nature 387, 308–312. doi: 10.1038/387308a0
Van Der Spoel, D., Lindahl, E., Hess, B., Groenhof, G., Mark, A. E., and Berendsen, H. J. C. (2005). Gromacs: fast, flexible, and free. J. Comput. Chem. 26, 1701–1718. doi: 10.1002/jcc.20291
Wintrode, P. L., Makhatadze, G. I., and Privalov, P. L. (1994). Thermodynamics of ubiquitin unfolding. Prot. Struct. Funct. Bioinf. 18, 246–253. doi: 10.1002/prot.340180305
Wu, K. E., Yang, K. K., Berg, R., Zou, J. Y., Lu, A. X., and Amini, A. P. (2022). Protein structure generation via folding diffusion. arXiv [preprint]. doi: 10.48550/arXiv.2209.15611
Keywords: protein unfolding, 3D visualization, dynamics simulation, collision detection, collision elimination
Citation: Qian H, Chen Y and Jiang Y (2024) A lightweight visualization tool for protein unfolding by collision detection and elimination. Front. Comput. Sci. 6:1415648. doi: 10.3389/fcomp.2024.1415648
Received: 10 April 2024; Accepted: 29 August 2024;
Published: 19 September 2024.
Edited by:
Jagdish Suresh Patel, University of Idaho, United StatesReviewed by:
Jian Huang, University of Massachusetts Amherst, United StatesL. America Chi Uluac, University of Idaho, United States
Copyright © 2024 Qian, Chen and Jiang. This is an open-access article distributed under the terms of the Creative Commons Attribution License (CC BY). The use, distribution or reproduction in other forums is permitted, provided the original author(s) and the copyright owner(s) are credited and that the original publication in this journal is cited, in accordance with accepted academic practice. No use, distribution or reproduction is permitted which does not comply with these terms.
*Correspondence: Yelu Jiang, eWxqaWFuZ0BzdHUuc3VkYS5lZHUuY24=