
94% of researchers rate our articles as excellent or good
Learn more about the work of our research integrity team to safeguard the quality of each article we publish.
Find out more
ORIGINAL RESEARCH article
Front. Comput. Sci., 10 June 2024
Sec. Software
Volume 6 - 2024 | https://doi.org/10.3389/fcomp.2024.1406086
This article is part of the Research TopicComputer Technology and Sustainable FuturesView all 3 articles
 Kunjabihari Swain1
 Murthy Cherukuri1*
 Indu Sekhar Samanta2
 Abhilash Pati2*
 Jayant Giri3,4*†
 Amrutanshu Panigrahi2
 Hong Qin5*
 Saurav Mallik6*
This research presents a process for analyzing a hybrid microgrid's dependability using a fuzzy Markov model. The research initiated an analysis of the various microgrid components, such as wind power systems, solar photovoltaic (PV) systems, and battery storage systems. The states that are induced by component failures are represented using a state-space model. The research continues by suggesting a hybrid microgrid reliability model that analyzes data using a Markov process. Problems arise when trying to estimate reliability metrics for the microgrid using data that is both restricted and imprecise. This is why the study takes uncertainties into account to make microgrid reliability estimations more realistic. The importance of microgrid components concerning their overall availability is evaluated using fuzzy sets and reliability assessments. The study uses numerical analysis and then carefully considers the outcomes. The overall availability of hybrid microgrids is 0.99999.
Due to its versatile operational modes, encompassing grid-connected, and islanded configurations, microgrids are increasingly pivotal in establishing resilient electrical energy networks, especially in the face of natural disasters and adverse conditions. Typically incorporating distributed generation facilities capable of supplying heat and electricity, microgrids are anticipated to witness substantial integration of renewable energy sources. They constitute a fundamental component of smart grids (Nikos, 2007; Ashraf et al., 2020).
Reliability, defined as the capacity of an entity to fulfill a specified function within predetermined environmental and operational parameters and for a defined duration (Billinton and Allan, 1992), is of paramount importance in the context of microgrid systems. This significance arises from their role as backup power systems, particularly during main grid blackouts or failures. An in-depth examination of microgrid system reliability is crucial for system design and maintenance. Such an analysis offers insights into potential failure modes of subsystems and components, catering to the informational needs of system designers, operators, and end-users. Furthermore, it facilitates the estimation of the system's operational lifespan by predicting the time elapsed before the occurrence of the microgrid's initial physical failure. Consequently, reliability analysis emerges as a critical undertaking during the design and operational phases of microgrid implementation.
In the study by Said et al. (2019), a new SMES controller based on the fuzzy logic control method is presented, considering the state of charge of the superconducting magnetic energy storage (SMES) system to enhance its reliability. This controller effectively avoids the short-lifetime shortcoming of SMES and maintains constant bus voltages despite the fluctuating power of PV generation, thereby improving the overall microgrid system's reliability. Additionally, the proposed controller design method can be generalized for different microgrid architectures, offering a versatile solution for enhancing microgrid reliability. Akbari and Hesamian (2020) presented a method for constructing time-dependent reliability systems based on intuitionistic fuzzy random variables. The reliability functions of a k-out-of-n system are evaluated using an intuitionistic fuzzy random variable with exact parameters. The evaluation criteria are discussed and interpreted. Numerical evaluations are presented to illustrate the calculation of the system reliability criteria in the form of intuitionistic fuzzy numbers. In the study by Kumar et al. (2021), the authors presented the fuzzy reliability of a specific system utilizing intuitionistic fuzzy set theory and the universal generating function technique. The analysis relies on triangular fuzzy numbers and exponential distribution in lower and upper forms. In the study by Talaat et al. (2023), the authors provided a comprehensive review of the challenges and potential solutions for integrating renewable energy sources into microgrids. It highlights the role of artificial intelligence (AI) in improving integration and control strategies. It presents case studies on using AI to optimize the performance of hybrid renewable energy systems. Overall, this file offers valuable insights for researchers and practitioners working in the field of renewable energy integration. In the study by Ren et al. (2020), the authors developed a reliability model for radial multi-microgrids using the Bayesian network considering distribution network transmission capacity. A reliability assessment of aggregate battery energy storage systems in microgrids was proposed by Pham et al. (2020) using the Markov model. In the study by Kwasinski et al. (2012), the authors addressed the availability of microgrids during natural disasters. Microgrid availability is evaluated using the Markov model and evaluated using minimal cut set approximations. In the study by Ahshan et al. (2017), the authors have built a microgrid reliability model that takes into account the intermittent effects of renewable energy sources such as wind using Monte Carlo simulation. Adefarati and Bansal (2019) relied on the assessment of the reliability and economic and environmental advantages of renewable energy sources in the microgrid system. In the study by Ansari et al. (2016), the authors assessed the reliability of microgrids containing prioritized loads and distributed renewable energy resources through a hybrid analytical simulation method. Xu et al. (2016) focused on assessing the reliability of the microgrid accurately, taking into account its operating condition. A reliability assessment of the microgrid consisting of conventional generators, a photovoltaic system, and a small hydropower plant based on Monte Carlo simulation was presented (Na and Kim, 2019). In the study by Santhan et al. (2022), the authors introduced a method to enhance the resilience of existing microgrids against low-probability, high-impact events using Monte Carlo simulation and load prioritization. It evaluates this approach by modeling the IEEE 5-Bus and IEEE 14-Bus systems, assessing the impact of load shedding on microgrid resilience across different grid sizes, and introducing a new resilience index. Khare and Chaturvedi (2023) presented a thorough evaluation of microgrid systems, covering optimal design considerations and control system evaluation, and drew insights from a detailed analysis of literature and case studies. Khalili et al. (2022) introduced a novel approach to optimizing the power scheduling of energy sources in an isolated microgrid, focusing on the upside risk for the first time. The microgrid under consideration includes diverse sources such as wind turbines, photovoltaic panels, diesel generators, and batteries. Onaolapo and Ojo (2023) emphasize the importance of microgrids in balancing power consumption and generation, thus enhancing customer satisfaction and addressing challenges posed by events such as COVID-19.
The above reliability models are such that the transition rates of reliability are treated as crisp numbers. Input parameters such as failure rates and repair rates have been extracted from historical documents that may be prone to errors in reliability assessment methods. Due to the probabilistic characteristics of failure situations and variations in the environment, these parameters reveal considerable unit-to-unit variability.
Presuming a probability distribution for input parameters and utilizing either the conditional probability method by Billinton and Allan (1992) or the Monte Carlo simulation by Li (2013) are two traditional methods to integrate such uncertainties. However, identifying appropriate probability distributions in most situations proves challenging. Furthermore, the computational demands of traditional probabilistic methods could be substantial, particularly for expansive systems. In reliability analyses, methodologies based on fuzzy sets should specifically consider the uncertainties of input parameters (Klir and Yuan, 1996). Instead of single-point output, they can also generate possibility distributions. In addition, a subjective collection of information evaluated by expert opinions may be considered in such applications (Bowles and Pelaez, 1995; Kabir and Papadopoulos, 2018).
The reliability data for a device can be determined either by relating statistical methods to historical data or by using the reliability modeling of the device as a single system. The proposed work deals with a reliability model for hybrid microgrids. A reliability model for a hybrid microgrid was proposed by Adefarati and Bansal (2017), in which reliability transition rates were considered crisp numbers. In reliability evaluation methods, input parameters such as failure and repair rates were derived from historical records, which are prone to errors. Furthermore, due to the stochastic character of both ecological changes and failure situations, these metrics exhibit significant variability from one unit to the next. The true and single-point values of these parameters could lead to errors in reliability evaluations. Thus, fuzzy sets are taken into account for reliability analysis to integrate the inherent uncertainties associated with the input data.
This study focuses on the reliability modeling of a hybrid microgrid through the application of a fuzzy Markov model. Initially, comprehensive descriptions of microgrid components and their functionalities are provided, followed by the development of a state-space reliability model. The availability of the microgrid is subsequently computed based on the formulated model. The integration of fuzzy sets is employed in the reliability analysis to account for uncertainties inherent in the input data. Numerical illustrations are systematically studied to assess the efficacy of the suggested framework. The utility of the suggested framework extends to microgrid manufacturers, offering a tool for discerning critical microgrid components. This insight enables manufacturers to optimize investments in microgrid components, thereby enhancing overall microgrid availability.
The subsequent segments of this article are structured as follows. Section 2 provides a concise discourse on the constituent elements of a microgrid. The reliability modeling of the microgrid and the application of fuzzification in the analysis are expounded upon in Sections 3, 4, respectively. Section 5 undertakes numerical investigations about the articulated model, while the conclusions derived from this study are deliberated upon in Section 6.
A microgrid denotes a diminutive power system or localized power station characterized by independent operational capacity or parallel connectivity with other small-scale power grids (Adefarati and Bansal, 2017; Adefarati et al., 2017; Wesly et al., 2020). The functioning of a microgrid system relies on communication infrastructure. It incorporates distributed generation technologies, including photovoltaic (PV) systems, wind turbine generation (WTG), diesel generators, and battery systems, as depicted in Figure 1. The main goal of implementing microgrid systems over conventional power systems is to enhance local energy delivery, optimize energy efficiency, realize cost efficiencies, ameliorate grid safety through congestion reduction, generate utility revenue, bolster grid resilience, accrue savings on energy expenditures, stimulate economic growth in rural areas, diminish electricity costs, and ensure a reliable power supply. This approach concurrently contributes to lower greenhouse gas (GHG) emissions (Klir and Yuan, 1996; Kabir and Papadopoulos, 2018). The ensuing discussion succinctly outlines the principal components integral to the proposed microgrid.
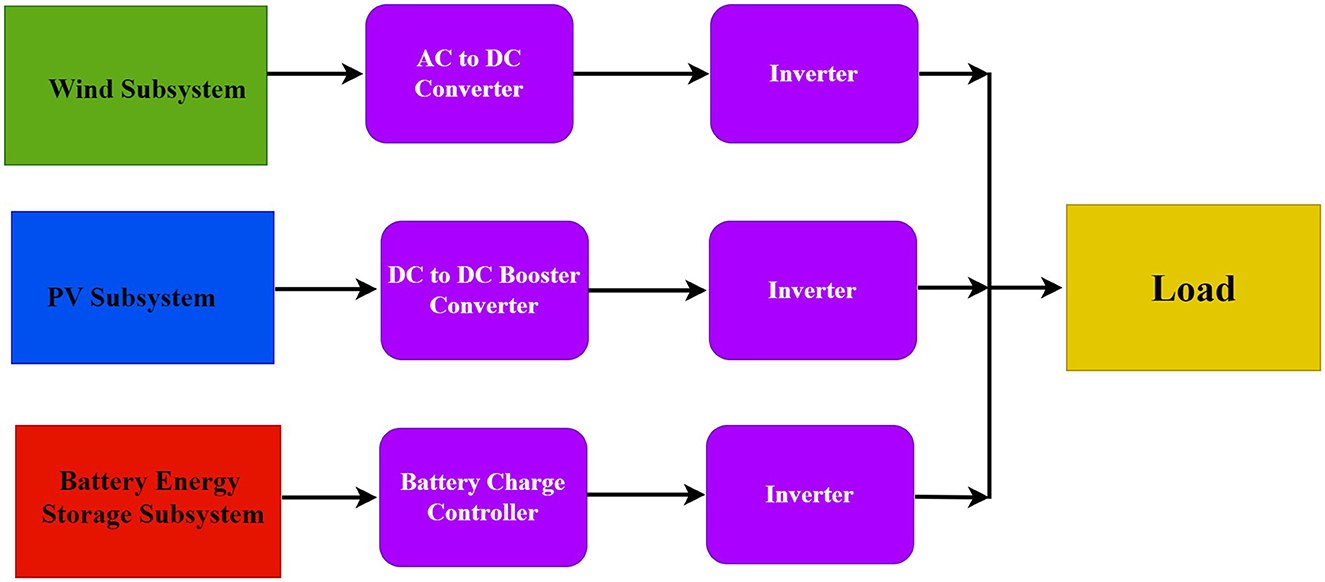
Figure 1. Hybrid microgrid.
The power curve serves as a tool for assessing the generated power value by the WTG in relation to varying wind speeds (Tazvinga et al., 2017). The output of the WTG is contingent upon the wind speed at the hub height, geographical coordinates, and operational characteristics specific to the WTG (Del Granado et al., 2016).
Solar energy undergoes direct conversion into electrical power through the application of photovoltaic (PV) panels, serving diverse functionalities within microgrid systems (Tazvinga et al., 2017). The PV system possesses the capability to be interconnected in both parallel and series configurations, strategically aligned to fulfill the instantaneous power requisites of consumers at a given time. The functionality of the PV system exhibits temporal variation due to fluctuations in solar irradiation conditions, temperature, geographical positioning, weather dynamics, and load patterns (Wu and Xia, 2015).
The battery energy storage system (BESS) functions as an electrochemical apparatus designed to accumulate energy derived from diverse sources, such as photovoltaic (PV) and Wind Turbine Generator (WTG), offering versatility for multiple applications. Its integration into a microgrid system is imperative due to the inherently stochastic nature of solar and wind resources. The BESS is instrumental in addressing scenarios characterized by energy scarcity, ensuring the provision of stored energy to designated load points. Conversely, it is engineered to store surplus power generated by the microgrid system when the power output exceeds consumer demand. The operational dynamics of the BESS are evaluated through the assessment of its state of charge (SOC).
Every element depicted in Figure 1 possesses the capacity to exist in either an operational (UP) state or a non-operational (DOWN) state. When a subsystem lacks redundancy in its components, the failure of any individual element within the subsystem precipitates the failure of the entire subsystem. In such instances, from a reliability perspective, the components of the subsystem are considered to be arranged in series. The subsequent subsections elucidate the state-space representation for each microgrid subsystem.
The wind subsystem comprises a WTG, an AC-to-DC converter, and an inverter. Figure 2 depicts the 8-state Markov model of the wind subsystem. State 1 is the working state or UP state of the wind subsystem, and the remaining states are DOWN states caused by the failure of components of the wind subsystem. Combining states 2–8 in the Markov model, which leads to the wind subsystem failure, into a unified DOWN state, Figure 3 illustrates the resulting two-state Markov model for the wind subsystem. The parameters for this equivalent model are outlined below. The equivalent failure rate of the wind subsystem is shown in Equation 1.
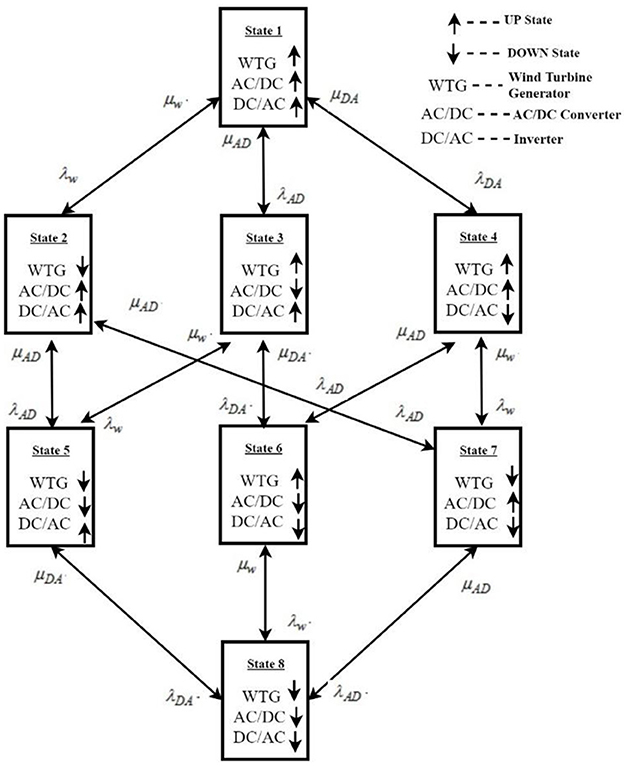
Figure 2. Eight-state Markov model of wind subsystem.

Figure 3. Equivalent two-state Markov model of wind subsystem.
The equivalent repair rate of the wind subsystem is shown in Equation 2.
The probability of being at the UP state and DOWN state in the wind subsystem equivalent model is given in Equations 3, 4, respectively.
However, the probabilities of being in state 1, state 2, state 3, state 4, state 5, state 6, state 7, and state 8 can be derived from the 8-state Markov model as follows. The limiting probabilities corresponding to these states are P1, P2, P3, P4, P5, P6, P7, and P8.
Here, α and P are limiting probability vectors and stochastic transitional probability matrices, respectively, as given in Equation 5.
The stochastic transitional probability matrix is given in Equation 7. Putting the values of failure and repair rates of each component [19].
From Equations 6, 8
For any system, the summation of the probability of all the states is 1.
The probabilities of the wind subsystem being in different states can be obtained by solving Equations 9, 10, as shown in Table 1. The probability of the wind subsystem being in UP state is Pup = P1 = 0.99203. The probability of the wind subsystem being in a DOWN state is PDown = P2+P3+P4+P5+P6+P7+P8 = 0.00797.
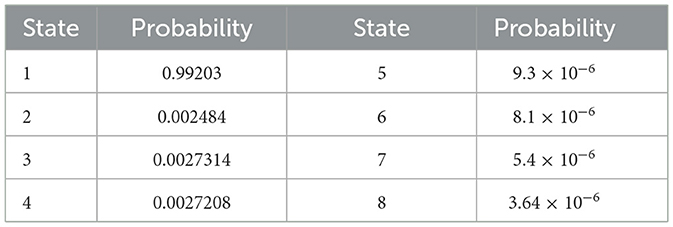
Table 1. Probability of the wind subsystem being in different states.
The PV subsystem comprises PV cells, a DC-to-DC booster, and an inverter. Figure 4 depicts the 8-state Markov model of the PV subsystem. State 1 is the working state or UP state of the PV subsystem, and the remaining states are DOWN states caused by the failure of the PV subsystem's components. Combining states 2–8 in the Markov model, which leads to the failure of the PV subsystem, into a consolidated DOWN state, Figure 5 depicts the resulting two-state Markov model for the PV subsystem. The parameters for this equivalent model are detailed as follows.

Figure 4. Eight-state Markov model of the PV subsystem.

Figure 5. Equivalent two-state Markov model of PV subsystem.
The equivalent failure rate and repair rate are shown in Equations 11, 12, respectively.
The probability of being at the UP state and DOWN state in the PV subsystem equivalent model is given in Equations 13, 14, respectively.
The stochastic transitional probability matrix in Equation 15 of the PV subsystem is computed by using the failure and repair rates of each component (Adefarati and Bansal, 2017).
However, the probability of being in state 1, state 2, state 3, state 4, state 5, state 6, state 7, and state 8 can be derived from the 8-state Markov model of the PV subsystem using Equations 5, 6, 15. The limiting probabilities corresponding to these states are P1, P2, P3, P4, P5, P6, P7, and P8. Table 2 shows the probabilities of PV subsystems in different systems.

Table 2. Probability of the PV subsystem being in different states.
The battery energy storage subsystem comprises a battery bank, battery charge controller, and inverter. Figure 6 depicts the 8-state Markov model of the BES subsystem. State 1 is the working state or UP state of the BES subsystem, and the remaining states are DOWN states caused by the failure of components of the BES subsystem.
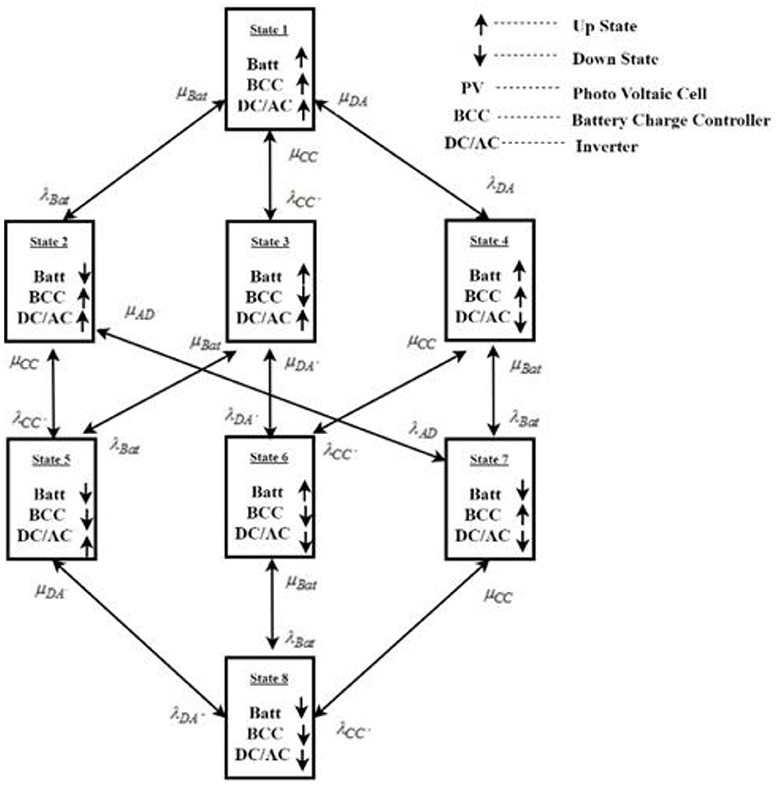
Figure 6. Eight-state Markov model of BES subsystem.
The consolidation of states 2–8 in the Markov model is undertaken due to the resultant failure of the BES subsystem. These states are amalgamated into a unified DOWN state, as illustrated in Figure 7, representing the equivalent two-state Markov model for the BES subsystem. The parameters delineating this equivalent model are provided as follows. The equivalent failure rate and repair rate are shown in Equations 16, 17, respectively.

Figure 7. Equivalent two-state Markov model of BES subsystem.
The probability of being at the UP state and DOWN state in the BES subsystem equivalent model is given in Equations 18, 19, respectively.
However, the probability of being in state 1, state 2, state 3, state 4, state 5, state 6, state 7, and state 8 can be derived from the 8-state Markov model of the BES subsystem using Equations 5, 6, 15. The limiting probabilities corresponding to these states are P1, P2, P3, P4, P5, P6, P7, and P8. The stochastic transitional probability matrix of BES is given in Equation 20.
The probability of the BES subsystem being in the UP state is Pup = P1 = 0.99405. The probability of the BES subsystem being in the DOWN state is PDown = P2+P3+P4+P5+P6+P7+P8 = 0.00594983. Table 3 shows the probabilities of the BES subsystem.
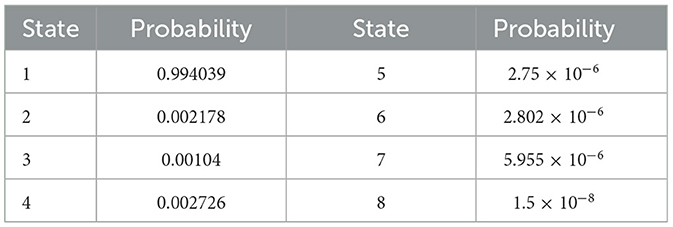
Table 3. Probability of the BES subsystem being in different states.
Each component in Figure 8 can reside in either the UP state or DOWN state. It comprises three subsystems, i.e., the wind subsystem, the PV subsystem, and the battery energy storage subsystem, which are said to be in parallel from the reliability point of view. The equivalent parameters of this model are as follows (Billinton and Allan, 1992). Figure 8 shows the 8-state Markov model of microgrid. State 1 to state 7 are UP states and state 8 is the DOWN state. The equivalent repair rate
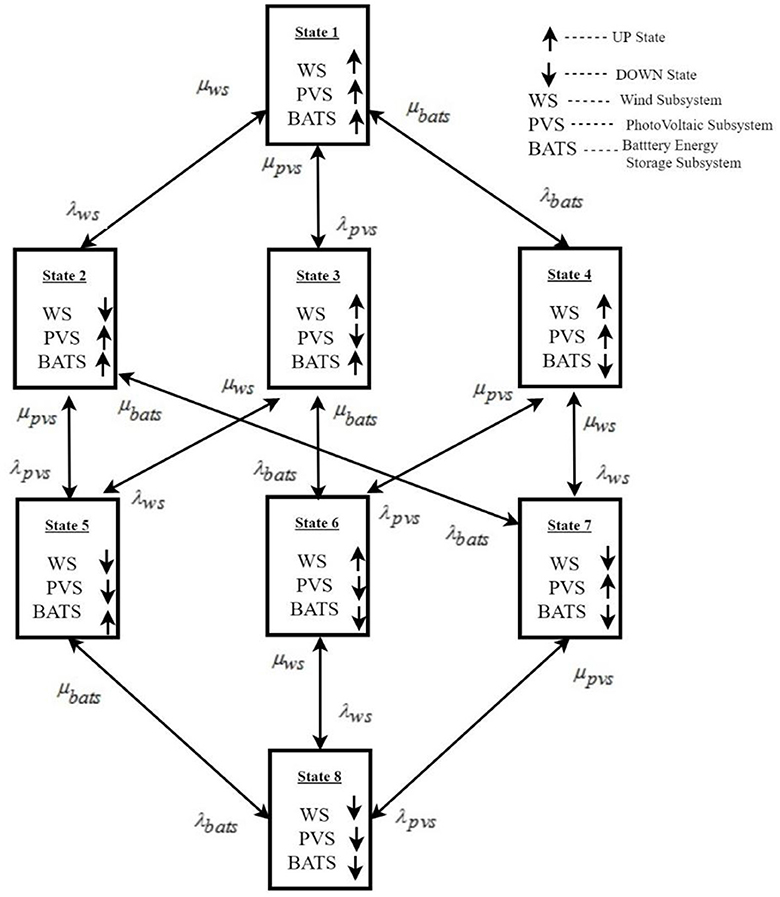
Figure 8. Markov model of microgrid.
The equivalent failure rate
The availability,
Where, , , and are the probabilities of being in state 1, state 2, state 3, state 4, state 5, state 6, state 7, and state 8 can be derived from the 8-state Markov model of the microgrid using Equation 5 and stochastic transitional probability matrix of the microgrid given in Equation 24.
The limiting probabilities corresponding to these states are P1, P2, P3, P4, P5, P6, P7, and P8. The stochastic transitional probability matrix in Equation 24 of the microgrid is computed by using the equivalent failure rates and equivalent repair rates of each subsystem. Since the subsystems are in parallel, the availability of the microgrid system, the summation of the probability of all the states as given in Equation 10, is 1. From Equations 5, 21,
By solving the linear Equations 10, 25, the probability of the microgrid being in different states is given in Table 4. Since the subsystems are in parallel with the availability of the microgrid system, the probability of the microgrid being in UP state is Pupmgd=P1+P2+P3+P4+P5+P6+P7 = 0.9999999989.
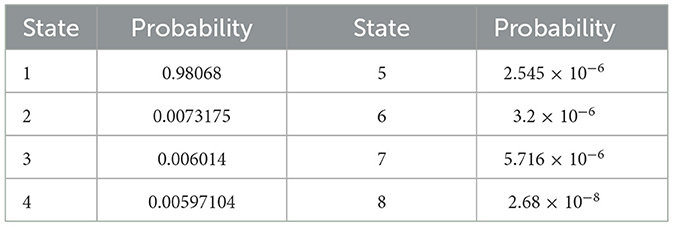
Table 4. Probability of the microgrid being in different states.
The probability of the BES subsystem being in the UP state is Pdnmgd = P8 = 2.68 × 10⁻⁸. The probability of the microgrid to be in the UP state is
The probability of the BES subsystem being in the UP state Pdnmgd = P8 = 2.68 × 10⁻⁸.
Fuzzy sets have been employed to account for inherent uncertainties in parameters, specifically failure and repair rates, during reliability calculations. Consequently, reliability parameters are represented as fuzzy numbers (Klir and Yuan, 1996; Zimmermann, 2011). The degree of uncertainty increases with the breadth of support of the membership function (Li and Yen, 1995). Computational efficiency is a critical concern in fuzzy analyses. Anzilli and Facchinetti (2019) demonstrated that computational complexity in fuzzy analyses can be mitigated by consolidating membership functions into alpha-cuts and performing mathematical operations within these intervals. The crisp set comprising elements belonging to a fuzzy set to at least the degree alpha is termed the α-cut of that fuzzy set. The ensuing procedural steps delineate the application of fuzzy reliability analysis to the microgrid.
Steps of Procedure:
Step 1: Express the input data, specifically failure and repair rates, through the utilization of fuzzy numbers. Determine membership functions based on past data or expert input.
Step 2: Establish alpha cuts of input data for α ∈ [0,1].
Step 3: Determine the parameters of the equivalent reliability model for any specified α by employing the set of Equations 21–23 and utilizing fuzzy arithmetic operations. For each α-cut of the fuzzy number representing a parameter, perform calculations based on Equations 21–23 to ascertain the minimum and maximum attainable values of the output.
Step 4: The results computed in Step 3 are employed to formulate fuzzy outputs.
This section showcases specific investigations aimed at illustrating the advantages inherent in the proposed reliability model. The preceding Section 3, scrutinized the crisp model, whereas the focus here lies on the examination of fuzzy models. In the realm of reliability studies, it is observed that reliability transition rates exhibit asymmetry and are characterized by single-kernel fuzzy numbers.
Table 5 presents the equivalent failure rate, repair rate, availability, and unavailability fuzzy values considering 5% of crisp value. Figure 9 depicts the membership function of effective failure rate, repair rate, availability, and unavailability of wind subsystem at different cuts from 0 to 1. The fuzzy calculation is employed to analyze the equivalent two-state model. Table 6 presents the 11 cuts for these parameters.
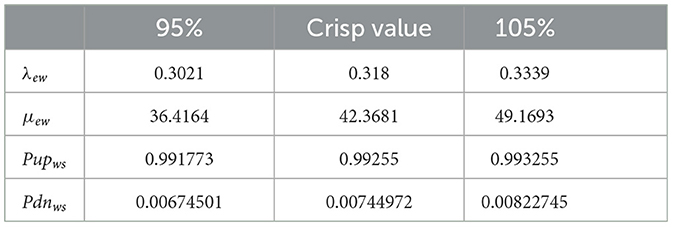
Table 5. Equivalent parameters of wind subsystem.
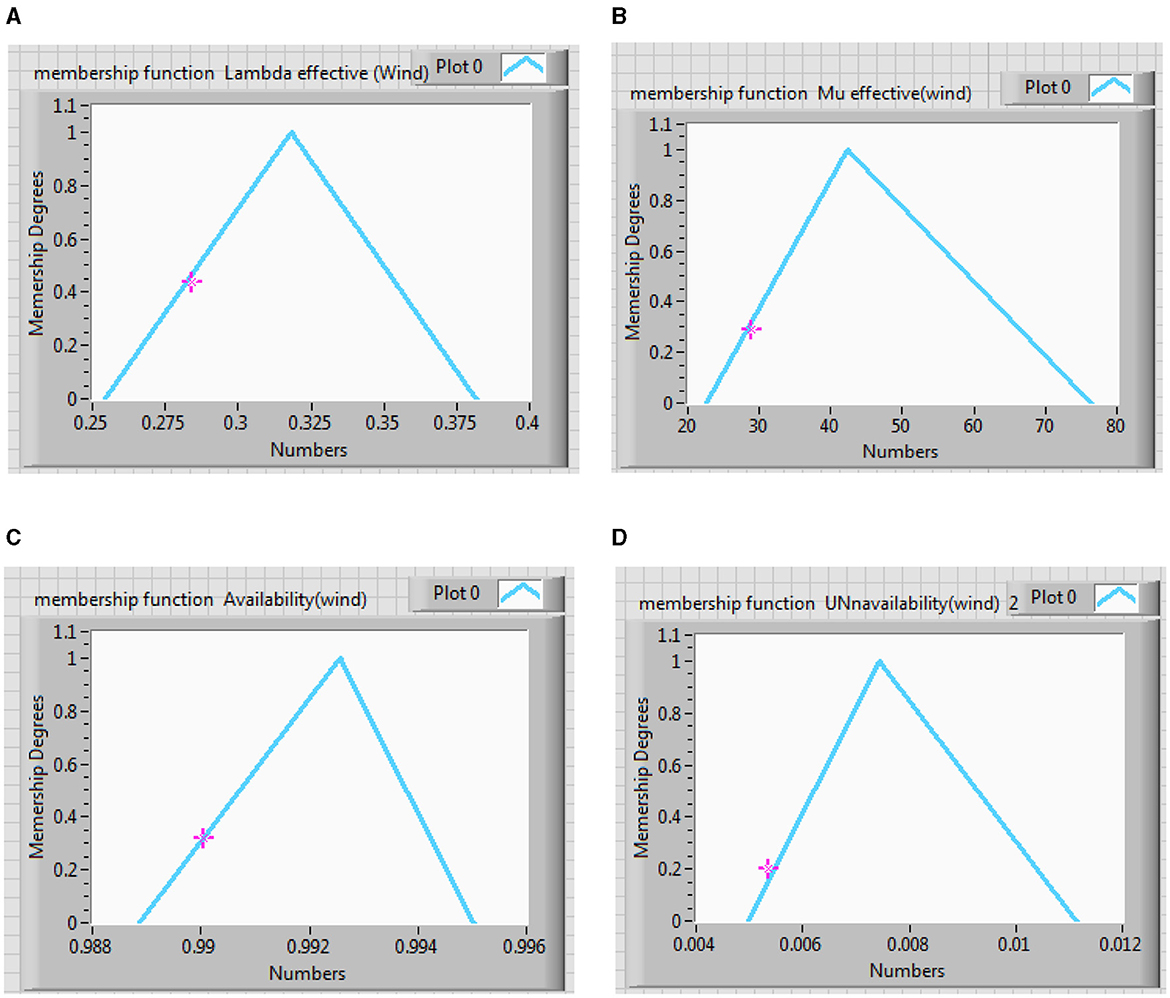
Figure 9. Membership function effective, (A) failure rate of wind subsystem, (B) repair rate of wind subsystem, (C) availability of wind subsystem, and (D) unavailability of wind subsystem.
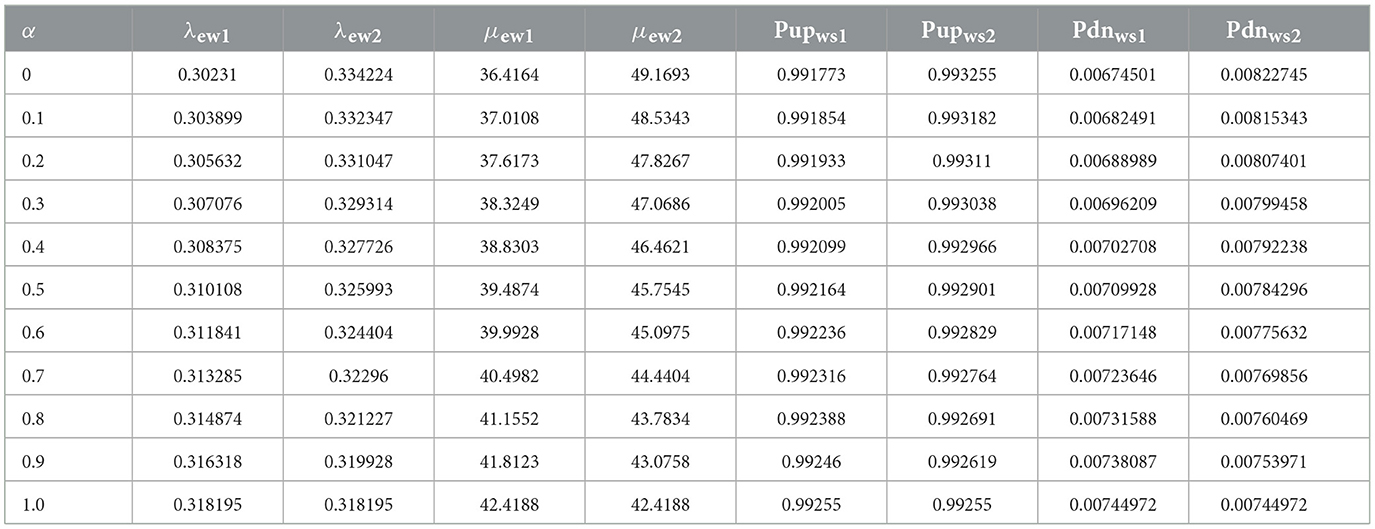
Table 6. Effective failure rate, repair rate, availability, and unavailability of wind subsystem.
Comparing Tables 5, 6, it can be observed that fuzzy results with alpha equal to 1 are expectedly identical to crisp results. In Figures 9A, D are approximately symmetrical, while Figures 9B, C are unsymmetrical. The Center of Area (CA) of Figures 9B, C are not equal to their kernels, which is caused by the uncertainties in the input data. The results of fuzzy analyses are more realistic than those of crisp study. In addition, the triangular membership function has been used because its results incorporate the effect of uncertainties appropriately, and its corresponding computations are plain.
Table 7 presents the equivalent failure rate, repair rate, availability, and unavailability fuzzy values considering 5% of crisp value. Figure 10 depicts the membership function of effective failure rate, repair rate, availability, and unavailability of PV subsystem at different alpha cuts from 0 to 1. Table 8 shows 11 cuts for these parameters.
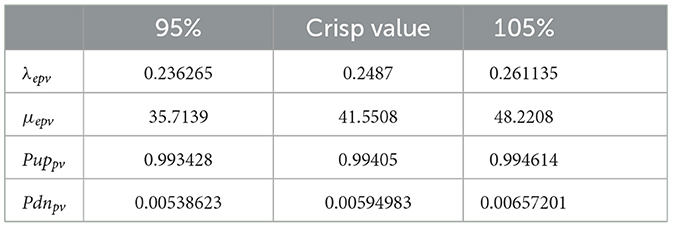
Table 7. Equivalent parameters of wind subsystem.
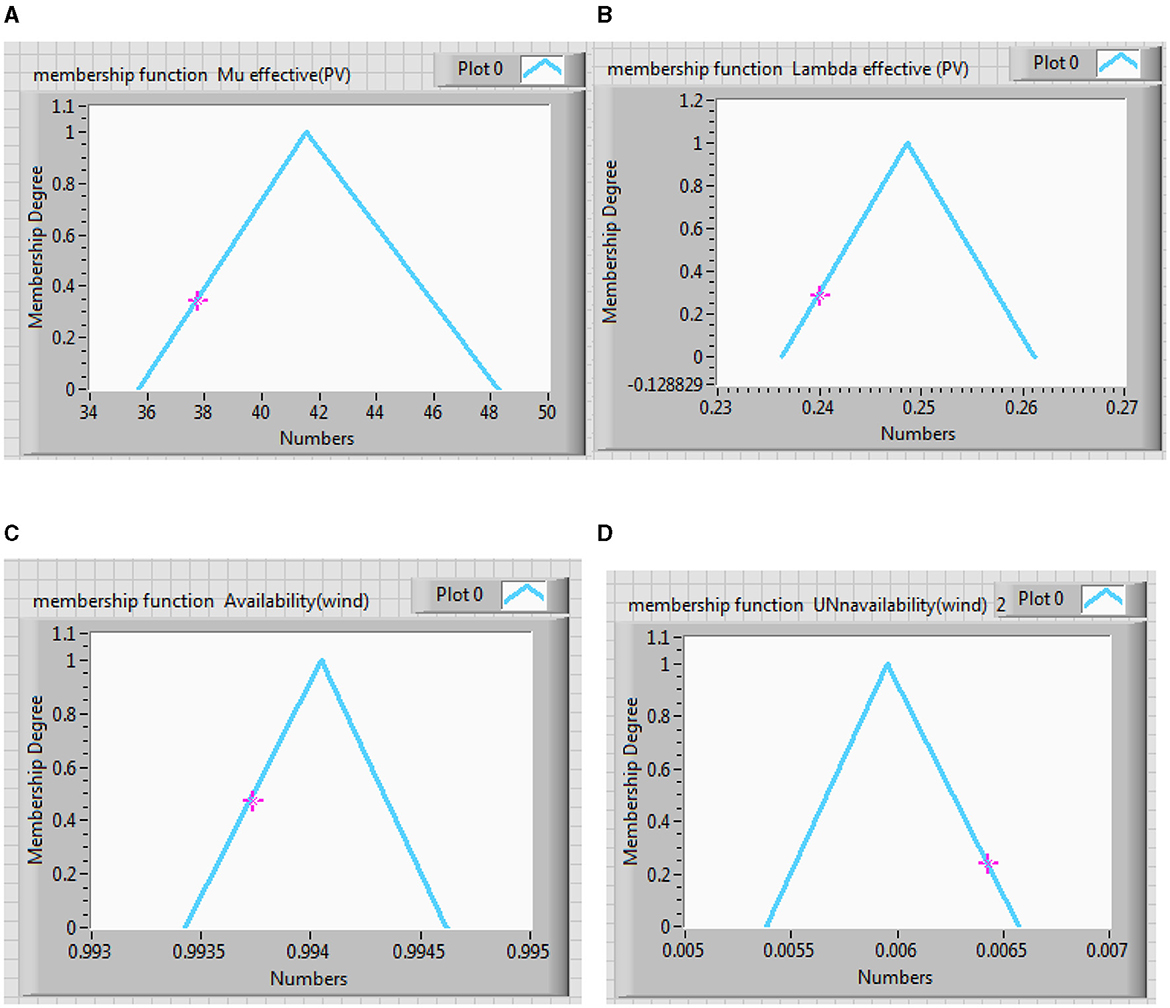
Figure 10. Membership function effective (A) failure rate, (B) repair rate, (C) availability, and (D) unavailability of PV subsystem.
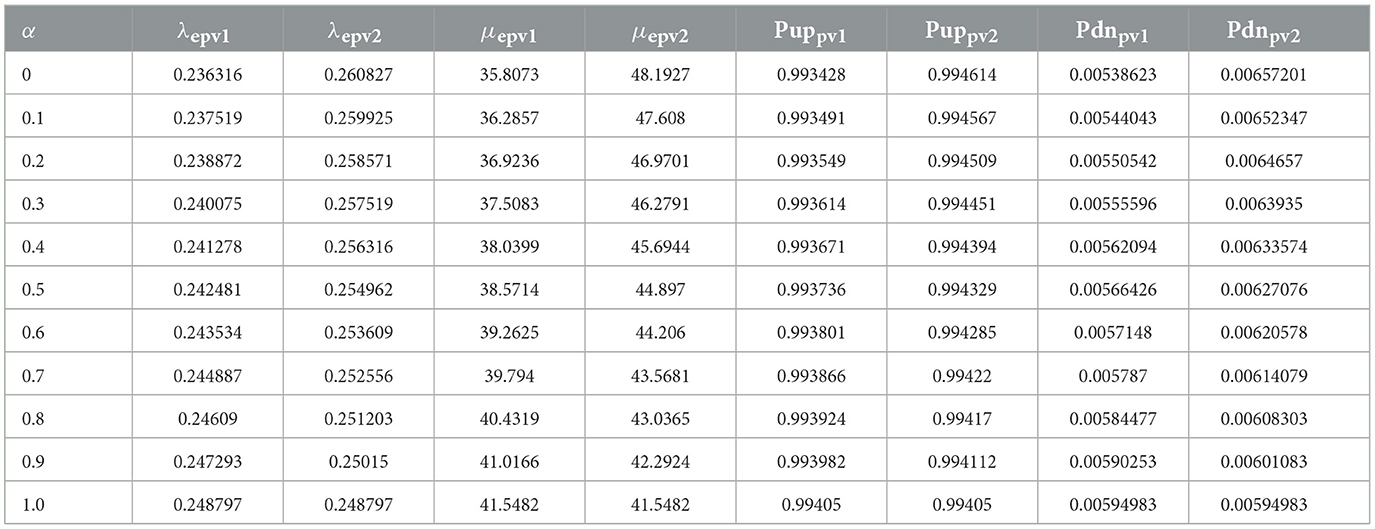
Table 8. Effective failure rate, repair rate, availability, and unavailability of PV subsystem.
Comparing Tables 7, 8, it can be observed that fuzzy results with alpha equal to 1 are expectedly identical to crisp results. In Figures 10A, D are approximately symmetrical, while Figures 10B, C are unsymmetrical. The Center of Area (CA) of Figures 10B, C are not equal to their kernels, which is caused by the uncertainties in the input data. The results of fuzzy analyses are more realistic than those of crisp study. In addition, the triangular membership function has been used because its results incorporate the effect of uncertainties appropriately, and its corresponding computations are also plain.
Table 9 presents the equivalent failure rate, repair rate, availability, and unavailability fuzzy values considering 5% of crisp value. Figure 11 depicts the membership function of effective failure rate, repair rate, availability, and unavailability of battery energy storage system at different alpha cuts from 0 to 1. Table 10 shows the 11 cuts for these parameters.
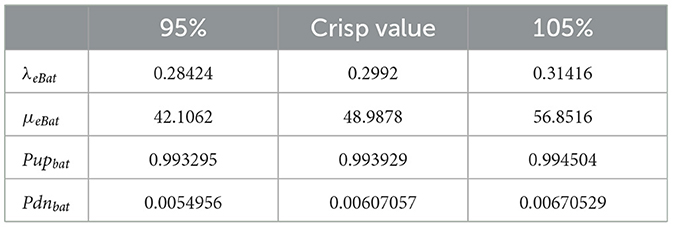
Table 9. Equivalent parameters of the BES subsystem.
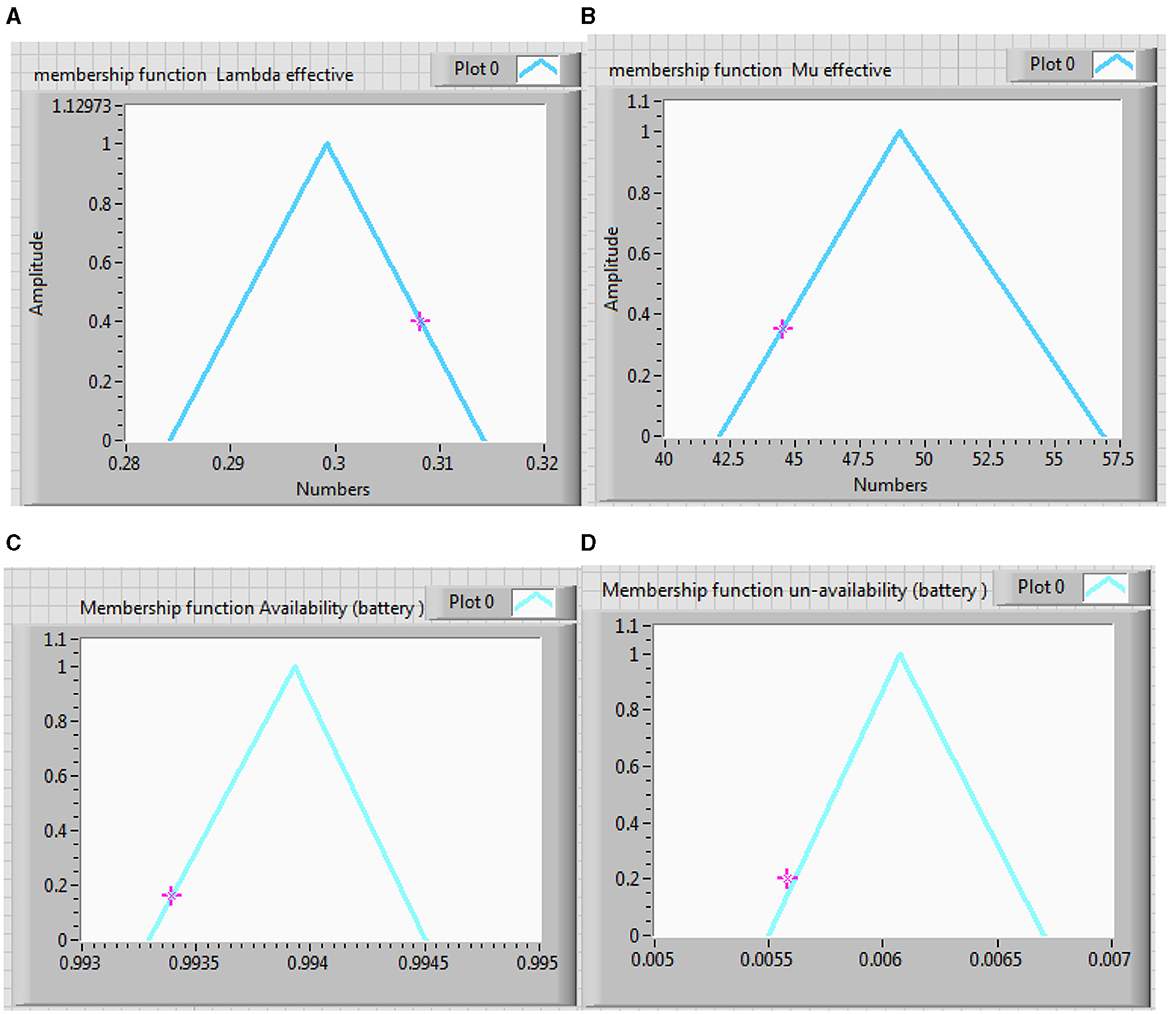
Figure 11. Membership function effective (A) failure rate, (B) repair rate, (C) availability, and (D) unavailability of battery energy storage system.
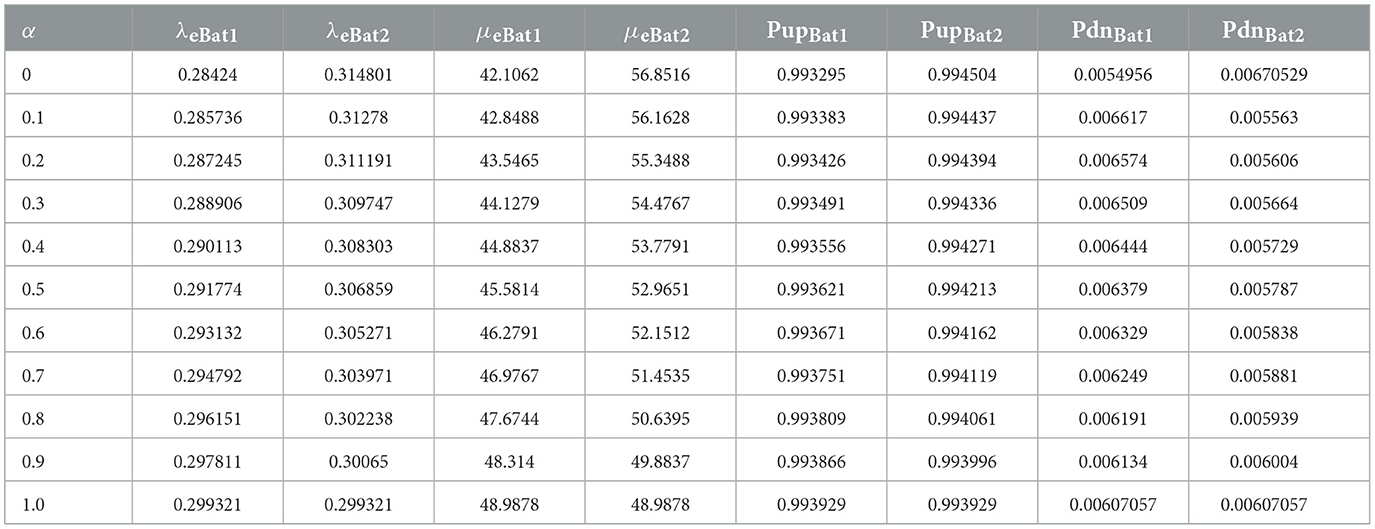
Table 10. Effective failure rate, repair rate, availability, and unavailability of BES subsystem.
Comparing Tables 9, 10, it can be observed that fuzzy results with alpha equal to 1 are expectedly identical to crisp results. In Figures 11A, D are approximately symmetrical, while in Figures 11B, C are unsymmetrical. Center of Area (CA) of Figures 11B, C are not equal to their kernels, which is caused by the uncertainties in the input data. The results of fuzzy analyses are more realistic than those of crisp study. In addition, the triangular membership function has been used because its results incorporate the effect of uncertainties appropriately, and its corresponding computations are also plain.
The equivalent failure rate repair, rate, availability, and unavailability of the microgrid are evaluated using Equations 21–23 and given in Tables 11, 12.
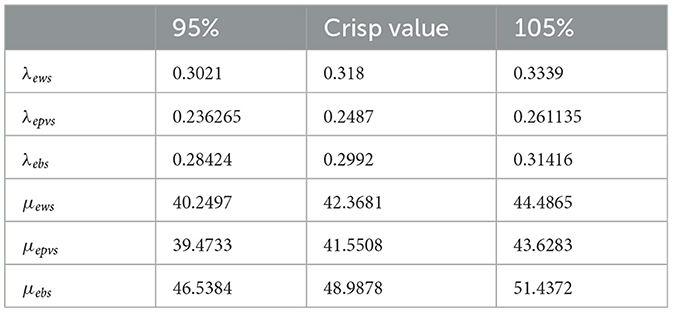
Table 11. Equivalent parameters of microgrid subsystem.
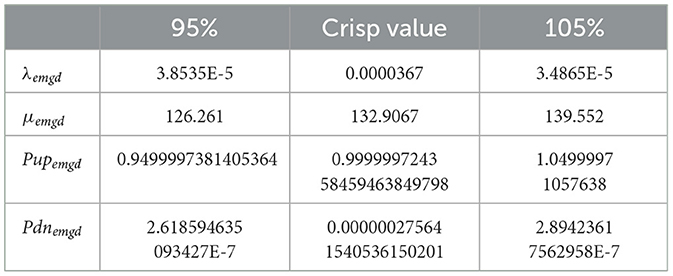
Table 12. Effective failure rate, repair rate, availability, and unavailability of microgrid subsystem.
This study focuses on the reliability modeling of a microgrid, employing the Markov process approach. To address uncertainties in input parameters, fuzzy analysis is implemented, incorporating the effective alpha-cut method for precise calculations. The equivalent two-state model is applied to compute probabilities and transition rates within the microgrid reliability framework. A comparative analysis is conducted using a numerical example involving both crisp and fuzzy data. The findings indicate that assuming crisp parameters equal to the kernel of fuzzy parameters results in a lower microgrid availability when employing fuzzy calculations compared to crisp analysis. This discrepancy is ascribed to the inherent uncertainties present in the input data. The availability of the wind subsystem, PV subsystem, and battery subsystem are 0.99255, 0.99405, and 0.99392, respectively, at an alpha-cut =1. The overall availability of hybrid microgrids is 0.99999.
The original contributions presented in the study are included in the article/supplementary material, further inquiries can be directed to the corresponding authors.
KS: Formal analysis, Writing – original draft, Writing – review & editing. MC: Writing – original draft, Writing – review & editing. IS: Data curation, Investigation, Writing – original draft, Writing – review & editing. APat: Conceptualization, Investigation, Writing – original draft, Writing – review & editing. JG: Conceptualization, Data curation, Investigation, Methodology, Visualization, Writing – original draft, Writing – review & editing. APan: Conceptualization, Investigation, Writing – original draft, Writing – review & editing. HQ: Conceptualization, Data curation, Methodology, Software, Writing – original draft, Writing – review & editing. SM: Conceptualization, Investigation, Software, Writing – original draft, Writing – review & editing.
The author(s) declare financial support was received for the research, authorship, and/or publication of this article. HQ thanks the USA NSF award 1663105, 1761839, and 2200138, a catalyst award from the USA National Academy of Medicine, AI Tennessee Initiative, and the support at the University of Tennessee at Chattanooga.
The authors declare that the research was conducted in the absence of any commercial or financial relationships that could be construed as a potential conflict of interest.
The author(s) declared that they were an editorial board member of Frontiers, at the time of submission. This had no impact on the peer review process and the final decision.
All claims expressed in this article are solely those of the authors and do not necessarily represent those of their affiliated organizations, or those of the publisher, the editors and the reviewers. Any product that may be evaluated in this article, or claim that may be made by its manufacturer, is not guaranteed or endorsed by the publisher.
Adefarati, T., and Bansal, R. C. (2017). Reliability and economic assessment of a microgrid power system with the integration of renewable energy resources. Appl. Energy 206, 911–933. doi: 10.1016/j.apenergy.2017.08.228
Adefarati, T., and Bansal, R. C. (2019). Reliability, economic and environmental analysis of a microgrid system in the presence of renewable energy resources. Appl. Energy 236, 1089–1114. doi: 10.1016/j.apenergy.2018.12.050
Adefarati, T., Bansal, R. C., and John Justo, J. (2017). Techno-economic analysis of a PV–wind–battery–diesel standalone power system in a remote area. J. Eng. 2017, 740–744. doi: 10.1049/joe.2017.0429
Ahshan, R., Iqbal, M. T., Mann, G. K., and Quaicoe, J. E. (2017). Microgrid reliability evaluation considering the intermittency effect of renewable energy sources. Int. J. Smart Grid Clean Energy 6, 252–268. doi: 10.12720/sgce.6.4.252-268
Akbari, M. G., and Hesamian, G. (2020). Time-dependent intuitionistic fuzzy system reliability analysis. Soft Comput. 24, 14441–14448. doi: 10.1007/s00500-020-04796-w
Ansari, O. A., Safari, N., and Chung, C. Y. (2016). “Reliability assessment of microgrid with renewable generation and prioritized loads,” in 2016 IEEE Green Energy and Systems Conference (IGSEC) (IEEE), 1–6. doi: 10.1109/IGESC.2016.7790067
Anzilli, L., and Facchinetti, G. (2019). “An alpha-cut evaluation of interval-valued fuzzy sets for application in decision making,” in Fuzzy Logic and Applications: 12th International Workshop, WILF 2018 Genoa, Italy, September 6–7, 2018 (Cham: Springer International Publishing), 193–211. doi: 10.1007/978-3-030-12544-8_16
Ashraf, S., Saleem, S., Ahmed, T., Aslam, Z., and Shuaeeb, M. (2020). “Iris and foot based sustainable biometric identification approach,” in 2020 International Conference on Software, Telecommunications and Computer Networks (SoftCOM) (IEEE), 1–6. doi: 10.23919/SoftCOM50211.2020.9238333
Billinton, R., and Allan, R. N. (1992). Reliability Evaluation Of Engineering Systems. New York: Plenum press. doi: 10.1007/978-1-4899-0685-4
Bowles, J. B., and Pelaez, C. E. (1995). Application of fuzzy logic to reliability engineering. Proc. IEEE 83, 435–449. doi: 10.1109/5.364489
Del Granado, P. C., Pang, Z., and Wallace, S. W. (2016). Synergy of smart grids and hybrid distributed generation on the value of energy storage. Appl. Energy 170, 476–488. doi: 10.1016/j.apenergy.2016.01.095
Kabir, S., and Papadopoulos, Y. (2018). A review of applications of fuzzy sets to safety and reliability engineering. Int. J. Approx. Reason. 100, 29–55. doi: 10.1016/j.ijar.2018.05.005
Khalili, T., Habibi, S. I., Abadi, S. A. G. K., Ahmadi, S., and Bidram, A. (2022). “Upside risk effect on reliability of microgrids considering demand response program and COVID-19: an investigation on health system and power system interactions,” in 2022 IEEE Kansas Power and Energy Conference (KPEC) (IEEE), 1–6. doi: 10.1109/KPEC54747.2022.9814788
Khare, V., and Chaturvedi, P. (2023). Design, control, reliability, economic and energy management of microgrid: a review. e-Prime-Adv. Electr. Eng. Electr. Energy 5:100239. doi: 10.1016/j.prime.2023.100239
Klir, G. J., and Yuan, B. (1996). Fuzzy sets and fuzzy logic: theory and applications. Possib. Theory Probab. Theory 32, 207–208.
Kumar, A., Ram, M., Goyal, N., Bisht, S., Kumar, S., and Pant, R. P. (2021). “Analysis of fuzzy reliability of the system using intuitionistic fuzzy set,” in Intelligent Communication, Control and Devices: Proceedings of ICICCD 2020 (Springer Singapore), 371–378. doi: 10.1007/978-981-16-1510-8_36
Kwasinski, A., Krishnamurthy, V., Song, J., and Sharma, R. (2012). Availability evaluation of micro-grids for resistant power supply during natural disasters. IEEE Trans. Smart Grid 3, 2007–2018. doi: 10.1109/TSG.2012.2197832
Li, H., and Yen, V. C. (1995). Fuzzy Sets and Fuzzy Decision-Making. London: CRC Press. ISBN: 978–0849389313
Li, W. (2013). Reliability Assessment of Electric Power Systems Using Monte Carlo Methods. Cham: Springer Science and Business Media.
Na, M. S., and Kim, J. O. (2019). Reliability evaluation of micro-grids containing PV system and hydropower plant. Energies 12:343. doi: 10.3390/en12030343
Nikos, H. (2007). Microgrids: an overview of ongoing research, development, and demonstration projects. IEEE Power Energy 5, 1349–1356. doi: 10.1541/ieejpes.129.1349
Onaolapo, A. K., and Ojo, E. E. (2023). “Effects of upside risk on microgrids' reliability considering the COVID-19 Pandemic,” in 2023 31st Southern African Universities Power Engineering Conference (SAUPEC) (IEEE), 1–6. doi: 10.1109/SAUPEC57889.2023.10057664
Pham, T. T., Kuo, T. C., and Bui, D. M. (2020). Reliability evaluation of an aggregate battery energy storage system in microgrids under dynamic operation. Int. J. Electr. Power Energy Syst. 118:105786. doi: 10.1016/j.ijepes.2019.105786
Ren, Y., Cui, B., Feng, Q., Yang, D., Fan, D., Sun, B., et al. (2020). A reliability evaluation method for radial multi-microgrid systems considering distribution network transmission capacity. Comput. Industr. Eng. 139:106145. doi: 10.1016/j.cie.2019.106145
Said, S. M., Aly, M., Hartmann, B., Alharbi, A. G., and Ahmed, E. M. (2019). SMES-based fuzzy logic approach for enhancing the reliability of microgrids equipped with PV generators. IEEE Access 7, 92059–92069. doi: 10.1109/ACCESS.2019.2927902
Santhan, K., Karuppiah, N., Praveen Kumar, B., Shitharth, S., and Dasu, B. (2022). Improvement of the resilience of a microgrid using fragility modeling and simulation. J. Electr. Comput. Eng. 2022:3074298. doi: 10.1155/2022/3074298
Talaat, M., Elkholy, M. H., Alblawi, A., and Said, T. (2023). Artificial intelligence applications for microgrids integration and management of hybrid renewable energy sources. Artif. Intell. Rev. 56, 10557–10611. doi: 10.1007/s10462-023-10410-w
Tazvinga, H., Thopil, M., Numbi, P. B., and Adefarati, T. (2017). “Distributed renewable energy technologies,” in Handbook of Distributed Generation: Electric Power Technologies, Economics and Environmental Impacts, 3–67. doi: 10.1007/978-3-319-51343-0_1
Wesly, J., Brasil Jr, A. C., Frate, C. A., and Badibanga, R. K. (2020). Techno-economic analysis of a PV-wind-battery for a remote community in Haiti. Case Stud. Chem. Environ. Eng. 2:100044. doi: 10.1016/j.cscee.2020.100044
Wu, Z., and Xia, X. (2015). Optimal switching renewable energy system for demand side management. Solar Energy 114, 278–288. doi: 10.1016/j.solener.2015.02.001
Xu, X., Mitra, J., Wang, T., and Mu, L. (2016). Reliability evaluation of a microgrid considering its operating condition. J. Electr. Eng. Technol. 11, 47–54. doi: 10.5370/JEET.2016.11.1.047
Zimmermann, H. J. (2011). Fuzzy Set Theory—and Its Applications. New York: Springer Science and Business Media.
λw, λAD, λDA, λDD, λBat, λcc - are the failure rates of wind turbine generation, solar photovoltaic, AC/DC converter, inverter, DC/DC booster battery system, and charge controller, respectively.
λws, λpvs, and λbats are the equivalent failure rate of wind, PV, and battery subsystems, respectively.
μws, μpvs, and μbats are the equivalent repair rates of the wind, PV, and battery subsystems, respectively.
μw, μAD, μDA, μDD, μBat, μcc are the repair rates of wind turbine generation, solar photovoltaic, AC/DC converter, inverter, DC/DC booster battery systems, and charge controllers, respectively.
Pupws, Puppv, Pupbat are the probability of being at UP state in wind turbine generation, solar photovoltaic, and battery subsystem, respectively.
Pdnws, Pdnpv, Pupbat are the probabilities of being at a DOWN state in wind turbine generation, solar photovoltaic, and battery subsystems, respectively.
λew1, λew2, μew1 μew2 Pupws1, Pupws2 Pdnws1, and Pdnws2 are the equivalent failure rate, repair rate, availability, and unavailability fuzzy values of wind subsystem considering 5% of crisp value, respectively.
λepv1, λepv2, μepv1, μepv2, Puppv1, Puppv2, Pdnpv1, and Pdnpv2 are the equivalent failure rate, repair rate, availability, and unavailability fuzzy values of the PV subsystem considering 5% of crisp values, respectively.
λeBat1, λeBat2, μeBat1, μeBat2, PupBat1, PupBat2, PdnBat1, and PdnBat2 are the equivalent failure rate, repair rate, availability, and unavailability fuzzy values of battery subsystem considering 5% of crisp values, respectively.
Keywords: microgrid, fuzzy Markov model, reliability analysis, wind, solar, battery
Citation: Swain K, Cherukuri M, Samanta IS, Pati A, Giri J, Panigrahi A, Qin H and Mallik S (2024) Fuzzy Markov model for the reliability analysis of hybrid microgrids. Front. Comput. Sci. 6:1406086. doi: 10.3389/fcomp.2024.1406086
Received: 24 March 2024; Accepted: 17 May 2024;
Published: 10 June 2024.
Edited by:
Fiona Maree Chatteur, Torrens University Australia, AustraliaReviewed by:
Praveen Kumar Balachandran, Vardhaman College of Engineering, IndiaCopyright © 2024 Swain, Cherukuri, Samanta, Pati, Giri, Panigrahi, Qin and Mallik. This is an open-access article distributed under the terms of the Creative Commons Attribution License (CC BY). The use, distribution or reproduction in other forums is permitted, provided the original author(s) and the copyright owner(s) are credited and that the original publication in this journal is cited, in accordance with accepted academic practice. No use, distribution or reproduction is permitted which does not comply with these terms.
*Correspondence: Hong Qin, SG9uZy1RaW5AdXRjLmVkdQ==; Saurav Mallik, c2F1cmF2bXRlY2gyQGdtYWlsLmNvbQ==; Abhilash Pati, ZXIuYWJoaWxhc2gucGF0aUBnbWFpbC5jb20=; Jayant Giri, amF5YW50cGdpcmlAZ21haWwuY29t; Murthy Cherukuri, Y2htdXJ0aHkyMDA3QGdtYWlsLmNvbQ==
†ORCID: Jayant Giri orcid.org/0000-0003-4438-2613
Disclaimer: All claims expressed in this article are solely those of the authors and do not necessarily represent those of their affiliated organizations, or those of the publisher, the editors and the reviewers. Any product that may be evaluated in this article or claim that may be made by its manufacturer is not guaranteed or endorsed by the publisher.
Research integrity at Frontiers
Learn more about the work of our research integrity team to safeguard the quality of each article we publish.