- 1Department of Electrical and Computer Engineering, University of Michigan-Dearborn, Dearborn, MI, United States
- 2Department of Sustainable Communication Technology, SINTEF Digital, Oslo, Norway
- 3Department of Informatics, University of Oslo, Oslo, Norway
A novel technique for electronic control unit (ECU) identification is proposed in this study to address security vulnerabilities of the controller area network (CAN) protocol. The reliable ECU identification has the potential to prevent spoofing attacks launched over the CAN due to the lack of message authentication. In this regard, we model the ECU-specific random distortion caused by the imperfections in the digital-to-analog converter and semiconductor impurities in the transmitting ECU for fingerprinting. Afterward, a 4-layered artificial neural network (ANN) is trained on the feature set to identify the transmitting ECU and the corresponding ECU pin. The ECU-pin identification is also a novel contribution of this study and can be used to prevent voltage-based attacks. We have evaluated our method using ANNs over a dataset generated from 7 ECUs with 6 pins, each having 185 records, and 40 records for each pin. The performance evaluation against state-of-the-art methods revealed that the proposed method achieved 99.4% accuracy for ECU identification and 96.7% accuracy for pin identification, which signifies the reliability of the proposed approach.
1 Introduction
The modern vehicle functions as a cyber-physical system (CPS). It is equipped with numerous wireless and wired communication interfaces, along with a multitude of microcontrollers and electronic control units (ECUs). These components are interconnected via various in-vehicle networks (IVNs) (Lorenz, 2010; Grzemba, 2012; AUTOSAR, 2017; Hafeez, 2020; Hafeez et al., 2020b,c; Noori et al., 2023), such as the controller area network (CAN) (Tindell et al., 1994), local interconnected network (LIN) (AUTOSAR, 2017), media-oriented system transport (MOST) (Grzemba, 2012), and FlexRay (Lorenz, 2010). These networks link critical vehicle systems such as brakes, airbags, engine control, and safety features like electronic stability programs and adaptive cruise control. However, integrating wireless interfaces like Bluetooth and Wi-Fi with IVNs, alongside using the legacy CAN protocol for in-vehicle control, introduces significant security risks to connected autonomous vehicles (AVs) (Arif et al., 2012; Upstream Security Global Automotive Cybersecurity Report, 2019; Khalid et al., 2023).
Advances in vehicle technologies are unable to keep pace with the growing attack surfaces and vectors, leaving millions of vehicles vulnerable to a wide range of attacks, e.g., man-in-the-middle and packet spoofing (Fröschle and Stühring, 2017; Liu et al., 2017; Marchetti and Stabili, 2018). This is because the automotive industry still relies on the legacy CAN protocol for in-vehicle communication among ECUs, which lacks basic security features such as message authentication, confidentiality, and integrity, making it vulnerable to attacks (Studnia et al., 2013; Greenberg, 2015; Elkhail et al., 2021; Lee et al., 2024; Pal et al., 2024). Researchers have proposed various solutions to detect and prevent attacks on the CAN protocol for in-vehicle control networks. These methods can be classified into two categories: (i) message authentication code (MAC)-based approaches (Wolf et al., 2004; Hazem and Fahmy, 2012; Wang and Sawhney, 2014; Ueda et al., 2015; Gierlichs and Poschmann, 2016; Sugashima et al., 2016; Doan and Ganesan, 2017; Hafeez et al., 2017; Agrawal and Maiti, 2024); and (ii) intrusion detection-based approaches (Cho and Shin, 2016, 2017; Marchetti et al., 2016; Avatefipour et al., 2017; Lee et al., 2017; Marchetti and Stabili, 2017; Rieke et al., 2017; Stabili et al., 2017; Choi et al., 2018a,b; Groza and Murvay, 2018; Hafeez et al., 2018, 2019, 2020a; Kneib and Huth, 2018; Sagong et al., 2018a; Wu et al., 2018; Bellaire et al., 2022; Mohammadi and Malik, 2022; Refat et al., 2022; Baldini, 2023; Deng et al., 2023; Gul et al., 2023; Ibrahim and Safa, 2023; Liu et al., 2023; Ahmad et al., 2024; Aloraini et al., 2024; Cao et al., 2024; Elsayed and Zincir-Heywood, 2024; Jeong et al., 2024; Saini and Islam, 2024; Wang et al., 2024).
The MAC-based methods achieve security and privacy by encrypting the payload of the CAN packet before transmission (Singh et al., 2024). For instance, Wang and Sawhney (2014) demonstrated a MAC-based framework, VeCure, for CAN security. In VeCure, a 64-bit MAC was transmitted for every 64-bit message between the ECUs. Intuitively, this method exhibited high computational cost, adds 50% additional transmission overhead, and also requires a higher data rate. Ueda et al. (2015) designed an authentication mechanism for the CAN protocol to protect against spoofing attacks. The monitoring node provided the authentication code for all ECUs and verified the code for all CAN messages. Hazem and Fahmy (2012) proposed a lightweight CAN authentication protocol (LCAP). The LCAP required appending a “magic number” generated by a one-way hash function employed on the TESLA prototype (Perrig et al., 2000). This protocol still created a 25% overhead by requiring 16 bits of data field to append the authentication. The MAC-based approaches have intrinsic overhead that lowers the transmission performance, making them unreliable for CAN security (Wang and Sawhney, 2014; Avatefipour et al., 2017; Hafeez et al., 2017).
To address the limitations of MAC-based solutions, researchers have proposed intrusion detection-based approaches for CAN network traffic analysis (Hazem and Fahmy, 2012; Ueda et al., 2015; Cho and Shin, 2016; Nürnberger and Rossow, 2016; Groza and Murvay, 2018). These intrusion detection-based approaches have lower data rate requirements because they do not add additional bits during the message transmission, thus avoiding additional network overhead. Cho and Shin (2016) demonstrated a clock-based intrusion detection system (CIDS) that used ECU fingerprinting. Each ECU contained a crystal oscillator known as a clock, and the ECU fingerprinting measured the clock skewness against the received packets and detected the attack. However, Sagong et al. (2018a), and Tayyab et al. (2018) demonstrated that CIDS can be bypassed by estimating the clock parameters. In Avatefipour et al. (2017), message authentication was performed through ECU detection by applying higher-order moments of the CAN signal in both time- and frequency domains. However, this approach needs to be more tolerant against the transmitter induction, and the performance of the system significantly decreases with an increased number of transmitters. Therefore, we need an IDS-based approach that can extract unique fingerprints from the signal, works for a higher number of transmitters, and exhibits low computational complexity.
This study presents a novel IDS-based message authentication approach to address the aforementioned limitations of existing in-vehicle security techniques. Our approach exploits the uniqueness in device-specific distortions, such as semiconductor impurities, DC offset, aliasing error, and mismatch between the nominal and measured values of electric components in a digital-to-analog converter (DAC), for message fingerprint generation. This study hypothesizes that distortions due to digital-to-analog conversion operation at the ECU output are device-dependent and can be used to link the received packet to the transmitting ECU. Therefore, we associate the received packet with a specific ECU and the ECU pin responsible for message transmission using an artificial neural network approach.
The main objective of this research is to investigate ECU-level uniqueness for a given network and pin-level uniqueness for a given ECU to authenticate the message. The proposed method relies on the distinctive physical artifacts of the DAC of the transmitting ECU for device-level fingerprinting. The imperfections in the material, design, and fabrication of the DAC contribute to distortion in the ECU signal. A statistical modeling of this distortion is developed, and used as a feature vector for transmitter identification (i.e., transmitting ECU and ECU-Pin) through a neural network architecture. Thus, the main contributions of the study are:
• A mathematical model of the distortion sources, including imperfections in the material, design, and fabrication of the DAC.
• A statistical model of the device ECU-level distortion for transmitter identification.
• A proposal that different transmitting pins in a single device have unique distortion and can be used for ECU-pin identification.
The rest of the study is organized as follows: Section 2 describes the system model and outlines sources of device-specific distortion in the CAN signal. Experimental setup, dataset, performance measures, results, and analysis are provided in Section 3. This section also provides a comparison of our method with the current state-of-the-art research. Concluding remarks and future directions are discussed in Section 4.
2 System model
Figure 1A shows a subnet of a CAN bus that contains γ = {1, 2, …, n} ECUs represented as E(i), with a fingerprinting unit E(s) that sniffs the CAN bus and acquires an analog signal transmitted by the ith ECU, E(i), where i∈γ. The E(s). As represented in Equation 1, the fingerprinting ECU, E(s), converts the analog measurement at its input, , to its digital equivalent, . The fingerprinting ECU, E(s), computes the distortion, d(i)(n), for E(i) in the received signal, , by subtracting it from the expected signal level, , i.e.,
Here, {d(i)(n) ∈ n(i)|n(i):[L→U]}, where L = −0.10 and U = 0.10 represent the lower and upper distortion values, respectively.
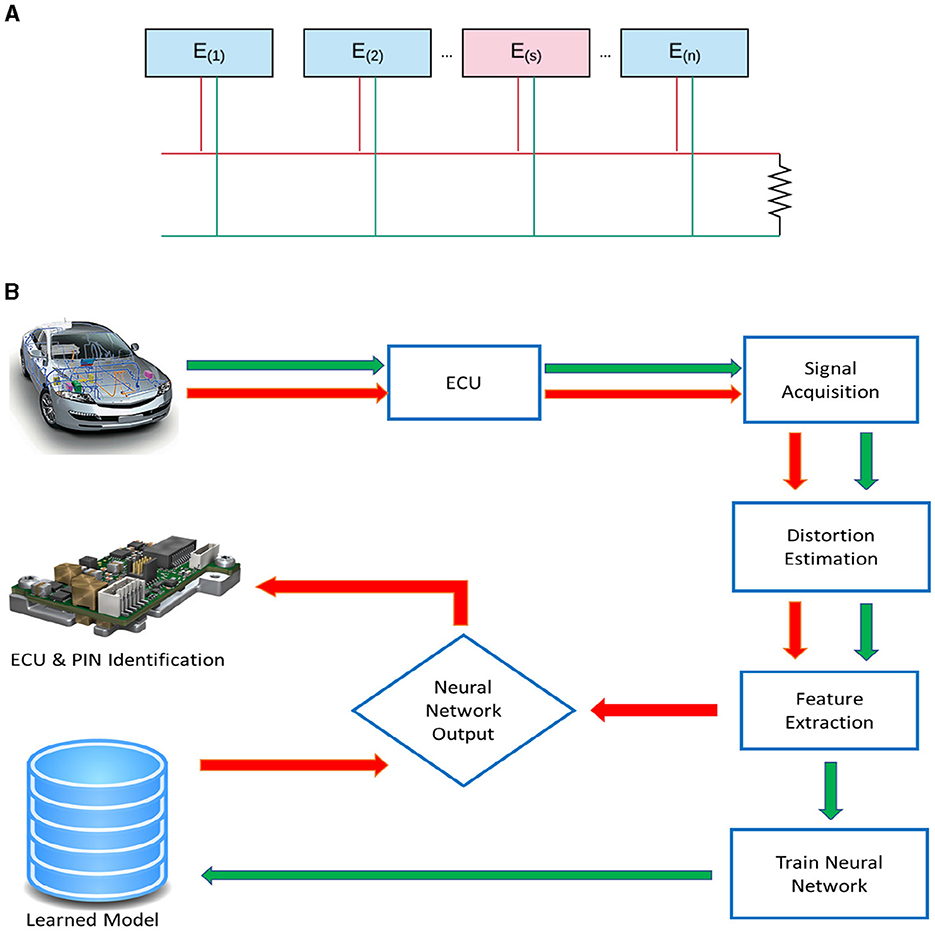
Figure 1. Generalized architecture of the CAN bus (A) and block diagram of the proposed device identification system (B). Green arrows → here represent the learning phase, and red arrows → here represent the testing phase of device identification.
The d(i)(n) is then used for feature extraction to generate the feature vector for E(i), where m represents the number of features, r ∈ R, and R is the total number of records. The extracted features are used in an artificial neural network architecture for training data and evaluation of test data. Shown in Figure 1B, is the generalized architecture of the CAN bus (Figure 1A) and block diagram of the proposed device identification system (Figure 1B). A brief description of each processing block is provided in the following subsections.
2.1 Signal acquisition
The E(s) acquires the analog signal generated by E(i) and converts it into a digital signal as represented in Equation 2.
The represents a sampling time of 50ns and a sampling rate of 20MSa/sec for the signal. The reason to generate is that the occurs at infinite instants of time, thus demanding large memory to get stored. However, the analog-to-digital conversion is performed because the E(s) have limited memory. The number of bits required to store each sample is n; in our case, n = 8bits. To extract distortion, we compute the expected signal from using Equation 3:
Equation 3 here represents the mapping of the received signal, , onto the CAN high and CAN low voltage levels, e.g., 3.5V and 2.5V. Specifically, the received signal, , is mapped to 3.5v if is between 3.3v and 3.7v; otherwise it will be 2.5v. The signal represents the expected signal from E(i); however, it has been observed through extensive analysis of CAN communication signals that the actual signal levels differ from the expected signal levels. As shown in Figure 2A, the waveform of the CAN signal captured using a DS1012A oscilloscope for the significantly differs from the expected signal due to the distortion mainly attributed to semiconductor impurities, the mismatch between nominal values and measured values of electric components, the aliasing error of the finite impulse response (FIR) filter, and the DC offset of the DAC. Moreover, these imperfections are device-specific and can be used for ECU fingerprinting.
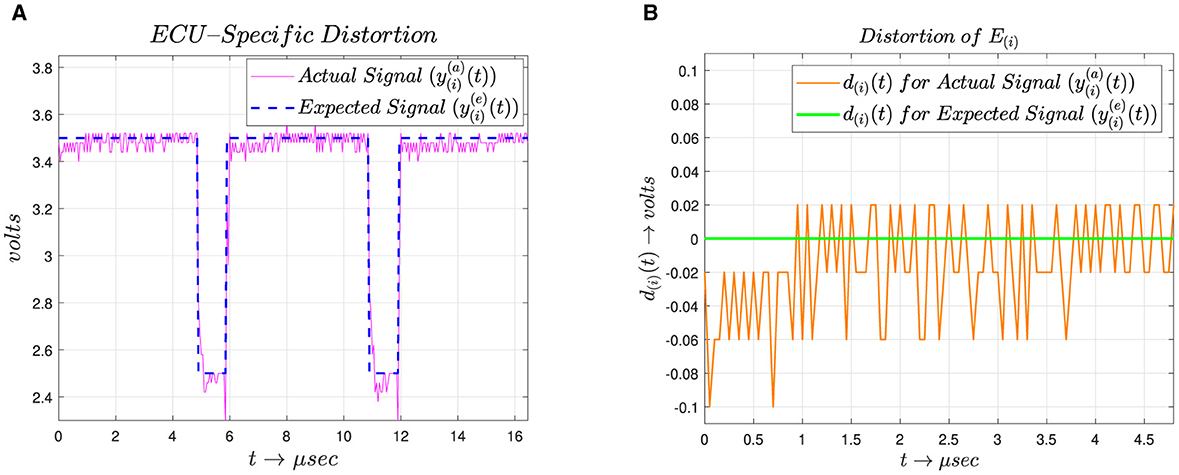
Figure 2. Screenshots of the actual and expected waveform vs. ECU signal. (A) Actual and expected waveform. (B) Distortion in the ECU signal.
2.2 Distortion extraction
The imperfections observed in the signal acquisition stage are used for fingerprinting the ECUs. The fingerprinting is quantified in distortion modeling, which is acquired in the DensityEstimation stage. Before distortion modeling, we acquire distortion as shown in Figure 2B, which is represented in Equation 4.
There are four main reasons for distortions, which are discussed as follows:
2.2.1 Mismatch of nominal and measured values of electric components
Imperfections in the electric components are one of the sources of d(i)(n). These imperfections can be described as deviations of the measured values of electric components from their nominal values. Let Ro(i) be the value of the feedback resistor of the E(i), and δR(i) represents the deviation from the nominal value, commonly known as the tolerance level. The actual resistance Ra(i) can then be expressed as Equation 5, which is as follows:
Let represent the distortion due to δR(i), which is the first cause of distortion at the DAC output. The purpose of a DAC in an ECU is to convert bits into a physical signal in the form of voltage, as shown in Figure 3. The reason for this conversion is that the signal propagates through a channel in the form of a physical signal.
2.2.2 Semiconductor impurities
During semiconductor device manufacturing, the impurities in the silicon used for manufacturing semiconductors cannot be removed entirely (Pizzini et al., 1986; Pizzini, 2010; Roskill, 2011; Yoshida and Langouche, 2015). These impurities in the semiconductor can cause flicker distortion (also known as 1/f noise) at the DAC output (Godfrey et al., 2015). We represent the distortion due to semiconductor impurities as , which is one of the sources of distortions at the DAC output. The imperfections in the device material and fabrication process are the other contributing factors to the observed distortion.
2.2.3 Non-ideal behavior of low-pass filter
Another contributing factor in distortion is an aliasing error due to the non-ideal behavior of the low-pass filter used in digital-to-analog conversion. The digital signal, acquired through the continuous signal sampling operation, introduces periodic repetition of its spectra. Let represent the Fourier transform of , which is input in DAC, and represents the Fourier transform in form of the continuous signal. Low-pass filtering is used to filter out from to avoid unwanted copies, which is commonly implemented using a FIR filter realization. Equation 6 represents the relationship between input and output of the DAC,
Let H(f) represent the transfer function of the FIR filter; the output of the FIR filter can be expressed through Equation 7.
Ideally, Y(i)FIR(f) should be the same as , but due to an aliasing error these values differ. The non-ideal behavior of FIR realization introduces aliasing at the DAC output. Let denote distortion due to the non-ideal behavior of the low-pass filter realization for the E(i). This is the third cause of distortion in the output of the DAC.
2.2.4 DC offset error
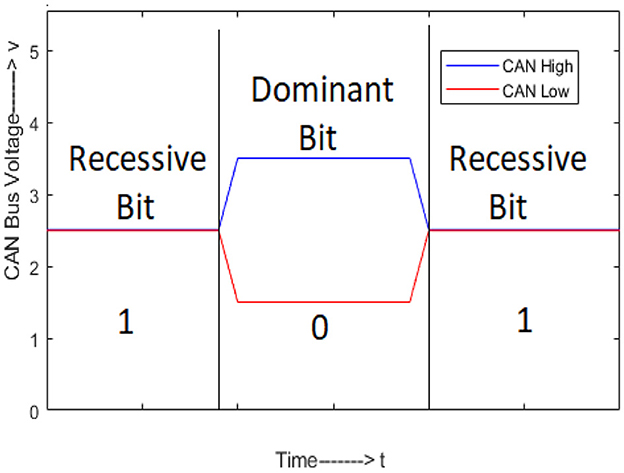
The DC offset error in the DAC is another source of distortion (Pavan et al., 2017). Ideally, the dominant bit level is 3.5V and the ideal recessive bit level is 2.5V, as shown in Figure 3, but DC offset is added to the ideal voltage value due to grounding issues in the DAC. The total distortion d(i)(n) due to DAC for the E(i) can be expressed as Equation 8,
Similarly, we can derive from Equation 4 that:
Therefore, Equation 9 validates our hypothesis that the distortion added to the received signal is dynamic and can be an effective measure for fingerprinting the ECUs.
Furthermore, the device-specific distortion is also unique for each pin within the E(i), represented as E(i, l), where {l ∈ ζ|ζ = 1, 2, …, λ} are the total number of pins within E(i). This also elaborates that we need to determine the affected ECU and the relevant pin for attack modeling. Additionally, pin-level artifacts effectively detect spoofing attacks launched from a different pin of the same ECU. Recently, Sagong et al. (2018b) demonstrated a voltage-based attack that permanently damages a target ECU pin. A voltage-based attack is launched by an adversary, which sends a high voltage through a pin (which has a maximum capacity of 5V) to damage the pin permanently. However, these attacks can be avoided by fingerprinting the E(i, l).
2.3 Density estimation
After the distortion modeling, we use d(i)(n) for histogram generation. These histograms will then be used as fingerprints for E(i) and E(i, l). In order to make a histogram, we need to group the distortion values in m histogram bins with step size β, which can be computed as in Equation 10.
Where U and L represent the lower and upper values for distortion, and m represents the number of bins. In our case, m = 200; thus, step size β becomes 10−3. The histogram h(i)(k) for N = 1500 samples of d(i)(n) is computed using Equation 11. Here, k = {0, 1, 2, …, m}.
Where δ(.) denotes the Kronecker delta function (Adnan et al., 2018), that can be computed through Equation 12.
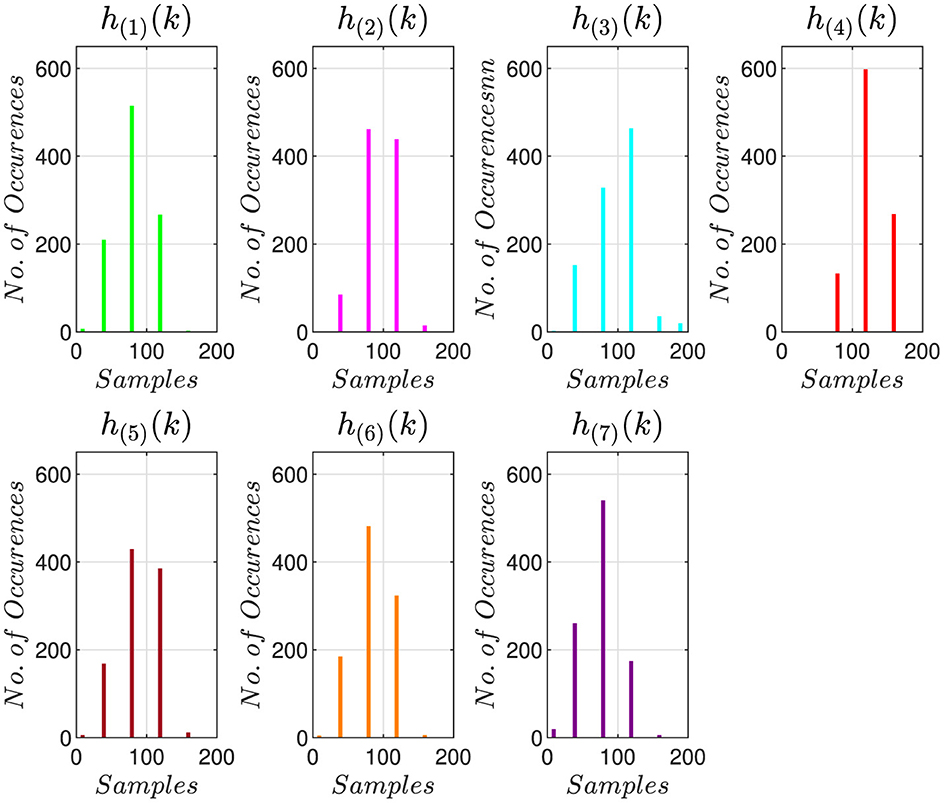
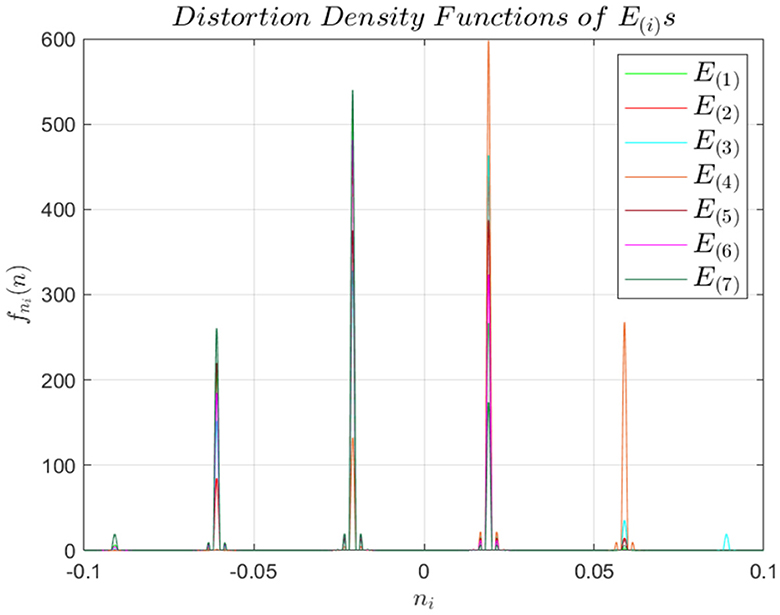
Figure 4 shows the histogram h(i)(k) of E(1)–E(7). Afterwards h(i)(k) is used as feature set .
2.4 ANN-based model learning
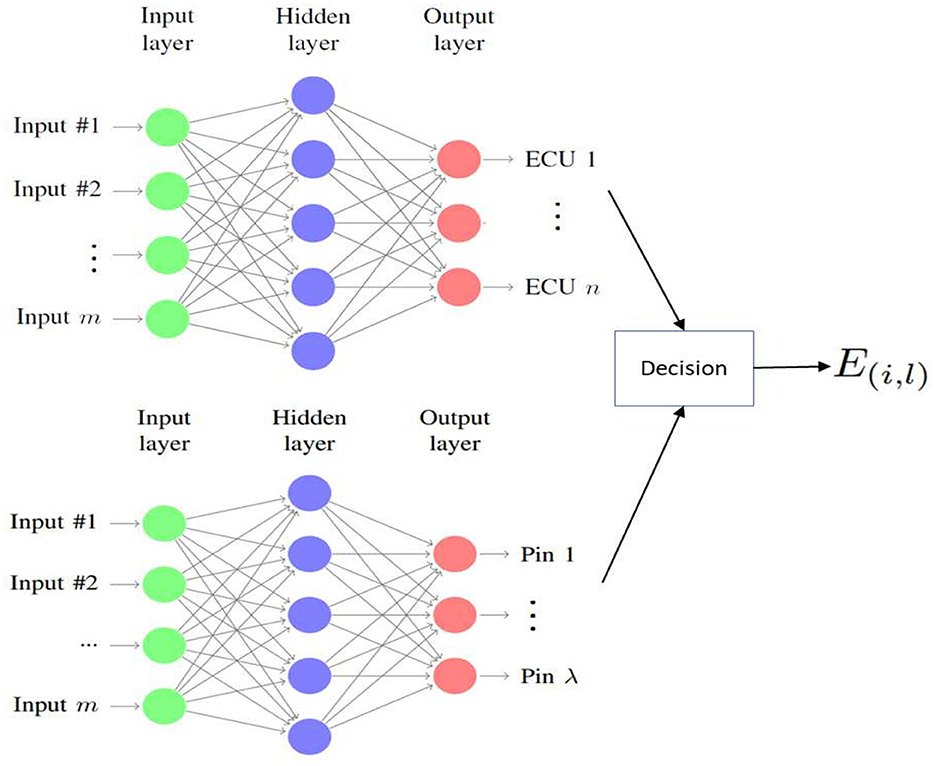
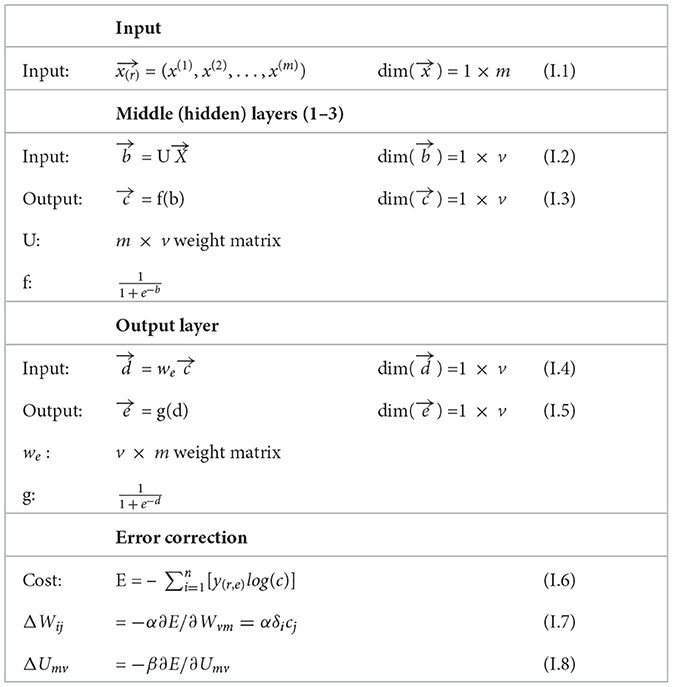
An artificial neural network (ANN)-based model is used to identify the source ECU and the corresponding pin. For this the ANN gets X(r) = {x(1), x(2), …, x(R)} as input-set and corresponding ECU- and pin-labels Y(r, e) = {y(1, e), y(2, e), …, y(R, e)}, Y(r, p) = {y(1, p), y(2, p), …, y(R, p)} respectively; and it predicts the ECU-labels and corresponding pin-labels as Ŷ(r, e) = {ŷ(1, e), ŷ(2, e), …, ŷ(R, e)} and Ŷ(r, p) = {ŷ(1, p), ŷ(2, p), …, ŷ(R, p)} respectively, where e∈γ, p∈ζ, and r∈R. The classifier is trained on the dataset with three hidden layers, each with v neurons (in our case v = 10), using the “scaled conjugate gradient backpropagation” method for weight optimization. For hyperparameter tuning, we used GridSearchCV (a scikit-learn library) to search for the best parameter values from the given set of parameters. Several hidden layers and neurons were tested using this library. Empirically, we chose three hidden layers and determined the number of neurons (Arif et al., 2023). During the training phase, the model learns the weight vector represented by: for all E(i) and for all E(i, l). The output of both networks is then merged as the final output during the testing phase (Figure 5). The ANN architecture for ECU recognition is presented in Table 1, and the same architecture is also used for ECU-pin recognition.
Table 1 summarizes the neural network structure used in this study, including the input layer, middle (hidden) layers, output layer, and error correction mechanism. The input layer, represented as , receives data with dimensions 1 × m. The middle layers perform computations on the input vector using a weight matrix U, resulting in an output vector through an activation function f. Similarly, the output layer processes the input vector using a weight matrix w, resulting in an output vector through another activation function g. The error correction mechanism is described by the calculation of the cost function E and the update equations for the weight matrices w and U, denoted as ΔWij and ΔUmv, respectively. These equations involve gradients of the error with respect to the weights and are updated using learning rates α and β for w and U, respectively. This comprehensive structure outlines the flow of information and the mechanism for adjusting weights to minimize errors during the training process of the neural network.
3 Results and discussion
3.1 Experimental setup
The proposed approach evaluates inter-class (amongst ECUs) and intra-class (amongst ECU pins) variability for message authentication. For inter-class variability, seven ECUs (transmitters) of the same make and model were used in this study, and data was recorded through the CAN-High (CANH) pin. For intra-class variability, six DAC pins of the same ECU were analyzed to determine the pin-level characteristics.
The hardware comprised seven Arduino UNO-R2 micro-controller kits; seven CAN-Bus shield boards with MCP2515 CAN-bus controllers and MPC2551 CAN transceivers; and a DSO1012A oscilloscope to record the voltage samples with a sampling rate of 20Msa/s, with 100MHz bandwidth. MatlabR2018a software was used for statistical data analysis of the sampled signals. A computer simulation that continuously transmitted messages from different ECUs and pins was written. Afterward, these messages were then used as the dataset for model training and evaluation.
3.2 Dataset description
The ECU identification dataset comprised 1, 295(7 × 185) records with 1, 500 samples in each record. Whereas, for pin-level identification, a dataset was collected for six different pins of each transmitting ECU with 40 records for each pin. The dataset used here was collected in the same environment, i.e., under the same temperature, and using an identical message to observe the unique variations of the digital signals.
To ensure the proposed classification scheme was robust and not overfitting to the training data, we implemented several validation techniques. The model was evaluated using various metrics: the dataset was randomly split into training and testing sets with a training ratio of 70% and a testing ratio of 30%. In addition, regularization techniques such as L1 (Lasso) were incorporated into the model. Moreover, early stopping criteria were introduced during the training phase. In addition to accuracy, the model was evaluated using precision, recall, F1-score, and AOC. By implementing these techniques, we ensured that the proposed classification scheme was validated rigorously and could generalize well to new, unseen data.
3.3 Performance evaluation measures
We used precision, recall, F1score, accuracy, and error rate as performance evaluation measures. To evaluate the effectiveness of the proposed method, we determined how many ECUs were correctly identified in response to messages sniffed by E(s). Let TP represent the true positive rate, FP represents the false positive rate, TN represents the true negative rate, and FN represents the false negative rate. Then precision can be defined as follows in Equation 13.
Precision was used to measure the ratio of the true instances against the retrieved instances for a particular class. To measure the sensitivity, we used the recall rates that can be computed as follows in Equation 14.
Recall was computed to measure the total number of retrieved relevant instances. In order to combine both measures, i.e., precision and recall, we used the F1Score that was computed as below in Equation 15.
The higher F1score signifies the robustness of the classification approach. In order to evaluate the overall performance by considering all the classes together, we computed the accuracy as follows in Equation 16.
Accuracy was computed to measure all instances that were correctly classified, despite the fact, whatever class they belong to. Moreover, by using the accuracy value, we also computed the overall error rate as follows in Equation 17.
3.4 Feature stability analysis
This experiment aims to validate that different ECUs, even of the same make and model, introduce different artifacts while transmitting an identical message, and this uniqueness can be exploited to counter spoofing attacks. To achieve this goal, all ECUs transmitted the same messages over the same channel with constant settings regarding temperature and environment. Data was recorded for each ECU with identical channel inputs and transmission parameters to validate the claim of ECU-specific distortion. To verify the uniqueness, we estimated the distortion density function by applying the Spline function (Hirst and Espesser, 1993) over the histogram h(i)(k) to get fni(n) as shown in Figure 6A. The estimated distortion distribution represents the physical characteristics of each ECU. In order to find the stability, we generated the fni(n) of each ECU 100 times and computed the mean and standard deviation (STD). From Figure 6B, it can be observed that the difference between the mean and mean ± STD is negligible, which shows that the feature set remains constant over time for each ECU. Hence, it is proved that the proposed feature extraction approach induces the unique attributes for ECU representation that make it effective for ECU identification.
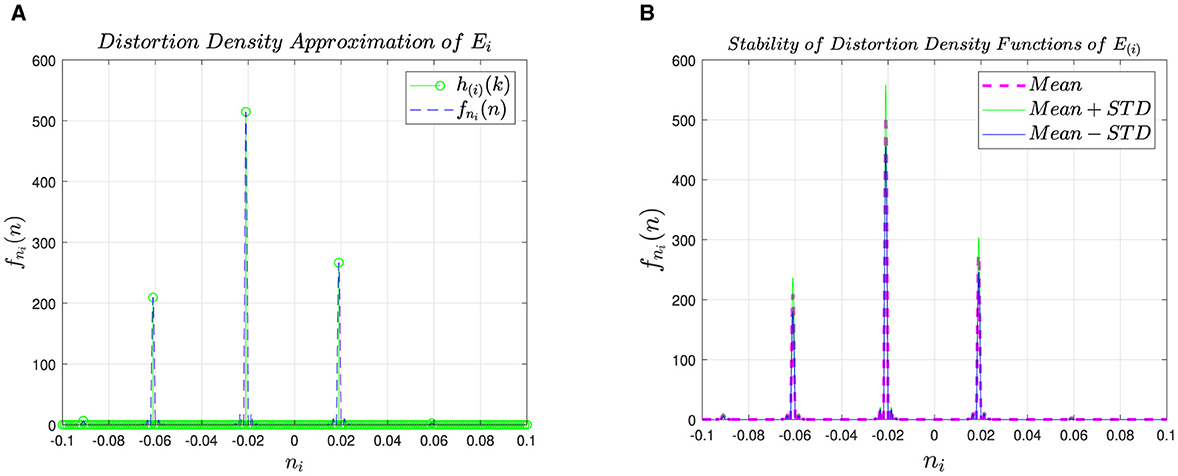
Figure 6. Density approximation of distortion and effectiveness of our feature set. (A) Density approximation of distortion. (B) Effectiveness of our feature set.
To further validate the uniqueness attribute of the proposed method, we plotted fni(n) for seven ECUs as shown in Figure 7, which clearly shows that each ECU has a unique representation. The benefit of the uniqueness is that the attacker cannot replicate an ECU's profile, thus signifies that our approach is robust against spoofing attacks.
3.5 ECU-level identification
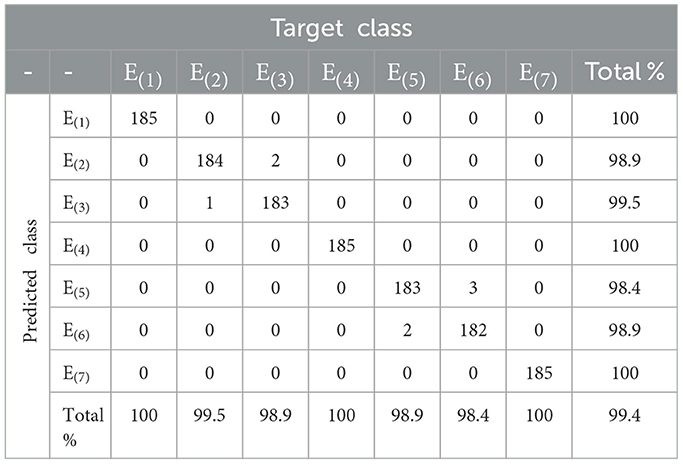
The purpose of this experiment is to validate that any two ECUs exhibit different distortion profiles, i.e., any two ECUs, even from the same make and model, introduce different artifacts into the transmitted signal. To achieve this objective, seven ECUs were used to transmit the same message over the same channel with the same environmental settings, e.g., temperature, environment, etc. A seven-class multilayered neural network classifier is trained and tested on the data collected using data acquisition method described in Section 3. Shown in Tables 2, 3, and Figure 8 are the confusion matrix, performance evaluation in terms of selected performance metric, and detector receiver operating characteristic (ROC), respectively.
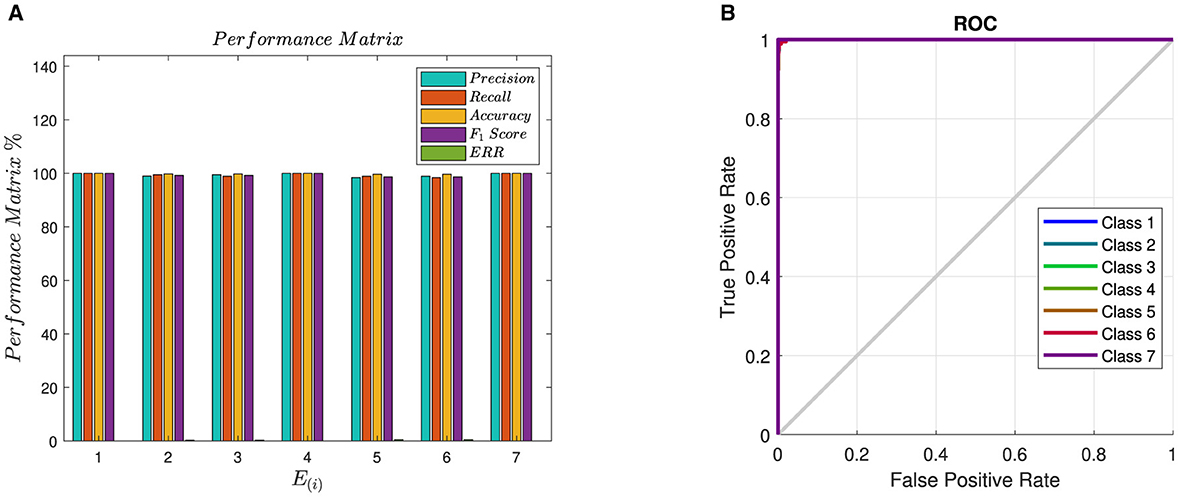
Figure 8. Bar graph and ROC of E(i) for the ECU classifier. (A) Bar graph of PM for ECU Classifier. (B) ROC of E(i).
From Table 2, it can be observed that the proposed method achieves very high accuracy for ECU classification. The high accuracy signifies that the distortion introduced in each ECU due to DAC imperfections and semiconductor impurities is unique, thus resulting in high accuracy for ECU identification. Moreover, it also validates our hypothesis that the distortion due to DAC and semi-conductor impurities has the potential for ECU fingerprinting for attack detection. It can also be observed from Table 2 that E(1), E(4), and E(7) have 100% detection rates, which is mainly associated with the high distortion values appearing in the form of high peaks as shown in Figure 4. Moreover, by analyzing Table 2 from the perspective of Figure 4, it can also be observed from T that if distortion is concentrated in a certain region, it increases the inter-class variability, which is one of the targets of this research.
Similarly, Table 3 shows that E(1), E(4) and E(7) have 100% precision, recall, accuracy and F1Score rates. Furthermore, E(2) has a 99.5% recall, which means it has only one false negative record; the other performance evaluation rate slightly drops. On the other hand, E(3) has 99.5% precision; it has only one false positive, therefore slightly affects the precision.
Figure 8A shows the graphical representation of the ECU identification results. A high correlation among the performance evaluation measures for all ECUs signifies the reliability of the proposed method. Furthermore, the area under the curve analysis of the ROC plots, as shown in Figure 8B, confirms our claim that unique distortions in the output of electronic devices can be used for fingerprinting and identification. This has many applications, ranging from hardware authentication to attack detection and localization.
3.6 Pin-level identification
The purpose of this experiment is to validate that different ECUs exhibit different distribution profiles, meaning that is, different pins of the same transmitting ECU introduce different artifacts into the transmitted signal. Pin-level fingerprinting can be utilized for reliable attack profile generation. To achieve this objective, six pins of the same transmitting ECU were used to transmit the same message over the same channel with the same environmental settings, such as temperature and environment. A six-class multilayered neural network classifier was trained and tested on the data collected using the data acquisition method described in Section 3. Shown in Table 4 is the performance of the proposed method in the confusion matrix (in terms of the number of samples per class).
Shown in Table 5 is the performance of the proposed method in terms of selected performance evaluation measures, including precision, recall, F1score, accuracy, and error rate. It can be observed from Tables 4, 5 that pins # 3 and 4 achieved perfect detection, with 100% precision, recall rate, accuracy, and F1score. Overall, the proposed method achieved an overall 96.7% detection rate for pin-level identification. Although detection rates for pin-level identification are slightly lower than ECU-level detection. The same results are graphically presented in Figure 9A. The area under the curve results, as presented in Figure 9B, show that the pin-level detection of the proposed approach is still satisfactory. It is important to highlight that the notion of pin-level detection is a novel concept; research efforts focused on finding why edge pins, e.g., pins 1, 2, 5, and 6, are expected to generate more interesting results.
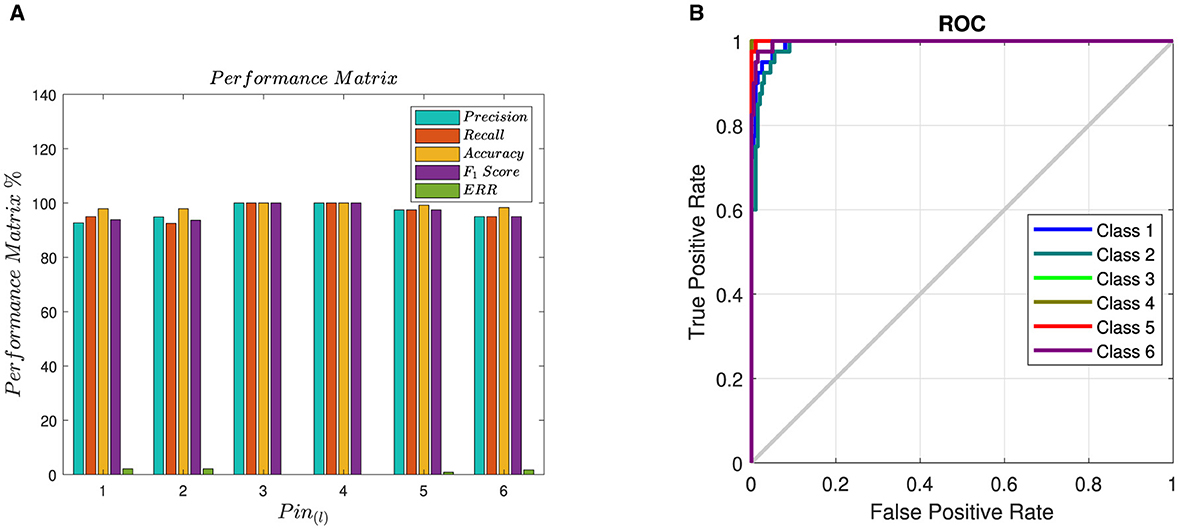
Figure 9. Bar graph of PM and ROC of pin classifier. (A) Bar graph of PM for pin classifier. (B) ROC of pin classifier.
3.7 Comparison against state-of-the-art
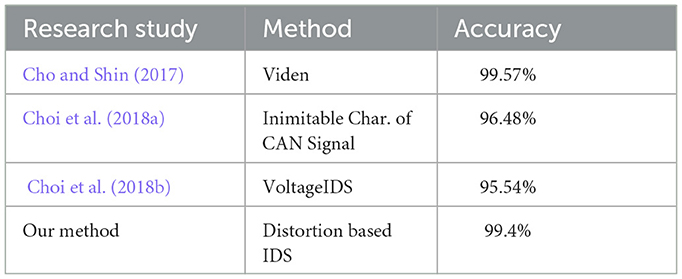
In this section, the proposed method is compared against state-of-the-art methods that are also doing the ECU identification. The performance is compared against ECU detection using Viden (Cho and Shin, 2017), Inimitable characteristics of CAN signal (Choi et al., 2018a), and VoltageIDS (Choi et al., 2018b).
3.7.1 Comparative studies
Cho and Shin (2017) proposed a method called Viden that utilized the voltage profile of acknowledgment (ACK) bits for transmitter identification. In the first phase, the ACK bit was used to determine if the message originated from the genuine transmitter. Afterward, voltage measurements were used to generate ECU fingerprints. Based on these fingerprints, the attacker ECU was identified. In Choi et al. (2018a), a monitoring unit was installed in the vehicle that analyzes the electrical CAN signals and computes the statistical features. These features were then classified to identify the ECU. In Choi et al. (2018b), ECU detection based on inimitable voltage characteristics technique was proposed. The feature vectors proposed by Choi et al. (2018a) were extended both in time- and frequency domains and were classified for ECU identification by Choi et al. (2018b).
3.7.2 Performance comparison
Table 6 shows the performance comparison of our method against (Cho and Shin, 2017; Choi et al., 2018a,b). The results show that our method is giving higher accuracy compared to Choi et al. (2018a,b), whereas it is giving almost the same performance as Cho and Shin (2017). However, the main advantage of our method is that feature extraction and message authentication can be done in any part of the signal without latency. Whereas, in the case of Viden, the voltage profile is estimated for message authentication during reception of the ACK bit, but it also introduces latency. Hence, from the aspect of latency, our method is more robust than the Viden.
4 Conclusion
In this research study, a novel approach for electronic control unit (ECU) identification in a vehicular network is presented. The main motivation behind ECU identification is that the CAN protocol lacks sender ECU information, which makes it prone to spoofing attacks. Our proposed device identification framework allows cybersecurity professionals to detect and localize transmitting devices even without transmitter information.
This study utilizes electronic device-specific distortion for device identification. The proposed approach utilizes unique but physically unclonable distortions in electronic device output stemming from the material's intrinsic imperfections and the manufacturing process. We have demonstrated that device-specific distortions are unique for all ECUs, even from the same make, model, and manufacturer. We have shown that device-specific distortions can be used to detect and localize devices on the network. We realized the proposed device identification framework using a 4-layered artificial neural network architecture. We have also demonstrated that the proposed framework can be used for device output-pin identification (e.g., device pin being used for message transmission).
For future study, we will investigate the robustness and reliability of the proposed framework under different environmental conditions, i.e., temperature, humidity, electromagnetic interference, sampling rate, etc. We also plan to evaluate its performance of the proposed system in real-time applications. In this regard, fuzzy logic-based decision modeling will be considered for the proposed ECU and pin identification framework under various environmental and data acquisition conditions.
Data availability statement
The raw data supporting the conclusions of this article will be made available by the authors, without undue reservation.
Author contributions
AH: Conceptualization, Data curation, Formal analysis, Investigation, Writing – original draft. HM: Conceptualization, Project administration, Supervision, Writing – review & editing. AI: Conceptualization, Validation, Writing – review & editing. MU: Supervision, Validation, Writing – review & editing. FN: Formal analysis, Writing – review & editing.
Funding
The author(s) declare financial support was received for the research, authorship, and/or publication of this article. This research work was supported by the National Science Foundation under the award # CNS-2035770.
Conflict of interest
The authors declare that the research was conducted in the absence of any commercial or financial relationships that could be construed as a potential conflict of interest.
Publisher's note
All claims expressed in this article are solely those of the authors and do not necessarily represent those of their affiliated organizations, or those of the publisher, the editors and the reviewers. Any product that may be evaluated in this article, or claim that may be made by its manufacturer, is not guaranteed or endorsed by the publisher.
References
Adnan, S., Irtaza, A., Aziz, S., Ullah, M.-O., Javed, A., and Mahmood, M. (2018). Fall detection through acoustic local ternary patterns. Appl. Acoust. 140, 296–300. doi: 10.1016/j.apacoust.2018.06.013
Agrawal, A., and Maiti, R. R. (2024). “Poster: itieprobe: Is iot device provisioning secure against mac layer authentication-token based replay attacks?,” in Proceedings of the 19th ACM Asia Conference on Computer and Communications Security (New York: ACM Digital Library), 1958–1960.
Ahmad, U., Han, M., and Mahmood, S. (2024). Enhancing security in connected and autonomous vehicles: a pairing approach and machine learning integration. Appl. Sci. 14:5648. doi: 10.3390/app14135648
Aloraini, F., Javed, A., and Rana, O. (2024). Adversarial attacks on intrusion detection systems in in-vehicle networks of connected and autonomous vehicles. Sensors 24:3848. doi: 10.3390/s24123848
Arif, S., Iqbal, J., and Munawar, S. (2012). “Design of embedded motion control system based on modified fuzzy logic controller for intelligent cruise controlled vehicles,” in 2012 International Conference of Robotics and Artificial Intelligence (Rawalpindi: IEEE), 19–25.
Arif, S., Munawar, S., Marie, R. R., and Shah, S. A. (2023). “Leveraging wavelets and deep cnn for sleep pattern recognition in road safety: An eeg study,” in International Conference on Recent Trends in Image Processing and Pattern Recognition (Cham: Springer), 227–241.
AUTOSAR (2017). AUTOSAR, Specification of Lin Interface. Available at: http://bit.ly/33EJDyk (accessed November 2023).
Avatefipour, O., Hafeez, A., Tayyab, M., and Malik, H. (2017). “Linking received packet to the transmitter through physical-fingerprinting of controller area network,” in IEEE Workshop on Information Forensics and Security (WIFS) (Rennes: IEEE), 1–6.
Baldini, G. (2023). In-vehicle network intrusion detection system using convolutional neural network and multi-scale histograms. Information 14:605. doi: 10.3390/info14110605
Bellaire, S., Bayer, M., Hafeez, A., Refat, R. U. D., and Malik, H. (2022). “Fingerprinting ecus to implement vehicular security for passenger safety using machine learning techniques,” in Proceedings of SAI Intelligent Systems Conference (cham: Springer), 16–32.
Cao, Z., Zhao, Z., Shang, W., Ai, S., and Shen, S. (2024). Using the ton-iot dataset to develop a new intrusion detection system for industrial iot devices. Multimedia Tools Appl. 2024, 1–29. doi: 10.1007/s11042-024-19695-7
Cho, K., and Shin, K. (2016). “Fingerprinting electronic control units for vehicle intrusion detection,” in USENIX Security Symposium (Berkeley, CA: USENIX), 911–927.
Cho, K., and Shin, K. (2017). “Viden: attacker identification on in-vehicle networks,” in Proceedings of the ACM SIGSAC Conf. on Computer and Communications Security (New York: ACM Digital Library), 1109–1123.
Choi, W., Jo, H., Woo, S., Chun, J., Park, J., and Lee, D. (2018a). Identifying ecus using inimitable characteristics of signals in controller area networks. IEEE Trans. Vehi. Technol. 67, 4757–4770. doi: 10.1109/TVT.2018.2810232
Choi, W., Joo, K., Jo, H., Park, M., and Lee, D. (2018b). Voltageids: Low-level communication characteristics for automotive intrusion detection system. IEEE Trans. Inform. Forens. Secur. 13, 2114–2129. doi: 10.1109/TIFS.2018.2812149
Deng, Z., Liu, J., Xun, Y., and Qin, J. (2023). Identifierids: A practical voltage-based intrusion detection system for real in-vehicle networks. IEEE Trans. Inform. Forens. Secur. 19, 661–676. doi: 10.1109/TIFS.2023.3327026
Doan, T., and Ganesan, S. (2017). “Can crypto fpga chip to secure data transmitted through can fd bus using aes-128 and sha-1 algorithms with a symmetric key,” in Technical report, SAE Technical Paper (Warrendale, PA: SAE International).
Elkhail, A. A., Refat, R. U. D., Habre, R., Hafeez, A., Bacha, A., and Malik, H. (2021). Vehicle security: a survey of security issues and vulnerabilities, malware attacks and defenses. IEEE Access 9, 162401–162437. doi: 10.1109/ACCESS.2021.3130495
Elsayed, M. A., and Zincir-Heywood, N. (2024). Boostsec: Adaptive attack detection for vehicular networks. J. Netw. Syst. Manage. 32:6. doi: 10.1007/s10922-023-09781-w
Fröschle, S., and Stühring, A. (2017). “Analyzing the capabilities of the can attacker,” in European Symposium on Research in Computer Security (Cham: Springer), 464–482.
Gierlichs, B., and Poschmann, A. (2016). Cryptographic Hardware and Embedded Systems-CHES 2016. Cham: Springer.
Godfrey, T., Eielsen, A., and Fleming, A. (2015). “Digital-to-analog converter considerations for achieving a dynamic range of 1 ppm in precision mechatronics systems,” in IEEE Conf. on Control Applications (CCA) (Sydney, NSW: IEEE), 786–791.
Greenberg, A. (2015). Hackers remotely kill a jeep on the highway-with me in it. Wired 7 :21. Available at: https://www.wired.com/2015/07/hackers-remotely-kill-jeep-highway/
Groza, B., and Murvay, P. (2018). Efficient intrusion detection with bloom filtering in controller area networks (can). IEEE Trans. Inform. Forens. Secur. 14, 1037–1051. doi: 10.1109/TIFS.2018.2869351
Gul, O. M., Kulhandjian, M., Kantarci, B., D'Amours, C., Touazi, A., and Ellement, C. (2023). On the impact of cdl and tdl augmentation for rf fingerprinting under impaired channels. arXiv [preprint] arXiv:2312.06555. doi: 10.13052/2794-7254.006
Hafeez, A. (2020). A Robust, Reliable and Deployable Framework for in-Vehicle Security. Ann Arbor, MI: University of Michigan.
Hafeez, A., Malik, H., Avatefipour, O., Rongali, P., and Zehra, S. (2017). “Comparative study of can-bus and flexray protocols for in-vehicle communication,” in Technical report, SAE Technical Paper (Warrendale, PA: SAE International).
Hafeez, A., Ponnapali, S. C., and Malik, H. (2020a). Exploiting channel distortion for transmitter identification for in-vehicle network security. SAE Int. J. Transp. Cybersecur. Privacy 3, 5–17. Available at: https://www.sae.org/publications/technical-papers/content/11-02-02-0005/
Hafeez, A., Rehman, K., and Malik, H. (2020b). “State of the art survey on comparison of physical fingerprinting-based intrusion detection techniques for in-vehicle security,” in Technical Report, SAE Technical Paper (Warrendale, PA: SAE International).
Hafeez, A., Tayyab, M., Zolo, C., and Awad, S. (2018). “Finger printing of engine control units by using frequency response for secure in-vehicle communication,” in 14th Int. Computer Engineering Conf. (ICENCO) (Cairo: IEEE), 79–83.
Hafeez, A., Topolovec, K., and Awad, S. (2019). “Ecu fingerprinting through parametric signal modeling and artificial neural networks for in-vehicle security against spoofing attacks,” in 2019 15th International Computer Engineering Conference (ICENCO) (Cairo: IEEE).
Hafeez, A., Topolovec, K., Zolo, C., and Sarwar, W. (2020c). “State of the art survey on comparison of can, flexray, lin protocol and simulation of lin protocol,” in Technical report, SAE Technical Paper (Warrendale, PA: SAE International).
Hazem, A., and Fahmy, H. (2012). “Lcap-a lightweight can authentication protocol for securing in-vehicle networks,” in 10th ESCAR Conf. Embedded Security in Cars, Berlin, Germany, Volume 6.
Hirst, D., and Espesser, R. (1993). Automatic Modelling of Fundamental Frequency Using a Quadratic Spline Function. Aix-en-Provence: Institut de Phonétique d'Aix.
Ibrahim, M., and Safa, N. S. (2023). Detecting message spoofing attacks on smart vehicles. Comp. Fraud Secur. 2023:12. doi: 10.12968/S1361-3723(23)70054-7
Jeong, S., Kim, H. K., Han, M. L., and Kwak, B. I. (2024). Aero: Automotive ethernet real-time observer for anomaly detection in in-vehicle networks. IEEE Trans. Indust. Inform. 20, 4651–4662. doi: 10.1109/TII.2023.3324949
Khalid, A., Mushtaq, Z., Arif, S., Zeb, K., Khan, M. A., and Bakshi, S. (2023). Control schemes for quadrotor UAV: taxonomy and survey. ACM Comp. Surv. 56, 1–32. doi: 10.1145/3617652
Kneib, M., and Huth, C. (2018). “Scission: Signal characteristic-based sender identification and intrusion detection in automotive networks,” in Proceedings of the ACM SIGSAC Conf. on Computer and Communications Security (New York: ACM Digital Library), 787–800.
Lee, H., Jeong, S., and Kim, H. (2017). “Otids: a novel intrusion detection system for in-vehicle network by using remote frame,” in 15th Annual Conf. on Privacy, Security and Trust (PST) (Calgary, AB: IEEE), 57-5709.
Lee, H., Lee, H., Jun, S., and Kim, H. K. (2024). Expanding the attack scenarios of sae j1939: A comprehensive analysis of established and novel vulnerabilities in transport protocol. arXiv [preprint] arXiv:2406.00810. Available at: https://arxiv.org/abs/2406.00810
Liu, J., Zhang, S., Sun, W., and Shi, Y. (2017). In-vehicle network attacks and countermeasures: Challenges and future directions. IEEE Netw. 31, 50–58. doi: 10.1109/MNET.2017.1600257
Liu, T., Jian, Y., Chong, T., Lu, X., Liu, P., and Jia, X. (2023). “Intrusion detection system in intelligent connected vehicles based on two-step algorithm,” in 3rd International Conference on Digital Economy and Computer Application (DECA 2023) (Amsterdam: Atlantis Press), 574–580.
Lorenz, S. (2010). “The flexray electrical physical layer evolution,” in Special Edition Hanser automotive FLEXRAY (Munich: Hanser Verlag), 14–16.
Marchetti, M., and Stabili, D. (2017). “Anomaly detection of can bus messages through analysis of id sequences,” in IEEE Intelligent Vehicles Symposium (IV) (Los Angeles, CA: IEEE), 1577–1583.
Marchetti, M., and Stabili, D. (2018). Read: Reverse engineering of automotive data frames. IEEE Trans. Inform. Forens. Secur. 14, 1083–1097. doi: 10.1109/TIFS.2018.2870826
Marchetti, M., Stabili, D., Guido, A., and Colajanni, M. (2016). “Evaluation of anomaly detection for in-vehicle networks through information-theoretic algorithms,” in IEEE 2nd Int. Forum on Research and Technologies for Society and Industry Leveraging a Better Tomorrow (RTSI) (Bologna: IEEE), 1–6.
Mohammadi, A., and Malik, H. (2022). “Vehicle lateral motion stability under wheel lockup attacks,” in the Fourth International Workshop on Automotive and Autonomous Vehicle Security (AutoSec@ NDSS'22) (Reston, VA: Internet Society (ISOC)).
Noori, F. M., Hafeez, A., Malik, H., Uddin, M. Z., and Torresen, J. (2023). “Source linking framework in vehicular networks for security of electric vehicles using machine learning,” in 2023 IEEE Vehicular Networking Conference (VNC) (Istanbul: IEEE), 207–214. doi: 10.1109/VNC57357.2023.10136272
Nürnberger, S., and Rossow, C. (2016). “Vatican-vetted, authenticated can bus,” in Int. Conf. on Cryptographic Hardware and Embedded Systems (Cham: Springer), 106–124.
Pal, K., Shakshuki, E., and Shakshuki, E. (2024). Supply chain transport management, use of electric vehicles, review of security and privacy for cyber-physical transportation ecosystem and related solutions. Procedia Comput. Sci. 238, 135–142. doi: 10.1016/j.procs.2024.06.008
Pavan, S., Schreier, R., and Temes, G. (2017). Understanding Delta-Sigma Data Converters. Hoboken, NJ: John Wiley & Sons.
Perrig, A., Canetti, R., Tygar, J., and Song, D. (2000). “Efficient authentication and signing of multicast streams over lossy channels,” in Proceeding IEEE Sym. on Security and Privacy (Berkeley, CA: IEEE), 56–73.
Pizzini, S. (2010). Towards solar grade silicon: Challenges and benefits for low cost photovoltaics. Solar Ener. Mater. Solar Cells 94, 1528–1533. doi: 10.1016/j.solmat.2010.01.016
Pizzini, S., Bigoni, L., Beghi, M., and Chemelli, C. (1986). On the effect of impurities on the photovoltaic behavior of solar grade silicon: Ii. influence of titanium, vanadium, chromium, iron, and zirconium on photovoltaic behavior of polycrystalline solar cells. J. Electrochem. Soc. 133:2363. doi: 10.1149/1.2108409
Refat, R. U. D., Elkhail, A. A., and Malik, H. (2022). “A lightweight intrusion detection system for can protocol using neighborhood similarity,” in 2022 7th International Conference on Data Science and Machine Learning Applications (CDMA) (Riyadh: IEEE), 121–126.
Rieke, R., Seidemann, M., Talla, E., Zelle, D., and Seeger, B. (2017). “Behavior analysis for safety and security in automotive systems,” in 25th Euromicro Int. Conf. on Parallel, Distributed and Network-based Processing (PDP) (St. Petersburg: IEEE), 381–385.
Sagong, S., Ying, X., Clark, A., Bushnell, L., and Poovendran, R. (2018a). “Cloaking the clock: emulating clock skew in controller area networks,” in Proc. of the 9th ACM/IEEE Int. Conf. on Cyber-Physical Systems (Porto: IEEE Press), 32–42.
Sagong, S., Ying, X., Poovendran, R., and Bushnell, L. (2018b). Exploring Attack Surfaces of Voltage-Based Intrusion Detection Systems in Controller Area Networks. Dortmund: ESCAR Europe.
Saini, R., and Islam, R. (2024). Reconfigurable can intrusion detection and response system. Electronics 13:2672. doi: 10.3390/electronics13132672
Singh, A., Abosaq, H. A., Arif, S., Mushtaq, Z., Irfan, M., Abbas, G., et al. (2024). Securing cloud-encrypted data: detecting ransomware-as-a-service (raas) attacks through deep learning ensemble. Comp. Mater. Continua 79:1. doi: 10.32604/cmc.2024.048036
Stabili, D., Marchetti, M., and Colajanni, M. (2017). “Detecting attacks to internal vehicle networks through hamming distance,” in Int. Annual Conf. AEIT (Cagliari: IEEE), 1–6.
Studnia, I., Nicomette, V., Alata, E., Deswarte, Y., Kaaniche, M., and Laarouchi, Y. (2013). “Survey on security threats and protection mechanisms in embedded automotive networks,” in 43rd Annual IEEE/IFIP Conf. on Dependable Systems and Networks Workshop (DSN-W) (Budapest: IEEE), 1–12.
Sugashima, T., Oka, D., and Vuillaume, C. (2016). Approaches for secure and efficient in-vehicle key management. SAE Int. J. Passenger Cars-Elect. Electr. Syst. 9, 100–106. doi: 10.4271/2016-01-0070
Tayyab, M., Hafeez, A., and Malik, H. (2018). “Spoofing attack on clock based intrusion detection system in controller area networks,” in Proc. Ground Vehicle Systems Engineering and Technology Symposium (Novi: GVSETS).
Tindell, K., Hanssmon, H., and Wellings, A. (1994). “Analysing real-time communications: Controller area network (can),” in RTSS (Princeton: Citeseer), 259–263.
Ueda, H., Kurachi, R., Takada, H., Mizutani, T., Inoue, M., and Horihata, S. (2015). Security authentication system for in-vehicle network. SEI Tech. Rev. 81, 5–9. Available at: https://global-sei.com/technology/tr/bn81/pdf/81-01.pdf
Upstream Security Global Automotive Cybersecurity Report (2019). Upstream Security Global Automotive Cybersecurity Report. Available at: http://bit.ly/2oTQtB0
Wang, Q., and Sawhney, S. (2014). “Vecure: A practical security framework to protect the can bus of vehicles,” in Int. Conf. on the Internet of Things (IOT) (Cambridge, MA: IEEE), 13–18.
Wang, X., Xu, Y., Xu, Y., Wang, Z., and Wu, Y. (2024). Intrusion detection system for in-vehicle can-fd bus id based on gan model. IEEE Access. 12, 2169–3536. doi: 10.1109/ACCESS.2024.3412933
Wolf, M., Weimerskirch, A., and Paar, C. (2004). “Security in automotive bus systems,” in Workshop on Embedded Security in Cars (International Association for Cryptologic Research (IACR)).
Wu, W., Huang, Y., Kurachi, R., Zeng, G., Xie, G., Li, R., et al. (2018). Sliding window optimized information entropy analysis method for intrusion detection on in-vehicle networks. IEEE Access 6, 45233–45245. doi: 10.1109/ACCESS.2018.2865169
Keywords: intrusion detection system, electronic control unit (ECU), controller area network (CAN), machine learning, artificial neural network (ANN), digital-to-analog converter (DAC), performance matrix (PM)
Citation: Hafeez A, Malik H, Irtaza A, Uddin MZ and Noori FM (2024) Enhancing ECU identification security in CAN networks using distortion modeling and neural networks. Front. Comput. Sci. 6:1392119. doi: 10.3389/fcomp.2024.1392119
Received: 27 February 2024; Accepted: 13 August 2024;
Published: 18 September 2024.
Edited by:
Stelvio Cimato, University of Milan, ItalyReviewed by:
Saad Arif, King Faisal University, Saudi ArabiaAmad Zafar, Sejong University, Republic of Korea
Copyright © 2024 Hafeez, Malik, Irtaza, Uddin and Noori. This is an open-access article distributed under the terms of the Creative Commons Attribution License (CC BY). The use, distribution or reproduction in other forums is permitted, provided the original author(s) and the copyright owner(s) are credited and that the original publication in this journal is cited, in accordance with accepted academic practice. No use, distribution or reproduction is permitted which does not comply with these terms.
*Correspondence: Farzan M. Noori, ZmFyemFubW5AaWZpLnVpby5ubw==
 Azeem Hafeez1
 Md Zia Uddin
 Farzan M. Noori