 Pilar Terron-Lopez
 María-José Terrón-López
 Guillermo Castilla-Cebrian
94% of researchers rate our articles as excellent or good
Learn more about the work of our research integrity team to safeguard the quality of each article we publish.
Find out more
ORIGINAL RESEARCH article
Front. Comput. Sci. , 03 July 2024
Sec. Human-Media Interaction
Volume 6 - 2024 | https://doi.org/10.3389/fcomp.2024.1378796
This article is part of the Research Topic Video Games for Impact: Design Projects That Can Change the Way We Think View all 3 articles
The potential impact of a video game is directly conditioned by its recognizability in the public conscience. But classifying video games in this manner can be a challenging endeavor. This paper emphasizes inconsistencies in recognition metrics and the absence of a unified system of classification. It approaches the problem through a twofold methodology involving a systematic literature review exploring existing classifications and genres, and an exploratory survey gathering data on spontaneously recognized video games in Spain. The study utilizes quantitative data to create three lists of video games—most played globally, most representative internationally, and most significant in the Spanish market. The findings reveal complexities in comparing video game data and underscore the importance of comprehensive research frameworks. The study contributes valuable insights into video game recognition dynamics among users, addresses the scarcity of comparative research in the gaming field, revealing the subjective impact of globally recognized video games and highlighting the possible relations between industry trends, spontaneous recognition, and consumer preferences.
Video games, which are the foremost and most popular form of entertainment in the 21st century, have exhibited consistent growth and enduring popularity. Over the last few decades, they have evolved significantly in complexity, pervasiveness, and overall significance. However, the categorization of these games encounters persistent challenges. It is important to consider that any classification of video games is inherently destined for obsolescence, as the rapid technological evolution of video games continually alters the criteria that must be taken into account. There are various categorizations of video game genres based on gameplay and mechanics, such as Herz’s (1997), which identifies the type of experience users can expect from a game. Herz initially identified different video game genre categories, which have since expanded alongside the industry’s evolution. While this categorization system serves to classify video game titles by genre, it may not encompass the spontaneous recognition of certain titles in users’ minds.
There are product classifications based on spontaneous recognition, particularly within marketing and consumer psychology. These classifications typically consider consumers’ familiarity with certain brands or products without external stimuli. In the branding and marketing industry, studies often categorize brands and products based on ‘Top of Mind Awareness’ (Hakala et al., 2012; Wardhana, 2022). Hugues (2010) conducted a study on the spontaneous recognition of video game brands in France and Ireland. His research shows that brands most recognized by users also tend to have the highest sales of video game titles. However, the study does not list which specific video games belong to these brands. Interestingly, there is a lack of prior research on the spontaneous recognition of video game titles without providing users with a list of previous games. This underscores the necessity of conducting studies such as the one proposed in this article.
As a result, it is found that the classification of the most renowned or widely recognized video games often faces inconsistencies because current indices are structured around rankings that hinder straightforward comparisons. Metrics such as video game usage, sales figures, and user-list rankings often diverge. Given the diverse nature of the origin of the data used to construct them, the outcome may present no overlap whatsoever.
The primary inconsistency in the pursuit of spontaneously recognized user-centric video game rankings is rooted in the variability of parameters across different datasets. It is observed that each dataset employs diverse metrics and criteria such as number of players, sales, downloads, and registrations. Currently, there’s no unified classification system based on consistent criteria. For instance, in analyses regarding player counts, a single list might include games measured by global downloads, daily players, and monthly players. The Sacnilk’s 2022 list compilation (Jangir, 2022) for example integrates games evaluated by global downloads, daily players, and monthly players.
Although certain systematic game rankings have been proposed (Qaffas, 2020; European Videogames Industry, 2021; Global Cloud Gaming Report, 2022; Clement, 2023b), there remains an insufficiency in scholarly inquiries evaluating subjective user recognition. This gap in research underscores the need for further investigation and scholarly exploration to comprehensively understand and codify the dynamics of user-centric video game rankings.
To analyze current rankings, it is essential to first understand the evolution of the video game industry and the dynamics of its players.
In 2021, the worldwide gaming community expanded significantly, reaching a 3 billion players globally. This surge was accompanied by the release of over 10,000 new games throughout the year, as reported by the Spanish Association of Video Game and Entertainment Software Producers and Developers Companies (Asociación Española de Empresas Productoras y Desarrolladoras de Videojuegos y Software de Entretenimiento (DEV), 2022) This data underscores the robust growth and pervasive influence of the gaming industry on a global scale.
Systematic reviews on the video game industry, such as the one conducted by Shliakhovchuk and Muñoz García (2020) highlight that it is an industry that is increasingly gaining importance in the world of business and entertainment. The article underscores the global trend of studying the impact of video games on players across a wide range of topics. However, their research lacks any reference to which titles are those that spontaneously appear to users.
Focusing specifically on Spain, the gaming landscape is that there are more than 18 million people actively participating in video game activities. In particular, this participation is distributed relatively evenly between genders, since 52% of participants identify as men, while 48% as women, according to data from the AEVI 2022 Yearbook (Maroto et al., 2022). Furthermore, the commitment to video games in Spain is substantial, with an average of more than 7 h per week dedicated to playing them. This statistic sheds light on the important role of video games in the leisure and entertainment options of the Spanish population.
The prevalence of an extensive array of titles within the market signifies a saturation, emphasizing the wealth and diversity of gaming options accessible to consumers. However, navigating this abundance becomes challenging due to the absence of a ranking system that systematically evaluates these options based on user recognition.
This gives rise to our research question: which video games do users spontaneously recognize?
This inquiry underscores the need to delve into the subjective realm of user acknowledgment, thereby addressing a gap in the current understanding of video game rankings focused on user recognition criteria.
The proposed research hypothesis posits that users spontaneously recognize specific video games, implying the existence of a level of notoriety or popularity inherent to certain titles that surpasses objective classification criteria.
To test the initial hypothesis, exploratory searches have been conducted across diverse specialized media, considering categorizations based on records, sales, and user counts. The aim is to discern the intricacies and potential disparities among these criteria and shed light on the complexities of accurately categorizing video games in light of their popularity and recognition. This data encompasses statistics derived from platforms, shedding light on discrepancies within user populations. It includes data on registrations, sales, and user numbers across different gaming platforms.
Therefore, the main objective of this paper is to comprehensively explore and identify the video games that Spanish users spontaneously recognize.
As the aim is to fill a critical gap in the current understanding of video game rankings by focusing on user recognition criteria within the subjective realm, this paper we will first conduct a literature review analyze existing video game rankings and classifications, evaluating the extent to which they incorporate user recognition criteria. Second will gather data on subjective recognition of video game users in Spain through a questionnaire. Finally, we will propose a framework for a more user-centric video game ranking system that considers subjective elements of user acknowledgment, offering insights for the development of future classification models.
In this way, it is intended to contribute valuable insights into the dynamic interplay between user recognition and video game rankings, ultimately advancing our understanding of the subjective criteria influencing consumer preferences in the gaming industry.
Due to the absence of substantial existing literature addressing our research objectives, a twofold methodology was employed. Initially, a comprehensive systematic literature review was conducted to discern relevant insights. Subsequently, an exploratory survey was conducted to extract pertinent and crucial information for the research. This survey allows the relationship between surveyed users and the spontaneous recognition of video game titles to be comprehended. The questionnaire aimed to illuminate the landscape of video games, specifically focusing on those spontaneously recognized by users. This dual approach ensured a comprehensive exploration of our research objectives and provided a foundation for a thorough understanding of user perceptions and preferences within the gaming landscape. With data gathered from the literature review and the exploratory questionnaire, a triangulation of data is conducted to compile a list of specific video games. This approach allows for the evaluation of the video games that have the most significant impact on the user.
The intersection between video game usage, sales performance, and user-list rankings has become a focal point in the research about the impact of video games. However, given the lack of existing literature reviews with common criteria that address the relationship between users and the video games they spontaneously recognize, in this section it is intended to provide researchers with a comprehensive understanding of the intricate dynamics between users and video games, particularly those that users instinctively recognize.
Existing videogame classifications primarily center around their creation budget, distinguishing between smaller budgets and studios referred to as independent or “indie,” and larger budgets and studios known as “Triple-A.” Alternatively, classifications are based on genres, with action and puzzle games emerging as the most popular (Pallavicini et al., 2018).
Classifying video game genres offers a structured approach to discerning similarities among different forms of interactive entertainment. While there’s no universally accepted standard system for classification, Kirriemuir and McFarlane (2004) support Herz’s (1997) approach, akin to the industry’s categorization. Herz delineates games into categories like action (requiring quick reactions, such as shooters and platform games), adventure (involving puzzle-solving in virtual environments), fighting, puzzles (e.g., Tetris), role-playing, simulation, sports, and strategy. However, the industry has evolved since Herz’s classification, introducing new devices and technologies that influence gameplay.
DeMaria (2007) identifies a range of video game genres based on arcade gameplay, including shooters, third-person adventures, one-on-one fighting, strategy games, RPGs, adventures, simulators, sports, god games, massively multiplayer worlds (MMORPGs), casual games, and mobile games. Notably, he singles out mobile games as a distinct category, considering the device’s role as a distinguishing factor in genre classification.
Subsequent classifications, such as the one conducted by Hernandez-Perez (2015), return to broader categorizations, enabling the classification of video games regardless of the platform. Hernández-Pérez’s analysis results in categories like action, adventure, simulation, sports, driving, strategy, role-playing, shooter, arcade, and casual games. This classification aligns more closely with Herz’s original categorization. Observations indicate that the six genres associated with the best-rated games include adventure, RPG, shooter, platforms, puzzle, and strategy. However, it is noteworthy that in this study, a list of the most successful video games is provided without specifying the criteria by which success is defined (Qaffas, 2020).
To achieve this, we will conduct an extensive literature review, scrutinizing previous research and scholarly works to identify gaps and trends in the current discourse. Our review will focus on the incorporation of user spontaneously recognize criteria within existing video game rankings and classifications. This process will not only establish a foundation for our study but will also offer insights into the evolution of user-centric considerations in the gaming industry.
This analysis will offer valuable insights into the factors that contribute to a game’s recognition among users, bridging the gap between quantitative measures such as sales figures and the qualitative aspect of user preferences. Consequently, we conducted a bibliographic review to establish valid deductions and compare obtained data. This research methodology was aligned with digital ethnography, emphasizing systematic data collection.
Following the framework proposed by Gómez-Luna et al. (2014), our bibliographic review adhered to a three-phase study methodology. The first phase involved defining the specific problem, focusing on conducting subsequent bibliographic searches tailored to address the research need—in our case, identifying video games recognized by users spontaneously.
In the second phase, we gathered information through structured bibliographic searches, encompassing reports, rigorously scientific books, and journals. These searches spanned indexed databases and specialized websites in the video game domain (Shiro Uemura, 2020; Asociación Española del Videojuego, 2022; Activeplayer, 2023; Chaundy, 2023; Clement, 2023a).
The final phase involved organizing and analyzing information by structuring findings into tables for clarity and conducting critical analysis to draw conclusions and cross-reference information.
This discrepancy becomes apparent in studies examining how intrinsic and extrinsic quality indicators impact sales in digital video games (Choi et al., 2018). During the data collection process, researchers often face challenges due to inconsistencies in the information provided by platforms like Steam.
Various information sources from 2020 were analyzed to compile a list of video games. This list is presented in Table 1 which showcases the ‘Most played games Ranked by Average Monthly Players’ where the third column indicates the sources from which the data were extracted.
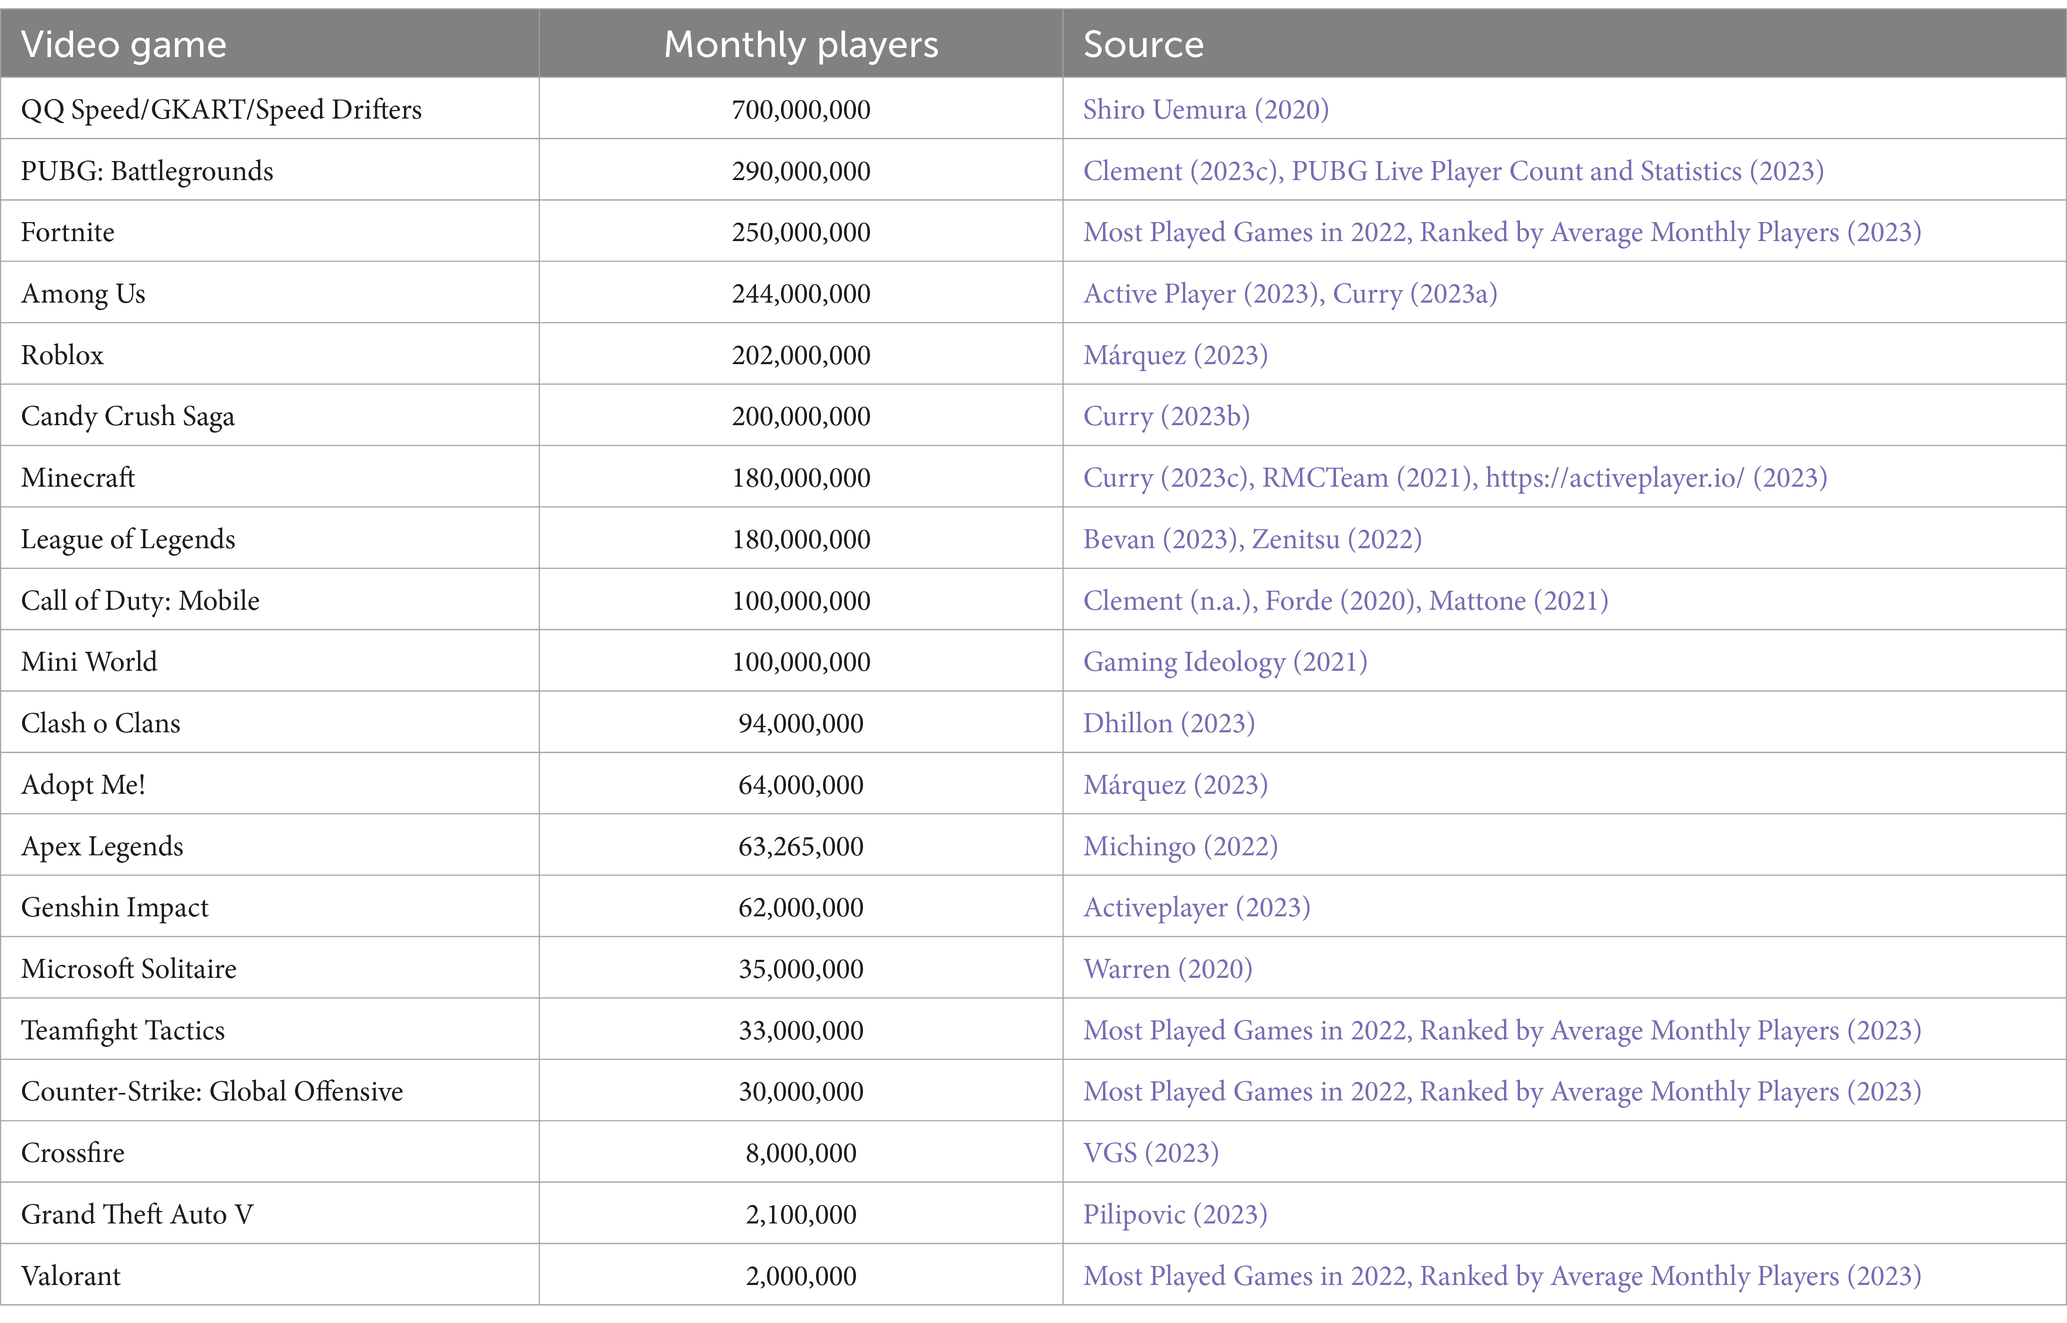
Table 1. Most played video games Ranked by Average Monthly Players.
During the analysis process that gave rise to Table 1, it became evident that each of these sources adheres to distinct criteria for gathering information. Authors employ different methods, including sales figures, platforms, registrations, downloads, simultaneous connections, among others, to determine player numbers. To ensure analytical consistency, we deliberately sought a transversal criterion that could accommodate the diversity in data extraction methodologies. Considering that, according to the report presented by the Spanish Association of Video Game and Entertainment Software Producers and Developers Companies, there are currently 3 billion players globally, the discriminative threshold in Table 1 was set at the 2 million user mark, resulting in a total of 24 specific video game titles.
For comparative purposes with an internationally recognized expert-reviewed study, we conducted an analysis of the report developed by ‘The Strong National Museum of New York’ (National Museum of Play, 2023). The institution was contacted to elucidate their work methodology and variables considered during report preparation. Based on the criteria previously defined by the Museum, a list of video games with international impact was generated from the obtained data.
To grasp the significance of this study, it’s essential to understand the concept of spontaneous recognition. In “Joystick Nation: How Videogames Ate Our Quarters, Won Our Hearts, and Rewired Our Minds” (Herz, 1997), spontaneous recognition is defined as an individual’s ability to identify something without external cues. In the context of video games, it refers to a player’s ability to name a specific game without additional visual or auditory prompts. Herz primarily focuses on analyzing the cultural and psychological impact of video games, exploring how they have integrated into popular culture and transformed interactive entertainment.
While Herz mentions various types and genres of games, his main objective is not to provide a comprehensive classification but to examine the evolution of video games. Our research, however, aims to compile a detailed list of video games recognized spontaneously by users.
In the realm of brands and marketing, studies on spontaneous recognition often use terms like “Top of Mind” and “Brand Awareness,” sometimes referred to as “Top of Mind Awareness” (from now on, TOMA). Kumar Padhy and Sawlikar (2018) relate spontaneous brand recognition to users’ purchase intentions, showing a clear link between frequently recognized brands and top-selling products. Gupta et al. (2023) conclude that brand recognition, marketing strategy, and brand loyalty significantly impact sales in the electronic products market.
“The Structure of Videogame Preference” (Klevjer and Hovden, 2017) determines the types of video games users prefer by identifying seven clusters of players: Strategists, Roleplayers, Partygamers, Nintendos, Casuals, Lads, and Esporters. Based on a study of 557 users, the most favored titles include: The Sims, Civilization, Angry Birds, Super Mario, The Legend of Zelda, Guitar Hero, Buzz, Singstar, FIFA, GTA (Grand Theft Auto), Call of Duty, Football Manager, World of Warcraft, Starcraft, Counter Strike, League of Legends, DotA (Defense of the Ancients), Half-Life, and Gran Turismo.
To gather information on video games spontaneously recognized by users, an exploratory survey was conducted following the methodology outlined by Romo (1998). Exploratory surveys are considered a crucial tool for studying human behavior and are quintessential representatives of social analysis techniques. The survey design underwent multiple iterations by the research team to effectively address the study’s objectives, specifically aimed at exploring video games spontaneously recognized by Spanish users. The methodology involved a user-centric design approach to incorporate insights gathered from potential participants during the initial phase to ensure effectiveness.
An online form, created with Google Forms, was employed for efficient data collection. This form not only facilitated the collection process but also ensured compatibility for result comparison with other studies, thereby enhancing the reliability and validity of the findings. The questionnaire, formulated in Spanish, was distributed through social media channels to recruit individuals from various demographic groups. This approach aimed to acquire unbiased and valuable data by ensuring diverse representation in the study.
The questionnaire, with a total of 15 questions, was divided into two sections:
1. The first section aimed to establish the sociodemographic profile of the surveyed sample, involving four multiple-choice closed-response questions and comprised six multiple-choice closed-response questions. These questions inquired about the respondents’ email address, age, gender, educational level, number of days per week spent playing video games, and the location from which they accessed the survey.
2. The second section consisted of 10 specific inquiries regarding the study object. Within this section, respondents encountered nine semi-open response questions. Each respondent was requested to designate their response using the title of a video game, ensuring a quantitative framework despite the open-ended nature of the questions. It is important to highlight that one question within this section addressed characters in video games, a topic deemed non-pertinent to the study and therefore excluded from the analysis.
The questions asked were:
1. Video game to which you have spent the most time (mobile or tablet).
2. Video game you have spent the most time playing (PC or console).
3. Video game from your childhood.
4. Favorite video game.
5. Last Video Game played.
6. Video game that you liked the most because of its graphics.
7. Video game that you liked the most because of its narrative.
8. Favorite platform video game.
9. Favorite open world video game.
The selection of these survey questions is grounded in the aim to comprehensively capture participants’ experiences and preferences, leading to a more representative understanding of spontaneously recognized video games. Each question is designed to elicit specific information about different aspects of the participants’ gaming experiences, contributing to a holistic view. The insights behind specific questions would be as follows:
• Video game to which you have spent the most time (mobile or tablet): This question helps identify the game that has garnered the most investment of time from the participant, providing insights into long-term engagement and preferences in the mobile or tablet gaming domain.
• Video game you have spent the most time playing (PC or console): Similar to the first question, this addresses the participant’s extensive engagement but focuses on PC or console gaming, providing a well-rounded understanding of the participant’s gaming habits across different platforms.
• Video game from your childhood: Childhood is the moment when personal tastes develop. This question taps into nostalgic elements, revealing games that have left a lasting impression on participants and potentially influencing their current gaming preferences.
• Favorite video game: Participants are asked to identify their overall favorite game, providing a direct measure of personal preference, and allowing for the identification of titles that hold significant importance to the individual.
• Last Video Game played: Recent gaming experiences are captured, offering insights into the participant’s current preferences and activities. This complements the historical data obtained from childhood memories and favorite games.
• Video game that you liked the most because of its graphics: Focusing on visual appeal, this question explores the importance of graphics in game enjoyment. It provides information on the significance of aesthetic elements in game design for the participant.
• Video game that you liked the most because of its narrative: Narratives contribute significantly to the immersive experience in gaming. This question assesses the impact of storytelling in games, uncovering titles where narrative elements are particularly valued.
• Favorite platform video game: This question explores participants’ preferences within the platform game genre. Platform games often involve navigating characters through various levels, focusing on precision and timing. By identifying participants’ favorite platform games, we gain insights into their specific interests within this genre, shedding light on the appeal of gameplay mechanics and level design unique to platformers.
• Favorite open world video game: Open-world games provide unique gaming experiences. By identifying participants’ favorite open-world titles, this question taps into the appeal of expansive, non-linear gameplay and emergent narratives.
The first two questions were created to establish a timeframe for participants’ gaming habits, as available industry statistics often rank games based on play times.
Questions three, four, and five aim to capture a broad temporal spectrum of each survey participant’s preferences. By inquiring about initial, overall, and current preferences, we mitigate bias stemming from current tastes or prevailing trends, thus obtaining a more comprehensive understanding of respondents’ subjective preferences.
Questions six and seven are designed to isolate aesthetic preferences, focusing solely on the visual appeal or narrative of a game rather than the overall experience.
Question eight and nine aim to identify genre preferences among respondents. Platform games as a genre were the dominant genre during the late 1980s and early 1990s. This era is often referred to as the “golden age” of platformer games. During this time, iconic platformer titles such as Super Mario Bros., Sonic the Hedgehog, and Mega Man gained widespread popularity and became synonymous with the video game industry. Open-world games are highlighted due to their current popularity. Notably, in the last decade, except for the first-person shooter Overwatch (2016), the winners of The Game Awards’ Game of the Year award have consistently been open-world games: Baldur’s Gate 3 (2023), Elden Ring (2022), It Takes Two (2021), The Last of Us Part II (2020), Sekiro: Shadows Die Twice (2019), God of War (2018), The Legend of Zelda: Breath of the Wild (2017), The Witcher 3: Wild Hunt (2015), and Dragon Age: Inquisition (2014).
Overall, the methodological framework employed in this research, characterized by a well-structured questionnaire and diverse participant recruitment, contributes to a thorough exploration and identification of spontaneously recognized video games within the Spanish user community.
Lastly, a cross-sectional analysis was conducted to examine overlaps with previous analyses, aiming to compile a list of video games reflecting user visual culture.
The quantitative data extracted from the literature review and the survey facilitated the formulation of three lists comprising the most played video games and those that are more representative internationally. These lists were derived from the information obtained through the literature review. Additionally, a separate list was compiled, focusing on games that hold greater significance in the Spanish market, using data gathered from the survey.
During data collection, multiple rankings or lists of video games were found, but no academic articles focused on the user’s visual culture were discovered. Wolf (2012) compiles and organizes various video games while explaining theoretical and historical content covering different platforms and technologies, but these titles lack scientific rigor.
Several lists comparing video games within the same platform were identified, potentially leading to biased results. Additionally, lists providing data on best-selling video games, most downloaded titles, or based on the number of registered users were observed. However, these datasets differentiate video games based on monetization types (Clement, 2023a) Haga clic o pulse aquí para escribir texto.
Following an analysis of diverse information sources, a comprehensive list was developed, encompassing varied data to enable comparison among different video games using common criteria. Despite each video game having a distinct business model and platform, the data does not consistently correlate.
The player count for a specific game is generally available when the game involves online registration. Companies often publicize these figures to highlight the popularity of their product and attract more clients. However, not all games require mandatory registration, and player counts presented by companies are not a homogeneous metric. These counts can include total registered users (not necessarily reflecting current users and strongly correlated with the amount of time the game has been available), the maximum number of active accounts (with varying definitions across companies), and similar figures, making this metric unreliable. Additionally, comparing video games based on sales figures poses challenges due to the prevalence of the ‘free-to-play’ business model, which does not rely on traditional sales metrics.
Monthly player count emerged as recurring data for all video games, irrespective of monetization or platform. This criterion aligns with the approach used by the consulting firm Newzoo in its reports (Newzoo Global Games Market Report 2022, 2023) Haga clic o pulse aquí para escribir texto. Consequently, a list categorized by the number of monthly players across various types and platforms of video games was generated.
From this list, a subset of 20 video games was selected for analysis based on a monthly player count greater than 1 million, as illustrated in Table 1. The game with the highest count on the list (QQ Speed/GKART/Speed Drifters) boasts over 700 million players, while the least played registers 2 million monthly players, averaging around 143 million players. If the number of players from these 20 games is added up, it reaches 95% of global gamers. It is important to note that some users may play more than one of the 20 video games listed.
A further breakdown of these numbers is depicted in Figure 1, where the 20 games mentioned earlier are organized into brackets of 100 million users, considering their monthly user bases. The 10 lowest ranked games on the list, i.e., 50% of the games, have less than 100 million monthly users, 45% fall within the user base range of 100–300 million monthly users, and only one instance has a user base of 700 million monthly users.
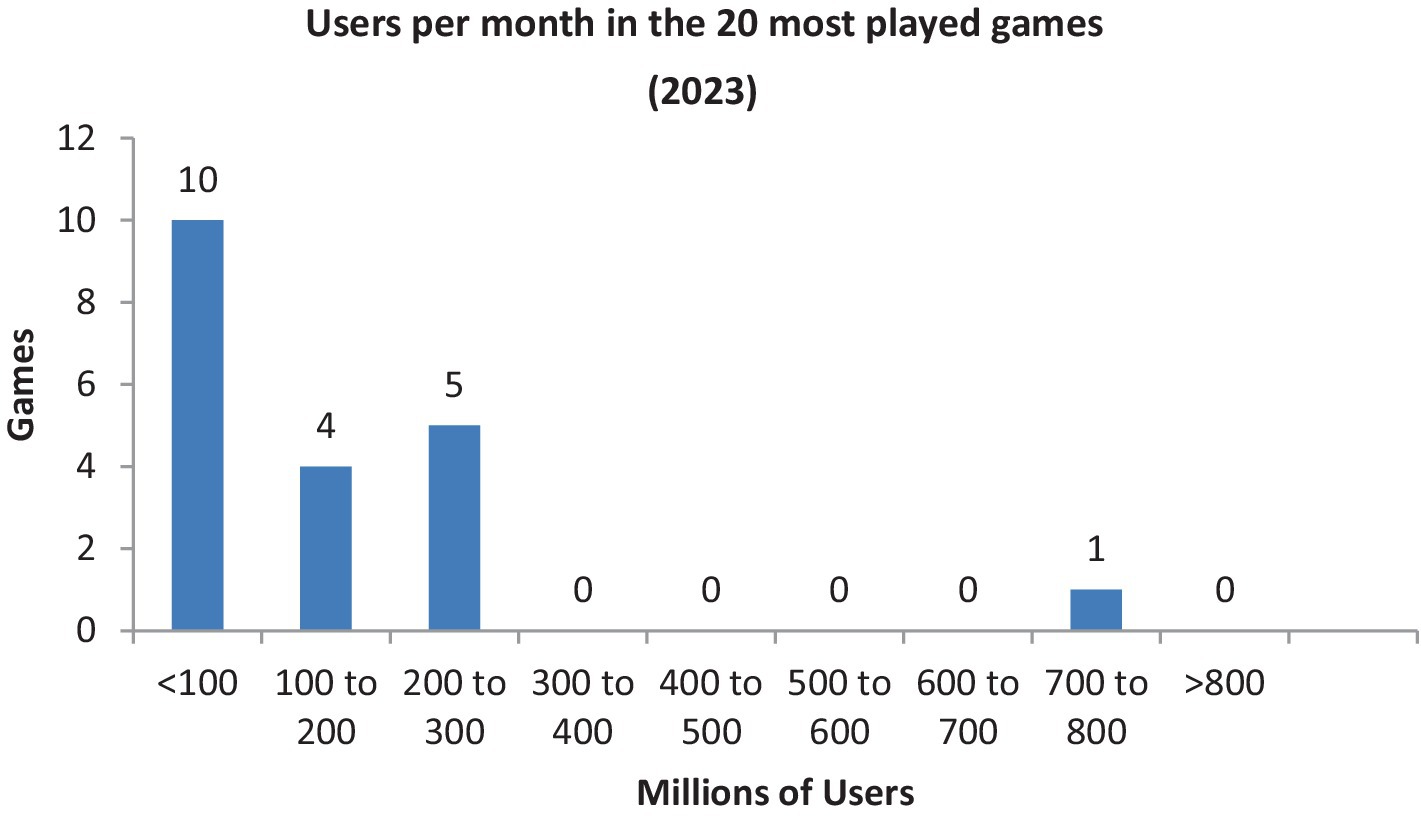
Figure 1. Users per month in the 20 most played video games (2023).
It should be noted that this dataset is derived from user bases openly published by companies, studios, or the press. There is a likelihood that there are games meeting the criteria for inclusion in the list but have not disclosed their user bases in a manner that allows for comparison with those included.
From a purely analytical standpoint, the data shows a high level of dispersion, as measured by the standard deviation of 159 million, signifying substantial variability in observed values around the mean. This dispersion is visually apparent in Figure 1, revealing notable positive skewness. The kurtosis value of 7.7 suggests a leptokurtic distribution, indicating heavier tails compared to a normal distribution. This is further supported by a skewness coefficient of 2.4, indicating a lateral bias due to extremely high values in the distribution. While this data analysis yields a list of current video games, it does not account for games from previous eras that might contribute to an individual’s visual culture.
Since 2015, ‘The Strong National Museum of New York’ established ‘The World Video Game Hall of Fame’ (National Museum of Play, 2023) to curate a list of the most iconic and influential video games across various eras and platforms, recognized by people worldwide. This initiative aims to identify the most significant games in the history of gaming.
The museum houses an extensive collection of over 55,000 video games and related artifacts, documenting the evolution of gaming. From numerous nominations, an internal team of video game experts and curators selects 12 finalists annually based on specific criteria, including the definition of each criterion provided alongside:
• Iconic Status: Widely recognized and remembered.
• Longevity: Enduring popularity over time.
• Global Impact: Recognition beyond international borders.
• Influence: Contribution to game design, development, other forms of entertainment, popular culture, or society.
The selection process of the finalists involves several stages:
• The museum compiles a list of a dozen nominees meeting the criteria, representing diverse eras, platforms, and gaming styles, incorporating both past nominees and new entries.
• Confidentially, the 12 nominees are shared with a global selection advisory committee comprising 30 academics and journalists familiar with these games. Each member votes for their top three choices, with a point system (five for first, three for second, one for third). Additionally, public votes carry equal weight as committee votes.
• Final evaluation determines the games entering ‘The World Video Game Hall of Fame’ and justifies the inclusion or withdrawal of previous year’s titles.
For a better understanding of the data obtained by the museum, Table 2 has been created, encompassing all the finalist video game titles based on the provided selection criteria. The aim of Table 2 is to facilitate the analysis of video games with the greatest impact. It outlines the finalist video games from 2015 to 2023 revealing recurring titles over the years. As observed, in 2015 and 2016, 15 titles are listed, which then reduced to 12 from the year 2017 onwards. In this compilation, games like FIFA or Age of Empires, regardless of multiple editions, are grouped under a single title. However, Call of Duty 4 is specified due to significant gameplay changes.
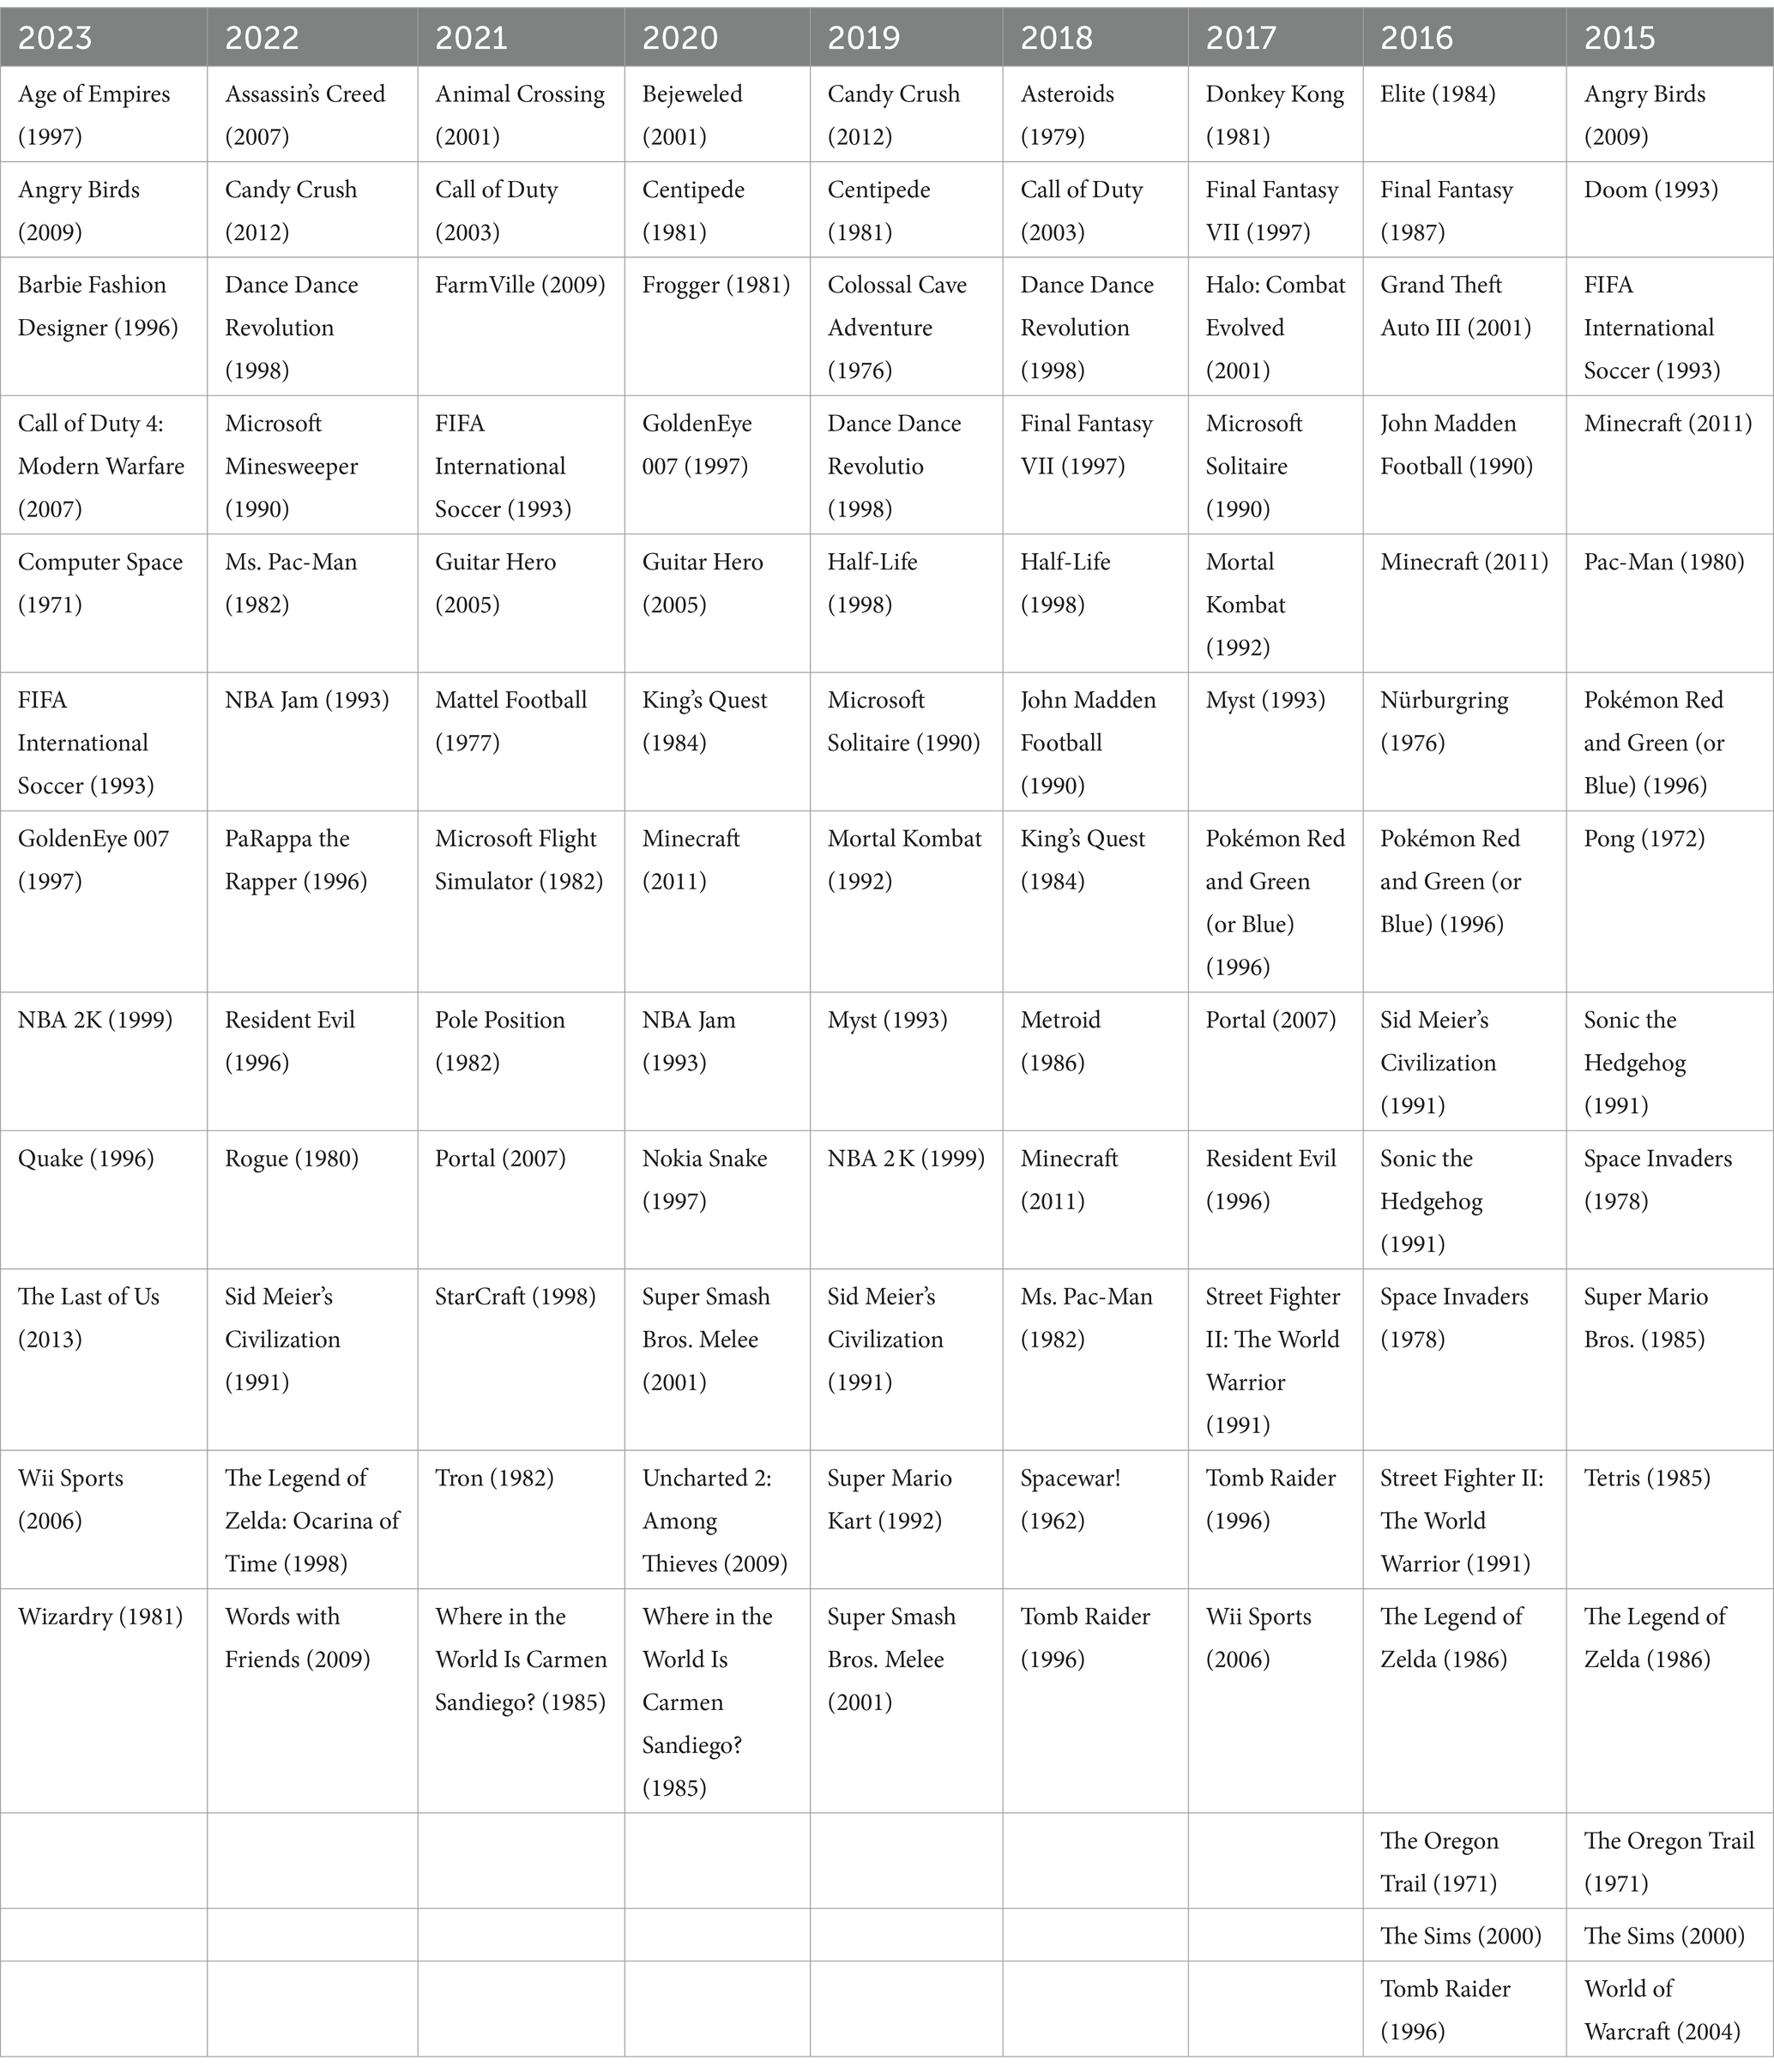
Table 2. Finalist video games from 2015 to 2023 “The World Video Game Hall of Fame.”
During the indicated period, 74 video game titles became finalists. For a better understanding of Table 2, Figure 2 has been generated, illustrating the video games with the greatest impact on users. It is observed that Minecraft (2011) appears 44% of the time, while Dance Dance Revolution (1998), FIFA International Soccer (1993), Sid Meier’s Civilization (1991), and Tomb Raider (1996) appear 33% of the time, indicating that Minecraft is the most frequently recognized game. Other titles appear 22% (27) and 11% (42) respectively.
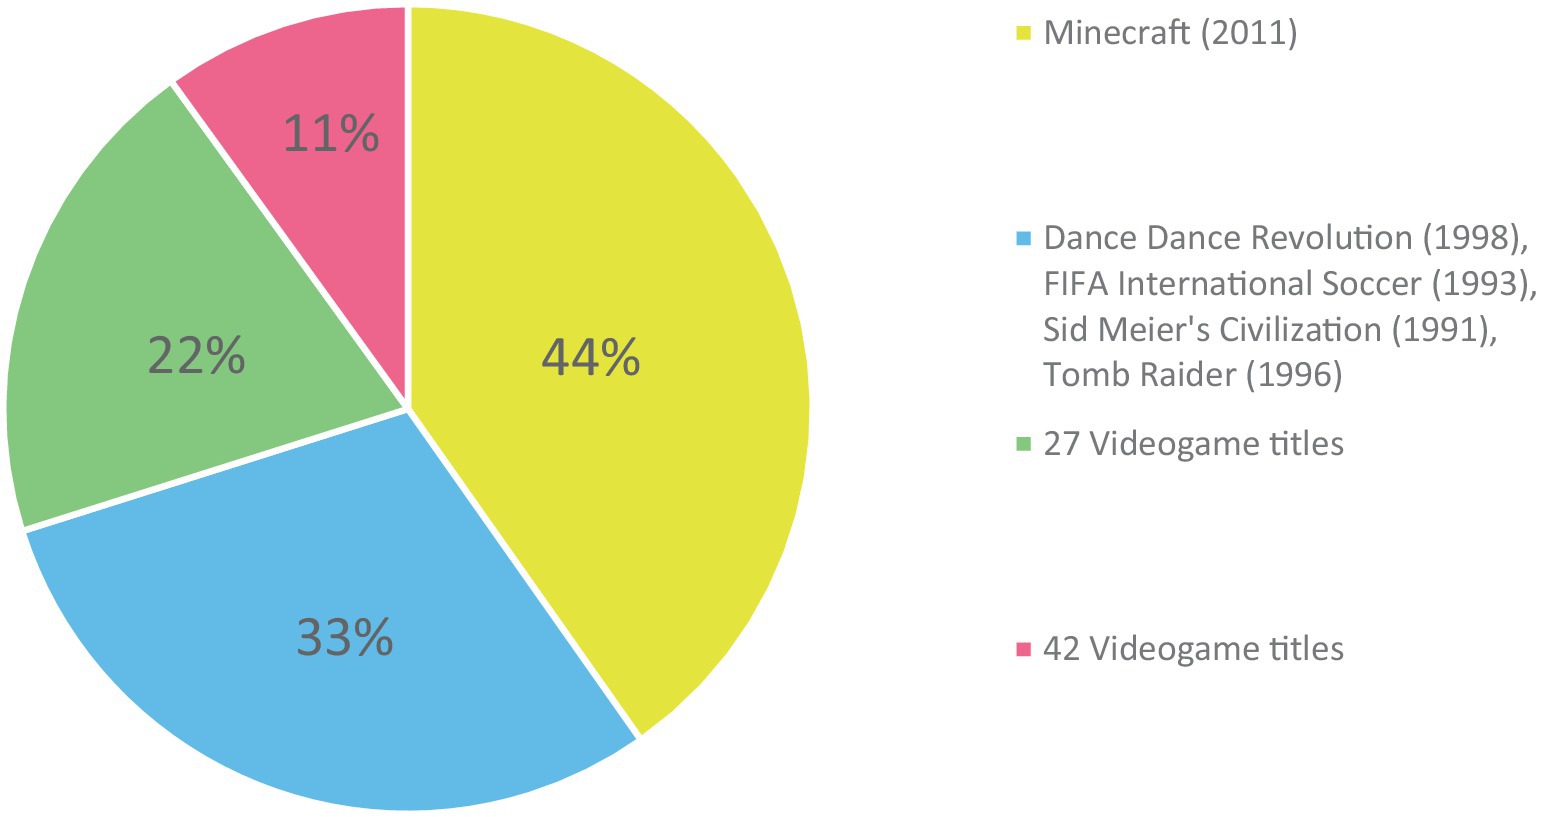
Figure 2. Percentage of times video games appear.
Taking these data into account, a survey was conducted in Spain among various age groups to discern which video games obtain spontaneous recognition. The survey consisted of open-ended questions covering various platforms and genres, with the aim of identifying the most significant video game titles for users, regardless of the era.
The demographic data, obtained from the first section of the survey, revealed that after distributing the survey through social media, the study sample comprised a diverse group of 330 individuals aged 12–61 of both genders. This group ranged from Middle School to doctoral studies and reported currently playing video games from 0 to 7 days a week.
Most respondents identified as masculine, comprising 61% of the total sample, followed by feminine respondents, accounting for 37%. A small proportion of respondents chose not to disclose their gender, representing only 2% of the total sample.
Respondents have varying levels of education, with the majority holding a Vocational Training or University Degree. Specifically, Vocational Training and University Degree holders each constitute 18 and 24% of the total sample, respectively. Other education levels, such as Middle School, High School, Postgraduate, Master, and Doctorate, are also represented in the survey results, albeit with smaller proportions.
Respondents can be categorized into four age groups: Teen (12–17 years old), Young Adult (18–25 years old), Adult (26–50 years old), and Senior (more than 50 years old). The data shows that the majority of respondents fall into the Young Adult and Adult categories, comprising 42 and 44% of the total sample, respectively. Teen respondents represent 7% of the sample, while Senior respondents constitute 8%.
Gender against frequency of play: Cross-analyzing the data on genders and gaming frequency reveals that among masculine respondents, approximately 45% report low gaming frequency (0–2 days a week), 47% report medium frequency (3–5 days a week), and 7% report high frequency (6–7 days a week). In comparison, feminine respondents demonstrate different distribution patterns, with approximately 48% reporting low frequency, 33% reporting medium frequency, and 19% reporting high frequency. The category representing individuals who decided not to state their gender shows minimal representation across all gaming frequency levels.
Upon examining the data, it becomes apparent that masculine respondents tend to engage in gaming activities more frequently compared to feminine respondents, particularly in the high frequency category. Conversely, feminine respondents are more prevalent in the low frequency category, indicating relatively lower engagement with video games.
Gender against age: When the cross-analysis is applied to genders against age groups, it can be observed that among masculine respondents, the majority fall into the young adult category, constituting approximately 57% of the total, followed by the adult category with approximately 38%. Teen respondents make up a smaller proportion, accounting for around 4%, while Senior respondents represent a minimal percentage. Conversely, feminine respondents demonstrate a different distribution, with approximately 53% falling into the young adult category, 44% into the adult category, and a smaller proportion in the Teen category. The category representing individuals who decided not to state their gender exhibits minimal representation across all age ranks.
Upon examination, it’s evident that both Masculine and Feminine respondents are predominantly concentrated in the young adult and adult age groups. However, there are slight variations in the distribution between the two gender groups within each age rank. Notably, there is a relatively higher proportion of Masculine respondents in the young adult category compared to Feminine respondents, while Feminine respondents show a slightly higher representation in the adult category.
These participants were then directed to the second section of the survey, where they were required to respond to nine semi-open-ended questions with the objective of specifying a particular video game title.
From the nine semi-open-ended questions specifically related to video game titles based on user’s spontaneous subjective recognition, the survey yielded a total of 475 unique video game titles were identified. When more than one title was provided, the first title provided was selected across nine specific questions related to various gaming aspects.
During data filtering, ambiguous data relating to some video game titles in the same series were standardized under a common title because they shared recognizable aspects across the saga. If any of the respondents gave more than one title, only the first one was taken into consideration. In the case of acronyms, as in the case of titles such as GTA, the commercial title Grand Theft Auto was unified.
Further analysis filtered titles that appeared more than 20 times in the defined questions, excluding question 4 (favorite video game), which was limited to 10 due to sample dispersion. This process resulted, as detailed in Table 3, in the identification of 24 distinct titles:
1. Super Mario Bros
2. Call of Duty
3. Grand Theft Auto
4. Pokémon
5. FIFA
6. The Legend of Zelda
7. God of War
8. Assassin’s Creed
9. Fortnite
10. Sims
11. The Last Of Us
12. Red Dead Redemption
13. Clash Royale
14. Minecraft
15. Candy Crush
16. World of Warcraft
17. Uncharted
18. League Of Legends
19. Elden Ring
20. Clash of Clans
21. Mario Kart
22. Valorant
23. Skyrim
24. Hollow Knight

Table 3. Survey results.
In Table 3, we can find, for each title identified, the number of times each of these titles was the answer to each of the questions stated earlier. The columns are labeled 1–9, representing each formulated question. In the last column labeled ‘total,’ the sum of the times a game was named throughout is included. As can be seen there, Super Mario Bros emerges as the most frequent title in several categories: platform video games, favorites, and children’s games. It appears 95 times as a platform game, followed distantly by Hollow Knight, with 11 occurrences.
From the analysis, it can be concluded that the titles that spontaneously appear recurrently in the users’ responses are those that have appeared more than 40 times. Therefore, a list of videogames with a high user impact is provided:
1. Super Mario Bros
2. Call of Duty
3. Grand Theft Auto
4. Pokémon
5. FIFA
6. The Legend of Zelda
7. God of War
8. Assassin’s Creed
9. Fortnite
10. Sims
11. The Last of Us
12. Red Dead Redemption
13. Clash Royale
14. Minecraft
15. Candy Crush
Based on the data presented in Table 3, Figure 3 has been created to display a bar diagram, for enhanced clarity. Figure 3 provides a visual representation of how frequently each of the 24 analyzed games was mentioned throughout the survey.

Figure 3. Spontaneous recognition of videogames in the survey.
In Figure 3, the horizontal axis is divided into distinct sections, each representing a range or “bracket” of potential mentions a game could receive. These brackets delineate various intervals of mention counts. For instance, one bracket might encompass mentions ranging from 0 to 10, while another could cover mentions from 11 to 20, and so forth. Each section along this axis corresponds to a specific numerical range of mentions. Conversely, the vertical axis represents the frequency with which games were mentioned within each respective bracket. For the analysis presented, a total of 24 games were selected as the basis for this study. The vertical axis thus displays the count of these 24 selected games that were mentioned falling within each bracket on the horizontal axis. This graphical representation serves to illustrate the distribution of mentions across different ranges of mention counts, providing insight into the prominence or popularity of the selected games within various levels of mention frequency (Table 4).
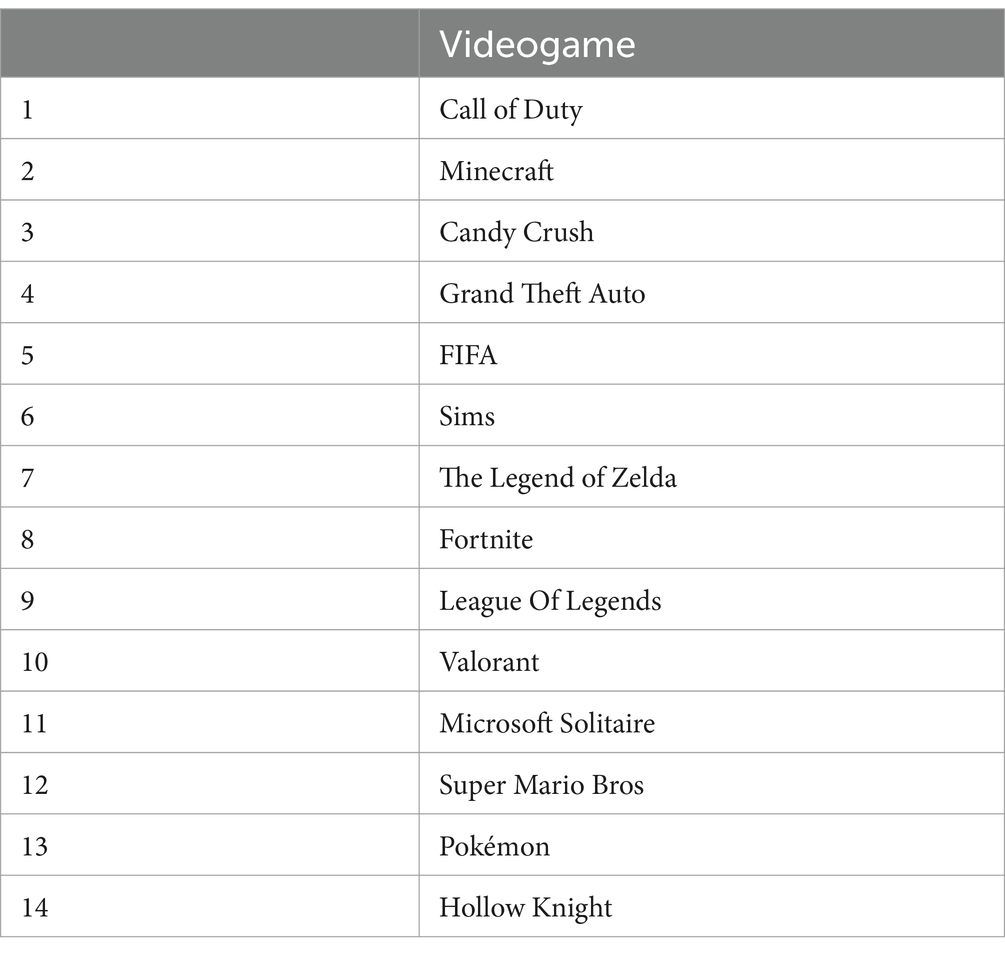
Table 4. Video games entrenched within individuals’ spontaneous recognition.
One notable observation is the bar representing the category of 175–200 mentions, which contains only one game: Super Mario Bros, with a total of 177 mentions. This game stands out as the sole outlier within the dataset. To assess the significance of this outlier, statistical measures such as the mean and standard deviation of the mention counts are utilized. The mean mention count across all games is calculated to be 54.8, with a standard deviation of 35.8 mentions. These statistics provide a measure of the central tendency and dispersion of the mention data. Given that the mean is 54.8 mentions and the standard deviation is 35.8 mentions, a mention count of 177 for Super Mario Bros is more than 3 standard deviations beyond the mean. This places it significantly to the right of the diagram, indicating its substantial deviation from the typical range of mention counts observed for the other games.
Conversely, the mention counts for the remaining titles fall within a bracket of less than two standard deviations from the mean. This suggests that they can be considered typical values within the dataset. In summary, the descriptive analysis highlights Super Mario Bros as an outlier due to its notably high mention count, which significantly exceeds the mean and standard deviation of the dataset. The remaining titles are characterized by mention counts that fall within a more typical range, as indicated by their proximity to the mean and standard deviation.
Continuing with a descriptive analysis of the data represented in Figure 3, it is revealed that titles exceeding the average appearance count of 55 include Super Mario Bros, Call of Duty, Grand Theft Auto, Pokémon, FIFA, The Legend of Zelda, God of War, and Assassin’s Creed. Despite representing 33% of titles of Table 3, they account for only 1.7% of the total surveyed titles.
Most of the games (70%) from Table 3 fall inside the second and third bars of Figure 3. So it is expected that most measures of centrality (mean, median and mode) will concentrate around the values represented within those brackets (25–50 mentions for the second bar and 50–75 mentions for the third bar). The mean, as stated before, corresponds to 54.8 mentions, while the median has a value of 47 and the mode of 53. A standard deviation of 36 suggests notable variability relative to the mean.
The kurtosis and skewness coefficients were obtained in order to further analyze the shape of the distribution presented in Figure 3. The kurtosis value of five implies a leptokurtic distribution, indicating data clustering around the mean with heavier tails than a normal distribution. Additionally, a skewness coefficient of two indicates positive skewness, signifying a right-tailed data distribution toward higher values, which occurs due to the presence of Super Mario Bros as the mentioned outlier.
A q–q plot of the data presented in Figure 3, is represented in Figure 4. A q–q plot, or Quantile–Quantile plot, is a graphical technique employed to compare the distribution of observed data against a theoretical distribution, in this case, the normal distribution.
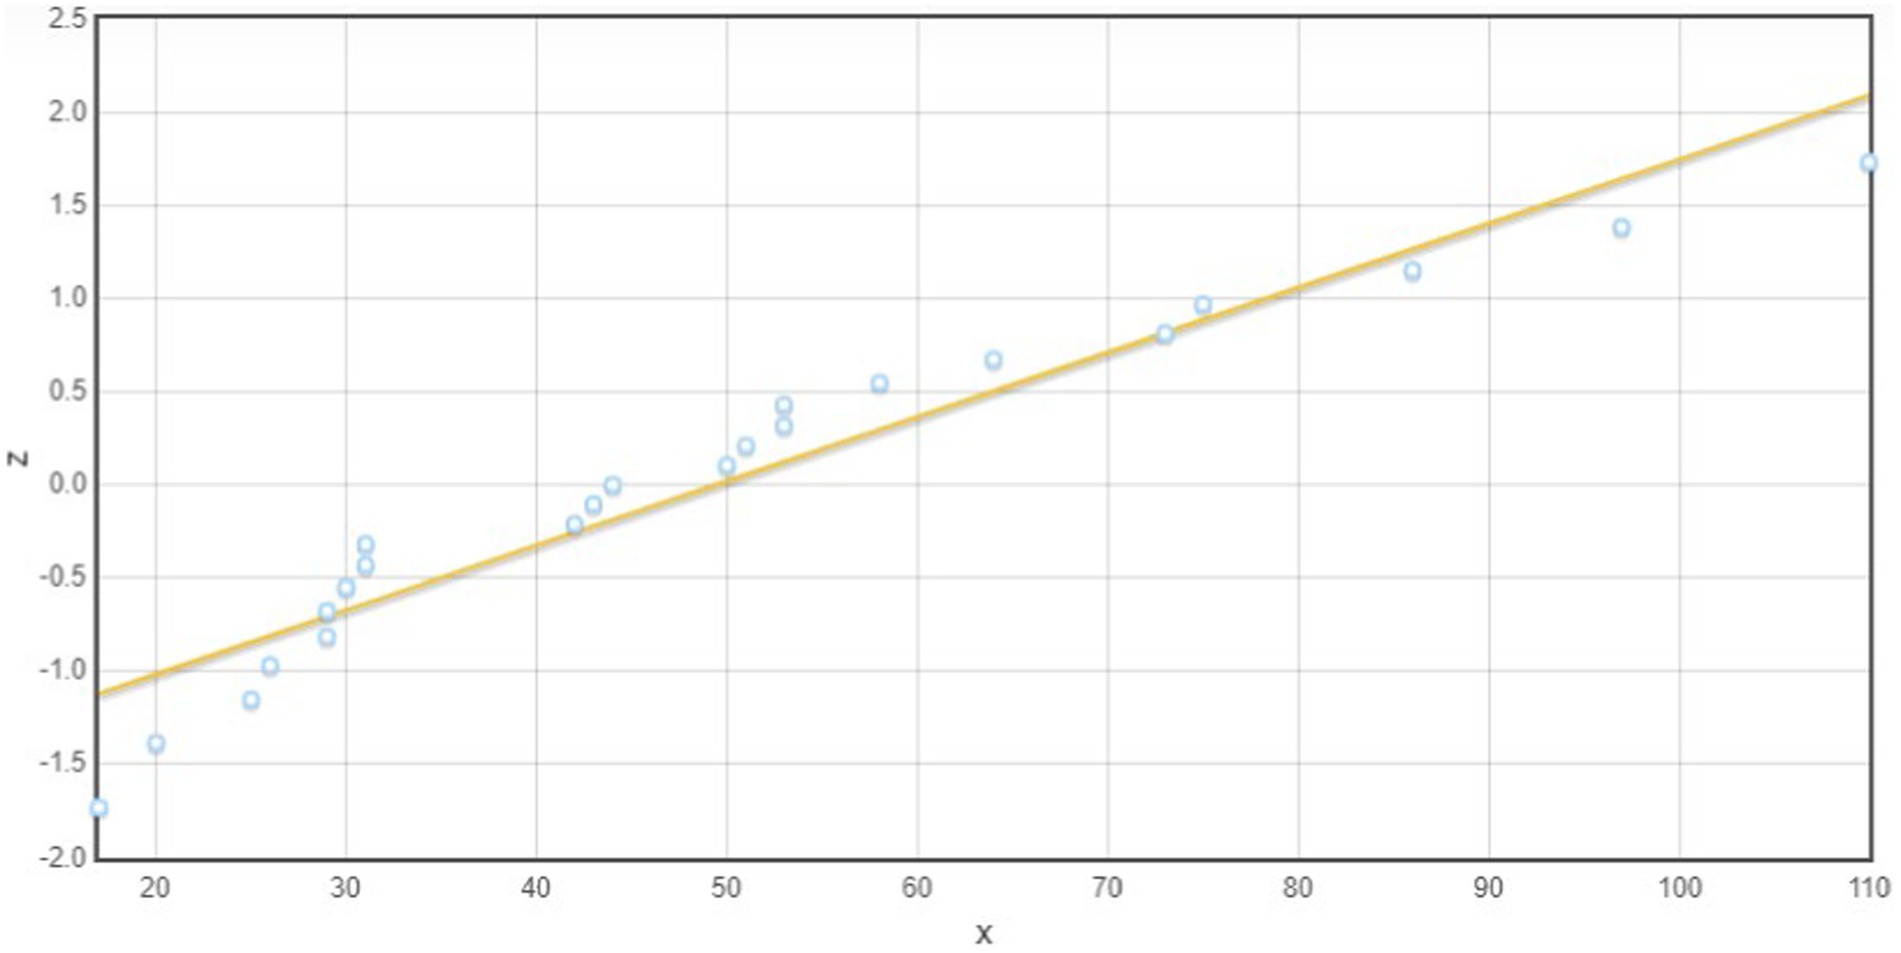
Figure 4. Q–Q plot of the values of most mentioned games against a normal distribution.
If the data is represented without including the outlier (with a value of 172), it shows that the games are mentioned following a normal distribution, which is something to be expected, given that the position of the bars represents the perceived popularity of games. The outlier, in this case, Super Mario Bros (1985), predates the most popular entries of the rest of the games on the list by over a decade—more than two in the case of Call of Duty (Call of Duty 4: Modern Warfare released in 2007), the next most mentioned game on the list, which does not qualify as an outlier. This longer exposure time to the public consciousness could explain why it breaks the normal trend of the rest of the list.
To provide further insight into the findings presented in Table 3; Figure 5 was generated to compare the total number of times a game was named in Table 3 with the number of times that game was selected as the most time-invested game by survey participants. This comparison is broken down by platform, distinguishing between PC or console vs. mobile or tablet usage. The aim of Figure 5 is to investigate potential visual correlation between spontaneous recognition of a game and time invested in it by players.
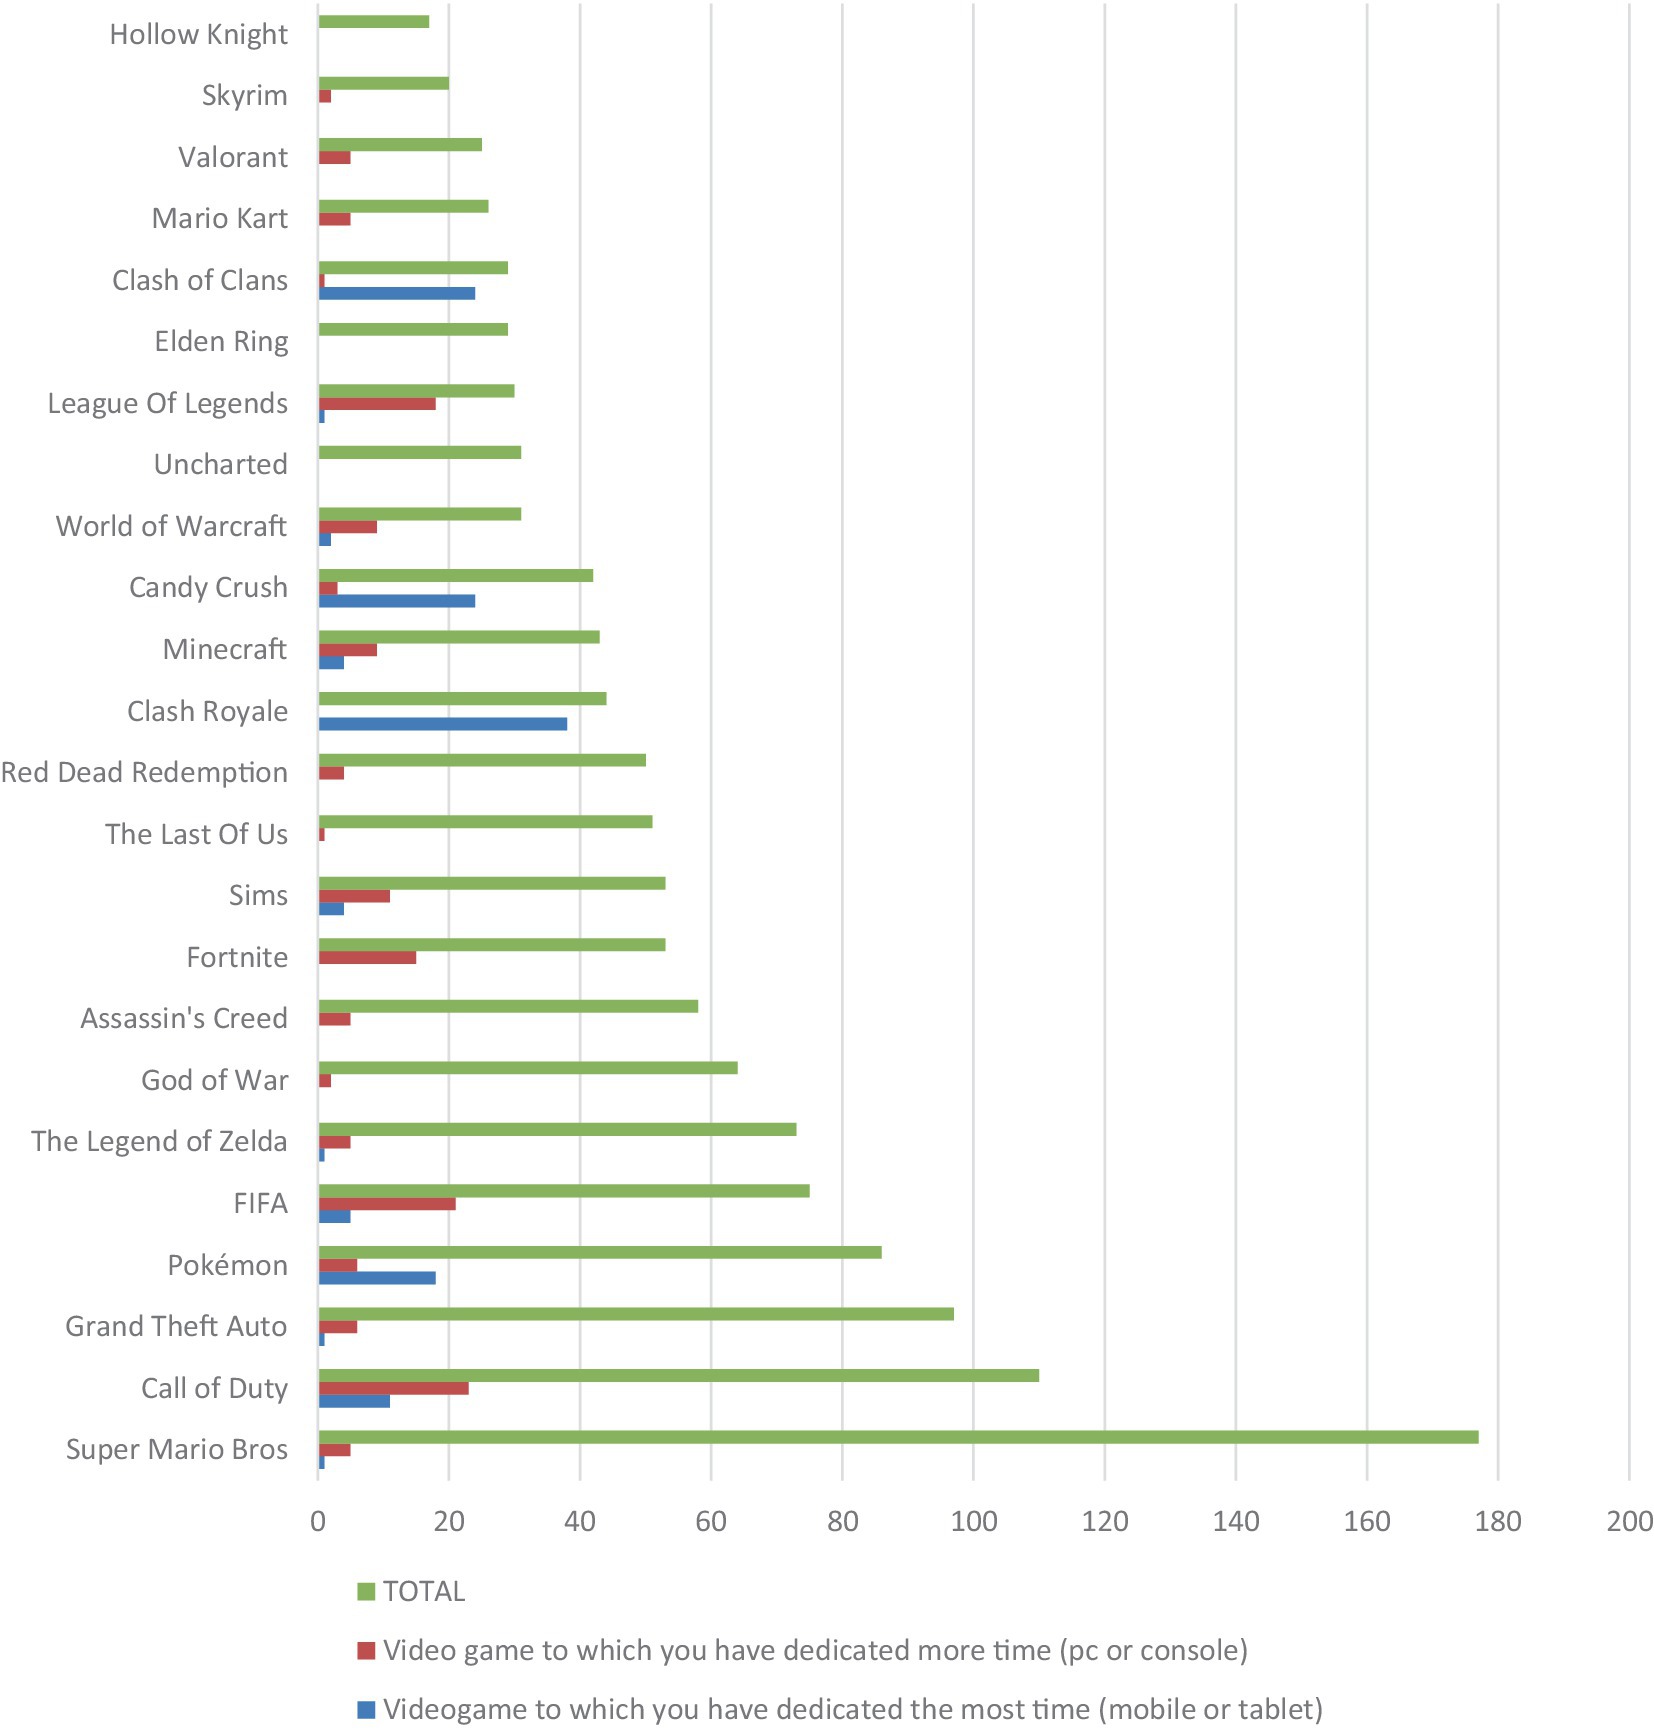
Figure 5. Frequency of games mentioned in Table 3 against those with the most time-investment by users (attending to platform).
Figure 5 illustrates that the video game most frequently recognized in individuals’ spontaneous recognition may not necessarily be the one they spent the most hours playing. However, Call of Duty ranks highest in PC/console playing hours and second in total appearances. Titles like Clash Royale and Clash of Clans exhibit a relationship between hours played and appearances in users’ imagination, despite appearing minimally in other categories.
There’s a clear relationship between childhood and favorite video games, with titles like ‘Assassin’s Creed’ and ‘Call of Duty’ frequently appearing in both categories.
A comparative analysis revealed:
• A strong correlation between favorite and childhood games.
• Titles appreciated for graphics, showcasing elaborate, reality-like models.
• A higher frequency of appearances in open-world games (nine titles) compared to platform games, where ‘Super Mario Bros’ stands out with 95 appearances, well above the average.
Upon analyzing the most played video games and the most representative video games internationally, retrieved from the literature review and the data gathered from the survey, it is found that three videogames or sagas consistently appear in all of them: Call of Duty, Minecraft, and Candy Crush. This discovery could serve as a foundational point for future investigations into subjective user recognition criteria.
Consequently, this research has led to the creation of an index featuring 14 video games entrenched within individuals’ spontaneous recognition. These include.
To address the question of which video games are spontaneously recognized by users, an investigation has been conducted based on data provided by the current industry. It is observed that there are no lists of video games derived from the spontaneous recognition of users.
The classification of video game genres has evolved over time, from early divisions proposed by Herz based on gameplay, to modern classifications that consider the platform on which games are played. While no single system is universally accepted, these classifications provide a framework for organizing and understanding the diverse range of gaming experiences. Herz’s categorization remains the most standardized, but it’s important to remain open-minded and flexible due to the constant evolution of technology, player preferences, and industry trends.
The systematic review has highlighted the difficulties of comparing video game data. Inconsistencies arise from the diversity of criteria among available datasets, compounded by limited open access to industry data, often concealed behind paywalls. Companies have little incentive to disclose competitive data, hindering open research platforms.
Research on spontaneous recognition in video games sheds light on the interaction between video game culture and society. While authors like Herz have explored the cultural and psychological aspects of video games, there’s been no exhaustive classification of video games. In contrast, Klevjer and Hovden’s study of video game preferences reveals seven distinct player clusters and a list of widely recognized titles, showcasing the diversity of preferences within the gaming community. Additionally, studies in other fields, such as brand and electronic product marketing, demonstrate a correlation between spontaneous recognition and consumer behavior, indicating that greater recognition often leads to increased sales success (Kumar Padhy and Sawlikar, 2018; Gupta et al., 2023). These findings underscore the relevance of spontaneous recognition not only in the video game industry but also in understanding consumer behavior and marketing strategies across various industries.
To standardize data, concessions were necessary, involving the harmonization of disparate sources. For instance, the analysis of monthly video game user counts omitted titles not requiring online play or registration, leading to exclusions from the list. A compilation of 14 video games has been generated based on users’ spontaneous subjective recognition. This study has highlighted the challenges in comparing video game data. Inconsistencies arise due to varying criteria among available datasets, compounded by limited open access to industry data—often tucked behind paywalls. Companies have little incentive to disclose competitive data, hindering open research platforms.
The complexity of the gaming landscape stems from diverse platforms and individual gaming approaches—ranging from casual mobile games like Candy Crush to intensive gaming experiences like Call of Duty or The Legend of Zelda.
The scarcity of academic literature for comparative studies in the gaming field has been evident, underscoring the need for more comprehensive research frameworks, especially in terms of video game lists,
Through a survey conducted in Spain, valuable data regarding the subjective recognition of video game users have been obtained. It’s apparent that certain globally recognized video games significantly permeate an individual’s visual culture. The provided ranking based on TOMA for Spain could serve as a point of comparison with other countries or population groups. These comparisons would provide greater insight toward the potential correlation between industry, academy and user perspectives both globally and country by country.
This research has underscored the subjective criteria influencing consumer preferences in the gaming industry. The list of video games obtained shows that all of them belong to the most successful genres as defined by Qaffas (2020), indicating a correlation between industry trends and spontaneous recognition.
Future research endeavors could be to delve deeper into the subjective recognition patterns among video game users.
To gain a comprehensive understanding of user recognition in the video game industry, future research could explore how specific marketing strategies, cultural influences, and social media presence influence individual perceptions of video games. For instance, analyzing how advertising campaigns targeting different demographics impact a game’s perception could reveal insights into the relationship between marketing strategies and user recognition. Similarly, investigating how local or global cultural trends affect the popularity of certain games could provide valuable insights into how consumer preferences are shaped in different cultural contexts. By delving deeper into these aspects, researchers can gain a nuanced understanding of the factors driving user preferences in the video game market, informing more effective marketing strategies, game development decisions, and industry trends.
The original contributions presented in the study are included in the article/supplementary material, further inquiries can be directed to the corresponding authors.
Ethical review and approval was not required for the study on human participants in accordance with the local legislation and institutional requirements. Written informed consent from the participants/legal guardian/next of kin was not required to participate in this study in accordance with the national legislation and the institutional requirements.
PT-L: Conceptualization, Investigation, Methodology, Writing – original draft, Writing – review & editing. M-JT-L: Formal analysis, Supervision, Writing – original draft, Writing – review & editing. GC-C: Conceptualization, Formal analysis, Investigation, Supervision, Writing – original draft, Writing – review & editing.
The author(s) declare that no financial support was received for the research, authorship, and/or publication of this article.
The authors declare that the research was conducted in the absence of any commercial or financial relationships that could be construed as a potential conflict of interest.
All claims expressed in this article are solely those of the authors and do not necessarily represent those of their affiliated organizations, or those of the publisher, the editors and the reviewers. Any product that may be evaluated in this article, or claim that may be made by its manufacturer, is not guaranteed or endorsed by the publisher.
Active Player (2023). Among us live player count and statistics, https://activeplayer.io/. Available at: https://activeplayer.io/among-us/ (Accessed April 27, 2023).
Activeplayer (2023). Genshin impact live player count and statistics, https://activeplayer.io/.
Asociación Española de Empresas Productoras y Desarrolladoras de Videojuegos y Software de Entretenimiento (DEV) (2022). Libro Blanco del Desarrollo Español de Videojuegos. Available at: https://dev.org.es/images/stories/docs/libro%20blanco%20del%20desarrollo%20espanol%20de%20videojuegos%202021.pdf (Accessed December 7, 2022).
Asociación Española del Videojuego (2022). La industria del videojuego en España en 2022. Available at: http://www.aevi.org.es/web/wp-content/uploads/2023/05/Anuario-AEVI-2022.pdf (Accessed May 29, 2023).
Bevan, J. (2023). League of legends revenue and user stats (2023) | mobile marketing reads. Available at: https://mobilemarketingreads.com/league-of-legends-revenue-and-user-stats/ (Accessed April 27, 2023).
Chaundy, D. (2023). Most played games in 2022, Ranked by Average Monthly Players, Twinfinite. Available at: https://twinfinite.net/features/most-played-games/ (Accessed April 28, 2023).
Choi, H. S., Ko, M. S., Medlin, D., and Chen, C. (2018). The effect of intrinsic and extrinsic quality cues of digital video games on sales: an empirical investigation. Decis. Support. Syst. 106, 86–96. doi: 10.1016/J.DSS.2017.12.005
Clement, J. (2023a). All-time best selling console games worldwide 2023 | Statista. Available at: https://www.statista.com/statistics/264530/all-time-best-selling-console-games-worldwide/ (Accessed April 27, 2023).
Clement, J. (2023b). Best-selling video games – top publishers and titles, Statista. Available at: https://www.statista.com/topics/9344/best-selling-video-games-top-publishers-and-titles/#topicOverview (Accessed May 29, 2023).
Clement, J. (2023c). PUBG unit sales 2021 | Statista. Available at: https://www.statista.com/statistics/791791/pubg-player-base-world/ (Accessed April 27, 2023).
Clement, J. (n.a.). Call of duty monthly active users, 2023. Available at: Call of Duty monthly active users (Accessed April 27, 2023).
Curry, D. (2023a). Among us revenue and usage statistics (2023) – business of apps. Available at: https://www.businessofapps.com/data/among-us-statistics/ (Accessed April 27, 2023).
Curry, D. (2023b). Candy crush revenue and usage statistics (2023) – business of apps. Available at: https://www.businessofapps.com/data/candy-crush-statistics/ (Accessed April 27, 2023).
Curry, D. (2023c). Minecraft revenue and usage statistics (2023) – business of apps. Available at: https://www.businessofapps.com/data/minecraft-statistics/ (Accessed April 27, 2023).
Dhillon, S. (2023). Clash of clans revenue and usage statistics (2023) – business of apps. Available at: https://www.businessofapps.com/data/clash-of-clans-statistics/ (Accessed April 27, 2023).
Forde, M. (2020). Tencent’s TiMi Studios discuss Call of Duty, Pokémon partnership and 2020 trends | Pocket Gamer.biz | PGbiz. Available at: https://www.pocketgamer.biz/asia/interview/72374/tencents-timi-studios-call-of-duty-pokemon-and-2020-trends/ (Accessed April 27, 2023).
Gaming Ideology (2021). Mini world’ with 100 million monthly active users has issued an announcement and will strictly implement the new anti-addiction regulations, https://gamingideology.com/. Available at: https://gamingideology.com/2021/08/31/mini-world-with-100-million-monthly-active-users-has-issued-an-announcement-and-will-strictly-implement-the-new-anti-addiction-regulations/ (Accessed April 27, 2023).
Gómez-Luna, E., Navas, D. F., Aponte-Mayor, G., and Betancourt-Buitrago, L. A. (2014). Metodología para la revisión bibliográfica y la gestión de información de temas científicos, a través de su estructuración y sistematización. Dyna 81, 158–163. doi: 10.15446/dyna.v81n184.37066
Gupta, S., Bohra, N. S., Sherly,, and Simangunsong, R. (2023). Role of brand-equity on consumer purchase intention in electronic goods industry. J. Inf. Educ. Res. 3. doi: 10.52783/jier.v3i1.36
Hakala, U., Svensson, J., and Vincze, Z. (2012). Consumer-based brand equity and top-of-mind awareness: a cross-country analysis. J. Prod. Brand Manag. 21, 439–451. doi: 10.1108/10610421211264928
Hernandez-Perez, J.F. (2015). Taxonomía del videojuego: un planteamiento por géneros, La Pantalla Insomne. Available at: https://www.researchgate.net/publication/308983850_Taxonomia_del_videojuego_un_planteamiento_por_generos (Accessed March 27, 2024).
Herz, J. C. (1997). Joystick nation: how videogames ate our quarters, won our hearts, and rewired our minds. Boston: Little, Brown and Company [Preprint].
https://activeplayer.io/ (2023). Minecraft live player count and statistics. Available at: https://activeplayer.io/minecraft/ (Accessed: April 27, 2023).
Hugues, P. (2010). An investigation based on brand awareness in the video-games industry. Dublin Business School. Available at: http://hdl.handle.net/10788/100 (Accessed March 26, 2024).
Jangir, A. (2022). List of most-played video games (by player count). Available at: https://list.sacnilk.com/article/List_Of_MostPlayed_Video_Games_by_player_count (Accessed March 28, 2023).
Kirriemuir, J., and McFarlane, A. (2004). Literature review in games and learning, a NESTA futurelab research report – report 8. Available at: https://telearn.archives-ouvertes.fr/hal-00190453/file/kirriemuir-j-2004-r8.pdf (Accessed March 27, 2024).
Klevjer and Hovden (2017). The structure of videogame preference, game studies. Available at: https://gamestudies.org/1702/articles/klevjer_hovden (Accessed March 27, 2024).
Kumar Padhy, S., and Sawlikar, R. K. (2018). The role of brand equity and brand awareness on consumers’ purchase intention. Int. J. Bus. Manage. Invent. 7, 12–16.
Maroto, R., Alegría, P., and González Lorca Presidente de AEVIJosé María Moreno, A. (2022). La industria del videojuego en España en 2021.
Márquez, R. (2023). Adopt Me! de Roblox ha hecho bien todo lo que Second Life hizo mal o demasiado pronto: así tienen a 64 millones de usuarios y facturan 50 millones. Available at: https://www.xataka.com/videojuegos/adopt-me-roblox-ha-hecho-bien-todo-que-second-life-hizo-mal-demasiado-pronto-asi-tienen-a-64-millones-usuarios-facturan-50-millones (Accessed April 28, 2023).
Mattone, J. (2021). Call of duty®: mobile surpasses 500 million downloads. Available at: https://www.callofduty.com/blog/2021/05/Call-of-Duty-Mobile-Milestone-500-Million-Downloads (Accessed April 27, 2023).
Michingo (2022). ¿Cuántas personas juegan Apex? (Estadísticas de usuario y crecimiento). Available at: https://www.tiempoderecreo.com/juegos/cuantas-personas-juegan-apex-estadisticas-de-usuario-y-crecimiento (Accessed April 28, 2023).
Most Played Games in 2022, Ranked by Average Monthly Players (2023). Twinfinite. Available at: https://twinfinite.net/features/most-played-games/ (Accessed April 27, 2023).
National Museum of Play (2023). 2023 world video game hall of fame finalists. Available at: https://www.museumofplay.org/exhibits/world-video-game-hall-of-fame/2023-finalists/ (Accessed April 21, 2023).
Newzoo Global Games Market Report 2022 (2023). Available at: https://newzoo.com/resources/trend-reports/newzoo-global-games-market-report-2022-free-version (Accessed June 14, 2023).
Pallavicini, F., Ferrari, A., and Mantovani, F. (2018). Video games for well-being: a systematic review on the application of computer games for cognitive and emotional training in the adult population. Front. Psychol. 9:407892. doi: 10.3389/FPSYG.2018.02127/BIBTEX
Pilipovic, S. (2023). How much money has GTA 5 made? — 2023 statistics | LEVVVEL. Available at: https://levvvel.com/grand-theft-auto-v-statistics/ (Accessed April 28, 2023).
PUBG Live Player Count and Statistics (2023). activeplayer.io. Available at: https://activeplayer.io/pubg/ (Accessed April 27, 2023).
Qaffas, A. A. (2020). An operational study of video games’ genres. Int. J. Interact. Mobile Technol. 14:175. doi: 10.3991/ijim.v14i15.16691
RMCTeam (2021). Minecraft registered 500 million Chinese players and the next major update will be launched in 2022 – real mi central. Available at: https://www.realmicentral.com/2021/10/17/minecraft-registered-500-million-chinese-players-and-the-next-major-update-will-be-launched-in-2022/ (Accessed April 27, 2023).
Romo, H.L. (1998). La metodología de encuesta, Técnicas de investigación en sociedad, cultura y comunicación [Preprint].
Shiro Uemura, O.M. (2020). Investor presentation NEXON Q1 2020. Available at: http://pdf.irpocket.com/C3659/yCGV/B6S9/ynEy.pdf (Accessed April 28, 2023).
Shliakhovchuk, E., and Muñoz García, A. (2020). Intercultural perspective on impact of video games on players: insights from a systematic review of recent literature. Educ. Sci. Theory Pract. 20, 40–58. doi: 10.12738/jestp.2020.1.004
VGS (2023). CrossFire player count, stats and facts | 2023 | VGS, https://videogamesstats.com/. Available at: https://videogamesstats.com/crossfire-facts/ (Accessed April 28, 2023).
Wardhana, A. (2022). “Brand image Dan bran awareness” in Brand marketing: the art of branding, 105–116.
Warren, T. (2020). Microsoft solitaire turns 30 years old today and still has 35 million monthly players – the verge. Available at: https://www.theverge.com/2020/5/22/21266718/microsoft-solitaire-30-years-old-history-birthday-record-attempt (Accessed April 28, 2023).
Wolf, M. (2012). Encyclopedia of video games. Available at: https://books.google.es/books?hl=es&lr=&id=deBFx7QAwsQC&oi=fnd&pg=PP2&dq=list+videogames&ots=ISxw4m2VQf&sig=iKFzkGoOMNi4GPH6O-fQCwbKq6c#v=onepage&q=list%20videogames&f=false (Accessed March 15, 2023).
Zenitsu (2022). LoL: ¿Cuántos jugadores activos hay en 2022? El gran estado de forma del MOBA después de 13 años – Millenium. Available at: https://www.millenium.gg/noticias/49994.html (Accessed April 27, 2023).
Keywords: video games for impact, videogame, emotions, index, user, acknowledgment, user-centric
Citation: Terron-Lopez P, Terrón-López M-J and Castilla-Cebrian G (2024) Spontaneous recognition of impactful video games: a user-centric classification framework. Front. Comput. Sci. 6:1378796. doi: 10.3389/fcomp.2024.1378796
Edited by:
Anastasios Theodoropoulos, University of Peloponnese, GreeceReviewed by:
Elizabeth A. Boyle, University of the West of Scotland, United KingdomCopyright © 2024 Terron-Lopez, Terrón-López and Castilla-Cebrian. This is an open-access article distributed under the terms of the Creative Commons Attribution License (CC BY). The use, distribution or reproduction in other forums is permitted, provided the original author(s) and the copyright owner(s) are credited and that the original publication in this journal is cited, in accordance with accepted academic practice. No use, distribution or reproduction is permitted which does not comply with these terms.
*Correspondence: Pilar Terron-Lopez, cGlsYXIudGVycm9uQHVuaXZlcnNpZGFkZXVyb3BlYS5lcw==; María-José Terrón-López, bV9qb3NlLnRlcnJvbkB1bml2ZXJzaWRhZGV1cm9wZWEuZXM=; Guillermo Castilla-Cebrian, Z3VpbGxlcm1vLmNhc3RpbGxhQHVuaXZlcnNpZGFkZXVyb3BlYS5lcw==
Disclaimer: All claims expressed in this article are solely those of the authors and do not necessarily represent those of their affiliated organizations, or those of the publisher, the editors and the reviewers. Any product that may be evaluated in this article or claim that may be made by its manufacturer is not guaranteed or endorsed by the publisher.
Research integrity at Frontiers
Learn more about the work of our research integrity team to safeguard the quality of each article we publish.