
94% of researchers rate our articles as excellent or good
Learn more about the work of our research integrity team to safeguard the quality of each article we publish.
Find out more
SYSTEMATIC REVIEW article
Front. Comput. Sci., 04 March 2024
Sec. Human-Media Interaction
Volume 6 - 2024 | https://doi.org/10.3389/fcomp.2024.1368860
 Sebastian A. C. Perrig*
 Lena Fanya Aeschbach
 Nicolas Scharowski
 Nick von Felten
 Klaus Opwis
 Florian Brühlmann
User experience (UX) research relies heavily on survey scales to measure users' subjective experiences with technology. However, repeatedly raised concerns regarding the improper use of survey scales in UX research and adjacent fields call for a systematic review of current measurement practices. Therefore, we conducted a systematic literature review, screening 153 papers from four years of the ACM Conference on Human Factors in Computing Systems proceedings (ACM CHI 2019 to 2022), of which 60 were eligible empirical studies using survey scales to study users' experiences. We identified 85 different scales and 172 distinct constructs measured. Most scales were used once (70.59%), and most constructs were measured only once (66.28%). The System Usability Scale was the most popular scale, followed by the User Experience Questionnaire, and the NASA Task Load Index. Regarding constructs, usability was the most frequently measured, followed by attractiveness, effort, and presence. Furthermore, results show that papers rarely contained complete rationales for scale selection (20.00%) and seldom provided all scale items used (30.00%). More than a third of all scales were adapted (34.19%), while only one-third of papers reported any scale quality investigation (36.67%). On the basis of our results, we highlight questionable measurement practices in UX research and suggest opportunities to improve scale use for UX-related constructs. Additionally, we provide six recommended steps to promote enhanced rigor in following best practices for scale-based UX research.
Survey scales, sometimes called questionnaires or rating scales, are one of the most commonly used methods for measurement with a long history, originating in the social sciences (Gault, 1907). Human-Computer Interaction (HCI) research has adapted this method to measure the experiences people have when interacting with technology (Cairns and Power, 2018). Within user experience (UX) research specifically, survey scales account for one of the most popular methods to collect data (Bargas-Avila and Hornbæk, 2011; Pettersson et al., 2018). Essentially, survey scales use a set of items to measure a construct that is of interest to a researcher (DeVellis, 2017). In this regard, the term construct is often used to refer to unobservable aspects relevant to UX research, such as psychological traits or abilities of individuals (Hopkins, 1998). For example, “trust in automation” is a construct defined by UX researchers on the basis of patterns of thoughts and behaviors indicating subjective trust. This construct can then be made accessible with a survey scale by having users respond to the 12 items of the “Trust between People and Automation” scale (Jian et al., 2000). The users' responses to the scale's items can then be combined, for example, by forming an overall score or calculating the mean value. This process provides the researcher with a number reflecting users' subjective levels of trust toward the automated system. The resulting number can then be used for statistical analysis during the research process and compared across experiments when the same scales are used more than once.
While survey scales are a powerful method, offering many benefits to researchers (Nunnally, 1978), researchers can only have confidence in the data gathered and the conclusions derived from said data when appropriate scales are used with proper rigor (Furr, 2011). In turn, if survey scales used to measure a construct lack validity or are misused, the quality of the data collected is negatively affected, and a study's conclusions have to be put into question (Flake and Fried, 2020). Ideally, researchers use standardized scales, which are developed as part of a process specifically aimed at creating a new scale to measure one or more constructs. These scales should be constructed in adherence to certain quality standards to ensure their reliability and validity (DeVellis, 2017). Less ideal is when researchers adapt such a scale because it could potentially lose some or all the qualities compared to the scale it is based on, or when they construct a self-developed scale without investigating its psychometric quality (Furr, 2011). Work from fields related to UX, such as social and personality psychology, has raised doubts regarding the quality of some of the most frequently used survey scales in these respective disciplines (Flake et al., 2017; Hussey and Hughes, 2020). On this matter, Flake and Fried (2020) recently introduced the term questionable measurement practices (QMPs), referring to “decisions researchers make that raise doubts about the validity of measure use in a study, and ultimately the study's final conclusions” (Flake and Fried, 2020, p. 2). Thus, if researchers use survey scales for data collection without sufficient rigor, they expose their study to potential QMPs. Examples of such QMPs include a lack of evidence for the quality of a scale (e.g., for the scale's validity) or unjustified flexibility in employing the scale (e.g., removing or changing items). Most of the time, QMPs do not occur with malicious intent but because scientists face difficult decisions during all stages of the research process, including when working with survey scales, but also when other methods are used (Flake and Fried, 2020). Furthermore, if there is little to no information on how a scale was employed in a study, it can be hard, if not impossible, to judge the validity of the scale and the study as a whole. Thus, the absence of transparency hinders the identification and the prevention of QMPs (Flake and Fried, 2020).
Recent findings from the field of player experience (PX) research have shown that there is a lack of transparent reporting in studies that employ survey scales for measurement, indicating the presence of QMPs in PX research (Aeschbach et al., 2021). Given the close relation between UX and PX research, it is plausible that comparable practices likewise exist in UX research. Based on Flake and Fried (2020), we see a potential risk for QMPs in UX research whenever researchers do not follow best practices or rather do not report on following them. However, there is no systematic analysis of QMPs' prevalence in UX research. We, therefore, set out to identify current best practices based on literature from past HCI research, psychometrics, and the social sciences (Nunnally, 1978; Furr, 2011; DeVellis, 2017; Aeschbach et al., 2021), and systematically investigated how well scale-based UX research follows these best practices.
If QMPs are prevalent in UX research, improving adherence to best practices when employing scales would come with great potential for UX research. Due to the subjective nature of UX and the potential of survey scales as a method for data collection, we see a great prospect in the proper use of survey scales as a method to quantify people's subjective experience through indirect means (DeVellis, 2017). However, systematic knowledge of current practices in scale-based research is needed to understand where UX research currently needs more adherence to best practices, hindering it from reaping the full potential of survey scales. By comparing how survey scales have been employed in UX research with current “best practice” from the literature on survey scales and psychometrics (Nunnally, 1978; Furr, 2011; DeVellis, 2017), we aim to see where UX research stands and if there is room for improvement in scale-based UX research. From this, we can provide clear recommendations addressing the identified issues, helping future research use survey scales with even more potential, fostering methodologically improved UX research and a better understanding of UX.
In the field of HCI, whether survey scales are an appropriate method to study UX has frequently been questioned (Law et al., 2014). In particular, past research has uncovered skepticism among UX researchers toward the reductionist process of breaking down a user's experience into constructs to make it measurable, arguing that it goes against the holistic notion of UX, oversimplifying the complexity of a user's experience (Law et al., 2014). In defense of survey scales, Cairns and Power (2018) argued that proper use of modern psychometric methods could acknowledge this contradiction between a holistic view of experiences and the reductionist measurement process. By using modern statistical methods, researchers can form richer interpretations of the data gathered using survey scales, therefore offering a more differentiated picture of UX (Cairns and Power, 2018). Yet, research findings by Law et al. (2014) contain an argument that the challenge with measuring UX is not measurement itself, but rather that UX researchers need enhanced training and education on how to measure. Measurement of UX becomes problematic when researchers do not understand the measures they are utilizing, are unaware of certain limitations that come with them, over-formalize them, or intentionally misuse them (Law et al., 2014). Thus, it appears that the problem with measurement using survey scales in UX research is not the method itself but problems that arise when researchers use these scales without following current best practices.
The following section provides an overview of essential ideas and best practices behind measurement using scales that we considered in our review to investigate how UX researchers use survey scales. While some of these ideas are derived from suggestions on avoiding QMPs (Flake and Fried, 2020), others are based on additional literature on survey scales and measurement within the social sciences (Nunnally, 1978; Furr, 2011; DeVellis, 2017).
One of the more fundamental sources, DeVellis (2017), defines survey scales as “collections of items combined into a composite score and intended to reveal levels of theoretical variables not readily observable by direct means” (DeVellis, 2017, p. 15). We adopt this definition, as well as the terms used by DeVellis (2017), and refer to methodological approaches fitting this definition as survey scales. Survey scales, ideally, are developed as part of a process specifically aimed at creating a new scale to measure one or more constructs. Items are carefully formulated based on theoretical concepts to cover all relevant aspects of a construct, and the quality of the scale (e.g., its reliability and validity) is examined using appropriate statistical methods (DeVellis, 2017). Based on the results from the quality investigation, the scale and its items are then revised and re-investigated in an iterative development process until a final version of the scale is established (Furr, 2011). Researchers can then use the final scale across studies and, ideally, without modification (Juniper, 2009). In some cases, however, scales are assembled, and their items are written without much theoretical thought guiding the process (DeVellis, 2017). Such scales are typically created as part of a specific study and are rarely used across multiple ones. Therefore, researchers arguably invest less thought and effort into the precise wording of the items, and little to no effort is made to examine the quality of the scale. The former type of carefully developed scales is typically referred to as “validated” or “standardized” scales, while frequently used terms for the latter type are “self-developed” or “ad hoc” scales.
A standardized scale offers researchers many advantages, such as objectivity, reliability, and the possibility of scientific generalization (Nunnally, 1978). Researchers may lose some, if not all, of these advantages when using self-developed scales. The list of studies advocating for standardized scales in HCI research is long (e.g., Hornbæk, 2006; Hornbæk and Law, 2007; Sauro and Lewis, 2009). Nevertheless, several articles have demonstrated an over-reliance on self-developed scales in usability (Hornbæk, 2006; Hornbæk and Law, 2007) and UX research (Bargas-Avila and Hornbæk, 2011; Pettersson et al., 2018). Thus, we see a need to investigate the type of scales authors use (self-developed or standardized) to determine if UX research still shows an over-reliance on self-developed scales.
When using scales, researchers should share the exact wording of the items they used in their research (Flake and Fried, 2020). Sharing the items used allows readers to judge which version of a scale was employed, if or how items were adapted, and how adequate the items were for the research effort in general. Given factors such as differing scale versions (e.g., short vs. long, varying languages), adaptions of items, and sometimes unclear citations for those scale versions, it can sometimes be unclear which version of a scale was used, even if the scale is a standardized scale. Transparency regarding the items used is vital because differences in how a scale was employed can influence a study's results, introducing methodological variability across the research literature (Flake and Fried, 2020). In addition to helping other researchers better understand a study (Flake and Fried, 2020), transparency regarding study materials, such as scale items, makes replications possible (Wacharamanotham et al., 2020). However, past research has shown that reporting items is uncommon in scale-based UX research (Bargas-Avila and Hornbæk, 2011). Given these previously negative findings and the importance of sharing items (Flake et al., 2017), we find a need for an updated investigation into the transparency of the reporting of scale items.
Because numerous scales are often available to measure a particular target construct, it can be difficult for researchers to select an appropriate scale for their research purpose. While there are always arguments for or against using a particular scale, Flake and Fried (2020) argued that researchers need to provide a clear rationale for why they chose a specific scale based on theoretical as well as empirical, and practical reasoning. According to Aeschbach et al. (2021), a good rationale contains the definition of the target construct, the theory behind the construct, and how the target construct was operationalized (i.e., how it was measured). Furthermore, details on the administration process of a scale (e.g., number of items) and evidence for a scale's validity (i.e., content, criterion, and construct validity) need to be reported (Aeschbach et al., 2021). Providing complete rationales helps readers and reviewers judge the adequacy of said scale for measuring the target construct. In addition, forming such rationales forces the researchers to critically consider the appropriateness of the scale they used (Flake and Fried, 2020). Recent findings from PX research have demonstrated that rationales for scale selection are rare (Aeschbach et al., 2021). Regarding UX research, no comparable investigation exists. We thus see a need to investigate how often UX researchers offer any form of rationale when using survey scales.
As mentioned above, standardized scales usually undergo an elaborate development process to ensure their quality. Therefore, scales used in research should ideally not be adapted because even the slightest adaption could change the scale's psychometric quality (Juniper, 2009; Furr, 2011). Because adapting a scale can alter the scale's quality compared to the original validated version, adapted scales should be considered closer to self-developed scales rather than previously validated scales (Furr, 2011). In addition, adapting existing scales jeopardizes measurements' comparability across the published literature (Flake and Fried, 2020). Recent findings by Aeschbach et al. (2021) have shown that PX researchers frequently adapt their measures when using them. Therefore, we identify a need to investigate the rate of scale adaption in current UX research.
Researchers must ensure that the quality of the scales they use for measurement is adequate because their collected data, and thus their conclusions, depend on their method. Whenever a scale is used, its quality needs to be investigated to ensure it performs as expected within that specific study (Furr, 2011). Regarding scale quality, there are typically three main criteria to consider: objectivity, reliability, and validity (DeVellis, 2017).
Objectivity is concerned with the notion that “any statement of fact made by one scientist should be independently verifiable by other scientists” (Nunnally, 1978, p. 6). Carefully developed measurement methods, such as validated or standardized scales, typically bring with them the advantage of leaving little room for disagreement (Nunnally, 1978). Given this advantage, objectivity is one of the key arguments behind standardized scales.
Reliability is defined as “how accurately a test measures the thing which it does measure” (Kelley, 1927, p. 14). When trying to find indicators of a scale's reliability, Dunn et al. (2014) recommended that researchers ideally report both coefficients alpha (Cronbach, 1951) and omega (McDonald, 1999). Regarding usability research, past work found that only a few studies report on any efforts of validation or reliability assessment (Hornbæk, 2006), while for UX research, a comparable investigation still has to be conducted.
Validity considers “whether a test really measures what it purports to measure” (Kelley, 1927, p. 14). One important class of statistical methods used to assess an essential aspect of validity (i.e., construct validity) is factor analysis (Cairns and Power, 2018). Here, we chose to focus on factor analysis, leaving out other forms of validity assessments, but refer readers to Furr (2011, Chapter 5) for a more extensive overview. The most common forms of factor analysis are exploratory factor analysis (EFA) and confirmatory factor analysis (CFA). EFA is used to identify the underlying scale structure, determining which factors (i.e., which constructs) are measured employing the scales' items. CFA, on the other hand, as its name indicates, is applied to confirm the underlying theoretical structure of a scale (Brown, 2015). Given that there is no systematic investigation into how often UX researchers calculate EFAs and CFAs when using survey scales, examining if UX researchers report these validity indicators when using survey scales seems warranted.
When it comes to measurement, researchers face difficult decisions, and with them, the risk of QMPs arises (Flake and Fried, 2020). QMPs contain actions such as changing the items of a standardized scale without providing clear reasoning or not defining constructs measured in the study. However, no definitive list of QMPs exists to date. They cover a whole range of issues, from a researcher's ignorance or negligence to intentionally misleading practices (Flake and Fried, 2020). At their core, QMPs are closely linked to nontransparent reporting because lack of transparency, intentional or unintentional, obscures actions regarded as questionable in research (Flake and Fried, 2020). The lack of transparent reporting makes it impossible to identify threats to the validity of the measurement scales used as well as the conclusions of a study using scales (Flake and Fried, 2020). Therefore, while QMPs cover a range of different issues, it is hard to identify how frequent they are and what QMPs exist within a particular field of research if authors provide limited information on their measurement process (Flake and Fried, 2020).
Considering past findings from UX research, early indications for the existence of QMPs are evident. Bargas-Avila and Hornbæk (2011) raised concerns regarding how UX researchers use scales as a method, such as an over-reliance on self-developed items and nontransparent reporting regarding the scale items used. More recently, Pettersson et al. (2018) found that self-developed scales are still more popular in UX research compared to scales taken from previous research. While past research has highlighted specific problems within scale-based UX-related research, such as an over-reliance on self-reported scales (Bargas-Avila and Hornbæk, 2011; Pettersson et al., 2018) and a lack of transparent reporting (Bargas-Avila and Hornbæk, 2011; Aeschbach et al., 2021), the central role of survey scales in UX research and the emerging discussions about the correct application of this method (Flake and Fried, 2020; Aeschbach et al., 2021) calls for a systematic review of the current use of survey scales in UX research.
To better understand how survey scales are used as a method in UX research, we investigated how frequently publications contain reports on the above-described best practices, indicating to what extent UX research might be affected by QMPs. In addition, we examined which specific survey scales are used and which constructs are measured with these survey scales to enhance understanding of current practices of scale usage in UX research. Based on these research objectives, we formulated the following research questions to answer the overarching research question “To what extent is UX research affected by QMPs?”:
RQ1: Which standardized scales are currently used in UX research?
RQ2: How frequently are standardized scales used in comparison to self-developed scales?
RQ3: How often are standardized scales adapted?
RQ4: What constructs do researchers measure using survey scales?
RQ5: How often do authors provide a rationale for using a specific scale?
RQ6: How often do authors provide the items of the scales used?
RQ7: How often do authors investigate the psychometric quality of the scales they use? And with what methods?
We followed the systematic quantitative literature review (SQLR) process (Pickering and Byrne, 2014; Pickering et al., 2015). In addition, we adhered to the PRISMA 2020 statement (Page et al., 2021) in reporting this review, where applicable. Following the PRISMA-P statement (Moher et al., 2015), we preregistered an initial protocol for this systematic review with OSF on October 16, 2020.1 Since then, our research strategy and focus have seen several amendments due to the nature of the SQLR. We describe these amendments in the latest version of the protocol on OSF.
Likewise to other reviews in HCI (e.g., Liu et al., 2014; Caine, 2016; Tyack and Mekler, 2020; Salehzadeh Niksirat et al., 2023), we focused on proceedings of the ACM Conference on Human Factors in Computing Systems (CHI). Consequently, we searched the ACM Digital Library (ACM DL),2 specifically the ACM Guide to Computing Literature, considering all articles published as proceedings to CHI from 2019 to 2022. We decided to focus on CHI due to its reputation as one of the most prestigious venues for publishing HCI and UX-related research, as reflected in its high impact factor among HCI publications [h5-index of 113, h5-median of 154 (Google Scholar, 2022, March 17, 2023)]. Nevertheless, we have to acknowledge that this decision limits the scope of the present paper, given that other important venues for HCI research, such as journals, were not considered. For example, given longer or non-existent word or page limits in journals compared to conferences, researchers might have more space to report their methods. Reporting practices at other venues might also differ compared to those at CHI. However, articles published at CHI are often considered representative of all research in HCI (Hornbæk, 2006).
For our final search, we used the following search query:
[Abstract: “user experience”] OR [Abstract: ux] OR [Keywords: “user experience”] OR [Keywords: ux] OR [Title: “user experience”] OR [Title: ux] AND [E-Publication Date: (01/01/2019 TO 12/31/2022)]
We thus searched for the keywords “UX” or “user experience” in the titles, abstracts, and keywords. We further used the ACM DL's “Content Type” filter to include only records classified as “Research Article.” In addition, we used the ACM DL's “Proceedings/Book Names” filter only to include results for the relevant CHI proceedings, one year at a time.
We included all full paper articles reporting empirical studies of UX using scales for quantitative data collection, which gave us the following three inclusion criteria: “full paper,” “empirical study,” and “using scales.”
We focused only on full papers classified as “Research Article” in the ACM DL, thus excluding entries marked as “Extended Abstract,” “Poster,” “Abstract,” “Review Article,” “Demonstration,” “Short Paper,” “Technical Note,” “Tutorial,” or “Panel.” This inclusion criterion was mainly checked for using the ACM DL's “Content Type” filter during the initial search (filtering for “Research Article”) and again assessed during the coding of the final sample.
Due to our focus, we defined “empirical studies of UX” as research projects fitting the following criteria: (a) collect qualitative or quantitative data (b) from users' interactions (c) with a product (d) in an attempt to develop a better understanding of UX. We thus excluded publications that did not contain empirical studies gathering and reporting data from users (e.g., literature reviews, theoretical reflections) or did not consider users' interactions with a product to study UX (e.g., technical investigations of a new artifact without users). This inclusion criterion is comparable to the first criterion used by Bargas-Avila and Hornbæk (2011), where eligible studies were required to report on qualitative or quantitative data collected from users.
To define the term scale in line with our research objective, we used the definition for survey scales by DeVellis (2017). We also decided to include papers using single-item scales from previous literature, such as the Net Promoter Score (NPS, Reichheld, 2003) and the Subjective Mental Effort Question (SMEQ, Zijlstra and Van Doorn, 1985). Thus, we also included all articles reporting on using single-item scales if authors gave a citation for those single items.
Papers only using self-created single items (without a citation) were not eligible, considering they did not fit the chosen definition of a scale. Studies only using non-UX scales (scales used to measure constructs unrelated to UX research) were also non-eligible due to our focus on UX research. Given the broadness of UX, we tried to be inclusive concerning the constructs measured, only excluding obvious cases where this criterion was not met [e.g., we excluded a study that only used a psychedelic drug experience questionnaire (Glowacki et al., 2020)]. However, we did include scales unrelated to UX research if they were used alongside UX-related scales to study topics of UX research. Studies only using scales in preliminary studies (e.g., pilot studies) without any details (e.g., just mentioning that a scale was used without reporting results) were also excluded because coding them with confidence would have been hard, if not impossible.
We conducted our definitive search in the ACM DL on March 22, 2023, yielding 156 search results for our search query. After the initial search, we excluded three records because they were not full papers published as proceedings to CHI (e.g., extended abstracts). Citation info and abstracts for the remaining 153 records were then exported to check for duplicate entries. No duplicate records were identified. Thus, all 153 entries were uploaded into a shared spreadsheet for the creation of our codebook and the coding of eligibility. The final sample screened for eligibility consisted of 37, 43, 30, and 43 unique records for 2019, 2020, 2021, and 2022, respectively. Figure 1 summarizes our complete study selection process as a PRISMA flow diagram. The complete list of all 153 records considered for eligibility can be found in the codebook on OSF.
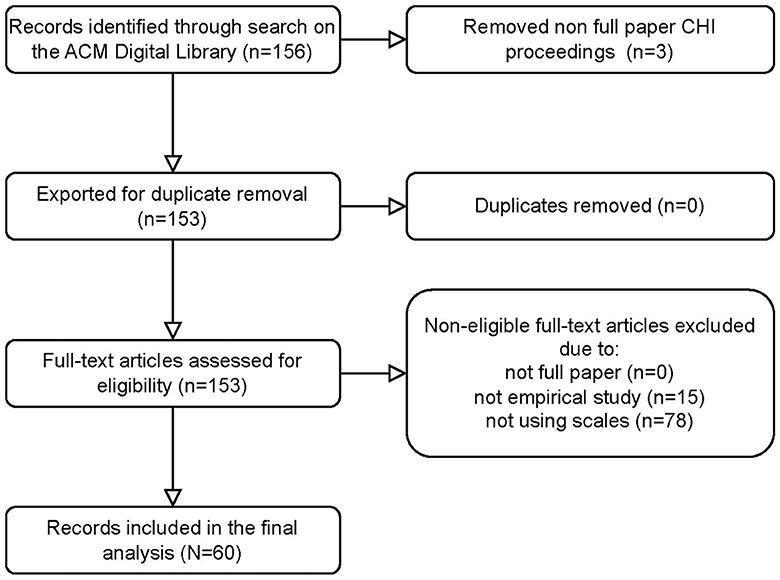
Figure 1. PRISMA flow diagram summarizing the study selection process.
For the data collection, we created a codebook, as recommended in the SQLR procedure (Pickering and Byrne, 2014; Pickering et al., 2015). We aimed to collect all information from the eligible papers relevant to meeting our goals with this codebook. The first author created a draft version of the codebook based on what information would be relevant to extract from the papers to answer the research questions. For an initial quality assessment, the first, second, and sixth authors then coded a random selection of papers (ten, five, and five, respectively), commenting on possible improvements to the codebook. Next, the first and third authors coded a random 10% of papers from the proceedings of CHI '17 to CHI '20 (n = 72, initial sample collected before we decided to focus on the years 2019 to 2022 and before refining our search query to the final version used) to check the quality of the codebook and calculate the overall inter-rater reliability (IRR) of the codings. The IRR for the inclusion criteria (Cohen's Kappa: M = 0.926, min. = 0.838, max. = 1) were almost perfect (Landis and Koch, 1977), and the overall average IRR (Cohen's Kappa: M = 0.803) was substantial (Landis and Koch, 1977). In addition, the first and third authors discussed all disagreements in coding to settle on a final version of the codebook. Before a new coder started coding, they coded a random subset of five papers out of the 10% subset used for IRR calculation to ensure that the new coder would not deviate from the codings of the first and third authors. Calculations for all IRRs can be found in the OSF repository. For the final coding, all 153 records identified through the final search were split up between and coded by the first, second, third, and fourth authors. In total, we assessed 153 full papers for eligibility using our three criteria and coded all relevant information from 60 eligible papers. In addition, the sixth author read through all 60 eligible records for detailed coding of the measured constructs. Thus, each eligible record was examined by at least two authors. Each record's methods section, paper title, and abstract were always read in full detail. At the same time, additional sections, such as the results, were screened using keywords (e.g., the names of scales identified) or fully read as was deemed necessary for answering our research questions. Hard-to-code cases were marked in the codebook and then discussed in regular meetings. The final filled-out version of the codebook can be found on OSF (Perrig et al., 2023).
For each of the 60 eligible papers, we coded all scales used within the paper and what constructs were reported to be measured with both cited and self-developed scales. Whenever a paper reported using a specific scale for the first time, we added that cited scale to our codebook. Whenever another paper reported using that same scale, we added an instance of measurement to that cited scale. We categorized scales as either “cited” or “self-developed.” We did not opt for terms such as validated scale, as this would require us to investigate secondary sources of scale validity. Therefore, survey scales were categorized as cited scales in our data when researchers provided any source for the scale, while self-developed scales did not provide a source. For each eligible paper, we coded what constructs were measured using scales (both cited and self-developed). We consulted the information provided in both the methods and results sections of papers while mainly extracting the wording used for constructs when reporting on the measured results (i.e., terms used for variable names). A construct was only coded once for each paper (i.e., if a construct was measured more than once in a paper, it was counted just the first time it was measured). We further coded if the authors provided any items for the survey scales used, provided a rationale for using a particular scale, and reported evidence of the scale's psychometric quality. Additional outcomes included types of data collected (qualitative, self-reported quantitative, behavioral) and if authors reported adapting cited scales. An example of a code would be as follows: Scale 1 adapted (1/0): did the authors mention adapting the scale in any way (e.g., removing items, rewording items, etc.). Refer to the OSF repository for a criterion catalog with explanations for all codes as part of the codebook.
To analyze the data, we created descriptive summary values, figures, and tables using formulas in the codebook (on Google Sheets) and the statistical software R (R Core Team, 2019, version 4.3.0). Key findings are reported in the following section. The complete codebook and the R-script are available on OSF, containing additional variables beyond those reported here (e.g., type of data gathered).
We assessed a total of 153 full-text articles for eligibility, out of which we deemed 93 entries (60.78%) non-eligible, either because they were not an empirical study of UX interaction (n = 15 or 9.80%) or did not use a scale to study UX (n = 78 or 50.98%). A total of 60 papers remained for the analysis (39.22%). Refer to Figure 1 for an overview of the selection process.
Throughout the 60 eligible papers, we recorded 85 distinct cited scales and 155 instances of measurement where a paper reported using one of those cited scales. For example, one of those 85 scales, the System Usability Scale, was used 14 times across all eligible papers (14 out of 155 instances of measurement). Most cited scales were only employed in one paper (mode = 1; min. = 1; max. = 14), with an average of 1.82 mentions per scale. More specifically, out of the 85 different cited scales, 60 were recorded once (70.59%). On average, authors reported using 1.05 different cited scales in their paper, with a mode of one cited scale used per paper (min. = 0; max. = 8). Across all 155 instances where a paper contained reports of one of the 85 cited scales, the System Usability Scale (SUS, Brooke, 1996) was most frequent with 14 instances of measurement (9.03%), followed by 13 instances for the User Experience Questionnaire (UEQ, Laugwitz et al., 2008, 8.39%), 12 for the NASA Task Load Index (NASA-TLX, Hart and Staveland, 1988, 7.74%), and five instances of measurement coded for the USE questionnaire (USE, Lund, 2001, 3.23%). A summary of the ten most frequently used cited scales is presented in Table 1, and the Supplementary material on OSF contain the complete list of coded scales.
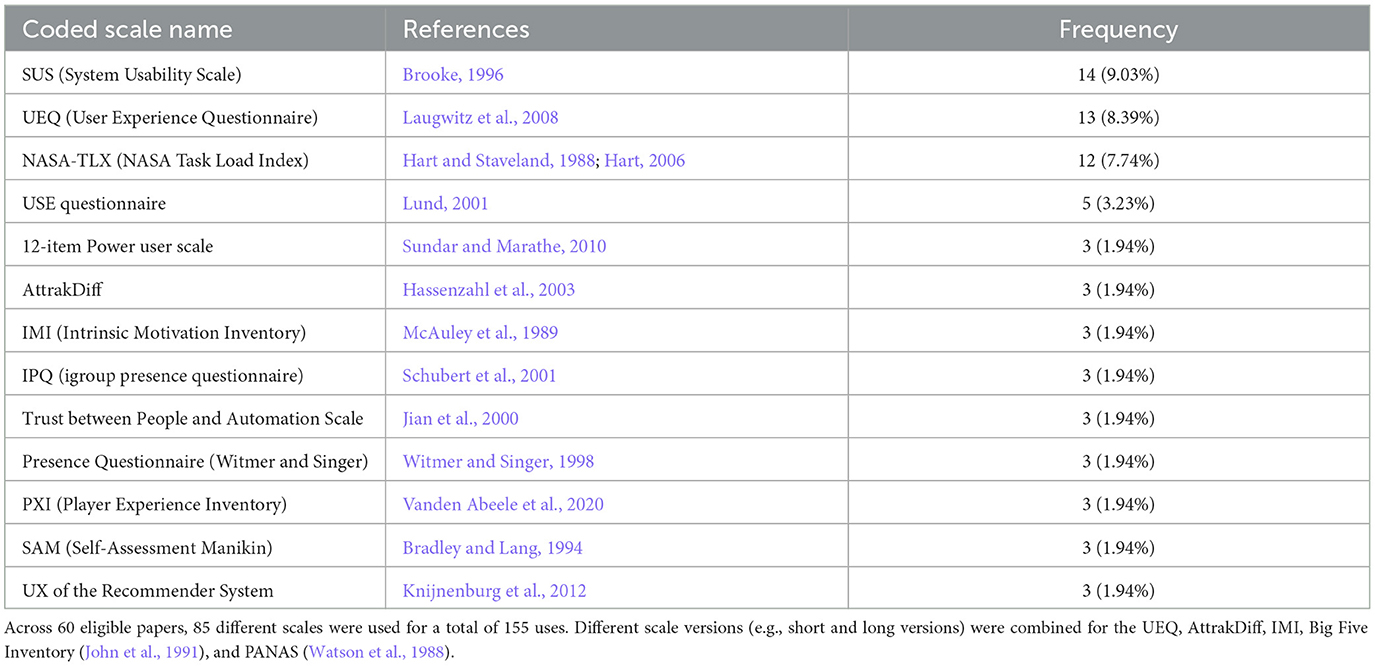
Table 1. Top ten of the most frequently used cited scales in UX research published at CHI '19–'22, identified in the systematic literature review.
Next, we report the types of survey scales used in the eligible articles and how often cited scales were employed compared to self-developed scales. Across all 60 papers examined, 21 reported using self-developed scales for measurement (35.00%), with one article reporting the development of a new survey scale (1.67%). In comparison, 59 of 60 eligible papers reported utilizing at least one cited scale for measurement (98.33%). Of the 60 eligible papers, 39 reported using only cited scales (65.00%), followed by 20 using a mix of cited and self-developed scales (33.33%). One eligible paper reported using exclusively self-developed scales (1.67%). Figure 2 also depicts this distribution of types of scales across eligible papers.
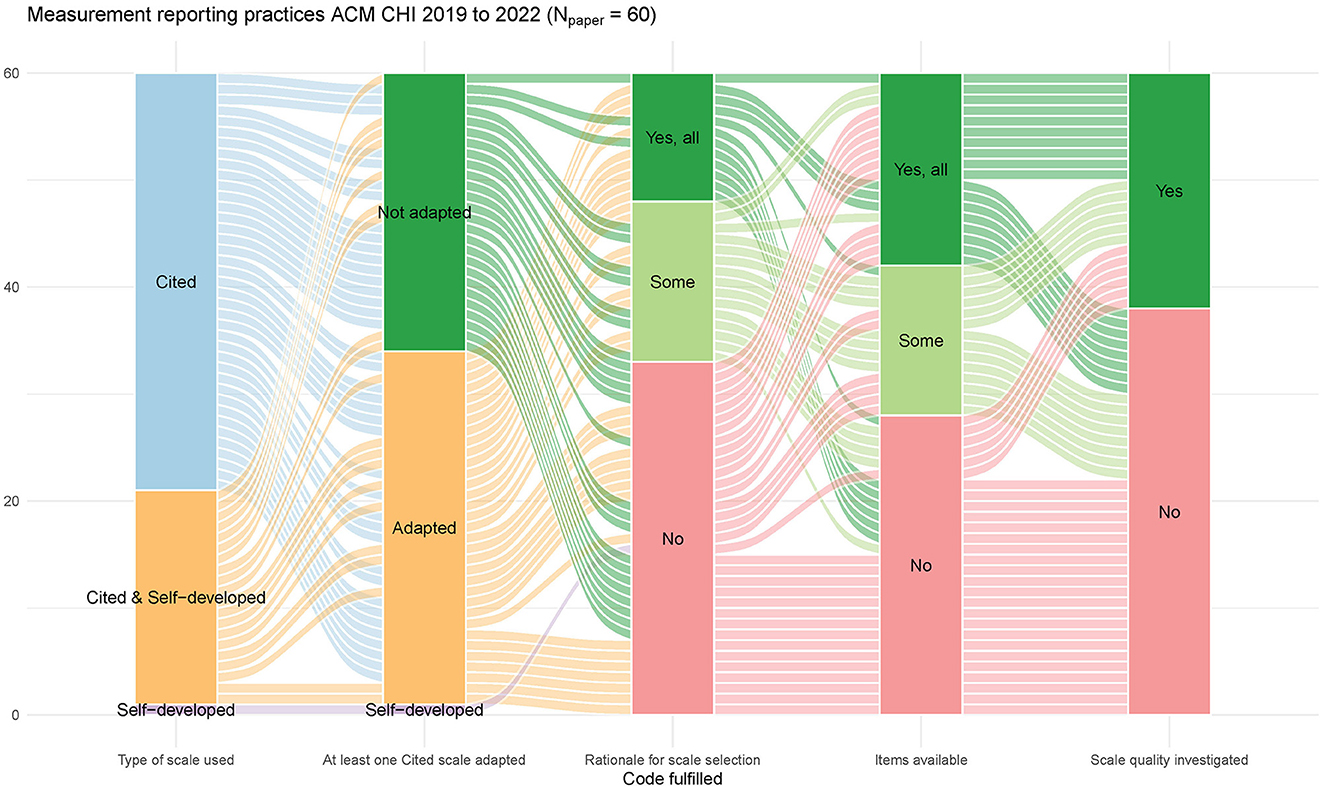
Figure 2. Alluvial plot summarizing frequencies of key measurement practices with survey scales in UX research papers in the proceedings of CHI '19 to '22.
Subsequent coding focused on whether authors reported adapting a cited scale for their work, that is, whether they made changes to the original scale, such as removing certain items or rewording them. Of the 155 instances of measurement where papers reported using a cited scale, 53 (34.19%) stated that the cited scale was adapted. Looking at this from the paper level, we see that 33 out of all 60 eligible papers (55.00%) reported adapting at least one cited scale. This rate of adaption can also be seen in Figure 2. Examples of adaptations included rewording items to fit the study, omitting items deemed irrelevant to the study, or utilizing only specific subscales considered essential to the study context.
We coded 172 distinct constructs across 412 instances where a construct was measured. For example, the distinct construct usability (1/172) was coded 14 times across all eligible papers (14/412). Across all eligible papers, we recorded an average of 5.28 different constructs per paper (mode = 1; min. = 1; max. = 19). Most constructs were only mentioned once (114 out of 172 or 66.28%), with the average mention per construct being 2.40 times (mode = 1; min. = 1; max. = 14). Among all constructs, usability was the most popular construct, studied 14 times (3.40% of the 412 instances of measurement), followed by attractiveness (12 out of 412 or 2.91%), effort (12 or 2.91%), presence (12 or 2.91%), enjoyment (9 or 2.18%), trust (9 or 2.18%), and user experience (9 or 2.18%). Table 2 shows the top ten constructs measured within the sample. In addition, we also looked at which scales were used to measure the most common constructs, which is also summarized in the table.
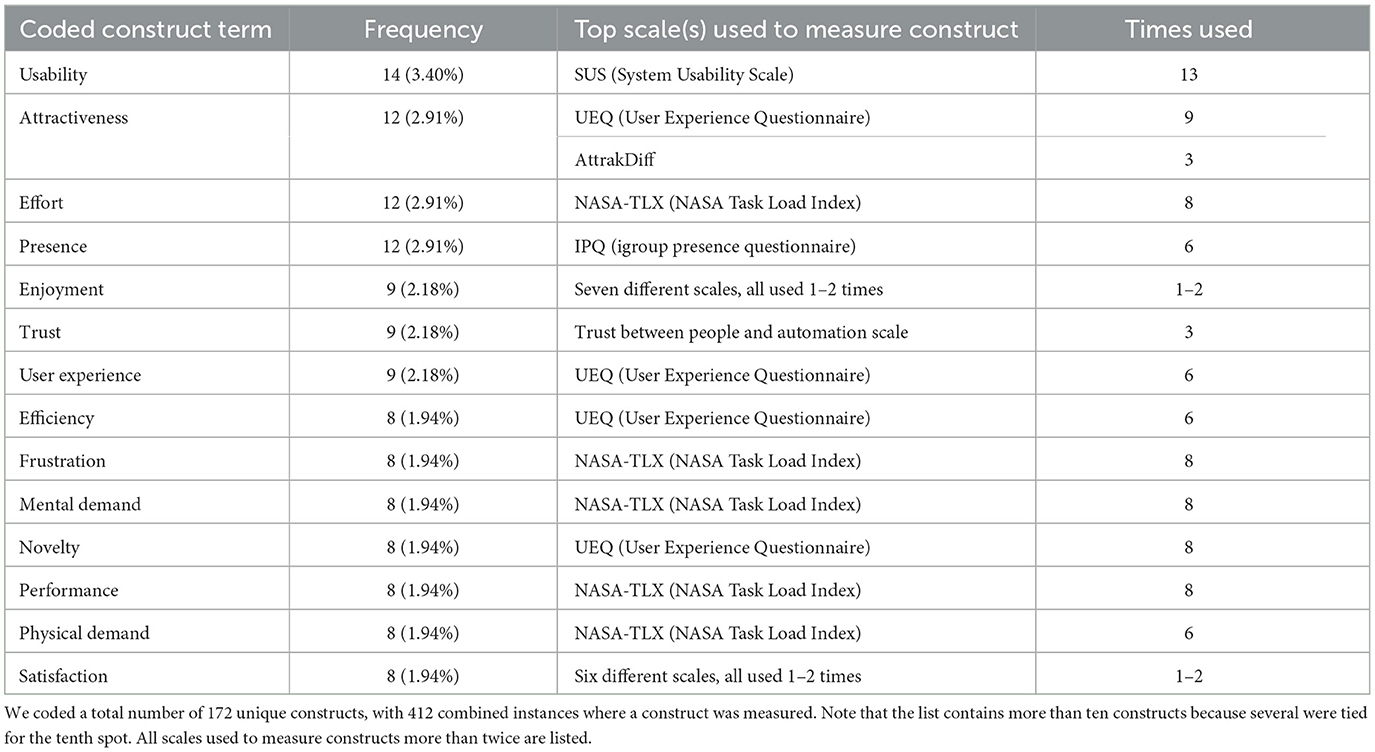
Table 2. Top 10 constructs of UX measured at ACM CHI and the scales used to measure them.
Furthermore, we looked at the co-occurrence of constructs to further understand which constructs researchers consider relevant when studying users' experiences. However, these results are influenced by the constructs measured with subscales of frequently used survey scales, such as the UEQ and NASA-TLX. The network diagram in Figure 3 illustrates the constructs that have been studied at least twice, and it indicates that constructs related to workload (e.g., mental demand, physical demand, effort) are commonly measured together. This is because authors often use individual items of the NASA-TLX to investigate several workload-related constructs. A similar trend is observed with constructs measured using subscales of the UEQ, such as novelty, perspicuity, and attractiveness. In the coded papers, attractiveness was the most central construct, requiring the fewest steps to reach other constructs. The constructs of satisfaction and trust connect several constructs related to the Technology Acceptance Model (Davis et al., 1989) (i.e., ease of use, usefulness, effectiveness) to constructs related to workload and attractiveness. Constructs related to need satisfaction (i.e., competence and autonomy) similarly function as a bridge between user experience constructs and player experience constructs (e.g., challenge, pleasure, immersion).
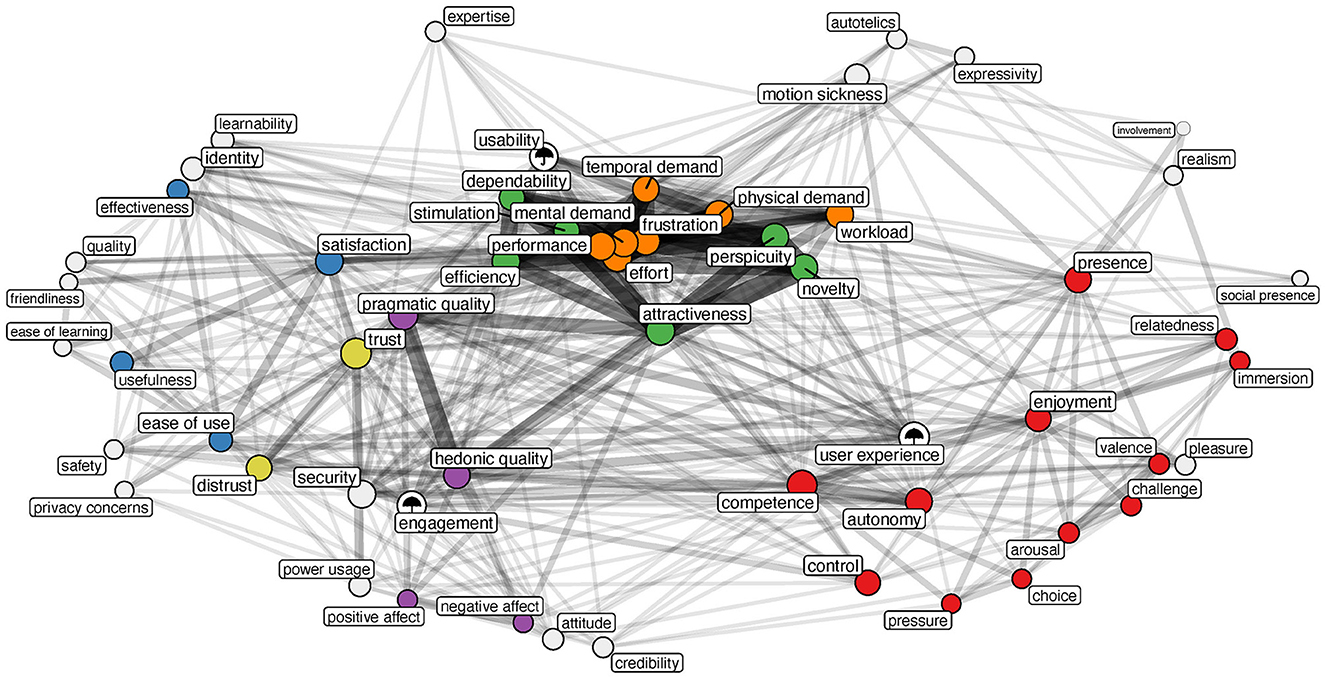
Figure 3. Network depicting the co-occurrence of constructs (weight of the edges) in papers studying user experience. The colors of the nodes indicate clusters of theoretically related constructs (e.g., dimensions of the same survey scale or model).
Further coding concerned whether the authors provided a rationale for using a particular scale in their paper. Whenever a paper contained any reasoning on why a specific scale was chosen for the study (e.g., due to past evidence of a scale's psychometric quality), we coded that paper as providing a rationale for selecting that scale. We did not assess the appropriateness of the rationales but only coded if the authors provided a rationale. More than half of all 60 eligible papers did not provide a rationale for using a particular scale (33 or 55.00%). Fifteen papers (25.00%) contained a partial rationale (i.e., a rationale for selecting some scales but not for all). In comparison, 12 papers contained a complete rationale for all scales used in the study (20.00%). Figure 2 also depicts how many papers provided full, partial, or no rationale.
The subsequent coding concerned whether the authors provided the scales' items, either in the paper or the Supplementary material. Of the 60 eligible papers, 28 lacked reporting of scale items, neither giving example items for all scales nor providing all items for at least one scale used (46.67%). Eighteen papers contained all items of the scale(s) used (30.00%). In comparison, 14 papers (23.33%) contained some items (either all items for some scales or some items for all scales). This is also shown in Figure 2. Considering only those 33 papers where authors reported adapting at least one scale, 11 papers provided all items (33.33%), while seven contained some items (21.21%), and for 15 papers, no items were given (45.45%).
To analyze the frequency and type of psychometric quality evaluations of scales, we coded several common types of quality investigation and the general question of whether authors reported any quality investigation of the scales used. Twenty-two out of all 60 eligible papers contained reporting on any form of quality investigation for the scales used (36.67%), as can also be seen in Figure 2. Among all coded indicators of scale quality, the reliability indicator coefficient alpha was reported most often (20 or 33.33%). One paper reported coefficient omega (1.67%). Concerning evidence for validity, two papers reported an EFA (3.33%), and four papers reported a CFA (6.67%). Six papers reported additional quality investigation methods (10.00%), such as correlations with other scales, correlations between sub-scales, or principal component analysis. Out of those 33 papers where at least one adaption of a cited scale was reported, 21 (63.64%) did not contain any reports on efforts of quality investigation.
We have presented results from a systematic literature review covering 4 years of CHI proceedings (2019 to 2022). The sample, consisting of 153 initially screened and 60 eligible final records, was analyzed to better understand how current UX research uses survey scales and what constructs are measured using survey scales. From this, we derive not only what is measured in UX research but also how well UX research currently follows best practices when employing survey scales and if UX research is at risk of QMPs that threaten the validity of research findings and conclusions. In general, our systematic literature review has provided several clear indicators of QMPs in UX research when survey scales are used. The following section will discuss these results and highlight their implications for scale-based UX research. Finally, we provide recommendations for researchers using scales for measurement, containing accessible information on best practices from fields related to UX research to help future work avoid QMPs.
We use the following section to compare our review's findings with the best practices summarized in the related work. Through this, we provide several indicators of current practice in UX research using scales, showing where best practices are followed or neglected and highlighting where scale-based UX research is at risk of QMPs.
We identified 85 different cited scales, with the majority used only once (70.59%). Such limited common ground regarding the scales used aligns with past findings from Pettersson et al. (2018), where 40% of articles examined used a unique method. Nevertheless, 25 scales from our sample were used more than once (29.41%). The SUS (9.03%) and the NASA-TLX (7.74%) were the first and third most frequently used among all scales. Again, this finding is comparable to past research (Pettersson et al., 2018), where the NASA-TLX and the SUS were among the most commonly used scales. The second most used scale from our sample, the UEQ (8.39%), was not identified to be used as often in past research (Pettersson et al., 2018). Instead, Pettersson et al. (2018) reported that the AttrakDiff (Hassenzahl et al., 2003) was the second most popular scale in their sample. In our study, the AttrakDiff ranked sixth among the most recurring scales, as it was only coded three times. Given that both scales build on the same theoretical model of UX (Hassenzahl, 2001), our results suggest that the newer UEQ has replaced the AttrakDiff (Hassenzahl, 2001), which is in line with recent findings by Diaz-Oreiro et al. (2021).
In our systematic analysis, certain constructs were frequently measured, some of which with the same scale (e.g., “usability” with the SUS in 92.86% of cases). However, many constructs were measured just once (66.28%). The results thus indicate just a few established constructs in UX research. In this regard, for the three most frequently measured constructs, “usability,” “attractiveness,” and “effort,” researchers repeatedly used the same scale (the SUS, UEQ, and the NASA-TLX, respectively). Furthermore, most top constructs were measured with the same two scales (i.e., the UEQ and NASA-TLX). This shows how closely related the scales and some of the constructs frequently measured in UX research are, something also reflected in Figure 3. In comparison, the picture is less clear for other constructs, such as “enjoyment,” where multiple scales were used just once or twice, providing little evidence for any shared terminology or common acceptance of specific scales. This suggests that UX researchers share agreement on what scales to use when measuring classical usability constructs (i.e., “usability,” “workload”), while such consensus is lacking in regard to other constructs. Our results further suggest that UX research is still heavily influenced by usability research while having difficulty reaching common ground on what constructs are essential to UX beyond usability. The low agreement among UX researchers on what specific scales to use for particular constructs is concerning, considering that repeated use of the same survey scales brings a key benefit: comparability of results across research. If UX researchers do not share common ground on what scales to use for the same constructs across studies, results can only be compared with limited confidence. This diminished comparability confounds UX research because researchers cannot separate variations in findings introduced by a difference in methods (e.g., using various scales for the same construct) from actual differences relevant to the research focus (e.g., differences caused by experimental manipulations). Finally, the popularity of measuring constructs such as “user experience” and “usability” as distinct constructs may pose additional risks to UX research, given that they can be considered “umbrella constructs.” Such constructs tend to be very broad concepts with little agreement among researchers on how to define or measure them, thus complicating the communication and accumulation of knowledge in HCI research (see Tractinsky, 2018, for a detailed discussion).
Our review revealed that the majority of papers relied on cited scales only (65.00%), while around a third of articles reported using a mix of self-developed and cited scales. These results stand in contrast to what was reported in previous investigations. Both Bargas-Avila and Hornbæk (2011) and Pettersson et al. (2018) found an apparent over-reliance on self-developed scales compared to standardized scales. This discrepancy suggests that UX research has learned from past oversights, relying less on self-developed scales. However, in contrast to previous work, we strictly defined what is and is not a survey scale. In addition, we refrained from talking about standardized and validated scales, opting for the term “cited scales” instead. Thus, while our criterion for a scale to be classified as such arguably was harsher, the bar for a scale to be classified as not self-developed was likely lower. Unfortunately, a complete comparison of our results with past research is not possible because neither Bargas-Avila and Hornbæk (2011) nor Pettersson et al. (2018) provided details on what exactly they understood as “standardized,” “validated,” or “self-developed” scales. We conclude that UX researchers frequently cite a source when employing a survey scale. However, such a citation alone is insufficient proof of a scale's quality, leaving UX research vulnerable to QMPs, if additional best practices are neglected.
As stated in the related work, scale adaptions can affect a scale's quality (Juniper, 2009; Furr, 2011; Flake and Fried, 2020). Survey scales are ideally created with great rigor in a designated study, which gives them many advantages compared to self-developed scales often constructed without such consideration (Nunnally, 1978). If one adapts a survey scale, these advantages can be lost (Juniper, 2009; Furr, 2011). Within our sample, we observed that UX researchers frequently adapt cited scales. While most articles in our sample used at least one cited scale, these cited scales were adapted in over a third of all cases (34.19%). These results are consistent with recent findings from PX research, where 38.71% of articles reported on adapting the cited scale used (Aeschbach et al., 2021). Such adaptions raise the question of whether the cited scales retain their original quality and still measure what they were initially designed to measure (Furr, 2011). While some adaptions are justifiable (e.g., adapting the wording of items to the study context), they need to be transparently reported, so readers and reviewers can judge their legitimacy. This includes clear reasoning for those adaptions. In addition, the quality of survey scales needs to be re-investigated whenever they are adapted (Furr, 2011). Such re-investigation was rare in our sample, with two-thirds (63.64%) of papers reporting on an adaption not containing results from any quality re-investigation. Besides potentially affecting the quality of a scale, adaptions also reduce the comparability of survey scale results across papers (Flake and Fried, 2020). This makes it difficult for UX research to achieve generalizable and comparable findings across multiple studies. The high rate of adaptation in UX research also suggests that researchers struggle to find appropriate scales for the purpose and context of their studies. One reason why UX researchers often adapt existing survey scales could be dissatisfaction with current scales because they are not well developed (i.e. they lack quality) or have limited applicability to their research context. Considering the age of some of the most popular scales identified in our study, such as the SUS and NASA-TLX, which are up to several decades old, it is conceivable that these scales no longer fit current technology, prompting researchers to adapt them. Given the frequency of scale adaptation in UX research, there appears to be a need for newly developed or appropriately adapted survey scales of high psychometric quality, offering considerable research and development potential.
When scales are used, selecting an appropriate scale to measure a particular construct is essential in research. Not providing a rationale for choosing a scale makes it difficult for readers and reviewers to make an informed judgment about the appropriateness of a scale for the research at hand. It also makes it hard to determine whether the scale was carefully developed or merely consists of self-developed items taken from previous research (Aeschbach et al., 2021). While not providing a rationale for measurement selection does not mean that no such thought process has taken place (Ekkekakis and Russell, 2013), a lack of transparently reporting such a rationale leaves readers and reviewers in the dark (Flake and Fried, 2020). Therefore, researchers need to provide their rationale for choosing a particular scale. However, the results show that many papers do not provide a rationale for any scales used (55.00%), with only a fraction of all articles providing a complete rationale for all scales (20.00%). These findings are consistent with recent results from PX research, where only 19.05% of scale choices had a reported rationale (Aeschbach et al., 2021). Despite the rarity of rationales, there were instances where authors provided a good rationale for choosing a scale, such as the following for the UEQ: “The User Experience Questionnaire (UEQ) [20] was chosen to assess the attractiveness and perceived novelty of the different conditions. We relied on the UEQ novelty scale to assess perceived novelty, an approach that has been mentioned before to investigate the impact of novelty in HCI research [19]. The UEQ has been found to show high convergent validity, and the reliability (Cronbach's alpha) ranges from acceptable to good [20].” (Rutten and Geerts, 2020, p. 539). In this example, the authors clearly stated which constructs they measured with the UEQ and why they measured these constructs. In addition, they provided a source for why they relied on the scale to measure the construct “novelty” and cited evidence for the psychometric quality of the UEQ.
As mentioned in the related work section, providing all items used during research can help increase transparency and allow readers to assess the methods' adequacy. The results show that providing all items is not common in UX research. Almost half of all papers (46.67%) failed to fulfill the criterion of providing at least some items for the scales used. Results paint a similar picture concerning articles where an adaption to a cited scale was reported. This is in line with past UX research, where it was found that 51% of studies used self-developed scales without reporting any items (Bargas-Avila and Hornbæk, 2011). Findings thus suggest that UX research lacks transparency regarding the scale items used. Such opaqueness regarding the items of a scale can hide many QMPs (Flake and Fried, 2020), thus causing several issues for UX research that need to be addressed. It is not uncommon for survey scales to exist in different versions. For example, both the UEQ and its short version, the UEQ-S, were reportedly used within our sample. In addition, there often are various language versions of the same scale (e.g., the UEQ is available in more than 30 languages according to the official website for the UEQ).3 Each scale version has distinct psychometric properties, possibly delivering different results. If authors of a study do not clarify which exact items they worked with, readers cannot judge which version of a scale was used, if or how items were adapted, and how adequate the items were for the overall research effort. In addition, replication attempts are also hindered when items are not shared (Wacharamanotham et al., 2020), and the comparability of results across research is threatened (Flake and Fried, 2020).
A survey scale's psychometric quality needs to be re-evaluated whenever a scale is used in a study (Furr, 2011). As the related work section mentioned, researchers should calculate and report evidence for a scale's reliability (e.g., coefficient alpha and omega) and validity (e.g., EFA and CFA). Survey scales are situated in their initial development and current context of use (Cairns and Power, 2018). Aside from a direct replication, both contexts have a distinct sample and a specific study setting. A scale's psychometric properties cannot be assumed equal across samples (Furr, 2011). Therefore, researchers should re-investigate the scale quality in a new research context to acknowledge these contextual limitations. Furthermore, whenever a scale is adapted, it is unclear if the adaption affects its quality (Juniper, 2009; Furr, 2011; Flake and Fried, 2020). Therefore, researchers adapting a scale always need to investigate the quality of their adapted version (Furr, 2011). In most papers from our sample, not even basic scale reliability or validity indicators were calculated, with only 36.67% reporting on any quality investigation. In addition, the finding that coefficient alpha was reported most often (33.33% across all papers) is concerning, considering that coefficient alpha has seen heavy criticism in the past and is regarded as insufficient evidence for a scale's quality (Dunn et al., 2014). In our sample, only one paper (Bowman et al., 2021) reported coefficient omega while explicitly acknowledging its advantages over coefficient alpha. This finding suggests that many UX researchers are unaware of current practices within psychometrics, likely due to a lack of training and knowledge about best practices, exposing UX research to QMPs. Such an explanation would align with concerns raised in Law et al. (2014) regarding a need for enhanced training and education on measurement in UX research.
Concerning those papers that explicitly stated adapting a scale, the rate of quality investigation is comparably low (36.36%). These findings show that scales are frequently used in UX research without re-investigating the scale's quality. Without such re-investigations, researchers cannot be sure that the scale performed as expected in their study setting, especially if adapted, jeopardizing the confidence in the data gathered with those scales. However, there were also positive examples in the sample where such investigations were reported: One eligible paper (Zhu et al., 2022) calculated coefficient alpha and an EFA after translating a scale and adapting it to the study context to ensure that the scale still performed as expected. A second eligible paper (Li and Caine, 2022) performed a CFA to ensure that the measures they used for a construct were consistent with their understanding of that construct. These two examples show that it is reasonable to expect UX researchers to investigate the quality of their scales, especially after adapting them to the study context. If reviewers and readers expected the reporting of such quality re-investigations in cases where scales were used in UX research, it would be one step toward improved measurement practices in UX research.
Based on the reported results, we conclude that UX research is at risk of QMPs because best practices are frequently neglected. Across all papers using any type of scale (cited, self-developed, or both), we found just one (Lan et al., 2022) that followed all appropriate best practices (either not adapting or using only self-developed scales, giving a rationale for all scales, providing all items, and investigating scale quality). Although the fact that just one article fulfilled all best practice criteria appears surprising at first, we want to emphasize that a substantial part of QMPs comes down to nontransparent reporting (Flake and Fried, 2020). In our review, we coded whatever information the authors provided in their papers. It is reasonable to assume that authors sometimes performed certain best practices during the measurement process (e.g., choosing a specific scale based on a rationale) but did not report on it. Therefore, the best practice criteria considered here are relatively strict when aggregated, thus painting a precarious picture. With improved reporting practices, many of these issues could be addressed or at least mitigated, which would considerably improve measurement practices in UX research.
Recent efforts toward open science in HCI, such as fostering greater transparency and sharing of materials (Wacharamanotham et al., 2020), or calls to preregister CHI experiments (Cockburn et al., 2018), have laid the groundwork for research that produces robust findings by making research more reproducible and replicable, mitigating questionable research practices. However, QMPs also threaten the validity of scientific research. They decrease trust in both the data gathered and the conclusions of a study as a whole (Flake and Fried, 2020). Proper use of survey scales and improved reporting thus is of utmost importance for the field of UX research, given the wide-spread use of such scales for measurement (Bargas-Avila and Hornbæk, 2011; Pettersson et al., 2018). Furthermore, greater agreement on what scales to measure with and what terminology to use for the constructs measured would help make UX research more comparable across papers, promoting theory-building in the UX field. Our systematic literature review has shown that adherence to best practices needs to be improved, and reporting in scale-based UX research needs to be more transparent. To mitigate future QMPs in UX research, we provide recommendations in the following section on how to use survey scales in adherence to best practices and what to report on if scales were employed as part of a study.
Motivated by the problems identified in this systematic literature review, we present six steps researchers should take when measuring constructs using scales for improved measurement and reporting practices in scale-based UX research. Our recommendations build on previous work by Flake and Fried (2020) and Aeschbach et al. (2021).
First, researchers need to evaluate whether measurement with survey scales is appropriate. This choice of method needs to be based on the research question or the problem investigated (Greenberg and Buxton, 2008). If the contribution to HCI is theoretical (e.g., new models or frameworks) or an artifact (e.g., a new system or technique), it may not be necessary to employ empirical studies using survey scales (Wobbrock and Kientz, 2016). When the research question does not require scales, it is better not to use them at all than to misuse them.
Clearly defining all constructs of interest is essential because poor definitions threaten the validity of a study on multiple levels, from the validity of the scale to the validity of the findings beyond the study context (MacKenzie, 2003). In addition, being transparent about the definitions of constructs and the rationale for why researchers selected specific measures is crucial in preventing misunderstandings regarding what the researchers wanted to measure with the scale (Flake and Fried, 2020). For this step, researchers need to review existing definitions from related research and commit to one, or–if not satisfied–write a new definition. MacKenzie (2003) lists four aspects of a good definition that can serve as a guide: “Good definitions should (a) specify the construct's conceptual theme, (b) in unambiguous terms, (c) in a manner that is consistent with prior research, and that (d) clearly distinguishes it from related constructs. A good definition should also specify the extent to which values of the construct are expected to differ across cases, conditions, and time. Also, when the construct is conceptualized as being multidimensional, the relations between the subdimensions and the superordinate construct should be specified” (MacKenzie, 2003, p. 325).
Next, researchers should review scales that have already been used in UX research to measure the target construct, and then read the original paper(s) for the scale. They should verify that the definitions and theory underlying the scale and its constructs match the definition chosen in the previous step, and be aware that by choosing a specific scale, an indirect commitment to its underlying theory is made (DeVellis, 2017). Also, the researchers should consider existing evidence for the quality of a survey scale when making the choice (Flake and Fried, 2020). If the theory and definitions behind the chosen scale do not fit the research purpose, they should consider adapting the definition or searching for a scale that better serves the purpose. Standardized scales should be used wherever possible (Hornbæk, 2006). If there is no suitable existing standardized scale, a new scale should be developed following best practices for scale development. Adhering to these first three steps would likely have positively impacted the 48 cases in our sample that did not provide a complete rationale for all selected scales (80.00%), as considerations about why one should use a scale in the first place, how one defines one's target construct, and which scale best fits that definition should inform the rationale for scale selection.
Once the researchers have decided on a scale for the study, they need to implement it as closely as possible to the published version of the scale. They need to be aware that even minor adaptions can change the quality of a scale (Juniper, 2009). Thus, they have to ensure that the items are worded correctly, and the scale format is correct (e.g., seven-point Likert-type scale). The scale should only be adapted when necessary, and each adaption needs to be justified and recorded. After data collection, composite item scores should be formed by following the original scale authors' instructions, if provided. In our sample, adherence to this step would have impacted the 33 papers (55.00%) in which at least one cited scale was adapted by getting researchers to think about why they were adapting a scale in the first place while ensuring that they documented what they were adapting and why.
Survey scales are limited by their initial development process and the context of use (Cairns and Power, 2018). Therefore, before analyzing the data gathered, researchers need to make sure that the scale meets certain quality criteria given the research context. If the sample size is sufficient, they should calculate both indicators for a scale's reliability (e.g., coefficients alpha and omega) and validity (e.g., EFA and CFA). At the very least, they need to search for and report on past evidence for the scale's psychometric quality. Following this recommendation would have positively affected the 38 cases in our sample that did not report on any scale quality investigation (63.33%), and especially the 21 out of 33 cases where a scale was adapted but no quality re-investigation was reported (63.64%). Furthermore, reporting on evidence of scale quality from prior work would, in turn, have influenced the coding of giving a rationale for scale selection.
When writing up their work, researchers need to report on the entire measurement process, which followed the above steps, as transparently as possible. They should report on relevant definitions and theories behind the scale(s) used. Additionally, they need to explain their rationale for scale selection, including past evidence for scale quality, and give precise detail on how the scale(s) were implemented, including exact wording for all items. Furthermore, they ought to report any adaptions made, including justification, and report on evidence from the re-investigation into the quality of the scale(s) used. Providing all this information helps readers and reviewers reach an informed judgment of the methods' adequacy. It is also a crucial step toward preventing QMPs in future UX research. In addition, it helps other researchers replicate the study. Considering that this final step requires researchers to report transparently on all previous steps, compliance with this recommendation would have had a positive impact on all papers from our sample that we coded as containing evidence for at least one of the QMPs we considered in our review, or rather not containing enough evidence to conclude without doubt that best practices were followed (59 out of 60 or 98.33%).
First, we only considered the CHI conference proceedings in our sample. CHI has been considered prototypical of the rest of HCI research (Hornbæk, 2006). Thus, our findings indicate how well UX researchers follow best practices when using survey scales for data collection. Nevertheless, other venues for UX research besides CHI arguably have different reporting standards and distinct research cultures, possibly leading to higher or lower adherence to best practices. Thus, comparisons with other venues for UX research would be an opportunity for future work. Second, the results consider UX measurement from the perspective of published research and not of UX practitioners. Future work could explore the current industry practice on how survey scales are used in applied research by conducting interviews with practitioners or examining industry projects. Third, our work focused on quantitative research using scales, not looking at qualitative UX research and other quantitative methods for gathering data. However, given that scales are among the most commonly used methods in UX research (Pettersson et al., 2018), our investigation provides valuable insights into a vital part of UX research. In addition, QMPs mainly pose a threat to scale-based research. Thus, an inquiry into other research methods was out of scope. Fourth, while our review covered an extensive set of 60 eligible papers across four years of UX research published at CHI, the fragmented nature of the results regarding the scales and constructs identified made it impossible for us to break down our analysis further, for example differentiating application areas or types of UX research. Given a larger dataset, such a breakdown could deliver insight into whether and how various areas of UX research differ concerning QMPs. Finally, while we improved on the limitations of earlier work by explicitly defining what we mean by standardized, cited, and self-developed scales, we acknowledge that other definitions might be possible. Further, we were unable to distinguish between standardized scales and cited scales in our coding. While we defined the difference between these types of scales, coding them separately would have required us to investigate secondary sources of scale validity, which was out of the scope of this research.
Future research could apply our approach to other venues besides CHI. Moreover, records for different years, both more distant and future, could be analyzed to search for additional indications of QMPs in UX research. Beyond coding additional venues, future work could expand on our codebook, which we provide on OSF, to create a more comprehensive dataset of UX research. Once expanded, researchers could break down the results per application area, such as the various scales and constructs, to see if there are differences between areas of UX research regarding the prevalence and type of QMPs. In addition, definitions of constructs in UX research or statistical analyses of data collected with survey scales could also be investigated in future systematic reviews. These steps of the research process are also vulnerable to QMPs (Flake and Fried, 2020) but were out of this project's scope. Furthermore, as stressed before, our work focused on what authors actually report on in their papers. While transparent reporting is essential regarding QMPs, we cannot exclude that authors actually adhered to certain best practices but chose not to report them, for example, due to page or word limits. Thus, future work could use alternative methods, such as surveys contacting UX researchers, to see how prevalent QMPs are, comparable to past work conducted regarding the prevalence of QRPs (Baker, 2016). Finally, future work could explore the most frequently used cited scales we identified in detail, investigating the validity of these scales, as was done in recent research from social and personality psychology (Flake et al., 2017; Hussey and Hughes, 2020).
This article reported a systematic quantitative literature review of four years of UX research published at CHI. We specifically examined how survey scales are used in UX research, which constructs are studied, and which scales are used to measure them. We investigated how frequently adherence to current best practices for using survey scales is reported in UX research papers. We considered a total of 153 articles from the proceedings of CHI '19 to '22 for eligibility screening, including 60 full-paper articles reporting empirical UX research using survey scales in the analysis. Results show that best practices are frequently neglected when using scales. Researchers rarely provide a complete rationale for choosing their scales (20.00%), often adapt scales (34.19%), and rarely report on investigations of scale quality (36.67%). In addition, transparency regarding the scale items used is lacking, with only a third of authors (30.00%) providing all items used in a study. Furthermore, results revealed 172 different constructs and 85 unique scales, alongside the fact that 70.59% of scales were only employed once, while 66.28% of constructs were only measured once. While this speaks to the diversity of scale-based UX research, it also comes with a risk of misunderstandings and limited agreement among UX researchers on what to measure and how to measure using survey scales, possibly hindering research progress. If current best practices are not adhered to, UX research risks questionable measurement practices that compromise the validity of the survey scales used, the findings of the respective studies, and scale-based UX research as a whole. To support the increased uptake of state-of-the-art psychometric practice, we recommend a six-step process for improved measurement in UX research. We hope to contribute to future UX research with these six steps by promoting more rigorous adherence to best practices when using scales. Through this, UX research can address concerns from adjacent fields regarding questionable measurement practices that threaten scale-based research's validity. In addition, we hope our recommendations will improve conditions for future UX research employing survey scales, promoting a deeper understanding of UX in general.
The datasets presented in this study can be found in online repositories. The names of the repository/repositories and accession number(s) can be found below: OSF (https://doi.org/10.17605/OSF.IO/DGQ6B).
SP: Conceptualization, Data curation, Formal analysis, Investigation, Methodology, Project administration, Writing – original draft, Writing – review & editing, Visualization. LA: Conceptualization, Investigation, Methodology, Writing – review & editing. NS: Investigation, Methodology, Writing – review & editing. NF: Data curation, Investigation, Validation, Writing – review & editing. KO: Conceptualization, Funding acquisition, Supervision, Writing – review & editing. FB: Conceptualization, Formal analysis, Investigation, Methodology, Supervision, Visualization, Writing – review & editing.
The author(s) declare that no financial support was received for the research, authorship, and/or publication of this article.
A previous version of this work has been published as a preprint on PsyArXiv (Perrig et al., 2022).
The authors declare that the research was conducted in the absence of any commercial or financial relationships that could be construed as a potential conflict of interest.
All claims expressed in this article are solely those of the authors and do not necessarily represent those of their affiliated organizations, or those of the publisher, the editors and the reviewers. Any product that may be evaluated in this article, or claim that may be made by its manufacturer, is not guaranteed or endorsed by the publisher.
1. ^https://doi.org/10.17605/OSF.IO/29ZYA
3. ^https://www.ueq-online.org, accessed on January 10, 2024.
Aeschbach, L. F., Perrig, S. A. C., Weder, L., Opwis, K., and Brühlmann, F. (2021). “Transparency in measurement reporting: a systematic literature review of CHI PLAY,” in Proceedings ACM Human-Computer Interaction 5(CHI PLAY). doi: 10.1145/3474660
Baker, M. (2016). 1,500 scientists lift the lid on reproducibility. Nature 533, 452–454. doi: 10.1038/533452a
Bargas-Avila, J. A., and Hornbæk, K. (2011). “Old wine in new bottles or novel challenges: a critical analysis of empirical studies of user experience,” in Proceedings of the SIGCHI Conference on Human Factors in Computing Systems, CHI '11 (New York, NY, USA: Association for Computing Machinery), 2689–2698. doi: 10.1145/1978942.1979336
Bowman, N. D., Lin, J. T., and Wu, C. (2021). “A chinese-language validation of the video game demand scale (VGDS-C): measuring the cognitive, emotional, physical, and social demands of video games,” in Proceedings of the 2021 CHI Conference on Human Factors in Computing Systems, CHI '21 (New York, NY, USA: Association for Computing Machinery), 1–10. doi: 10.1145/3411764.3445348
Bradley, M. M., and Lang, P. J. (1994). Measuring emotion: the self-assessment manikin and the semantic differential. J. Behav. Ther. Exper. Psychiat. 25, 49–59. doi: 10.1016/0005-7916(94)90063-9
Brown, T. A. (2015). Confirmatory Factor Analysis for Applied Research. New York, NY, USA: The Guilford Press.
Caine, K. (2016). “Local standards for sample size at CHI,” in Proceedings of the 2016 CHI Conference on Human Factors in Computing Systems, CHI '16 (New York, NY, USA: Association for Computing Machinery), 981–992. doi: 10.1145/2858036.2858498
Cairns, P., and Power, C. (2018). Measuring Experiences, chapter 5. Cham, Switzerland: Springer International Publishing.
Cockburn, A., Gutwin, C., and Dix, A. (2018). “HARK no more: on the preregistration of CHI experiments,” in Proceedings of the 2018 CHI Conference on Human Factors in Computing Systems (New York, NY, USA: Association for Computing Machinery), 1–12. doi: 10.1145/3173574.3173715
Cronbach, L. J. (1951). Coefficient alpha and the internal structure of tests. Psychometrika 16, 297–334. doi: 10.1007/BF02310555
Davis, F. D., Bagozzi, R. P., and Warshaw, P. R. (1989). User acceptance of computer technology: a comparison of two theoretical models. Manag. Sci. 35, 982–1003. doi: 10.1287/mnsc.35.8.982
DeVellis, R. F. (2017). Scale Development: Theory and Applications. Thousand Oaks, CA, USA: SAGE Publications, Inc.
Díaz-Oreiro, I., López, G., Quesada, L., and Guerrero, L. A. (2021). UX evaluation with standardized questionnaires in ubiquitous computing and ambient intelligence: a systematic literature review. Adv. Hum. Comput. Inter. 2021, 1–22. doi: 10.1155/2021/5518722
Dunn, T. J., Baguley, T., and Brunsden, V. (2014). From alpha to omega: a practical solution to the pervasive problem of internal consistency estimation. Br. J. Psychol. 105, 399–412. doi: 10.1111/bjop.12046
Ekkekakis, P., and Russell, J. A. (2013). The Measurement of Affect, Mood, and Emotion: A Guide for Health-Behavioral Research. Cambridge, UK: Cambridge University Press. doi: 10.1017/CBO9780511820724
Flake, J. K., and Fried, E. I. (2020). Measurement schmeasurement: questionable measurement practices and how to avoid them. Adv. Methods Pract. Psychol. Sci. 3, 456–465. doi: 10.1177/2515245920952393
Flake, J. K., Pek, J., and Hehman, E. (2017). Construct validation in social and personality research: Current practice and recommendations. Soc. Psychol. Person. Sci. 8, 370–378. doi: 10.1177/1948550617693063
Furr, R. M. (2011). Scale Construction and Psychometrics for Social and Personality Psychology. London, UK: SAGE Publications Ltd. doi: 10.4135/9781446287866
Gault, R. H. (1907). A history of the questionnaire method of research in psychology. Pedag. Semin. 14, 366–383. doi: 10.1080/08919402.1907.10532551
Glowacki, D. R., Wonnacott, M. D., Freire, R., Glowacki, B. R., Gale, E. M., Pike, J. E., et al. (2020). “Isness: using multi-person VR to design peak mystical type experiences comparable to psychedelics,” in Proceedings of the 2020 CHI Conference on Human Factors in Computing Systems, CHI '20 (New York, NY, USA: Association for Computing Machinery), 1–14. doi: 10.1145/3313831.3376649
Greenberg, S., and Buxton, B. (2008). “Usability evaluation considered harmful (some of the time),” in Proceedings of the SIGCHI Conference on Human Factors in Computing Systems, CHI '08 (New York, NY, USA: Association for Computing Machinery), 111–120. doi: 10.1145/1357054.1357074
Hart, S. G. (2006). “Nasa-task load index (NASA-TLX); 20 years later,” in Proceedings of the Human Factors and Ergonomics Society Annual Meeting, 904–908. doi: 10.1177/154193120605000909
Hart, S. G., and Staveland, L. E. (1988). “Development of NASA-TLX (task load index): results of empirical and theoretical research,” in Human Mental Workload, eds. P. A. Hancock, and N. Meshkati (Amsterdam, the Netherlands: Elsevier Science Publishers B.V. (North-Holland)), 139–183. doi: 10.1016/S0166-4115(08)62386-9
Hassenzahl, M. (2001). The effect of perceived hedonic quality on product appealingness. Int. J. Hum. Comput. Inter. 13, 481–499. doi: 10.1207/S15327590IJHC1304_07
Hassenzahl, M., Burmester, M., and Koller, F. (2003). “AttrakDiff: Ein Fragebogen zur Messung wahrgenommener hedonischer und pragmatischer Qualität [AttrakDiff: A questionnaire for measuring perceived hedonic and pragmatic quality],” in Mensch &Computer 2003: Interaktion in Bewegung (Wiesbaden, Germany: Vieweg+Teubner Verlag), 187–196. doi: 10.1007/978-3-322-80058-9_19
Hopkins, K. D. (1998). Educational and Psychological Measurement and Evaluation. London, UK: Pearson.
Hornbæk, K. (2006). Current practice in measuring usability: challenges to usability studies and research. Int. J. Hum. Comput. Stud. 64, 79–102. doi: 10.1016/j.ijhcs.2005.06.002
Hornbæk, K., and Law, E. L.-C. (2007). “Meta-analysis of correlations among usability measures,” in Proceedings of the SIGCHI Conference on Human Factors in Computing Systems, CHI '07 (New York, NY, USA: Association for Computing Machinery), 617–626. doi: 10.1145/1240624.1240722
Hussey, I., and Hughes, S. (2020). Hidden invalidity among 15 commonly used measures in social and personality psychology. Adv. Methods Pract. Psychol. Sci. 3, 166–184. doi: 10.1177/2515245919882903
Jian, J.-Y., Bisantz, A. M., and Drury, C. G. (2000). Foundations for an empirically determined scale of trust in automated systems. Int. J. Cogn. Ergon. 4, 53–71. doi: 10.1207/S15327566IJCE0401_04
John, O. P., Donahue, E. M., and Kentle, R. L. (1991). Big Five Inventory (BFI) [Database record]. APA PsycTests. doi: 10.1037/t07550-000
Juniper, E. F. (2009). Validated questionnaires should not be modified. Eur. Respir. J. 34, 1015–1017. doi: 10.1183/09031936.00110209
Knijnenburg, B. P., Willemsen, M. C., Gantner, Z., Soncu, H., and Newell, C. (2012). Explaining the user experience of recommender systems. User Model. User-Adapt. Inter. 22, 441–504. doi: 10.1007/s11257-011-9118-4
Lan, X., Wu, Y., Shi, Y., Chen, Q., and Cao, N. (2022). “Negative emotions, positive outcomes? Exploring the communication of negativity in serious data stories,” in Proceedings of the 2022 CHI Conference on Human Factors in Computing Systems, CHI '22 (New York, NY, USA: Association for Computing Machinery), 1–14. doi: 10.1145/3491102.3517530
Landis, J. R., and Koch, G. G. (1977). The measurement of observer agreement for categorical data. Biometrics 33, 159–174. doi: 10.2307/2529310
Laugwitz, B., Held, T., and Schrepp, M. (2008). “Construction and evaluation of a user experience questionnaire,” in HCI and Usability for Education and Work, ed. A. Holzinger (Berlin, Heidelberg, Germany: Springer Berlin Heidelberg), 63–76. doi: 10.1007/978-3-540-89350-9_6
Law, E. L.-C., van Schaik, P., and Roto, V. (2014). Attitudes towards user experience (UX) measurement. Int. J. Hum. Comput. Stud. 72, 526–541. doi: 10.1016/j.ijhcs.2013.09.006
Li, Y., and Caine, K. (2022). “Obfuscation remedies harms arising from content flagging of photos,” in Proceedings of the 2022 CHI Conference on Human Factors in Computing Systems, CHI '22 (New York, NY, USA: Association for Computing Machinery), 1–25. doi: 10.1145/3491102.3517520
Liu, Y., Goncalves, J., Ferreira, D., Xiao, B., Hosio, S., and Kostakos, V. (2014). “Chi 1994–2013: Mapping two decades of intellectual progress through co-word analysis,” in Proceedings of the SIGCHI Conference on Human Factors in Computing Systems, CHI '14 (New York, NY, USA: Association for Computing Machinery), 3553–3562. doi: 10.1145/2556288.2556969
MacKenzie, S. B. (2003). The dangers of poor construct conceptualization. J. Acad. Market. Sci. 31, 323–326. doi: 10.1177/0092070303031003011
McAuley, E., Duncan, T., and Tammen, V. V. (1989). Psychometric properties of the intrinsic motivation inventory in a competitive sport setting: a confirmatory factor analysis. Res. Quart. Exer. Sport 60, 48–58. doi: 10.1080/02701367.1989.10607413
Moher, D., Shamseer, L., Clarke, M., Ghersi, D., Liberati, A., Petticrew, M., et al. (2015). Preferred reporting items for systematic review and meta-analysis protocols (PRISMA-P) 2015 statement. System. Rev. 4:9. doi: 10.1186/2046-4053-4-1
Page, M. J., McKenzie, J. E., Bossuyt, P. M., Boutron, I., Hoffmann, T. C., Mulrow, C. D., et al. (2021). The PRISMA 2020 statement: an updated guideline for reporting systematic reviews. BMJ 372:n71. doi: 10.1136/bmj.n71
Perrig, S. A. C., Aeschbach, L. F., Scharowski, N., von Felten, N., Opwis, K., and Brühlmann, F. (2023). Code book (CHI 19 - 22 coded) - Data from “Measurement practices in user experience UX research: A systematic quantitative literature review”. doi: 10.17605/OSF.IO/DGQ6B
Perrig, S. A. C., Aeschbach, L. F., Scharowski, N., von Felten, N., Opwis, K., and Brühlmann, F. (2022). Measurement practices in UX research: a systematic quantitative literature review. PsyArXiv. doi: 10.31234/osf.io/3jz67
Pettersson, I., Lachner, F., Frison, A.-K., Riener, A., and Butz, A. (2018). “A bermuda triangle? A review of method application and triangulation in user experience evaluation,” in Proceedings of the 2018 CHI Conference on Human Factors in Computing Systems, CHI '18 (New York, NY, USA: Association for Computing Machinery), 1–16. doi: 10.1145/3173574.3174035
Pickering, C., and Byrne, J. (2014). The benefits of publishing systematic quantitative literature reviews for PhD candidates and other early-career researchers. Higher Educ. Res. Dev. 33, 534–548. doi: 10.1080/07294360.2013.841651
Pickering, C., Grignon, J., Steven, R., Guitart, D., and Byrne, J. (2015). Publishing not perishing: how research students transition from novice to knowledgeable using systematic quantitative literature reviews. Stud. Higher Educ. 40, 1756–1769. doi: 10.1080/03075079.2014.914907
R Core Team (2019). R: A Language and Environment for Statistical Computing. Vienna, Austria: R Foundation for Statistical Computing.
Rutten, I., and Geerts, D. (2020). “Better because it's new: the impact of perceived novelty on the added value of mid-air haptic feedback,” in Proceedings of the 2020 CHI Conference on Human Factors in Computing Systems (New York, NY, USA: Association for Computing Machinery), 1–13. doi: 10.1145/3313831.3376668
Salehzadeh Niksirat, K., Goswami, L. S. B., Rao, P., Tyler, J., Silacci, A., et al. (2023). “Changes in research ethics, openness, and transparency in empirical studies between CHI 2017 and CHI 2022,” in Proceedings of the 2023 CHI Conference on Human Factors in Computing Systems, CHI '23 (New York, NY, USA: Association for Computing Machinery), 1–23. doi: 10.1145/3544548.3580848
Sauro, J., and Lewis, J. R. (2009). “Correlations among prototypical usability metrics: Evidence for the construct of usability,” in Proceedings of the SIGCHI Conference on Human Factors in Computing Systems, CHI '09 (New York, NY, USA: Association for Computing Machinery), 1609–1618. doi: 10.1145/1518701.1518947
Schubert, T., Friedmann, F., and Regenbrecht, H. (2001). The experience of presence: factor analytic insights. Presence. 10, 266–281. doi: 10.1162/105474601300343603
Sundar, S. S., and Marathe, S. S. (2010). Personalization versus customization: the importance of agency, privacy, and power usage. Hum. Commun. Res. 36, 298–322. doi: 10.1111/j.1468-2958.2010.01377.x
Tractinsky, N. (2018). The usability construct: a dead end? Hum. Comput. Inter. 33, 131–177. doi: 10.1080/07370024.2017.1298038
Tyack, A., and Mekler, E. D. (2020). “Self-determination theory in HCI games research: current uses and open questions,” in Proceedings of the 2020 CHI Conference on Human Factors in Computing Systems, CHI '20 (New York, NY, USA: Association for Computing Machinery), 1–22. doi: 10.1145/3313831.3376723
Vanden Abeele, V., Spiel, K., Nacke, L., Johnson, D., and Gerling, K. (2020). Development and validation of the player experience inventory: a scale to measure player experiences at the level of functional and psychosocial consequences. Int. J. Hum. Comput. Stud. 135:102370. doi: 10.1016/j.ijhcs.2019.102370
Wacharamanotham, C., Eisenring, L., Haroz, S., and Echtler, F. (2020). “Transparency of CHI research artifacts: Results of a self-reported survey,” in Proceedings of the 2020 CHI Conference on Human Factors in Computing Systems, CHI '20 (New York, NY, USA: Association for Computing Machinery), 1–14. doi: 10.1145/3313831.3376448
Watson, D., Clark, L. A., and Tellegen, A. (1988). Development and validation of brief measures of positive and negative affect: the PANAS scales. J. Person. Soc. Psychol. 54, 1063–1070. doi: 10.1037/0022-3514.54.6.1063
Witmer, B. G., and Singer, M. J. (1998). Measuring presence in virtual environments: a presence questionnaire. Presence. 7, 225–240. doi: 10.1162/105474698565686
Wobbrock, J. O., and Kientz, J. A. (2016). Research contributions in human-computer interaction. Interactions 23, 38–44. doi: 10.1145/2907069
Zhu, X., Zhang, X., Chen, Z., Dong, Z., Gu, Z., and Chang, D. (2022). “The trusted listener: the influence of anthropomorphic eye design of social robots on user's perception of trustworthiness,” in Proceedings of the 2022 CHI Conference on Human Factors in Computing Systems, CHI '22 (New York, NY, USA: Association for Computing Machinery), 1–13. doi: 10.1145/3491102.3517670
Keywords: literature review, questionnaires, survey scales, user experience (UX), measurement, constructs, questionable measurement practices
Citation: Perrig SAC, Aeschbach LF, Scharowski N, von Felten N, Opwis K and Brühlmann F (2024) Measurement practices in user experience (UX) research: a systematic quantitative literature review. Front. Comput. Sci. 6:1368860. doi: 10.3389/fcomp.2024.1368860
Received: 11 January 2024; Accepted: 16 February 2024;
Published: 04 March 2024.
Edited by:
Carlos Duarte, University of Lisbon, PortugalReviewed by:
Paula Alexandra Silva, University of Coimbra, PortugalCopyright © 2024 Perrig, Aeschbach, Scharowski, von Felten, Opwis and Brühlmann. This is an open-access article distributed under the terms of the Creative Commons Attribution License (CC BY). The use, distribution or reproduction in other forums is permitted, provided the original author(s) and the copyright owner(s) are credited and that the original publication in this journal is cited, in accordance with accepted academic practice. No use, distribution or reproduction is permitted which does not comply with these terms.
*Correspondence: Sebastian A. C. Perrig, c2ViYXN0aWFuLnBlcnJpZ0B1bmliYXMuY2g=
Disclaimer: All claims expressed in this article are solely those of the authors and do not necessarily represent those of their affiliated organizations, or those of the publisher, the editors and the reviewers. Any product that may be evaluated in this article or claim that may be made by its manufacturer is not guaranteed or endorsed by the publisher.
Research integrity at Frontiers
Learn more about the work of our research integrity team to safeguard the quality of each article we publish.