 Sharifa Alghowinem
 Xiajie Zhang
 Cynthia Breazeal
 Hae Won Park
- 1Personal Robotics Group, Media Lab, Massachusetts Institute of Technology, Cambridge, MA, United States
- 2Computer and Information Sciences College, Prince Sultan University, Riyadh, Saudi Arabia
Introduction: Suicide is a leading cause of death around the world, interpolating a huge suffering to the families and communities of the individuals. Such pain and suffering are preventable with early screening and monitoring. However, current suicide risk identification relies on self-disclosure and/or the clinician's judgment.
Research question/statment: Therefore, we investigate acoustic and nonverbal behavioral markers that are associated with different levels of suicide risks through a multimodal approach for suicide risk detection.Given the differences in the behavioral dynamics between subregions of facial expressions and body gestures in terms of timespans, we propose a novel region-based multimodal fusion.
Methods: We used a newly collected video interview dataset of young Japanese who are at risk of suicide to extract engineered features and deep representations from the speech, regions of the face (i.e., eyes, nose, mouth), regions of the body (i.e., shoulders, arms, legs), as well as the overall combined regions of face and body.
Results: The results confirmed that behavioral dynamics differs between regions, where some regions benefit from a shorter timespans, while other regions benefit from longer ones. Therefore, a region-based multimodal approach is more informative in terms of behavioral markers and accounts for both subtle and strong behaviors. Our region-based multimodal results outperformed the single modality, reaching a sample-level accuracy of 96% compared with the highest single modality that reached sample-level accuracy of 80%. Interpretation of the behavioral markers, showed the higher the suicide risk levels, the lower the expressivity, movement and energy observed from the subject. Moreover, the high-risk suicide group express more disgust and contact avoidance, while the low-risk suicide group express self-soothing and anxiety behaviors.
Discussion: Even though multimodal analysis is a powerful tool to enhance the model performance and its reliability, it is important to ensure through a careful selection that a strong behavioral modality (e.g., body movement) does not dominate another subtle modality (e.g., eye blink). Despite the small sample size, our unique dataset and the current results adds a new cultural dimension to the research on nonverbal markers of suicidal risks. Given a larger dataset, future work on this method can be useful in helping psychiatrists with the assessment of suicide risk and could have several applications to identify those at risk.
1. Introduction
Depression and suicide are major public health concerns recognized as causes of disability and burden that impact the quality of life not only for individuals but also for relatives and communities worldwide (Knox, 2014). Key symptoms tend not to be physical in nature and range in a variety of complex characterizations, causing difficulties in objectively assessing risk for either condition (Cummins et al., 2015). The pandemic heightened the triggers for depression and suicide, with suicide now being the second leading cause of death among people 15–29 years old (WHO-Suicide, 2019). Moreover, WHO statistics show that 800,000 people die from suicide every year, with attempted suicides estimated to be 20 times higher (WHO-Suicide, 2019). The vast majority of suicides occur in the presence of mental illness (i.e., 95%), such as mood disorders, major depressive disorder, and bipolar disorder (Van Orden et al., 2010).
However, suicide is preventable, and early identification, management, and follow-up with people at risk of suicide are a few preventable measures (Shin et al., 2022). For suicide preventative interventions, WHO suggests equipping non-specialized health workers with training in assessing suicide behaviors (WHO-Suicide, 2019). Such a level of assessment is difficult for non-specialized personnel to accomplish without objective measures. Establishing objective and observable behaviors can help not only health workers, but also parents and family members to identify signs of suicide risk. For other mental illnesses, such as depression, several studies have investigated objective measures for diagnosing depression from different modalities such as speech acoustic, speech style, eye activity, and head movements, as reviewed in Pampouchidou et al. (2017). Due to the lack of video datasets for suicide risk interactions, objective measures and observations of suicide behavior have not received the same attention as other mental health disorders. To the best of our knowledge, only a handful of studies have investigated nonverbal behavioral markers associated with suicide risk (Laksana et al., 2017; Eigbe et al., 2018; Shah et al., 2019; Galatzer-Levy et al., 2021), and only one of them utilized a multimodal approach.
Multimodal approaches investigating the behavioral markers for diagnoses or assessment of general mental illness are limited, even though they outperform those relying solely on single modalities (Pampouchidou et al., 2017). In our previous work on multimodal analysis of depression behaviors (Alghowinem et al., 2020), we found that some modalities could dominate the feature space, which might introduce bias toward these modalities, and a better performance was provided by separating the feature spaces. We argue that to fully embrace the benefits of the multimodal approach in suicide screening, we need to preserve the integrity of subtle behaviors in single modalities.
In this work, we propose a novel multimodal region-based approach, that accounts for both subtle and strong behavioral markers associated with different levels of suicide risk. We hypothesize that even within a single modality, the dynamics of behaviors of subregions differ. For example, eye activity dynamics significantly differ from head movements in terms of the strength of movement and the timespan that captures them. Therefore, strong movements like head nods could overpower eye blinks. Similarly, when using a short time window size, not enough eye blinks would be captured compared to head nods. Therefore, fusing these regions in the same timespan might neglect the subtle behavior of the eyes. To achieve this goal, we divide the face and body into small regions (e.g., eyes, nose, hands, legs) and also analyze them as a whole in different window timespans to capture both subtle behaviors within the region and interacting behaviors between these regions. Then, we investigate different multimodal methods in early, late, and hybrid fusions and compare them with single modality results. To the best of our knowledge, this paper is the first to extensively analyze multimodal behaviors for suicide risk detection using speech acoustic, facial expression, and body gestures. The novelty of this paper is as follows:
• To address the lack of cultural diversity in video data of suicidal adults in the field, we collected video recordings of interviews conducted with young Japanese adults who have been identified with different levels of suicide risk (i.e., low, medium, and high).
• We investigate a broad array of region-based (e.g., eyes, legs) behaviors using both handcrafted features and deep representations to provide further insights into suicide risk-related behaviors.
• We investigate these region-based behaviors in different window size to capture subtle behaviors for interpretability.
• We perform a set of comprehensive multimodal fusion approaches of the automatically extracted behaviors in terms of interpretation and classification.
• The results confirm that region-based multimodal behavior is more informative in terms of behavioral markers, their timespan, and accounts for both subtle and strong behaviors.
The ultimate goal is twofold: 1) to provide clinicians with additional tools to more accurately assess the suicide risk of their patients using objective measures (e.g., video recording), and 2) to provide interpretable insights that non-specialists can use to assess behaviors associated with different levels of suicide risk. Additionally, the developed modeling could be incorporated into digital agents to provide personalized and informed therapy or mental health interventions.
2. Background
Due to high levels of psychiatric comorbidity, mental disorders are among the strongest predictors of suicidal risk. While there is not solid research on which mental disorders are uniquely associated with suicidal behavior, past research has concluded that major depressive disorder (MDD) best predicts the onset of suicidal ideation, while disorders characterized by anxiety and poor impulse control are the strongest predictors for ideators progressing to suicide attempts (Nock et al., 2010). Moreover, there is great diversity in mental disorder symptoms, and formal ways of suicide risk assessment are found to be helpful only in acute cases (Waern et al., 2016). Key symptoms for suicidal ideation tend not to be physical in nature and range in a variety of complex characterizations, and also depend on coexisting mental disorders (Ng et al., 2017). This has led to difficulties in objectively assessing suicidal risk. Several screening and assessment tools for suicide have been developed for emergency departments (Shin et al., 2022) and school settings (Erbacher and Singer, 2018) for early detection and monitoring of such risks. However, these instruments rely on the sufferer's willingness to disclose (McGillivray et al., 2022), where building rapport and perceived care based on verbal and nonverbal cues from practitioners could be key for patient's disclosure (Boudreaux et al., 2016). These problems hinder early detection and prevent those suffering from receiving appropriate help.
As the clinical interviews for this study were collected in Japan, it is important for us to contextualize suicide with cultural sensitivity. Even though Japan's and the United States' patterns of suicide are becoming similar, studies show that suicide rates and characteristics differ between cultures (Snowdon, 2018). The sociocultural environment in Japan has slowly been shifting due to globalization, particularly in the corporate world, which poses new challenges to Japanese people (Kato and Kanba, 2017). That is, there has been increasing exposure in Japan of an individualistic performance-based system from Western countries, while traditionally being a collectivistic society (Kato and Kanba, 2017). This shift introduced a new type of depression, in addition to melancholic depression, referred to as modern-type depression (MTD) (Sakamoto et al., 2016). Diagnostic criteria and evidence-based treatment guidelines do not yet exist for MTD, which is often misdiagnosed with adjustment disorder and is not formally recognized by the DSM. However, MTD is suspected as one of the causes of the increase in suicide rates in Japan (Kato and Kanba, 2017).
In order to reduce the gap and provide an objective measure of screening for suicide risk, this paper aims to explore nonverbal behavioral markers associated with different levels of suicidal risk. We do this by identifying behaviors typically associated with suicide risk or ideation. Studies have shown that suicidal patients have lower acoustic energy, breathy voice quality, and variance in pitch compared to control patients (Dhelim et al., 2022), which overlap with some of the voice characteristics of depression (Alghowinem et al., 2016a). Most studies on nonverbal behaviors have focused on facial expressions (including smiles, eye activities, and eyebrows), head and shoulder movements to identify suicide behaviors. Since our recording includes the full body posture, we extend the analysis to include body gestures (e.g., hand and foot behaviors), as described later.
3. Related work
Efforts have been made to use machine learning to automatically assess and screen for suicide risk, as surveyed in Castillo-Sánchez et al. (2020) and Heckler et al. (2022). These approaches often focused on social media using text modality, but the anonymity of these platforms may hinder efforts to provide help to sufferers. Other studies have used patient records, blood markers, and brain signals such as electroencephalogram (EEG) and functional magnetic resonance imaging (fMRI) to assess suicide risk, as surveyed in Mansourian et al. (2021) and Lejeune et al. (2022). However, such data is often inaccessible to non-specialist healthcare providers during a patient's initial consultation, or to the general public that an at-risk individual may encounter in their everyday life.
Using noninvasive and accessible markers such as behavioral cues from verbal and nonverbal actions might have a greater impact in identifying a person at risk of suicide. Acoustic behaviors from speech acoustic associated with suicide were investigated and surveyed by Cummins et al. (2015), and have received wider attention compared to nonverbal behaviors. Recently, Dhelim et al. (2022) reviewed research on automatic suicide assessment using audio and video signals. Given the scarcity of audiovisual datasets on suicide, only a few studies are related to this area of research.
One of the early works on nonverbal behavior for suicide detection was published by Laksana et al. (2017). Using 333 short video interviews, preliminary analysis of facial expressions was promising and had discriminative power in identifying patients without any mental illness, patients suffering from depression, and patients who had suicide ideation. They used a widely utilized tool called OpenFace (Baltrušaitis et al., 2015) to extract facial Action Units and face landmarks to analyze facial expression. More specifically, from the explored behaviors of smiling, frowning, eyebrow raising, and head motion as indicators of mental illness and suicide, smiling-related behavioral cues held the highest performance in identifying suicide ideation.
Similarly, Eigbe et al. (2018) used 74 video interviews to analyze nonverbal behaviors to identify patients in three categories: control, depressed, and suicidal ideation. Behavior markers extracted from OpenFace showed a strong correlation in distinguishing between these three conditions, both for smiling and eye gaze behaviors.
Shah et al. (2019) collected 90 social media videos, which were then categorized as suicide and distressed. They explored a multimodal approach using verbal cues from transcripts, acoustic cues from OpenSmile (Eyben et al., 2010), and visual behavioral cues from OpenFace to detect suicide risk. Certain behaviors were found to be indicative of suicidal intent, such as silences, slouched shoulders, and rapid hand movements.
A recent study (Galatzer-Levy et al., 2021) collected six short 1-minute video interviews of 20 patients admitted following a suicide attempt in Sweden. Facial expressions through facial actions and head movement, extracted from OpenFace, as well as speech prevalence, were extracted from the interviews and then statistically analyzed in correlation to suicide severity. The automatically extracted features demonstrated strong linear associations with the severity of suicidal ideation.
In our preliminary research, we analyzed eye activities and head pose, extracted from deep learning models, in relation to suicide risk assessment (Liu et al., 2022). We found that suicidal individuals who are at high risk show behaviors related to psycho-motor retardation and symptoms of anxiety and depression, characterized by eye contact avoidance, slower blinks, and a downward eye gaze. This basic analysis showed the potential for a systematic evaluation of suicide risk that could be adopted by both healthcare providers and naive observers.
As can be noticed from the above studies, the analysis of nonverbal behaviors was limited to facial actions from facial expression, and had limited behaviors from body gestures and acoustic features. Moreover, only Shah et al. (2019) investigated a multimodal approach by combining verbal, acoustic, and visual modalities. In this work, we aim not only to extend the array of behaviors extracted from each modality, but also to extensively investigate different methods of multimodal fusion.
4. Method of analysis
4.1. Suicide risk dataset collection
As described in Liu et al. (2022), interviews were video recorded with participants at risk of suicide. As part of the suicide awareness campaign, people are invited to share stories of their (or their loved ones') suffering from suicide ideation. People who were willing to be further interviewed were recruited for the project. All participants provided consent via email communication.
A pre-interview was completed with each participant by two project directors for screening and suicide risk assessment using the “Suicidal Risk” subsection of the M.I.N.I. (Mini-International Neuropsychiatric Interview) (Lecrubier et al., 1997), which consists of six questions about their negative thoughts (e.g., suicidal ideation and intensity). An additional five questions were asked during the pre-interview, upon consultation with psychiatrists, about the participant's history of self-harm and clinical visits, environment (e.g., age, family, socioeconomic status), and positive thoughts (e.g., trusted persons, hobbies, coping mechanisms).
Based on the pre-interview, the two directors individually rated each participant as low, medium, or high risk for suicide. These assessments and potential conflicts were subsequently cross-validated and resolved through discussion with psychiatric consultation.
For this study, a special set of interviews were recorded for the purpose of analyzing and modeling nonverbal behavior, for which written consent was acquired from each participant. A total of 14 participants were recorded during an interview, aged between 15 and 25. Four participants requested to be anonymized (i.e., have their faces blurred), and were subsequently excluded from this study to allow for full analysis of facial expression.
The distribution of suicide risk among the 10 participants used in this study was two at high risk, four at medium risk, and four at low risk, with seven of them being women (see Section 4.1 for gender distribution per risk group). The interviews were conducted in different locations with varying room layouts (e.g., window and door location, furniture), but the relative position of the interviewer-interviewee was consistent - both sat in chairs facing each other. The frame rate of the video recording was 30 fps, and the audio was 44 kHz. The average duration of the interview per participant was 18 min.
To mitigate the small size of the dataset, we segmented the interviews into 2, 5, and 10-s non-overlapping windows, which also served for region-based behavioral dynamic investigation. Details about the dataset and sample-level counts are presented in Table 1.
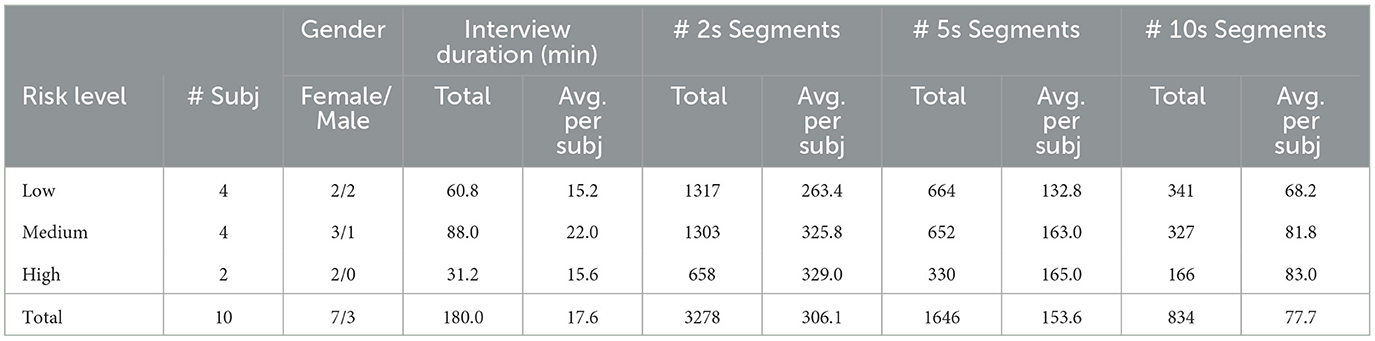
Table 1. Details of the sub-dataset used in this work for each suicide risk level (including number of subjects, total and average interview duration, and segments from different window sizes) are as follows).
4.2. Raw data preprocessing
In order to extract acoustic and nonverbal behaviors from the videos, we followed several preprocessing steps for each signal (audio and video channels). For the audio channel, speakers (i.e., participants and research assistant - RA) are identified to segment each speaker's voice to analyze the participant's acoustic. Even though state-of-the-art speaker diarization approaches have reached good performance in both supervised and unsupervised manners (i.e., with and without speakers' identification models) (Park et al., 2021), we manually segmented the speakers to ensure accuracy and to further annotate overlapped speech and acknowledgments, etc.
For the visual channel, in order to analyze nonverbal behaviors in relation to the participant's suicide risk, raw-level features (e.g., landmarks locations) are extracted as a preprocessing step for low-level and high-level feature extraction. This method has been widely utilized and validated across interaction contexts and population groups (Alghowinem et al., 2021a,b; Chen et al., 2022). The following pre-processing steps are conducted:
(1) Detecting human body using common object detection model YOLO v3 (You Only Look Once) (Redmon and Farhadi, 2018).
(2) Extracting body joints to calculate and analyze geometrical and temporal movement features from individual bodies and in relation to each other. For this purpose, we used AlphaPose (Fang et al., 2017) to extract 17 body joints in the 2D space. AlphaPose has higher accuracy compared to its counterparts (e.g., OpenPose Cao et al., 2021).
(3) Estimating the 3D triangulation and body pose from the 2D points using a state-of-the-art model that utilizes the temporal aspects of the 2D joints to predict the joints in the 3D space (Pavllo et al., 2019). It is worth noting that the 3D triangulation only estimates body pose given the 2D points without depth estimation. Body orientation (yaw, pitch, and roll) is calculated by solving the Direct Linear Transform (DLT) followed by Levenberg-Marquardt optimization.
(4) Extracting the 3D facial landmarks and head pose: This was performed after detecting the face region (Zhang S. et al., 2017), then the best alignment of the facial landmarks was applied using the Face Alignment Network (FAN) that extracts these landmarks in an estimated 3D space (Bulat and Tzimiropoulos, 2017). Head orientation (yaw, pitch, and roll) is calculated in a similar manner to body orientation. It is worth noting that we attempted to use the state-of-the-art head pose deep learning model proposed in Ruiz et al. (2018), but the DLT estimation outperformed the model. We believe that the accuracy of the 3D facial landmarks estimation is sufficient for head pose detection.
(5) Eye gaze estimation: This was extracted using the state-of-the-art model in Zhang X. et al. (2017), which estimates the yaw and pitch of the gaze, similar to our effort in Liu et al. (2022).
4.3. Behavior feature extraction
Using the pre-processing steps, we extracted handcrafted and deep representation of behavioral cues from speech acoustic, facial expression, and body gestures as illustrated in Figure 1.
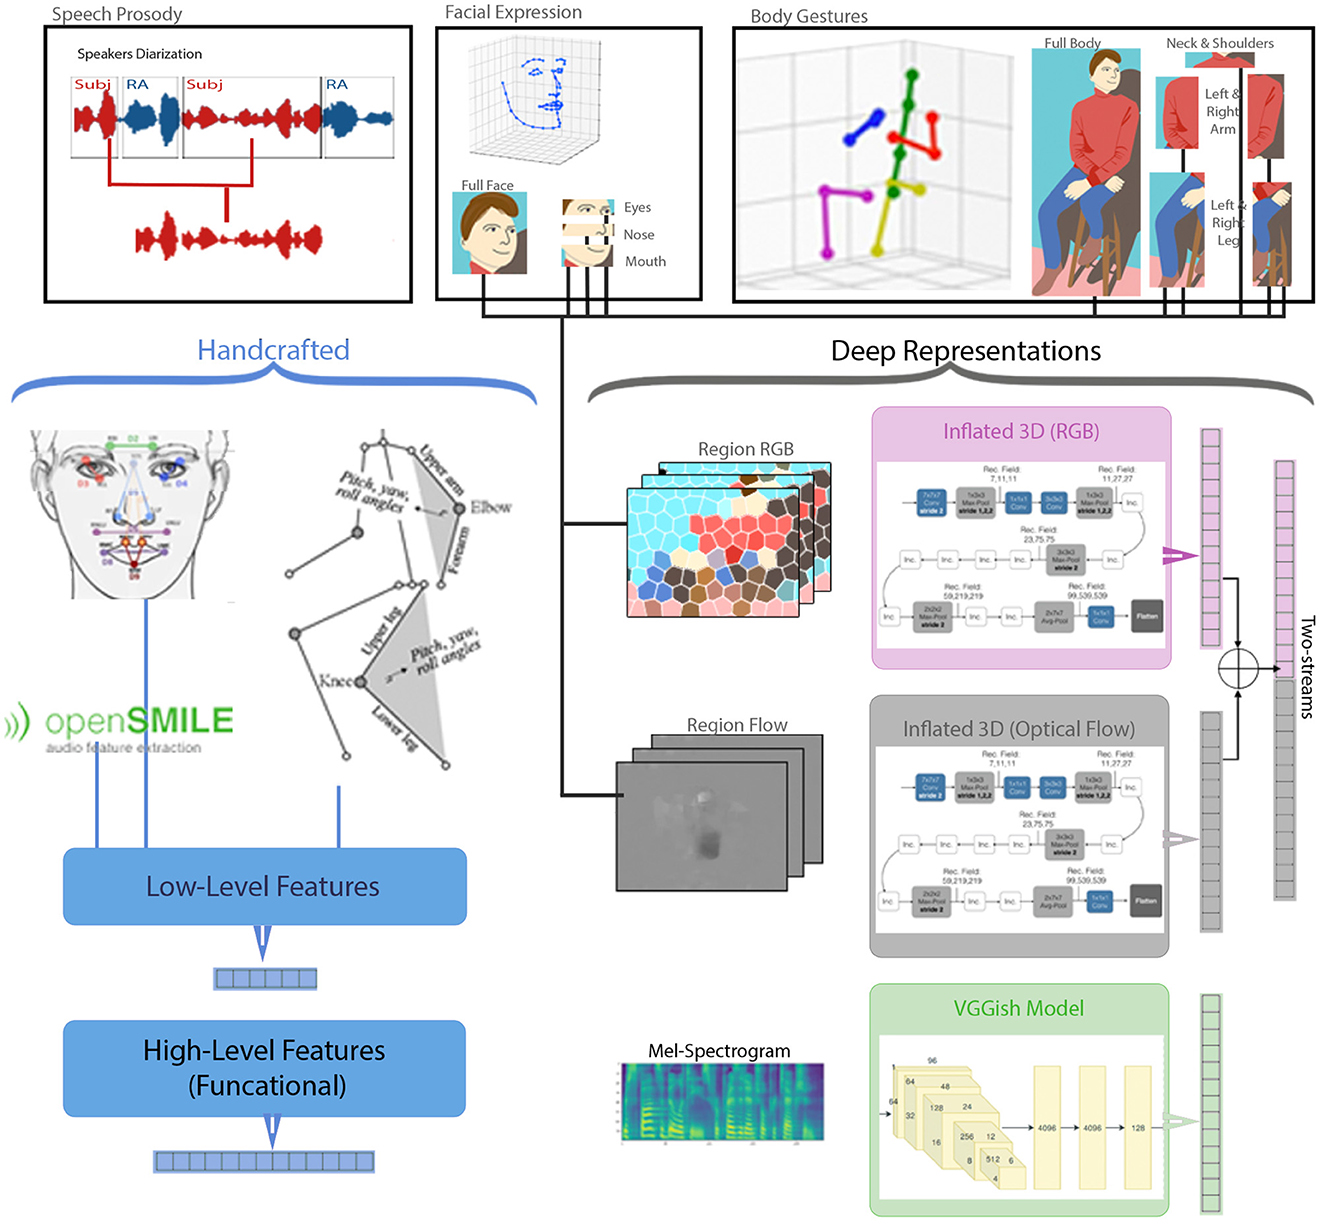
Figure 1. Behavior feature extraction from speech acoustic, facial expression, and body gestures. [Showing (1) the pre-processing steps of: speaker diarization, 3D facial landmarks, and 3D body joints, (2) handcrafted acoustic and region-based nonverbal behavior extraction forming low-level and high-level feature vectors, and (3) deep representation extraction of region-based RGB, Flow, and Two-streams, as well as audio VGGish].
4.3.1. Handcrafted features: Audio and video
Traditional nonverbal cues analysis relied on engineered features, which are derived from social and psychological behaviors. Through surveying the literature in Sections 2, 3, we handcrafted nonverbal cues from speech acoustic, facial expression, head movement, body gestures, and touching behaviors from each participant.
For each participant's audio segment, we extracted high-level functional (statistical) acoustic features using OpenSmile (Eyben et al., 2010), from different window sizes (i.e., 2, 5, 10 s) without overlap to match the deep audio feature representation. In a recent comparison, Eyben et al. (2015) showed a high performance using a minimalistic feature set of carefully selected acoustic features for Affect investigations. As widely used for acoustic behavior, we utilized eGeMAPS (the extended Geneva Minimalistic Acoustic Parameter Set), which contains 88 acoustic features, such as Energy (loudness, Shimmer), Frequency (Pitch, Jitter, Formants), and Spectral (including Mel-Frequency Cepstral Coefficients(MFCC). The purpose of extracting these acoustic features is to capture acoustic behaviors, such as monotone (identifying boredom, tiredness, and depression), and intensity (identifying stress), to name a few examples.
For both facial expression and body gestures behaviors, low-level (per-frame) geometrical features are extracted for each region first, then we calculate high-level temporal features over a timespan. Before the low-level features are extracted, we normalize the face and body sizes using the body joints and facial landmarks (explained in Section 4.2). This normalization accounts for within-participant variations (e.g., distance from the camera) and between-participant variations (e.g., differences in body size). Normalization assures reliable measures of the extracted features and comparability of the analysis. In this work, we use the distance between the sternum point location and the collarbone (clavicle) points to normalize the distance between other points (i.e., their distance is divided by the distance between these two points). We selected these two points for normalization because they are rigid, making them robust even through continuous, sudden, and skewed movements. Then, we use Grubbs' test to detect outliers (Grubbs, 1969) and remove any frames with skewed measures (e.g., erroneous joint or landmark location). Once the joints are processed, the low-level feature extraction for each region begins, as detailed below:
Eyes and Eyebrows: To extract behaviors related to blinks, eye gaze, eye activities, as well as eyebrows expression, we extracted several features:
• Gaze pitch and yaw for both eyes as described in Liu et al. (2022), to capture eye contact (or lack thereof),
• The area of each eye using the eye's landmarks normalized over the overall eye square area, to capture eye openness behavior,
• The openness of each eye calculated from the vertical distance between eyelids normalized over the horizontal distance between the eye corners,
• The area of each eyebrow normalized over the overall eye square area, to capture eyebrows expressions such as raising eyebrows (e.g., expressing surprise), and
• The horizontal distance between inner eyebrows points normalized over the horizontal distance between the outer eyebrows points, to capture pinched eyebrows (e.g., disgust or anger).
Nose and Cheeks: The nose region has been shown to be associated with disgust (Ekman and Friesen, 1978), which is also associated with depression, anxiety, and suicide behaviors (Brake et al., 2017). Therefore, we extract a few features that can capture such behaviors. We also extract features from the cheeks to capture expressions. The features are as follows:
• The large nose area, which includes the tip of the nose, nose corners, and center of the eyebrows. This captures raised nose wrinkles and also (inevitably) inherits head pose.
• The small nose area, which includes the tip of the nose, nose corners, and the bottom of the nose. This captures nose wrinkles.
• Each cheek area, which extends from under the eye to the edge of the face. This captures behaviors of the cheeks, including talking, smiling, and pinching (e.g., in disgust). All features are normalized over the overall face square area.
Mouth and Jaw: Behaviors from the mouth and jaw hold a lot of information about the interaction, including involvement and engagement in the conversation. Therefore, we extracted behaviors related to talking, smiling, lip stretching, and lip movement to infer from these behaviors some interaction differences between the suicide risk levels. The features we investigated are:
• The mouth openness calculated by the vertical distance between the outer lip points, to capture talking dynamics,
• each lip corner distance from the jaw, to capture expressions such as smiling, sadness, disgust, etc. from lip corners raising or pulling down, all normalized over the vertical distance between the nose tip and the center of the eyebrows,
• the mouth width calculated by the horizontal distance between the corners of the mouth normalized over the horizontal distance between the face edges, to capture variations of talking dynamics and smiling behavior, and
• area of the inner lip points, and area of outer lip points normalized over the overall face square area, to capture both talking dynamics and lip stretching.
Full Face: To include head motion behaviors, the full face region includes the head pose (pitch, yaw, and roll) in addition to the eye, nose, and mouth features explained above, which concludes the facial expression behavioral extraction.
Left and Right Arms: One advantage of our dataset is the inclusion of the full body, which allows us to extract arm movement behaviors and self-soothing behaviors represented by touching behaviors (e.g., touching the face, other hand, or upper body) (Ekman and Friesen, 1969a). The extracted features from both hands and arms are as follows:
• For each hand, the triangle area between the shoulder, elbow, and wrist, normalized over the overall body square area (excluding the face area), to capture arm movement dynamics during the conversation.
• Face touching, calculated by the distance between the wrist and the nose.
• Body touching, calculated by the distance between the wrist and the center of the body.
• Touching the other hand, calculated by the distance between the wrist of one hand and the other, to capture self-touching behaviors.
Left and Right Legs: Behaviors of manipulators are unintentional behaviors that can be viewed as indicators of an individual's involvement in an interaction (Ekman, 2004). For example, crossed legs can indicate a closed-off or protective posture in an interaction (Ekman and Friesen, 1969b), while repetitive movements may suggest anxiety (Nock et al., 2010). To capture these posture behaviors, we extracted the following features from the leg movements:
• For each leg, the triangle area between the ankle, the knee, and the hip, to capture leg movement dynamics, normalized over the overall body square area (excluding the face area)
• The distance between the ankles, to capture crossed leg posture
• The distance between the ankle and the hip, to capture the relationship between the feet and the body (e.g., tensed and close to the body vs. relaxed and far from the body)
Full Body: In addition to the features extracted from individual regions of the face and body, we also extracted features from the full body. These features are intended to capture postural changes, such as changes in the sitting position or shifts in the upper torso, which are often associated with restlessness or anxiety (Ekman and Friesen, 1969b). To extract these features, we included the body pose (pitch, yaw and roll) in addition to the features extracted from the arms and legs as explained above. This concludes the extraction of behavioral cues from body gestures.
All regions: It is worth noting that all of the handcrafted features mentioned above, refer to the early fusion of both the facial expression and body gesture features. These combined features are used for modeling.
Finally, we summarized the region-based low-level signals by extracting functional features over a timespan for each video. We applied these functional features to the low-level features, as well as their derivatives (velocity and acceleration), to capture the duration of nonverbal behaviors. We extracted 10 functional features from each of the low-level features and their derivatives, which included minimum (min), maximum (max), range, average, standard deviations (std), variance (var), skewness, kurtosis, total number of peaks, and total number of valleys in the invistigated window. Once the high-level feature vectors are calculated for all windows for the subject's recording, they are further normalized using min-max normalization.
4.3.2. Deep representations: Audio and video
To experiment with deep learning representations of the signals, we used several pre-trained network architectures as feature extractors. For the segmented audio signal of the participants' speech (from the pre-processing step), we extract VGGish embeddings implemented from the model of Hershey et al. (2017). The VGGish feature extractor model is trained on a large audio dataset, built for acoustic event detection. VGGish takes the Mel-Spectrum from a 16 Hz mono audio as an input, which is calculated from a ~1-s window. The VGGish model treats the Mel-Spectrum as a 2D image, similar to a VGG network architecture, to extract a 128-dimensional feature vector. For our audio samples, we extract the VGGish features using the pre-trained model for every ~1 s without overlap. Since the visual features (explained hereafter) span 2, 5, and 10 s, we stack several of the ~1-s feature vectors to match the visual features timespan and prepare for multi-modal fusion.
For the video signal, we utilized pre-trained models from human action recognition and video understanding research. These models focus on detecting activities from videos, such as holding an object, walking, reading, etc. Even though these actions are not necessarily nonverbal behaviors, using models that are trained on temporal actions from videos is the closest task to ours. We utilized the state-of-the-art model Inflated 3D (i3D) (Carreira and Zisserman, 2017), which is trained on RGB and optical Flow frames, to extract the deep representation of the video segment. The model's input is either RGB or Flow images with 64 temporal frames, to capture the dynamics of the action. The i3D model output is a 1024-dimensional feature vector for each of the RGB and Flow models, and 2,048 for the two-streams when concatenated. In this research, we used 64 consecutive frames to capture 2 s of each video segment. For the 5 and 10 s windows, we stacked the output of the 2 s window to form a longer timespan, as explained later.
In order to support our region-based experiments, we cropped the regions from each frame based on the extracted landmarks. That is, for facial expression deep representation, we used the facial landmarks to extract the eyes and brows region, nose and cheek region, and mouth and jaw region, besides the full face frames. For the body gestures, we used the body joints to extract the right and left arms regions, right and left legs regions, and neck and shoulders region as well as the full body. These region-based frames are stacked for processing as RGB input frames for the i3, or to calculate the Optical Flow.
In this work, we calculate the Optical Flow using the Farneback algorithm (Farnebäck, 2003) due to its low computational demands and compatibility with GPU, compared to its counterpart, the TVL1 algorithm (Pérez et al., 2013). Even though the TVL1 algorithm is commonly used for calculating Optical Flow due to its superior ability to model motion, it requires five times the calculation time ( 11 fps) compared to the Farneback algorithm ( 52 fps) on the same GPU. We calculate the Flow for each consecutive frame from the entire RGB frames, resulting in the same number of frames as with the RGB frames. It is worth noting that the Flow is calculated for each region individually to allow for subtle movements (e.g., eye blinks) to be visible and not dominated by larger movements (e.g., hand movements).
For both the handcrafted and deep features, we experimented with different window size segments, as we argue that some regions might benefit from shorter or longer timespans depending on the nature of their movement and behavior. For the handcrafted high-level features, this is performed by calculating the functional (statistical) features over 2, 5, and 10-s time window. On the other hand, for the deep features, as mentioned above, the extracted embeddings from the predefined frames (0.96 s for audio and 64 frames for RGB and Flow) are combined to form the 2, 5, and 10-s windows. The combinations of these windows are either simple concatenation, which doubles, quadruples, etc. the feature vector length, or averaging the feature vectors, which results in keeping the feature vector length the same. The different lengths for the region-based feature vectors between handcrafted and deep representation and timespans are listed in Table 2.
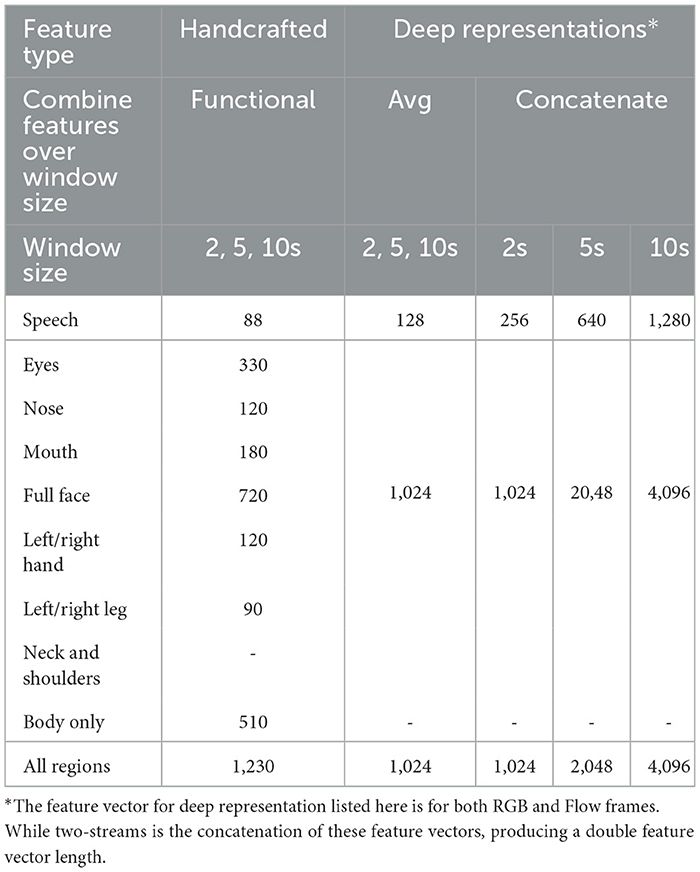
Table 2. Length of feature vectors for both handcrafted and deep representation in different timespans and feature combination over the timespans.
4.4. Modeling and configuration space
To further assess the suitability of the extracted behavioral features in screening for suicide risk, we run several experiments. One main experiment involves comparing the performance of deep representation features (i.e., from the VGGish, RGB, and Flow deep features) with the performance of engineered features. Moreover, we experiment with different window sizes in each modality, as mentioned earlier.
Leave-One-Subject-Out (LOSO): To mitigate the small size of our dataset, we performed LOSO as a cross-validation approach. In this approach, all samples (window segments) of a subject are left out of the training and validation process to avoid model contamination. That is, removing one subject's samples for testing ensures that the model will not have seen their unique characteristics such as speech signal, facial features, or even appearance such as clothing, which results in reducing the model's bias. Our validation dataset comprises 25% of the samples of the training set, which is randomly split in a stratified manner to ensure a balanced sample for each class. Given that we have 10 subjects in this dataset, we run 10 rounds of LOSO cross-validation.
Data Augmentation and Resampling: To reduce potential bias caused by overrepresented classes (especially when a participant from the high-class is in the LOSO), we tested different oversampling methods: random oversampling and variants of SMOTE (Synthetic Minority Over-sampling Technique) (Chawla et al., 2002). For random oversampling, we randomly duplicated samples from underpopulated classes, while for SMOTE, the algorithm utilizes techniques (e.g., clustering and calculated feature vector distances) to synthesize data points that are not exact duplicates of the data points. Although re-sampling techniques are interesting to ensure balanced samples and reduce bias, it also duplicates the penalties of misclassifying the minority classes. Since SMOTE works best on statistical features (Chawla et al., 2002), we applied it to the handcrafted features, while we used random sampling for the deep representations.
Evaluation Metric: Besides using accuracy as a metric to measure the model's performance, we also calculated a Matthews Correlation Coefficient (MCC) score, which accounts for the number of samples in each class. Accounting for the differences between class sample sizes, MCC is considered one of the best evaluators of classification quality in comparison with other measures such as F1 score, since it is only high when good results are achieved from all classes (Chicco and Jurman, 2020). MCC values range from –1 to 1, where 1 is perfect classification, -1 is reversed classification, and around 0 is random-level performance. This means that a high classification in the majority class with poor classification in the minority class will only yield random chance level MCC. We used a generalized multiclass version of MCC as described by Gorodkin (2004). Using MCC helps in evaluating the models while accounting for the imbalanced samples in the classes.
Network Architectures and Hyperparameters Tuning: Given the differences between the deep features and the handcrafted features not only in vector length but also in sample rate, we believe that the configuration space and network architectures should also be adjusted to suit the input signal. Therefore, we use Bayesian Optimization (Falkner et al., 2018) to search for the optimal network architectures and hyperparameters, where the configuration space search is based on the following:
• Hidden Layers: Since we are performing classification over already extracted features, we only need a few dense, non-linear layers. The configuration space search includes a single layer, as well as 2 and 3 dense layers architectures for comparisons. All dense layers used ReLU activation function. Finally, we added a classification dense layer with a Softmax activation function with three classes.
• Dropouts: We added at most a couple of dropout layers between the hidden layers to avoid overfitting.
• Layer Size: For each hidden layer, we fine-tuned using several values of the number of nodes.
• Optimizer and learning rate: We compared the performance of SGD and ADAM optimizer with a range of learning rates (and momentum for SGD).
From the above approach, for each modality and the fused ones, we selected the best performing model based on the balanced accuracy and MCC of the training and validation sets, which we then reported on the results on the testing set. Since the testing set is from one subject samples (LOSO), all the samples are from one class, and therefore, we only reported on the accuracy. The accuracy of the sample-level is the average number of samples that were correctly classified in all LOSO rounds, while the accuracy of the subject-level is the percentage of the subjects who were correctly classified. A subject is considered correctly classified if more than 50% of their samples are correctly classified in the LOSO round. We performed this extra metric to evaluate our models because we noticed that for some of the experiments, all subjects' samples will be correctly classified, and for other subjects all samples will be misclassified, which skews the overall results. We performed an additional experiment to compare randomized features with the handcrafted and deep features. To do this, we generated a random feature vector for each of the original labels. By comparing our classification results to the results obtained by chance, we ensure that our results are robust and our feature vectors are meaningful.
4.5. Multimodal fusion approaches
Fusing modalities for behavioral analysis is generally challenging given the differences in the combined modalities, and when it comes to automated assessment of psychopathology, it becomes even more challenging given the sensitivity of the application. In our previous work, the results showed differences in modeling confidence levels from different multimodal fusion approaches in diagnosing depression (Alghowinem et al., 2016b). In this work, we follow a similar general pattern using early, late, and hybrid fusion as illustrated in Figure 2. The specifics and details of each approach are as follows:
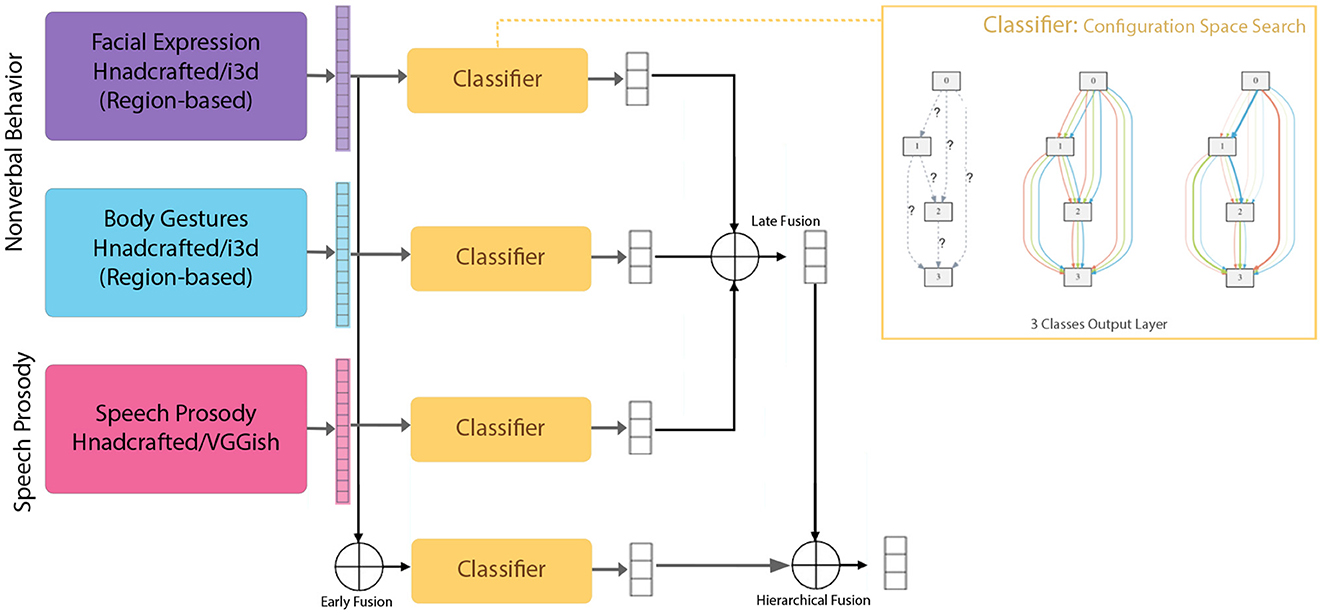
Figure 2. Single modeling (and configuration space) and multimodal fusion approaches used in this work (early, late, and hierarchical fusion levels).
Early Fusion (feature fusion): In this method, the features from different modalities are fused (e.g., concatenated) before the modeling. Even though feature fusion might enrich the model with diverse features from different modalities, it has its own complications and restrictions. For instance, samples where different modality features are extracted have to be aligned, and the features have to be compatible. That is, for our experiments with different window sizes, we cannot perform an early fusion of a 2-s window of facial expression with a 10-s window of body gesture, for example, due to different time scales. In this work, we performed early fusion on single modalities to fuse the region-based features, as well as in a multimodal setting to compare the results from different combinations.
Late Fusion: In this method, the results from the classification of the single modalities are fused. Even though the late fusion might reduce some of the restrictions that early fusion has, unifying the output of the classifiers could pose a new challenge, especially when using different classifier types. Even though we are using the same type of classifier (deep neural network with 3-class output), fusing different sample sizes produced by the different window span added another level of fusion in order to align the samples before the final fusion. For example, for our late fusion, when fusing a 2-s window of facial expression with a 10-s window of the body gesture, the 2-s window would have higher number of data points compared to the 10-s window. To unify the number of data points each 5 of the 2-s window samples are fused first to match each one sample of the 10-s window. This is done as a preparation step before the two are fused for the final decision. However, when fusing modalities of the same window size, only one level of late fusion is performed.
Since the output of each model is a probability vector, we believe that using the belief theory for the late fusion is suitable in this context. Using a mathematical belief function, available evidences from all different sources can be combined to reach a degree of belief. In this work, we use DempsterShafer theory, which is a generalization of the Bayesian theory of probability (Beynon et al., 2000), to perform the late fusion of the model probability outputs.
Hierarchical (hybrid) Fusion: This method utilizes the benefits of both early and late fusions. In this method, the model from the early-fused features is treated as another single modality, and its model results are also fused at another (late) level with the single modality model results. For the hierarchical fusion, we combine both methods explained above in different combinations, as illustrated in Figure 2.
It is worth noting that in hybrid fusion, both small regions and combined regions are modeled separately as well as when fused for comparison. Features are extracted for each region individually and then modeled individually, with minimal overlap between the regions. By design, to capture both subtle and strong behaviors, we investigate modeling from both small and large (i.e., combined) regions. Therefore, when fusing, the integrity of individual regions and the combined ones is maintained.
4.6. Statistical analysis of the features
In order to understand the differences among the three groups (suicide risks at low, medium and high), we focused our statistical analysis on all region features as well as the mouth region from both 5s and 10s windows, since their modeling performance were superior to the other regions. We first applied a normality test for each of the feature metrics to examine the assumption for the subsequent analyses. Unsurprisingly, most of the feature metrics data failed the normality assumption. Thus, we performed a non-parametric method, Kruskal-Wallis test, to determine whether statistical differences (p < 0.05) existed among the groups for feature metrics that failed the normality assumption (for those that met the normality assumption, we applied one-way ANOVA for the same null hypothesis). All of the Kruskal-Wallis analyses were corrected with Bonferroni correction to avoid the multiple comparison problem.
Then, we performed post-hoc tests to identify the differences and the features among the three suicide risk groups. Here, the Mann-Whitney U Test was applied for pairwise group comparison for all of the feature metrics that showed statistical differences (p < 0.05) in the Kruskal-Wallis Test. In this analysis, we first hypothesized the pairwise statistical differences (p < 0.05) between two groups, and focused on the feature metrics that exhibit statistical differences for all the group-pairs (Low and Medium, Low and High, Medium and High). In addition, we applied the Mann-Whitney test with an alternative hypothesis to test whether one group is statistically more likely to be larger than the other.
The full region features include all 41 features captured in our handcrafted features, including the head, eyes, mouth, nose, and body, with 30 metrics, including 10 statistical measurements and two derivative values. This results in a total of 1,230 feature metrics. The test results show that between-group differences exist for 911 of these metrics. Ad-hoc analysis shows that only 374 of these feature metrics have statistically significant differences between groups. For the mouth region specifically, there are 6 features with 30 metrics, resulting in 180 feature metrics. However, only 26 of these features show statistical differences across all pairs. The summary of significant different features and the data trends among the three groups are listed in Table 5, and the interpretations of these results are described in the following section.
5. Results
In order to provide insight on behavioral markers associated with suicide risk levels, we analyzed speech acoustic, facial expression, and body gestures from video interviews of participants at risk of suicide. We extracted both handcrafted and deep representation features from these modalities and explored the modeling results from region-based single and multimodal fusion.
5.1. Region-based single modalities results
To capture subtle behaviors from each region in the face and the body, we divided the face area into three sub-areas and the body area into five sub-areas, which were modeled individually for comparison (see Section 4.3 for detailed segmentation and feature extraction). This region-based modeling is performed to avoid model bias toward dominant features (Alghowinem et al., 2020) and to provide insights into the most contributing regions in distinguishing suicide risk levels. Moreover, the modeling results from the single modalities of facial expression, body gesture, as well as speech acoustic are presented in Table 3. In these tables, the best-performing model based on the balanced accuracy and MCC of the training and validation sets is selected, on which we report the testing results. For each region and feature type, the best-performing model also showed the best window size (in seconds) and method of combining the feature vectors over the window size (as detailed in Section 4.3).
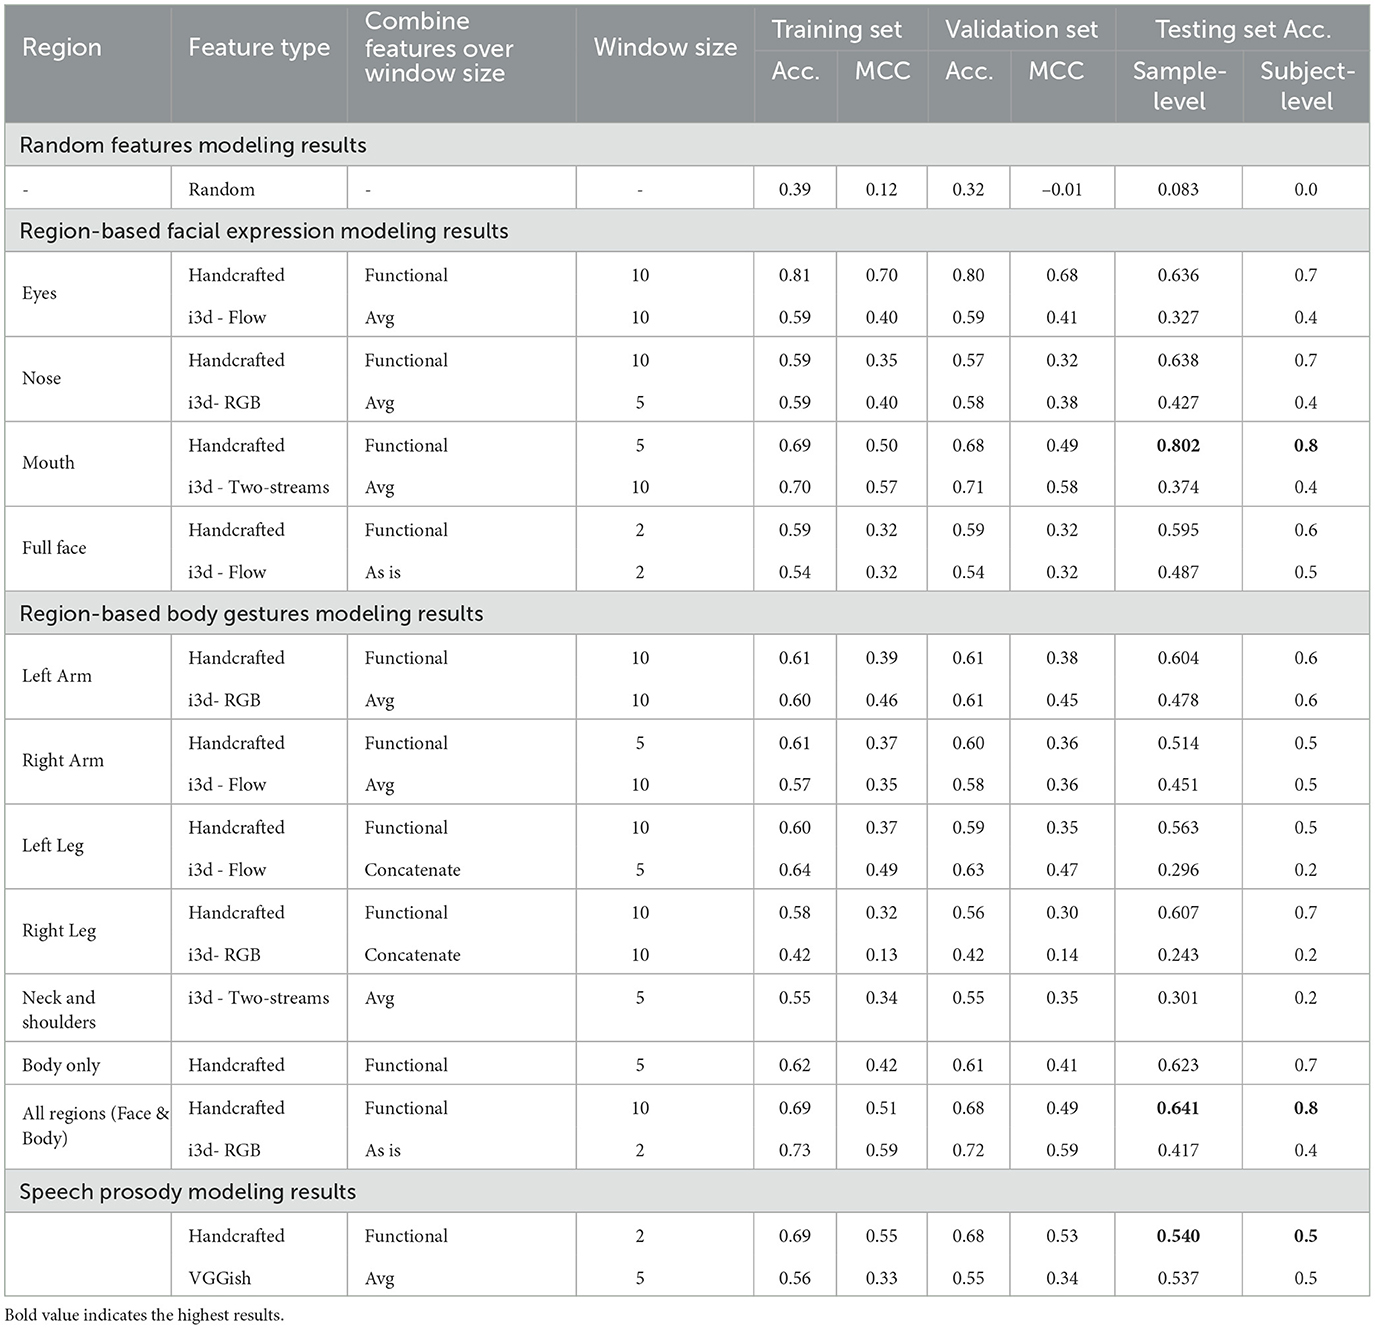
Table 3. Single modality modeling results-Showing (1) Facial Expression: the superiority of the mouth region in distinguishing suicide risk level, (2) Body Gesture: fusing all body regions with body orientation in handcrafted features provides informative behavior for better model performance, (3) Speech Acoustic: handcrafted features continuously outperforming deep representation features, and (4) all modalities outperformed the random features.
In general, comparing the modeling performance from handcrafted and deep representation features, handcrafted features outperformed its counterpart, where both outperformed random features. Even though training and validation performance for the deep representation modeling were close to those of handcrafted features, the models on the deep representation were not able to generalize to unseen data. This might be due to the small sample size of the dataset, where deep transfer learning benefits from large datasets to reach a reliable convergence. However, the fact that the deep representation outperformed the random feature levels in training, validation, and testing performances (except for the right leg) indicates potentials that deep embeddings hold some discriminative power in screening suicide risk levels.
When focusing on facial expression modeling presented in Table 3, it can be noticed that modeling from sliced regions outperformed the whole region for the handcrafted features. However, the same is not true for the deep representation, where modeling using the full face generalized better on the testing set compared to the cropped regions. For the handcrafted features, this finding confirms our finding on depression, where subtle behaviors could be overpowered or blended by other behaviors (Alghowinem et al., 2020). On the other hand, the use of the full face in the deep representation may have provided a holistic view that is closer to the pre-trained i3D model, which allowed the classifier to generalize better to the testing set. The best performing region in facial expression is the mouth region from the handcrafted features. The eye and nose regions of the handcrafted features, nonetheless, hold discriminative power for suicide risk level screening, particularly given that the sample-level accuracy results are a 3-class problem. Facial action units related to the mouth and smiling in particular have been found to be correlated to suicide behaviors (Laksana et al., 2017; Eigbe et al., 2018). Even though we do not directly extract smiling behavior, but rather extract overall mouth movement dynamics, the performance of the mouth region confirms these findings and shows the potential of mouth dynamics for suicide detection in the Japanese population. It is worth noting that in some cases, such as the handcrafted eye region and deep mouth region, the training and validation results outperformed the other regions, yet their generalization to the test set did not hold, which indicates overfitting models.
We investigated the window size for each region, as we hypothesized that some behaviors might benefit from a longer or shorter time span based on the nature of their movement dynamics. For example, a longer window for the eye region could capture eye blinks and eye movement dynamics, and a shorter window for the mouth could capture talking movement dynamics. These assumptions held true for the handcrafted features, where the best-performing models listed in Table 3 were within these window sizes. For the full face, the best model was with a window size of 2 s. This might indicate that abrupt head movements are distinguishable characteristics of suicidal behavior, in line with Shah et al. (2019).
Body gestures have received very limited attention in analyzing mental disorders in general, and to the best of our knowledge, none of the suicide behavioral analysis research has analyzed it. Similarly to the facial expression modality, we explored region-based, feature type, and window size for the body gesture modality, where the modeling results are listed in Table 3. Contrary to facial expression, slicing the regions of body gestures did not benefit the modeling in the handcrafted features, but it did benefit the modeling for the deep embeddings. For the handcrafted features, this finding might be due to the fact that behaviors from individual body regions are not subtle enough to be overpowered by other behaviors and that their interactions are more informative to the suicide level screening. On the other hand, for the deep embeddings, the left and right arms regions performed significantly better than other regions and slightly better than the full body region. This might be due to the fact that the i3d pre-trained model is trained on action recognition with a lot of hand actions (e.g., 'rock scissors paper', 'shaking hand', 'dribbling basketball'). Interestingly, the left arm and right leg from the region-based behaviors showed promising results from the handcrafted features.
For the window size experiments, a window of 10s is mostly the best performing window size. The only exception is with the handcrafted features with body only (not counting when the model performance at the subject-level is 0.5 or below). Body only features are when behaviors of both arms and legs are combined with body orientation. Similar to handcrafted full face features, body only handcrafted features benefited from a shorter window size. This finding might indicate differences in body movement dynamics between the three suicide risk levels.
For the handcrafted features, when combining behaviors of the body regions with behaviors of face regions, the model outperforms all regions except for the mouth region. This finding confirms our argument, where a multimodal approach is only powerful when the strength of its individual modalities and their sub-modalities (regions) are preserved. Further fusion approaches are explored in the following section, where this early fusion result is revisited.
Previous work on suicide speech acoustic used recorded audio interviews, lifeline phone recordings, etc. to analyze the patterns of speech in the English language, as reviewed in Cummins et al. (2015) and Dhelim et al. (2022). Speech acoustic includes energy, source, formant, and spectral features which have shown promising results in identifying suicidal speech patterns. Speech analysis in different languages is very limited, especially for suicidal behavioral speech. Comparing handcrafted speech features with deep VGGish features, the test results from modeling of the handcrafted features were slightly better than the deep features, even though the training and the validation results were significantly higher in the handcrafted ones. However, speech acoustic had a lower performance compared to the nonverbal modalities. This might be due to the differences in Japanese language in terms of phonetics and speech patterns compared to English language, where a more customized list of handcrafted features should be investigated instead of the currently generalized emotional feature used in this work.
5.2. Multimodal fusion results
One of the main goal of this research is to investigate multimodal fusion approaches that preserve the discriminative power of subtle behaviors while fully embracing the benefits of behavioral interactions from other modalities. We achieved this by dividing each single modality into smaller regions and modeling each region with different window sizes to accommodate for its behavioral dynamics. As described in Section 4.5, we explored early (feature) fusion, late fusion, and hierarchical (hybrid) fusion, where the results are presented in Table 4. For the simplicity of comparisons, we combined the facial expression and body gestures modalities as one and named it nonverbal, but divided it by the feature type of handcrafted and deep i3d, while keeping the speech acoustic modality as one without dividing it into feature types.
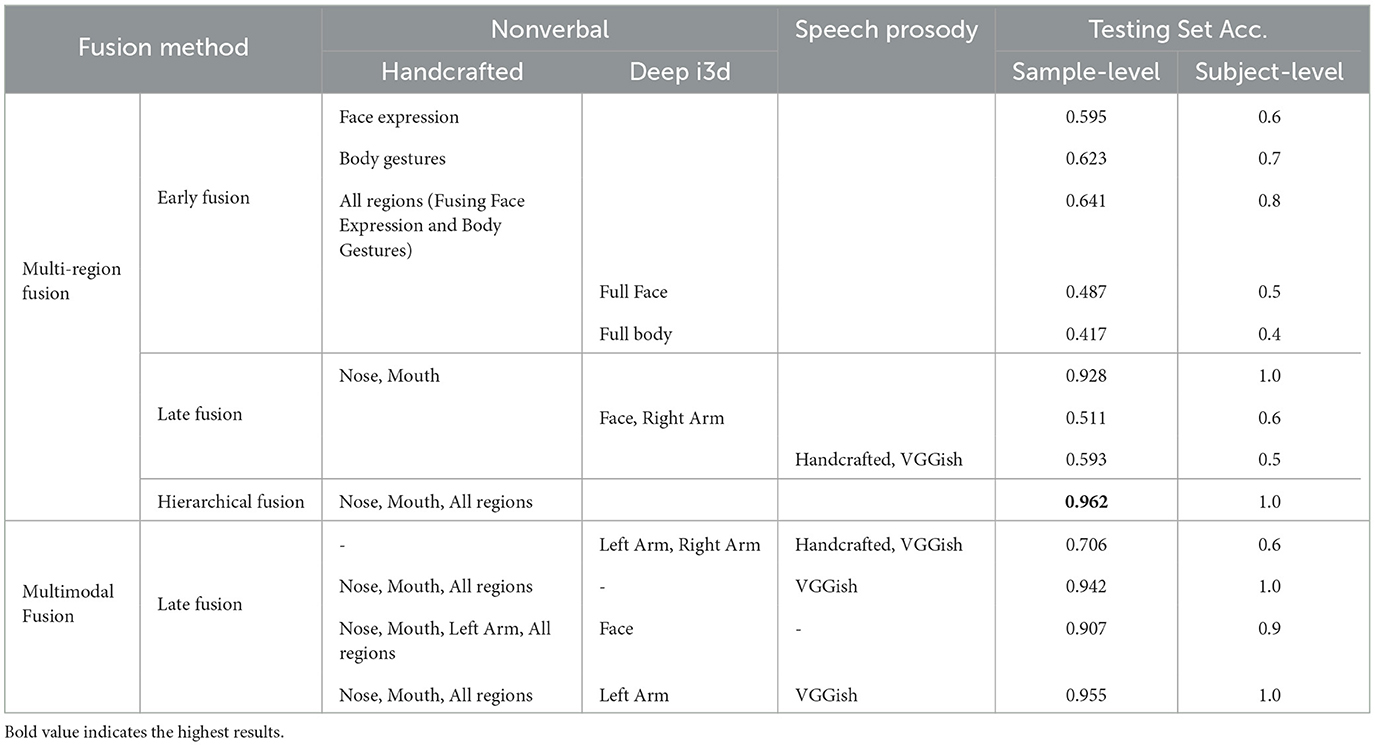
Table 4. Results of different multimodal fusion approaches—showing the strongest results from the hierarchical (hybrid) fusion, and confirming the strength of our region-based analysis.
Since each modality was divided into region-based modeling, we explored fusing these regions in a multi-region manner in early and late fusions. In the top part of Table 4, we reported the top-performing fusions. For the early fusion, the results were already discussed in the above section and repeated here for reference. Fusing both facial expression and body gesture modalities in early fusion outperformed region-based results, except for the mouth region.
On the other hand, for late fusion using Dempster-Shafer belief theory, combining the modeling results from the handcrafted features of the nose and mouth regions significantly improved modeling results from individual regions and the combined regions of the same feature type. Slight improvements were also observed in deep features of nonverbal modalities (facial expression and body gestures) and speech acoustic in the late fusion, which indicates that our late fusing method using the Dempster-Shafer theory was able to preserve the strength of the fused regions/features.
When applying hierarchical (hybrid) fusion on both the results from the early fusion and the late fusion, the results are further boosted to reach their ultimate maximum for our experiments. Even though we tried every other combination of late and hybrid fusion, the best combination was produced by the nose, mouth and all regions of the handcrafted features. Suggesting that behaviors within and between these regions have a strong discriminative power in identifying different levels of suicide risk.
Given the baseline results of each of the multi-region and feature type fusions presented above, we explored different combinations of these aspects. The bottom part of Table 4 shows the best results from each of these combinations. Even though all multimodal fusion results have improved the suicide risk level screening compared to the individual modalities and region-based modeling, it can be noticed the level of contribution of each region and feature type to the overall classification results. For example, the absence of the handcrafted features drops the classification results compared to when including them. When including all modalities' regions and feature types, the hybrid fusion of the nose, mouth and all regions from the handcrafted features is fused with the deep features of the left arm and VGGish, which performed the best results in the multimodal approach, which is slightly less than when using the hybrid fusion of the single modality. This is reassuring, since even when the results are not significantly improved after fusion of all modalities, it increases the confidence level of the final decision. It is interesting that the left arm behavior had some meaningful contribution to some of the combinations in the multimodal fusion compared to the single fusion and the region-based modeling.
It is worth noting that some late fusion experiments resulted in a significant decrease in classification results compared to their individual results. For example, fusing left and right arms resulted in a sample-level accuracy of 0.492 and 0.418 from the handcrafted and deep features, respectively. Moreover, as a sanity check, we tested fusing the probabilities of the random features with the highest performing modalities (hybrid fusion), and the results showed a significant drop in performance. This finding confirms that the fused behaviors are actually compatible with each other and contributing to the final decision on the suicide risk level.
6. Data summarization and interpretation through statistical analysis
The feature functionals that showed significant differences among the three suicidal risk groups are summarized in Table 5, along with the post-hoc pairwise comparison results. As stated earlier, to capture the rich information from the subject's non-verbal behaviors, we handcrafted features from different body regions. We derived both the first-order derivative and the second-order derivative of the original signals to capture a deeper context of the subject's behaviors, such as the speed and acceleration of their movements, which can also capture the duration and dynamics of their behavior. The original/raw features, the speed (short-handed as d1 features in the table) and the acceleration (short-handed as d2 features in the table) of the movement constructs the low-level descriptors (LLD). Then, we calculated 10 statistical functionals within different window sizes from the LLD. These statistical functionals are used as input features in the fusion model. We categorized the features with significant differences among all pairs of the three target groups by the statistical trend they exhibit, and listed the high-level functionals (calculated from the original, d1, and d2 signals) with which the features have a significant effect. We merged features that are impossible to discuss separately (i.e., the orientation of the left eye and right eye), and if the trends of their significant features do not agree, we still listed them in the table with the label “N/A” for the trend.
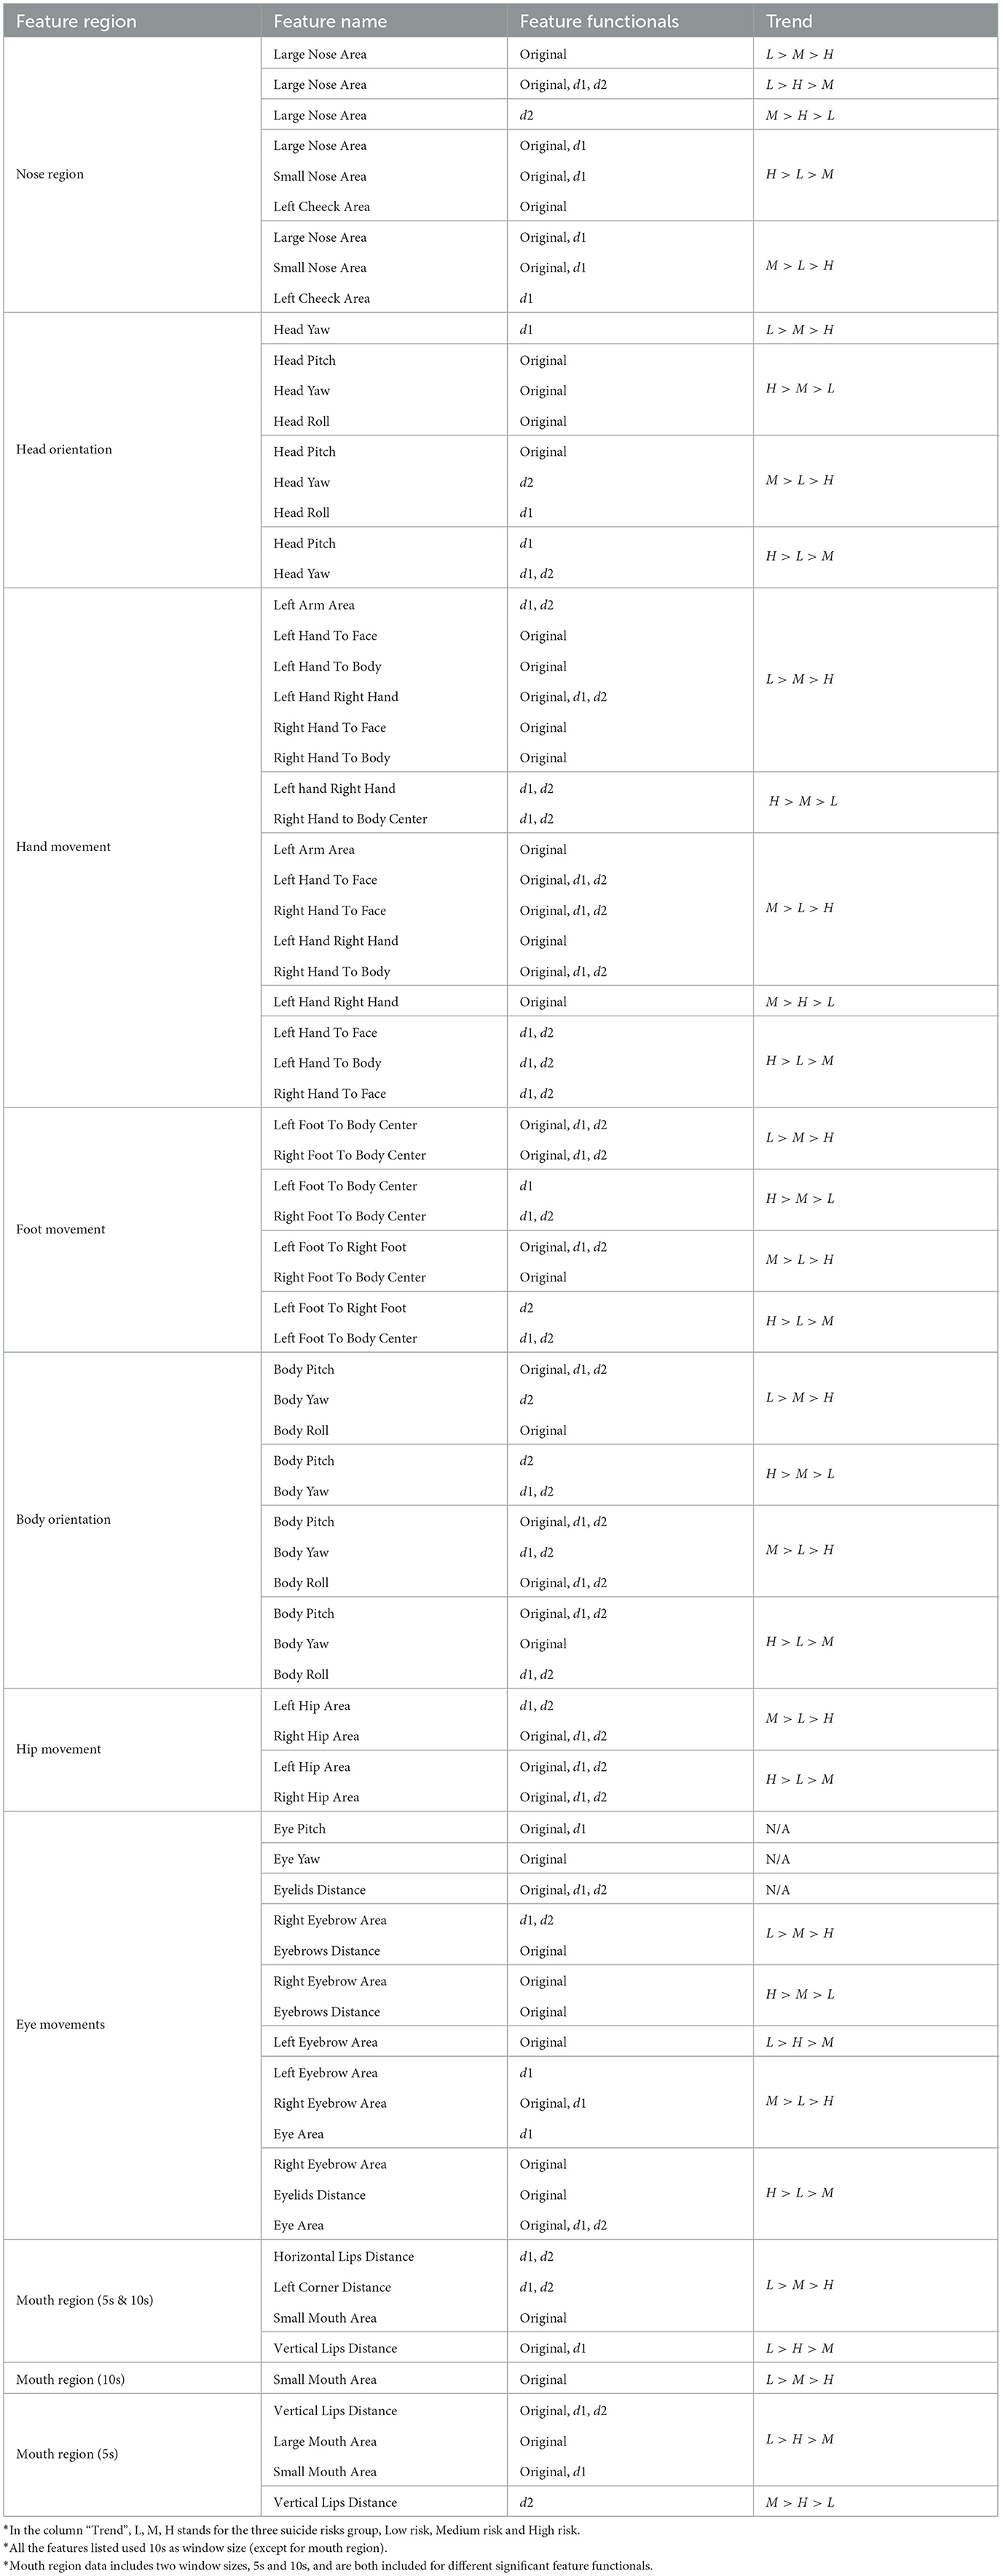
Table 5. Summary of significantly different feature functionals among three groups.
First, our results show that all regions, from head orientation to foot movement, exhibit statistically different feature functionals. There is no one feature region that shows an overwhelming amount of statistically different functionals compared to the others. This might help explain why the fusion model with all body parts information achieved the best performance.
Secondly, unlike most suicidal models where only the original signals are used for modeling, we used both the speed and acceleration information (represented by the first and second order derivatives of the original signals) from movements in our model. The statistical results show that many significant feature functionals are from the speed and acceleration. The information from the speed and acceleration of the movement might exhibit the same or completely opposite trends as the results from the original signal.
Specifically, we delve into the feature functionals that follow two types of data trends (L>M>H and H>M>L) for the interpretability, and the identification of the potential behavioral cues behind them for psychological insights in this dataset. In the head region, several feature functionals that are related to typical head movements and facial expressions show a uniform descending trend from the low-risk group to the high-risk group. For example, the value of the large nose area is affected by head movements in the pitch and yaw direction and expressions such as disgust and discomfort, where a wrinkled nose is typically expressed. The data trend with nose area shows that the high-risk group exhibits more behaviors such as wrinkled nose, looking up and down, and head shaking. Head movement, especially yaw orientation, shows a strong statistical difference with an interesting trend. The data shows that the low-risk group shakes their head less when compared with the high-risk group, however, at a faster speed. This suggests that subjects in the high-risk group exhibit more and slower head motions, which might be behaviors of avoidance of eye contact or discomfort in the situation, while the low-risk group might have mainly engaged in head movements as gestures (shaking the head when signaling “No”). The eyebrow distance is affected by behaviors such as frowning and surprised eyebrow raises. Our results show that subjects in the high-risk group display a wider range of eyebrow movement and smaller eyebrow distance when compared with the low-risk group. This indicates that the high-risk group is prone to displaying behaviors such as frowning and disgust. Several feature functionals from the mouth area indicate a similar descending trend from the low-risk group to the high-risk group, and all indicate forms of suppression in mouth behaviors among the high-risk group. For instance, the horizontal lip distance is affected by smiling, open-mouth surprise, yawning, and speaking. A low value in mouth openness in the high-risk group suggests suppression in speech and smiles. The speed-level functionals also show that the low-risk group might be talking at a faster speed or exhibit exaggerated lip movements. Further functionals from the small mouth area, the area of the opened inner lips, confirm that the low-risk group opens their mouth more while the subjects from the high-risk group might have a more closed-up mouth movement during the interview.
The feature functionals of body movements from the three risk groups also show interesting differences. Hand gesture-related features show that the low-risk group has wider and more frequent hand movement while the high-risk group has abrupt but less hand movement. For example, when measuring the distance between the right hand and the left hand, the low-risk group has a wider range of hand gestures. Their hand movements were more speedy, indicating a usage of hand gestures when illustrating and talking. While the high-risk group often has abrupt and short-duration hand gestures, and their hand movement is less continuous compared to the low-risk group. This phenomenon is confirmed through video observation, where we observed that subjects in the high-risk group hold their hands together most of the time with occasional abrupt yet small hand movements when they are speaking, compared to low and medium-risk groups. Then, their hands often quickly go back to their original hand-hold position close to their knees. On the other hand, subjects in the low-risk group often move their hands freely and use gestures for illustration along with their speech. Similarly, the low-suicidal risk group has more hand movements toward the center of the body, and their arm movements are active and acute (measured by arm area) during the interview, suggesting that they are relaxed, open to interaction during the interview, and more expressive with hand-arm movements. In addition, we identify that subjects in the low-risk group touch their face more frequently compared to the high-risk group. Foot movement functionals suggest that subjects in the low-risk group move their feet away from their body center further compared to the high-risk group; however, the high-risk group has a higher speed in their foot movements. Combining those two observations, the subjects in the high-risk group move their feet in fast, repetitive, and small motions and the low-risk group move their feet and stretch their legs with a larger variance with more distributed speed.
Several themes can be inferred from the above results, regarding specific emotions expressed in different levels of suicide risks, as well as expressivity, movement, and energy levels with the severity of the suicide levels. Several emotions were expressed more often in participants with high suicide risk, such as disgust (measured by nose wrinkles, eyebrows' area, and distance), and eye contact avoidance (measured by head movement). Expressing disgust has been linked to depression, anxiety, and suicide behaviors (Brake et al., 2017). Similarly, eye contact avoidance is correlated with depression, and anxiety (Waxer, 1977; Horley et al., 2003; Moukheiber et al., 2010; Alghowinem et al., 2013a,b; Jun et al., 2013). On the other hand, the low-risk suicide group showed higher self-soothing behavior (measured by face, hand, and upper body touching), and anxiety behavior (measured by the repetitive movements) (Kapur et al., 2006). Ekman and Friesen (1969a) also showed that self-soothing body movement (such as touching one's neck, face or body, and holding/crossing one's arms) could indicate anxiety.
Expressivity levels (Bolinger, 1983) reduced significantly with an increased level of suicide risk, where speaking, smiling, eyebrow movements, etc. were observed more often in the low-risk suicidal group during the interview. This could be explained by the fatigue and social withdrawal that is observed among suicidal individuals in line with Waern et al. (2016). The same observation is made with movement frequency and energy levels, where participants with low-risk of suicide showed higher energy and more frequent movement from their hands, head, body, and feet during the conversation. Such diminished movement in the high-risk group can be explained by depression-induced psycho-motor retardation (Waxer, 1977; Fossi et al., 1984; Alghowinem et al., 2013a,b) and social disengagement (Waern et al., 2016).
7. Discussion and conclusion
Given the prevalence of suicide rates, especially that the COVID-19 pandemic has heightened its causes, suicide has become the second leading cause of death in youth worldwide (Tanaka and Okamoto, 2021). With early identification, management, and follow-up of people at risk, suicide is preventable (Shin et al., 2022). To this end, we attempt to identify behavioral markers that are associated with different levels of suicide risks, which in turn could help reduce the gap and provide an objective measure for screening suicide risk.
In our multimodal fusion, we hypothesized that even though combining information from different modalities enriches the model with behavioral interactions, it could also suppress subtle behaviors. Furthermore, we also hypothesized that some behaviors might benefit from shorter or longer timespans based on their nature and dynamics.
To assess our hypotheses, we ran two main experiments. One where we divided each modality into region-based areas, and another where we explored the best timespan for each of the regions.
Our hypotheses held true for both region-based and timespan, especially for the small facial regions such as the mouth. All region-based facial expressions outperformed when all facial regions are combined, indicating that some behaviors overpower or dilute other behaviors when combined.For timespan investigation, we observed that regions with more frequent and dynamic movements benefit from a shorter window size, such as the mouth, face (including head movement), and body (including body orientation).
The purpose of the multi-region and multimodal fusions is to inspect the contribution of each region to the overall decision on the suicide risk level, which will also provide insight into the behavioral markers associated with these risk levels. In line with literature, the mouth region held the most discriminative power in identifying suicide risk levels, followed by the nose region. The nose region is usually associated with expressing disgust emotions, where a strong association between suicide risk and self-disgust was found (Brake et al., 2017). Moreover, all feature types and modalities have contributed in a meaningful way, adding confidence to the final decision, even if it did not improve the overall results. This finding was tested by fusing the results with the results of the random features modeling, where the final decision dropped.
Even though the study is based on a small sample size, the results indicate that the power of a multimodal fusion should be approached with care, in order to avoid introducing bias toward dominant modalities. When it comes to mental disorder applications, such as suicide screening, where behavioral cues could co-occur or overlap with other disorders, further caution should be considered before fusing regions and modalities.
The statistical analysis and the interpretation of the handcrafted features provided further insights into the differences in behaviors based on suicide risk levels. Mainly, the higher the suicide risk levels, the lower the expressivity, movement frequency, and energy levels observed from the subject. Moreover, high-risk suicide group expresses more disgust and contact avoidance, while low-risk suicide group expresses self-soothing and anxiety behaviors. We believe these cues are informative as preliminary results to identify the risk level a subject is at and to assess their improvement. Further studies are needed to confirm and validate these behavioral cues with larger samples in a cross-cultural context.
8. Limitation and future work
Even though our dataset adds to the cultural diversity by analyzing the Japanese young population, one of its main limitations is the small number of participants. Such a small sample size limits the generalizability of this study's analysis of behaviors of individuals at risk of suicide, especially for a three-level imbalanced participants. Nonetheless, given the lack of video datasets of suicidal individuals, we believe that this analysis is exploratory rather than confirmatory, and that the presented preliminary analysis serves as the first step toward validating and assessing the cross-cultural behaviors of individuals at risk of suicide. However, we tried to mitigate this shortcoming by dividing the dataset into small window segments of 2, 5, and 10 s and using LOSO cross-validation to avoid model contamination (as described in Table 1). Moreover, our dataset also suffers by the problem of self-selection bias and self-reported risk. For future work, it would be worthwhile to explore collaborating with medical institutions and/or mental health professionals to recruit participants who have either survived suicide attempts or have not self-reported risk (e.g., through a third-party referral from a friend or family member). Finally, error analysis could inform further insight of behavioral modeling, similar to Alghowinem et al. (2018), which was not included in this study. This could be performed by analyzing subject-level performance to identify video segments where misclassification occur for within and between subjects. Furthermore, analyzing the errors from the different experiments could inform model improvement and feature interpretation.
The second main limitation of this study is the lack of a control group for comparison. We attempted to collect a few video samples from Japanese social media, but the context, recording environment, nature of the conversation, and dynamics of the interactions were vastly different. This would have led the model to learn all these differences rather than the behavioral differences associated with suicide risk. Future work could investigate and compare with interviews collected from people who are not at risk of suicide to serve as a control group. Furthermore, with a larger multi-session data collection, future work could also investigate subject-dependent modeling, where the changes in suicide risk over time could be correlated with other changes in mental health. Although this work analyzed the general trend in behavioral change from the different suicide risk groups, subject-dependent modeling could provide further insights in such behavioral analysis.
Additionally, as discussed in the related work section, to the best of our knowledge, only four studies have used video recordings to analyze nonverbal behaviors of suicidal individuals. One study collected publicly available videos from social media, which were then rated by two observers for distress or suicide. While their dataset can be shared, the suicide labels are not clinically validated. On the other hand, the other three studies used clinically validated datasets that contained suicidal patients, however, their datasets are not sharable and duplicating or extending the work on these datasets is not feasible. Finding a mechanism for sharing unidentifiable raw-level processed data, such as 3D facial landmarks and 3D body joints for the visual part, and low-level descriptors for audio, or even deep representations of the audio/video data, could help the research community scale up the suicide screening modeling.
Furthermore, only one study has utilized non-English speaking suicidal patients, where six short video segments of a 1-minute interview are collected from 20 Swedish patients. Our dataset, even though small, is the only available dataset on the Asian culture for suicidal individuals. Validating and generalizing the previous findings on the Eastern culture to this dataset enables cross-cultural comparison, and could provide further insights on how to tackle such a global pandemic.
Data availability statement
The original contributions presented in the study are included in the article/supplementary material, further inquiries can be directed to the corresponding author.
Ethics statement
The patients/participants provided their written informed consent to participate in this study. Written informed consent was obtained from the individual(s) for the publication of any potentially identifiable images or data included in this article.
Author contributions
SA, XZ, and HP contributed to the conception and design of the study. SA performed the modeling and analysis. XZ conducted the statistical analysis. SA and XZ wrote the first draft of the manuscript. All authors contributed to manuscript revision, read, and approved the submitted version.
Acknowledgments
We extend our thanks to Emily Zhai and Somaia Saba for their contributions in annotating the videos.
Conflict of interest
The authors declare that the research was conducted in the absence of any commercial or financial relationships that could be construed as a potential conflict of interest.
Publisher's note
All claims expressed in this article are solely those of the authors and do not necessarily represent those of their affiliated organizations, or those of the publisher, the editors and the reviewers. Any product that may be evaluated in this article, or claim that may be made by its manufacturer, is not guaranteed or endorsed by the publisher.
References
Alghowinem, S., Chen, H., Breazeal, C., and Park, H. W. (2021a). “Body gesture and head movement analyses in dyadic parent-child interaction as indicators of relationship,” in 2021 16th IEEE International Conference on Automatic Face and Gesture Recognition (FG 2021) (Jodhpur: IEEE), 01–05.
Alghowinem, S., Goecke, R., Epps, J., Wagner, M., and Cohn, J. (2016a). “Cross-cultural depression recognition from vocal biomarkers,” in Proc. Interspeech 2016 (San Francisco, CA). 1943–1947. doi: 10.21437/Interspeech.2016-1339
Alghowinem, S., Goecke, R., Wagner, M., Epps, J., Hyett, M., Parker, G., et al. (2016b). Multimodal depression detection: fusion analysis of paralinguistic, head pose and eye gaze behaviors. IEEE Trans. Affect. Comput. 9, 478–490. doi: 10.1109/TAFFC.2016.2634527
Alghowinem, S., Goecke, R., Wagner, M., Epps, J., Hyett, M., Parker, G., et al. (2018). Multimodal depression detection: Fusion analysis of paralinguistic, head pose and eye gaze behaviors. IEEE Trans. Affect. Comput. 9, 478–490.
Alghowinem, S., Goecke, R., Wagner, M., Parker, G., and Breakspear, M. (2013a). “Eye movement analysis for depression detection,” in 2013 IEEE International Conference on Image Processing (Melbourne, VIC: IEEE), 4220–4224.
Alghowinem, S., Goecke, R., Wagner, M., Parkerx, G., and Breakspear, M. (2013b). “Head pose and movement analysis as an indicator of depression,” in 2013 Humaine Association Conference on Affective Computing and Intelligent Interaction (Geneva: IEEE), 283–288.
Alghowinem, S., Jeong, S., Arias, K., Picard, R., Breazeal, C., and Park, H. W. (2021b). “Beyond the words: Analysis and detection of self-disclosure behavior during robot positive psychology interaction,” in 2021 16th IEEE International Conference on Automatic Face and Gesture Recognition (FG 2021) (Jodhpur: IEEE), 01–08.
Alghowinem, S. M., Gedeon, T., Goecke, R., Cohn, J., and Parker, G. (2020). Interpretation of depression detection models via feature selection methods. IEEE Trans. Affect. Comput. 2020, 5535. doi: 10.1109/TAFFC.2020.3035535
Baltrušaitis, T., Mahmoud, M., and Robinson, P. (2015). “Cross-dataset learning and person-specific normalisation for automatic action unit detection,” in 2015 11th IEEE International Conference and Workshops on Automatic Face and Gesture Recognition (FG), Vol. 6 (Ljubljana: IEEE), 1–6.
Beynon, M., Curry, B., and Morgan, P. (2000). The dempster-shafer theory of evidence: an alternative approach to multicriteria decision modelling. Omega 28, 37–50. doi: 10.1016/S0305-0483(99)00033-X
Boudreaux, E. D., Camargo, C. A. Jr., Arias, S. A., Sullivan, A. F., Allen, M. H., Goldstein, A. B., et al. (2016). Improving suicide risk screening and detection in the emergency department. Am. J. Prev. Med. 50, 445–453. doi: 10.1016/j.amepre.2015.09.029
Brake, C. A., Rojas, S. M., Badour, C. L., Dutton, C. E., and Feldner, M. T. (2017). Self-disgust as a potential mechanism underlying the association between ptsd and suicide risk. J. Anxiety Disord. 47, 1–9. doi: 10.1016/j.janxdis.2017.01.003
Bulat, A., and Tzimiropoulos, G. (2017). “How far are we from solving the 2d & 3d face alignment problem?(and a dataset of 230,000 3d facial landmarks),” in Proceedings of the IEEE International Conference on Computer Vision (Venice: IEEE), 1021–1030.
Cao, Z., Hidalgo Martinez, G., Simon, T., Wei, S., and Sheikh, Y. A. (2021). “OpenPose: realtime multi-person 2D pose estimation using part affinity fields,” in IEEE Transactions on Pattern Analysis & Machine Intelligence, vol. 43 (Los Alamitos, CA), 172–186.
Carreira, J., and Zisserman, A. (2017). “Quo vadis, action recognition? a new model and the kinetics dataset,” in proceedings of the IEEE Conference on Computer Vision and Pattern Recognition (Honolulu, HI: IEEE), 6299–6308.
Castillo-Sánchez, G., Marques, G., Dorronzoro, E., Rivera-Romero, O., Franco-Martín, M., la Torre-Díez, D., et al. (2020). Suicide risk assessment using machine learning and social networks: a scoping review. J. Med. Syst. 44, 1–15. doi: 10.1007/s10916-020-01669-5
Chawla, N. V., Bowyer, K. W., Hall, L. O., and Kegelmeyer, W. P. (2002). Smote: synthetic minority over-sampling technique. J. Artif. Intell. Res. 16, 321–357. doi: 10.1613/jair.953
Chen, H., Alghowinem, S., Jang, S., Breazeal, C., and Park, H. (2022). Dyadic affect in parent-child multi-modal interaction: Introducing the dami-p2c dataset and its preliminary analysis. Trans. Affect. Comput. 2022, 3178689. doi: 10.1109/TAFFC.2022.3178689
Chicco, D., and Jurman, G. (2020). The advantages of the matthews correlation coefficient (mcc) over f1 score and accuracy in binary classification evaluation. BMC Genomics 21, 6. doi: 10.1186/s12864-019-6413-7
Cummins, N., Scherer, S., Krajewski, J., Schnieder, S., Epps, J., and Quatieri, T. F. (2015). A review of depression and suicide risk assessment using speech analysis. Speech Commun. 71, 10–49. doi: 10.1016/j.specom.2015.03.004
Dhelim, S., Chen, L., Ning, H., and Nugent, C. (2022). Artificial intelligence for suicide assessment using audiovisual cues: a review. arXiv preprint arXiv:2201.09130. doi: 10.1007/s10462-022-10290-6
Eigbe, N., Baltrusaitis, T., Morency, L.-P., and Pestian, J. (2018). “Toward visual behavior markers of suicidal ideation,” in 2018 13th IEEE International Conference on Automatic Face Gesture Recognition (FG 2018) (Xi'an: IEEE), 530–534.
Ekman, P. (2004). “Emotional and conversational nonverbal signals,” in Language, Knowledge, and Representation. Philosophical Studies Series, vol 99, eds J. M. Larrazabal and L. A. P. Miranda (Dordrecht: Springer), 39–50. doi: 10.1007/978-1-4020-2783-3_3
Ekman, P., and Friesen, W. V. (1969a). Nonverbal leakage and clues to deception. Psychiatry 32, 88–106. doi: 10.1080/00332747.1969.11023575
Ekman, P., and Friesen, W. V. (1969b). The repertoire of nonverbal behavior: categories, origins, usage, and coding. Semiotica 1, 49–98. doi: 10.1515/semi.1969.1.1.49
Ekman, P., and Friesen, W. V. (1978). Facial Action Coding System: A Technique for the Measurement of Facial Movement. Palo Alto, CA: Consulting Psychologists Press. doi: 10.1037/t27734-000
Erbacher, T. A., and Singer, J. B. (2018). Suicide risk monitoring: the missing piece in suicide risk assessment. Contemporary Sch. Psychol. 22, 186–194. doi: 10.1007/s40688-017-0164-8
Eyben, F., Scherer, K. R., Schuller, B. W., Sundberg, J., André, E., Busso, C., et al. (2015). The geneva minimalistic acoustic parameter set (gemaps) for voice research and affective computing. IEEE Trans. Affect. Comput. 7, 190–202. doi: 10.1109/TAFFC.2015.2457417
Eyben, F., Wöllmer, M., and Schuller, B. (2010). “Opensmile: the munich versatile and fast open-source audio feature extractor,” in Proceedings of the 18th ACM International Conference on Multimedia (MM '10). Association for Computing Machinery (New York, NY), 1459–1462. doi: 10.1145/1873951.1874246
Falkner, S., Klein, A., and Hutter, F. (2018). “BOHB: robust and efficient hyperparameter optimization at scale,” in Proceedings of Machine Learning Research 80:1437–1446. Available online at: https://proceedings.mlr.press/v80/falkner18a.html
Fang, H.-S., Xie, S., Tai, Y.-W., and Lu, C. (2017). “RMPE: regional multi-person pose estimation,” in Proceedings of the IEEE International Conference on Computer Vision (ICCV) (Venice).
Farnebäck, G. (2003). “Two-frame motion estimation based on polynomial expansion,” in Image Analysis. SCIA 2003. Lecture Notes in Computer Science, vol 2749, eds J. Bigun and T. Gustavsson (Berlin; Heidelberg: Springer), 363–370. doi: 10.1007/3-540-45103-X_50
Fossi, L., Faravelli, C., and Paoli, M. (1984). The ethological approach to the assessment of depressive disorders. J Nervous Mental Dis. 172, 332–341. doi: 10.1097/00005053-198406000-00004
Galatzer-Levy, I., Abbas, A., Ries, A., Homan, S., Sels, L., Koesmahargyo, V., et al. (2021). Validation of visual and auditory digital markers of suicidality in acutely suicidal psychiatric inpatients: proof-of-concept study. J. Med. Internet Res. 23, e25199. doi: 10.2196/25199
Gorodkin, J. (2004). Comparing two k-category assignments by a k-category correlation coefficient. Comput. Biol. Chem. 28, 367–374. doi: 10.1016/j.compbiolchem.2004.09.006
Grubbs, F. E. (1969). Procedures for detecting outlying observations in samples. Technometrics 11, 1–21. doi: 10.1080/00401706.1969.10490657
Heckler, W. F., de Carvalho, J. V., and Barbosa, J. L. V. (2022). Machine learning for suicidal ideation identification: a systematic literature review. Comput. Hum. Behav. 128, 107095. doi: 10.1016/j.chb.2021.107095
Hershey, S., Chaudhuri, S., Ellis, D. P. W., Gemmeke, J. F., Jansen, A., Moore, C., et al. (2017). “CNN architectures for large-scale audio classification,” in 2017 IEEE International Conference on Acoustics, Speech and Signal Processing (ICASSP) (New Orleans, LA), 131–135, doi: 10.1109/ICASSP.2017.7952132
Horley, K., Williams, L. M., Gonsalvez, C., and Gordon, E. (2003). Social phobics do not see eye to eye: a visual scanpath study of emotional expression processing. J. Anxiety Disord. 17, 33–44. doi: 10.1016/S0887-6185(02)00180-9
Jun, Y. Y., Mareschal, I., Clifford, C. W., and Dadds, M. R. (2013). Cone of direct gaze as a marker of social anxiety in males. Psychiatry Res. 210, 193–198. doi: 10.1016/j.psychres.2013.05.020
Kapur, N., Cooper, J., King-Hele, S., Webb, R., Lawlor, M., Rodway, C., et al. (2006). The repetition of suicidal behavior: a multicenter cohort study. J. Clin. Psychiatry 67, 17465. doi: 10.4088/JCP.v67n1016
Kato, T. A., and Kanba, S. (2017). Modern-type depression as an “adjustment” disorder in japan: the intersection of collectivistic society encountering an individualistic performance-based system. Am. J. Psychiatry 174, 1051–1053. doi: 10.1176/appi.ajp.2017.17010059
Knox, K. (2014). Approaching suicide as a public health issue. Ann. Intern. Med. 161, 151–152. doi: 10.7326/M14-0914
Laksana, E., Baltrušaitis, T., Morency, L., and Pestian, J. P. (2017). “Investigating facial behavior indicators of suicidal ideation,” in 2017 12th IEEE International Conference on Automatic Face Gesture Recognition (FG 2017) (Washington, DC: IEEE), 770–777.
Lecrubier, Y., Sheehan, D. V., Weiller, E., Amorim, P., Bonora, I., Sheehan, K. H., et al. (1997). The mini international neuropsychiatric interview (mini). A short diagnostic structured interview: reliability and validity according to the cidi. Eur. Psychiatry 12, 224–231. doi: 10.1016/S0924-9338(97)83296-8
Lejeune, A., Le Glaz, A., Perron, P.-A., Sebti, J., Baca-Garcia, E., Walter, M., et al. (2022). Artificial intelligence and suicide prevention: a systematic review. Eur. Psychiatry 65, e19. doi: 10.1192/j.eurpsy.2022.8
Liu, S., Lu, C., Alghowinem, S., Gotoh, L., Breazeal, C., and Park, H. W. (2022). “Explainable AI for suicide risk assessment using eye activities and head gestures,” in Artificial Intelligence in HCI. HCII 2022. Lecture Notes in Computer Science(), vol 13336, eds H. Degen and S. Ntoa (Cham: Springer). doi: 10.1007/978-3-031-05643-7_11
Mansourian, M., Khademi, S., and Marateb, H. R. (2021). A comprehensive review of computer-aided diagnosis of major mental and neurological disorders and suicide: a biostatistical perspective on data mining. Diagnostics 11, 393. doi: 10.3390/diagnostics11030393
McGillivray, L., Rheinberger, D., Wang, J., Burnett, A., and Torok, M. (2022). Non-disclosing youth: a cross sectional study to understand why young people do not disclose suicidal thoughts to their mental health professional. BMC Psychiatry 22, 1–11. doi: 10.1186/s12888-021-03636-x
Moukheiber, A., Rautureau, G., Perez-Diaz, F., Soussignan, R., Dubal, S., Jouvent, R., et al. (2010). Gaze avoidance in social phobia: objective measure and correlates. Behav. Res. Ther. 48, 147–151. doi: 10.1016/j.brat.2009.09.012
Ng, C. W. M., How, C. H., and Ng, Y. P. (2017). Depression in primary care: assessing suicide risk. Singapore Med. J. 58, 72. doi: 10.11622/smedj.2017006
Nock, M. K., Hwang, I., Sampson, N. A., and Kessler, R. C. (2010). Mental disorders, comorbidity and suicidal behavior: results from the national comorbidity survey replication. Mol. Psychiatry 15, 868–876. doi: 10.1038/mp.2009.29
Pampouchidou, A., Simos, P. G., Marias, K., Meriaudeau, F., Yang, F., Pediaditis, M., et al. (2017). Automatic assessment of depression based on visual cues: a systematic review. IEEE Trans. Affect. Comput. 10, 445–470. doi: 10.1109/TAFFC.2017.2724035
Park, T. J., Kanda, N., Dimitriadis, D., Han, K. J., Watanabe, S., and Narayanan, S. (2021). A review of speaker diarization: recent advances with deep learning. arXiv preprint arXiv:2101.09624. doi: 10.1016/j.csl.2021.101317
Pavllo, D., Feichtenhofer, C., Grangier, D., and Auli, M. (2019). “3D human pose estimation in video with temporal convolutions and semi-supervised training,” in Proceedings of the IEEE/CVF Conference on Computer Vision and Pattern Recognition (CVPR) (Long Beach, CA), 7753–7762.
Pérez, J. S., Meinhardt-Llopis, E., and Facciolo, G. (2013). Tv-l1 optical flow estimation. Image Process. On Line 2013, 137–150. doi: 10.5201/ipol.2013.26
Redmon, J., and Farhadi, A. (2018). Yolov3: an incremental improvement. arXiv preprint arXiv:1804.02767. doi: 10.48550/arXiv.1804.02767
Ruiz, N., Chong, E., and Rehg, J. M. (2018). “Fine-grained head pose estimation without keypoints,” in The IEEE Conference on Computer Vision and Pattern Recognition (CVPR) Workshops (Salt Lake City, UT: IEEE).
Sakamoto, S., Yamakawa, I., and Muranaka, M. (2016). A comparison of perceptions of ‘modern-type' and melancholic depression in japan. Int. J. Soc. Psychiatry 62, 627–634. doi: 10.1177/0020764016665410
Shah, A. P., Vaibhav, V., Sharma, V., Al Ismail, M., Girard, J., and Morency, L.-P. (2019). “Multimodal behavioral markers exploring suicidal intent in social media videos,” in 2019 International Conference on Multimodal Interaction, ICMI '19 (New York, NY: Association for Computing Machinery), 409–413.
Shin, H. D., Cassidy, C., Weeks, L. E., Campbell, L. A., Drake, E. K., Wong, H., et al. (2022). Interventions to change clinicians' behavior related to suicide prevention care in the emergency department: a scoping review. JBI Evid. Synthesis 20, 788–846. doi: 10.11124/JBIES-21-00149
Snowdon, J. (2018). Differences between patterns of suicide in east asia and the west. The importance of sociocultural factors. Asian J. Psychiatry 37, 106–111. doi: 10.1016/j.ajp.2018.08.019
Tanaka, T., and Okamoto, S. (2021). Increase in suicide following an initial decline during the COVID-19 pandemic in Japan. Nat. Hum. Behav. 5, 229–238. doi: 10.1038/s41562-020-01042-z
Van Orden, K. A., Witte, T. K., Cukrowicz, K. C., Braithwaite, S. R., Selby, E. A., and Joiner, T. E. Jr. (2010). The interpersonal theory of suicide. Psychol. Rev. 117, 575. doi: 10.1037/a0018697
Waern, M., Kaiser, N., and Renberg, E. S. (2016). Psychiatrists' experiences of suicide assessment. BMC Psychiatry. 16, 4. doi: 10.1186/s12888-016-1147-4
Waxer, P. H. (1977). Nonverbal cues for anxiety: An examination of emotional leakage. J. Abnorm. Psychol. 86, 306. doi: 10.1037/0021-843X.86.3.306
Zhang, S., Zhu, X., Lei, Z., Shi, H., Wang, X., and Li, S. Z. (2017). “S3fd: Single shot scale-invariant face detector,” in Proceedings of the IEEE International Conference on Computer Vision (Venice: IEEE), 192–201.
Keywords: suicide risk screening, nonverbal behavior, speech prosody, region-based behavior analysis, multimodal fusion, deep learning automatic suicide risk screening
Citation: Alghowinem S, Zhang X, Breazeal C and Park HW (2023) Multimodal region-based behavioral modeling for suicide risk screening. Front. Comput. Sci. 5:990426. doi: 10.3389/fcomp.2023.990426
Received: 10 July 2022; Accepted: 03 February 2023;
Published: 20 April 2023.
Edited by:
Itir Onal Ertugrul, Utrecht University, NetherlandsReviewed by:
Heysem Kaya, Utrecht University, NetherlandsMerel M. Jung, Tilburg University, Netherlands
Copyright © 2023 Alghowinem, Zhang, Breazeal and Park. This is an open-access article distributed under the terms of the Creative Commons Attribution License (CC BY). The use, distribution or reproduction in other forums is permitted, provided the original author(s) and the copyright owner(s) are credited and that the original publication in this journal is cited, in accordance with accepted academic practice. No use, distribution or reproduction is permitted which does not comply with these terms.
*Correspondence: Sharifa Alghowinem, c2hhcmlmYWhAbWl0LmVkdQ==