 Mélodie Sannier
 Stefan Janaqi
 Gérard Dray
 Pierre Slangen
 Benoît G. Bardy
94% of researchers rate our articles as excellent or good
Learn more about the work of our research integrity team to safeguard the quality of each article we publish.
Find out more
ORIGINAL RESEARCH article
Front. Comput. Sci., 07 December 2023
Sec. Human-Media Interaction
Volume 5 - 2023 | https://doi.org/10.3389/fcomp.2023.1270520
This article is part of the Research TopicRe-Imagining Mediated Human Building Interaction and Sensory EnvironmentsView all 7 articles
Introduction: Walking indoors, particularly at home, presents a distinct experience compared to the conventional pedestrian walking classically described. Our homes encompass intricate, confined, and cluttered architectural spaces that necessitate a predominantly curvilinear walking pattern. Despite the growing interest in studying our home, spurred by successive COVID-19 lockdowns, there remains a dearth of information regarding our walking behaviors inside homes, yet rich in data on the physical and sensory links between humans and their daily interior environment.
Methods: This study presents the outcomes of a controlled experiment conducted in an apartment in Montpellier, France. Participants were tasked with traversing the living room at a natural pace, encountering two natural obstacles-a large dining table and a small coffee table. They then walked back in opposite direction, circumnavigating the same two obstacles. To examine walking behavior within a pseudo-natural context, three conditions were tested: a controlled condition and two conditions that perturbed the natural curvilinear trajectory perceptually, by imposing an unpleasant sound, or physically, by suddenly displacing the coffee table between conditions. Twenty participants performed 30 trials in each condition. We approximated the position of their center of mass and computed various metrics related to their trajectories, including walking speed, obstacle clearance distance, its adaptation over time, and inter-trial trajectory variability.
Results: Findings revealed a greater visual clearance distance for the dining table compared to the coffee table, a difference reduced by the perturbation caused by displacing the coffee table. This clearing distance diminished with repetitions, showing that over time we tend to walk closer to obstacles around us. These adaptations were clearly the result of an active visuo-motor regulation, as evidenced by the reduced trajectory variability at, or just before, the location of the obstacles.
Discussion: Collectively, these results demonstrate that walking at home is a flexible behavior necessitating continuous perceptual adaptations in our daily trajectories. These findings could contribute to a detailed analysis of walking indoors under natural conditions, and the investigated metrics could serve as a baseline for comparing the embodiment of physical and mental health in walking patterns, for instance during lockdowns. Furthermore, our findings have consequences for safer mediated human architecture interaction.
The worldwide COVID-19 pandemic has compelled us to change our habits and spend more time in our homes, which can be described as a restricted and cluttered environment with obstacles such as tables, chairs, and furniture (Djaoui, 2011). The pandemic has highlighted the importance of understanding our behavior within the home, specifically our indoor locomotor behaviors. Previous research has extensively documented natural walking in outdoor settings, including urban environments (Losing and Hasenjäger, 2022), rural areas (Knoblauch et al., 1996; Pecol et al., 2011), and natural environments such as parks and forests (Song et al., 2019; Luo et al., 2020). Some studies have focused on locomotor trajectories in more confined spaces, such as laboratories (Hicheur et al., 2007), shopping malls (Hangland and Cimbalo, 1997) or even on airplanes (Borwein et al., 2012). However, the investigation of how we walk in the restricted space of our everyday living environment, i.e., our home, is a relatively recent area of study. Research has begun to document the behavior of healthy individuals at home (Glaister et al., 2007; WSJ, 2012; Sannier et al., 2022), with implications for rehabilitation (Lim et al., 2021) and healthy aging (Taleb et al., 2009; Borelli et al., 2019). However, crucial information is still lacking, particularly in understanding the characteristics, needs, and locomotor constraints of people living naturally at home. In this article, we present the results of an experiment conducted within a fully furnished apartment. The purpose of this experiment was to gain a better understanding of how our daily locomotor metrics are influenced by the presence of obstacles, such as tables, or sensory perturbations like external noise.
Walking is a natural form of human locomotion that requires the integration of motor, perceptual, and cognitive abilities (Delafontaine, 2018). It is characterized by a two-step walking cycle, consisting of left and right steps. On average, the step length falls between 50 and 80 cm, with a mean value of 64 cm and a duration of 536 ms (McGeer, 1990; Winter, 2009). The walking cycle corresponds to a stride, which is the sequence of two steps. It is typically identified by the initial heel strike of the right foot until the subsequent heel strike of the right foot. The stride is defined by its frequency (Fstride), length (Lstride), and speed (V) as follows (Pheasant, 1981):
Speed is a commonly used metric to describe walking and can serve as an indicator of health. This metric reflects our locomotor capabilities (Middleton et al., 2015), particularly indicating a minimal energy consumption (Ralston, 1958). Moreover, walking speed varies based on factors such as sex (Troje, 2002), age (Bohannon, 1997), physical health conditions (e.g., arteriosclerosis, muscular injury, skeletal damage) (Feldman et al., 2019), as well as psychological health conditions (e.g., depression) (Michalak et al., 2009). Typically, a walking speed in the range of 1.2 to 1.4 m/s is considered “normal.” Speeds above this range are categorized as “fast,” with a maximum speed between 2.0 and 2.3 m/s, while speeds below 1.0 m/s are classified as “slow,” often observed in older adults or individuals with specific pathologies (Bohannon, 1997). In addition to speed, locomotor trajectories are also classically studied through factors such as for instance the kinematics of the lower limbs (Patla and Rietdyk, 1993; Austin et al., 1999; Fink et al., 2007; Van Opstal et al., 2022), kinetic energy (Bertram, 2005; Emken et al., 2007; Selinger et al., 2015), or spatio-temporal walking parameters (Lee and Lishman, 1977; Ondrej et al., 2010; Olivier et al., 2012), as well as their variation with environmental (obstacles, luminosity) (Patla and Rietdyk, 1993; Austin et al., 1999; Fajen and Warren, 2003), psychological (depression, chronic fatigue) (Michalak et al., 2009; Feldman et al., 2019) and physical (injury, aging) factors (Said et al., 2001; Grinberg et al., 2022). Specific metrics such as the distance covered and its associated travel time, step frequency and length, speed changes (acceleration, deceleration), or trajectory radius of curvature have often been used, but always in the laboratory or outdoor, and have never been documented indoor. The first goal of this study was therefore to provide information on walking at home through the study of locomotor trajectories performed inside an apartment.
An essential constraint that significantly influences our walking behavior at home is the presence of obstacles, such as low- and high-level tables, chairs of various sizes, floor lamps, and the couch in our living room. These obstacles impose significant spatial limitations on our walking patterns, resulting in non-linear trajectories (e.g., curvilinear paths) that require visuo-locomotor adaptations (Emken et al., 2007). These curvilinear locomotor trajectories are accentuated by the type of obstacle encountered (e.g., mobile or stationary) (Silva et al., 2018). They create substantial demands on the locomotor system and its gait optimization mechanisms (Bertram, 2005; Glaister et al., 2007; Selinger et al., 2015), aiming to minimize gait disturbances (e.g., slipping, falling, colliding with chairs) (Yamaguchi et al., 2018) while enabling the achievement of locomotor goals (e.g., moving from one room to another).
Curvilinear paths reduce our walking speed as obstacles are approached to avoid the risk of collision (Silva et al., 2018), exponentially so with decreasing distance from the obstacle (Fajen and Warren, 2003). Tangential velocity is often correlated with the radius of curvature (Hicheur et al., 2004, 2007), and goal-directed curved walking implies fine motor control according to the principles of optimality and maximization of trajectory smoothness (Fajen and Warren, 2003).
To gain a comprehensive understanding of the locomotor behavior of individuals in their home environment, it is therefore essential to investigate how they navigate in the presence of obstacles along their intended path toward a goal. Previous research (Fajen and Warren, 2003; Peyer et al., 2017) suggests that obstacles encountered during walking can be regarded as repellers that need to be avoided, while goals (such as reaching the refrigerator or the door) act as attractors influencing locomotor dynamics. The interplay between locomotor attractors and repellers significantly influences the trajectories of our walking movements at home, and this aspect requires further investigation. Addressing this gap constituted the second objective of our study.
Research on embodied cognition (Troje, 2002), affordances (Cornus et al., 1999), and emotions (Montepare et al., 1987; Michalak et al., 2009; Barliya et al., 2013) have consistently demonstrated over the past three decades the intricate connection between our cognitive and social functions and our daily movements. Body movements contain rich personalized information (Troje, 2002; Chen and Shen, 2017), with each person exhibiting unique physical expressions in their movement patterns (Emken et al., 2007). These movements reflect how individuals interact with their natural, technological, or social environments (Cutting and Kozlowski, 1977; Losing and Hasenjäger, 2022), revealing both physical and psychological attitudes or affordances (Montepare et al., 1987). Walking, in particular, plays a significant role in these embodied manifestations, conveying distinctive information about gender through hip rotation in the fronto-parietal plane, degree of lateral body sway, hip to shoulder width ratio, and elbow position (Bohannon, 1997; Feldman et al., 2019); personality through gait speed and its consistency over time (Stephan et al., 2017); emotion through arm amplitude, stride length, or walking speed (Montepare et al., 1987); and mood through gait patterns, head movement, or lateral body sway (Michalak et al., 2009).
Some of these attributes, such as mood, emotion, and personality, can be categorized under the broader concept of wellbeing. Wellbeing is a complex and multidisciplinary concept (Keyes et al., 2002), encompassing psychological, physical, and socio-environmental dimensions (World Health Organization, 1946; Feldman, 2006). For example, Keyes et al. have established a correlation between wellbeing and personality traits, demonstrating that subjective wellbeing (SWB) and psychological wellbeing (PWB) are higher among individuals with high levels of extraversion, conscientiousness, and openness to experience, as well as lower levels of neuroticism (Keyes et al., 2002). In this study, we define wellbeing as the absence of psychological and physical discomfort. Assessing wellbeing necessitates observing its variations over a certain period rather than relying solely on strict measurements at a specific moment, such as through questionnaires like the Well-Being Manifestation Measure Scale (WBMMS), as the subjective perception of personal wellbeing depends on individual objectives. Environmental comfort can be manipulated to evaluate wellbeing. Previous research has documented the influence of comfort, particularly architectural comfort, on wellbeing (Serfaty-Garzon, 2003; Lavoye and Thellier, 2008; Roussel, 2017). This encompasses factors such as acoustic comfort (noise), olfactory comfort, lighting comfort, and thermal comfort (Choi et al., 2015). A third objective of this study was to assess the impact of environmental comfort on indoor walking dynamics. We specifically focused on noise (including the concept of noise scale, e.g., Moreau, 2001) as a disturbance to personal wellbeing. Variation in acoustic comfort parameters is prevalent in our homes, especially for those residing in busy city centers. Moreover, it is a parameter that can be easily controlled experimentally.
The aforementioned objectives, which aim to better understand how we walk at home by quantifying locomotor metrics and assessing the influence of obstacles and acoustic discomfort on our walking trajectories, were evaluated through an experiment conducted in a furnished apartment.
Twenty adults, including 9 women [mean age = 31.75, standard deviation (SD) = 11.94, median = 27.00], were recruited mainly through the authors' network in Montpellier to participate in our study on a voluntary basis. No financial or material compensation was provided to the participants. They self-reported having no psychomotor pathologies. To ensure safety during the COVID-19 pandemic, both participants and experimenters adhered to protective measures that were defined and implemented prior to the experiment. All participants were provided with detailed information about the study through an information letter and provided written informed consent. Additionally, they were required to complete and sign a non-disclosure agreement, which aimed to safeguard the project's experimental location.
Before and after the experiment, participants were asked to complete the original French version of the “Well-Being Manifestation Measure Scale” (WBMMS), a questionnaire consisting of 25 items that assess personal psychological dimensions such as self-esteem, equilibrium, social engagement, sociability, self-control, and happiness (Massé et al., 1998a,b).
The research protocol received approval from the Institutional Review Board of the EuroMov Digital Health in Motion research unit at the University of Montpellier, France (Protocol No. IRB-EM: 2004B). The study was conducted in accordance with the principles outlined in the 1964 Helsinki declaration and its subsequent amendments.
The experiment was conducted over a 2-week period during the summer of 2020 in the observatory apartment established by the Human at Home project (HUT), the overarching interdisciplinary project in which our study was conducted.1 The apartment, located in the center of Montpellier, France, was vacant at the time, providing the opportunity for us to set up the area of interest, specifically the open kitchen-living room area, with a full Qualisys motion capture system. This system consisted of 10 Qualisys infrared cameras of the Miqus M3 type2, which enabled the capture of participants' body kinematics at a sampling frequency of 100 Hz. Four retroreflective markers were placed on the participants' hips (HipFR, HipFL, HipBR, and HipBL) to track their movements. Additional markers were placed on the head and on the caudal part of the body, defined by the transverse plane, to ensure continuity of data capture and processing, as well as to track the skeleton in cases where the main markers of interest were no longer visible to the cameras (e.g., feet markers).
The two obstacles on the participants' walking path were also identified and located using eight retroreflective markers (four for each obstacle) visible to the infrared cameras. Markers not visible to the participants were utilized to maintain the precise spatial location of the obstacles. The Qualisys camera system was calibrated twice daily by the researcher to ensure the quality of data acquisition throughout the experiment.
Additionally, a sound system comprising a speaker was installed in the apartment, specifically positioned in front of one of the obstacles. This sound system was utilized only during one of the experimental conditions (condition 3). The intensity of the emitted sound was measured each morning using a Sauter SW 1000/SW 2000 sound level meter (version 1.1, 01/2018 EN), allowing the measurement of the acoustic environment in dB(A). Therefore, the initial acoustic environment of the apartment was measured daily before the participants' arrival. Furthermore, the researcher ensured daily that the emitted sounds did not exceed the threshold value of 80 dB(A) (directive n°2003/10/CE).3
The participants were provided with general information about the experiment before it begun. They were informed about the research objective, which was to understand human locomotor behaviors at home by studying their movements and adaptations when encountering obstacles. Upon arrival, they were required to disinfect their hands using soap and hand sanitizer. Throughout the entire experiment, all individuals present in the apartment, including the experiment team and participants, wore surgical masks to control and limit the spread of COVID-19. After giving their written consent, participants were asked to complete the WBMMS survey on wellbeing. They were then equipped with the markers.
The experiment consisted of three experimental conditions, following a brief familiarization phase of 3 min with the indoor setup and equipment. During this phase, participants were positioned at the center of the experimental space to ensure visibility by all cameras. They were then instructed to walk in place for 10 s. This step allowed for optimal capture of walking data and facilitated the subsequent implementation of the Automatic Identification of Markers (AIM) technique. For each condition, they were required to perform 30 round trips, approximately 15 min of walking, in the experimental area following a predetermined curvilinear trajectory that included two furniture-type obstacles: the dinner table and the coffee table.
The first condition involved a natural walking situation. Participants performed the 30 repetitions at their spontaneous walking speed, following the predefined trajectory from the corridor to the terrace and then from the terrace to the corridor (Figure 1, condition 1). The gait observed during this step was considered as the baseline locomotor pattern for each participant.
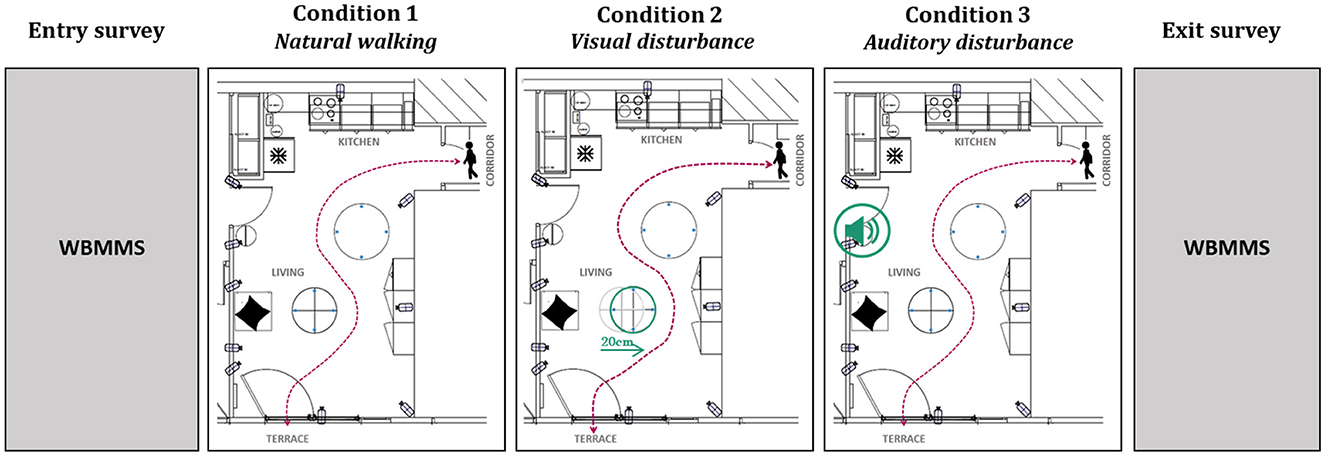
Figure 1. Curvilinear trajectories observed during the forward and return walking phases in the three conditions: (C1) natural walking condition, (C2) visual disturbance condition in which the coffee table was displaced by 20 cm, simulating the unexpected presence of an obstacle on the original trajectory, and (C3) auditory disturbance condition created by adding white noise [76 dB (A)] emitted from a loudspeaker. WBMMS refers to the wellbeing survey of 25 items which measure self-esteem, equilibrium, social engagement, sociability, self-control, and happiness.
The second condition introduced a visual locomotor disturbance. One of the two obstacles (the coffee table) was moved 20 cm out of sight from the participants in their corridor initial position (Figure 1, condition 2). They repeated the same exercise under similar conditions (30 repetitions, 15 min, spontaneous pace). At the end of this condition, the displaced obstacle was returned to its original location.
The third condition involved a disturbance in acoustic comfort. The acoustic environment was modified by adding a physical noise level ranging from 70 to 80 dB(A) with a frequency band of 125–4,000 Hz (Moreau, 2001). These parameters were selected to simulate annoying and tiring noises commonly encountered in daily life, such as traffic noise, vacuum cleaner noise, or dog barking. For this study, household noise recordings (e.g., vacuum cleaner noise) were superimposed. Participants repeated the same exercise under this acoustic perturbation. Once the 30 round trips were completed, the acoustic comfort condition was reset.
Condition 1 was always performed first and served as the control condition, while the order of conditions 2 and 3 was counterbalanced between participants to minimize experimental bias.
After completing all three conditions, participants were once again asked to complete the wellbeing survey (WBMMS), which was initially administered at the beginning of the experiment. This allowed for a comparison of the participants' wellbeing before and after the experiment.
Statistical power analysis using G*Power software (3.1.9.2) allowed us to define a sample size necessary to detect a significant effect equal to 20 participants (N = 20). The reference criteria chosen followed the suggestions of Cohen (1988) and Faul et al. (2007), including (i) an effect size d = 0.8, (ii) a risk α = 0.05, and (iii) a power 1-β = 0.95.
The collected data were anonymized, stored, and then visualized using Qualisys Track Manager 2021.2 (QTM) software. With the Center of Masses (CM) identified as the spatial landmark of interest, the four hip markers (HipFR, HipFL, HipBR, HipBL) were manually identified from the QTM interface.
The manually processed data were then exported in “.mat” format for automatic processing with Matlab R2021b numerical computation and programming software.
The first step was to reconstruct the spatial plan of the experimental zone. Four cardinal points were recorded for each of the two obstacles through their IR markers (Figure 2). The dining table, a tall and imposing round table (RT), remained stationary at a height of 715 mm. The coffee table, a square one (ST), stood at a height of 400 mm and could occasionally be displaced (condition 2) within the plane, shifting 20 cm along the Y-axis. Points RT02 and ST01 were then used to calculate the distance between the trajectories and the obstacle.
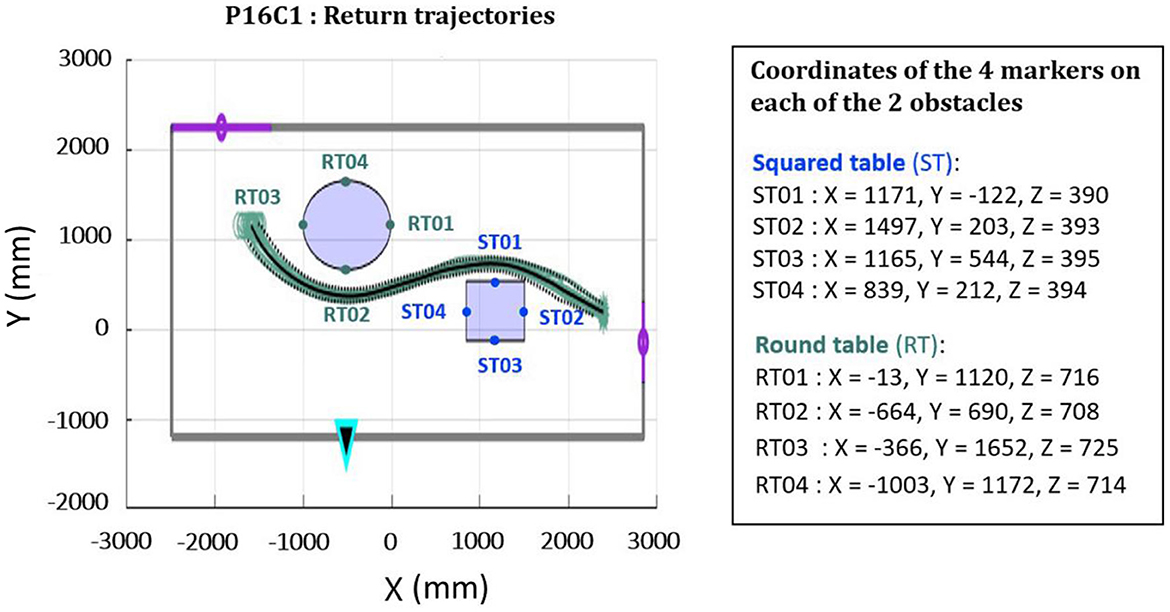
Figure 2. Static graph of the apartment. Markers on the round dining table (RT) and the square coffee table (ST) are marked in green and blue, respectively. The loudspeaker (bottom light blue arrow) was located opposite to the large table. Entrance (top) and terrace (right) doorways are marked in purple. Points RT02 and ST01 served to calculate distances from obstacles to walking trajectory.
The spatial constraints of the apartment led to some visual loss of markers by the Qualisys cameras. This is a common problem in Motion Capture (MoCap) experiments because of marker's occlusion by the environment or the participant's movements. As the hip can be considered as a solid, i.e., non-deformable body, we applied the method described by Janaqi et al. (2022). We filled the missing data on frames showing at least two visible markers. This allowed us to recover up to 80% of the data, and to calculate the projection onto the floor plane of the hip center of mass (CoM) (Tesio and Rota, 2019).
Let the floor coordinates of a frame of hip CoM be [x(t), y(t)]. A trajectory is the chain of [x(t), y(t)] for t = 1, …, T. A simple detection of movement direction allowed to distinguish between forward trajectories– from corridor to terrace—and return trajectories—from terrace to corridor.
This distinction is necessary in the following analysis, not only to distinguish between forward and return trajectories, but also to discriminate first and second obstacles on those trajectories.
The exact location of the obstacles being known (Figure 2), we were able to determine the number of trajectories that did not comply with the original instructions. Indeed, we occasionally observed (only in Condition 2 in which the small table was displaced) in some trials participants who did not walk around the obstacle (Figure 3) but linearly “cut the trajectory” on the other side of the coffee table. Those trials were marked and analyzed separately.
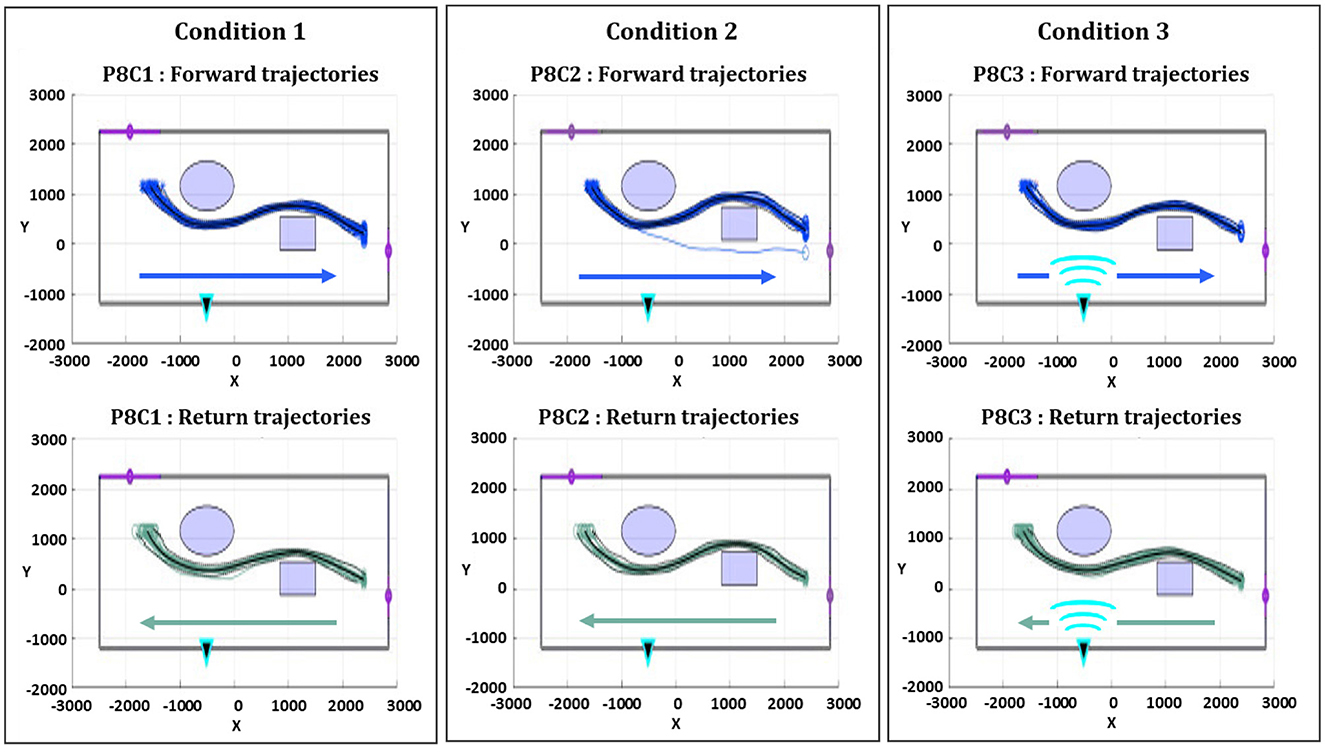
Figure 3. Representative trajectories in the apartment (example of participant 8). Forward and return trajectories are distinguished for each condition (C1, control; C2, obstacle displacement; C3, unpleasant noise through speaker). In some cases, C2 led to non-compliance with the walking instruction, as participants walked around the wrong side of the small table.
Next, we evaluated the inter-trial trajectory variability. During the experiment, 1,800 × 2 (forward and returns) = 3,600 trajectories were performed. However, we had to exclude 941 of these trajectories due to the loss of markers observed in the following circumstances: masking by obstacles or body parts, high indoor luminosity, detachment of markers, interference due to light reflection. These trajectories were removed, principally in condition 2 (obstacle disturbance) for participants 6, 7, 13, and 15. Some trajectories for participant 13 in condition 3 were also lost. The resulting set of forward and return trajectories for each participant formed a tube with an average of 23 curves for each set. We calculated the resulting width of the tube for each direction (forward, return) in each condition, through its mean and standard deviation at the meridian to each obstacle, as well as its evolution over the trajectory (see Figure 4).
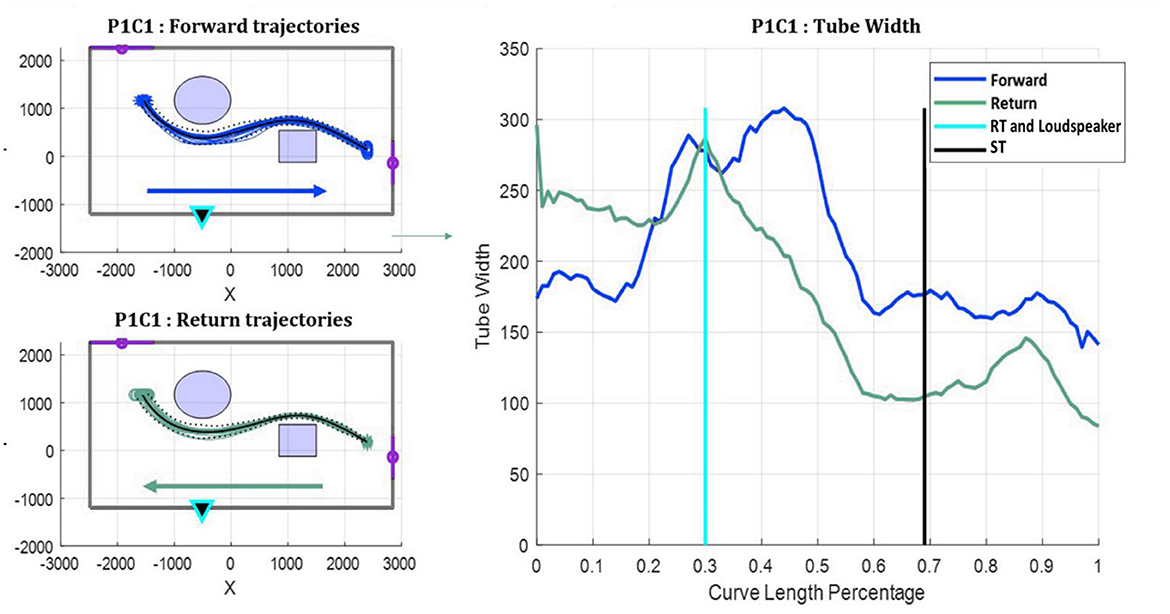
Figure 4. Representation of the trajectory variability tube. Left: A set of representative trajectories forming the variability tube for one participant in forward (dark blue) and return (green) directions. Right: Evolution of the tube width in millimeters over the trajectory (expressed in Curve Length Percentage) for the two directions. Locations of the repellers (tables and sound) are indicated by vertical bars.
For each trajectory we calculated the walking speed , distribution profile, mean and standard deviation. We also calculated the distance between the trajectory and each obstacle. The distance was measured at the meridian points of the two obstacles, RT02 and ST01 (Figure 2). In order to evaluate the evolution of these distances through the 30 trials, we fitted a linear regression model onto the relationship between distance and trials, and obtained the slope and regression coefficient for each participant, each condition and each walking direction. This information enabled us to assess the overall change over repetitions of the distance ratio (Figure 5).
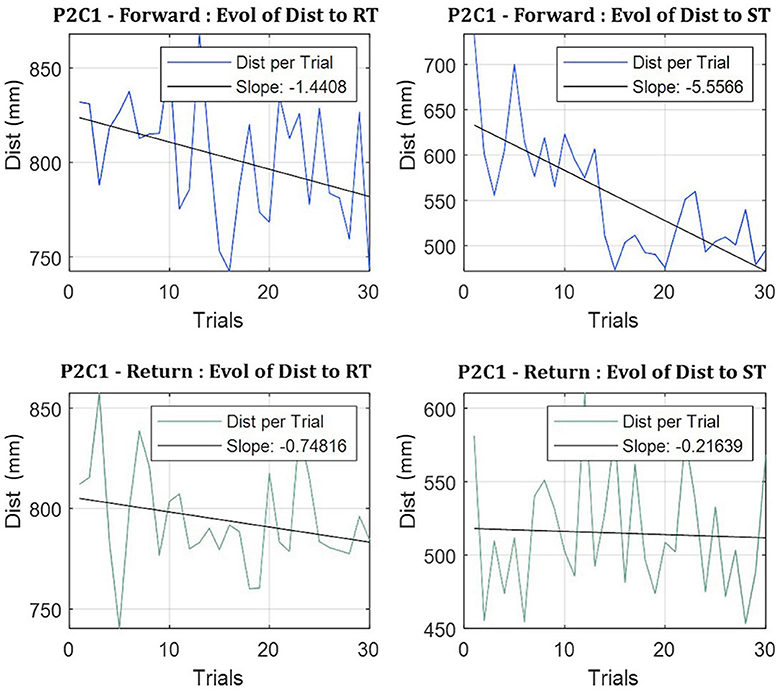
Figure 5. Evolution of the distance to the two obstacles (RT and ST) over the course of 30 trials, in both directions, for one representative participant. In this specific example, the distance to obstacles decreased with repetitions (slopes −1.44 and −5.56) for forward trajectories, not for return trajectories.
Each of the 20 participants completed the WBMMS questionnaire twice: once before the experiment, and once after. The 25-item version of the questionnaire, typically used in epidemiological studies, was chosen over the 47-item version. The scores obtained from the questionnaire were calculated following recommendations of Massé et al. (1998a,b) on the initial factors of wellbeing: (i) self-esteem, (ii) balance, (iii) social commitment, (iv) sociability, (v) self-control, (vi) happiness. Each of these initial factors scored a total of 20 points, except for the happiness category, which scored 25 points. Thus, overall wellbeing was characterized by a maximum score of 125 points.
Participants obtained an average general wellbeing score of 95 points and 98 points before and after the experiment, respectively. A MANOVA performed on the 6 initial factors highlighted a significant variation in the sense of wellbeing, F(1, 38) = 369.466, p < 0.001, characterized by an increase in self-esteem, balance, social engagement and happiness, accompanied by a decrease in sociability and self-control (all ps < 0.05) (Figure 6). The experiment thus induced a significant disruption in general wellbeing, primarily through the social factors.
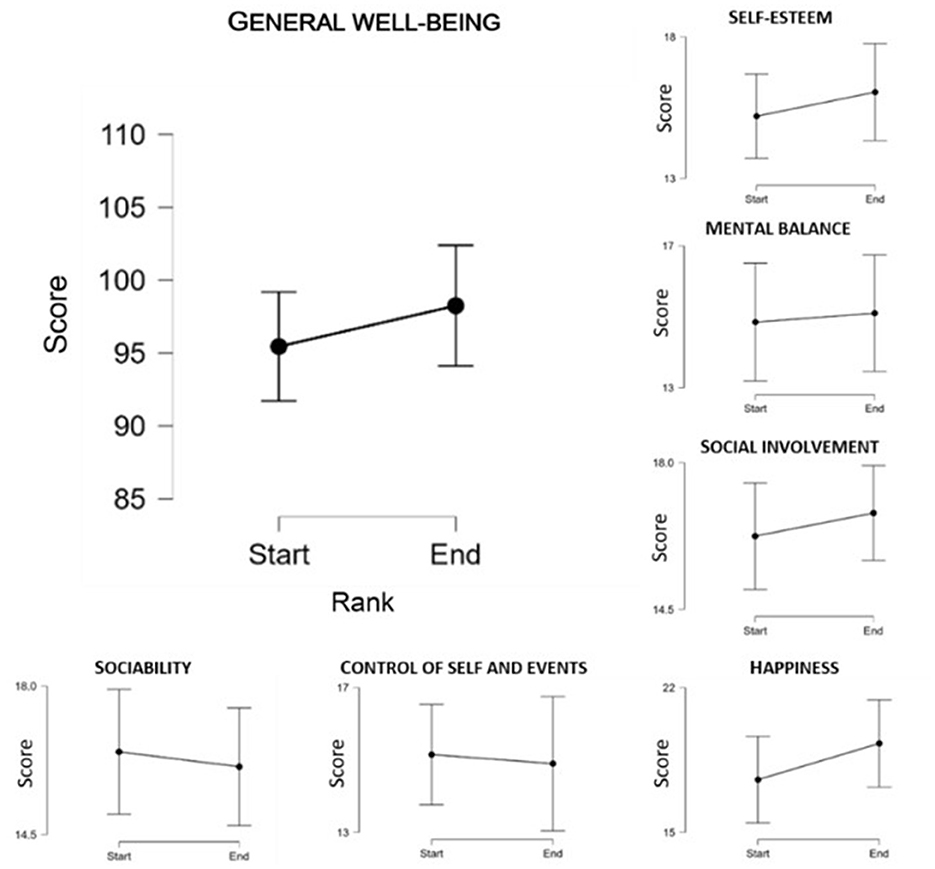
Figure 6. WellBeing Manifestations Measure Scale (WBMMS) scores before and after the experiment. The general wellbeing score and the scores for each initial factor are shown. Pre-post differences are significant for the 6 initial factors (all p < 0.001).
These results are surprising when we consider that the primary aim of noise disturbance was to reduce indoor comfort and, potentially leading to a decrease in overall wellbeing. However, they remain consistent. The initial decrease in social factors aligns with behaviors observed during noise exposure at around 80 dB(A), such as decreased solidarity and increased aggressive behavior (Timm et al., 2014). The increase in overall wellbeing, especially in terms of happiness, can be attributed to experimental factors, including the characteristics of the chosen noise nuisance (everyday, voluntary, repetitive, and often self-initiated), and the duration of exposure (approximately 10 min), which made the noise less aggressive, aversive and disturbing due to adaptation (Nelson and Meyvis, 2008).
In order to study participants' locomotor behavior during our home walking task, we first observed their walking speed (mean and variability), the classic metric of locomotor efficiency. As research has shown a decrease in walking speed with negative psychological states (i.e., depression or mood disorder; Troje, 2002), we hypothesized that condition 3 would induce a significant decrease in walking speed at home.
The mean velocity represents the average velocity across all trials, conditions and participants. Speed variability (Standard Deviation, SD) was calculated for each participant in each condition. The overall averaged speed in this experiment was 1.076 m/s, which is consistent with data classically found in the literature (Winter, 2009). No significant difference between conditions were found (p > 0.05). In addition, we adjusted a linear regression on the velocity vs. trial data to search for a continuous change in walking velocity over repetitions, and performed a complementary ANOVA on the (Z-transformed) R2 values of the regressions (with conditions and directions as factors). We did not find any significant effect. However, walking speed variability showed significantly lower variability in the noise discomfort condition (C3) (mean = 0.027m/s, SD = 0.009), compared to conditions C1 (mean = 0.034m/s, SD = 0.012) and C2 (mean = 0.031m/s, SD = 0.014), F(2, 106) = 3.110, p = 0.049, confirming an effect of conditions on speed. Here we can assume that the sound disturbance required a higher cognitive and visual control of the trajectories, thereby homogenizing some behavioral metrics including speed variability.
The clearance distance to the obstacles at points RT02 and ST01 was calculated (see Figure 2 for point references). The RoundTable (RT) was an oval dining table, 715 mm high (at hip level), heavy and difficult to move. The Squared Table (ST) was a square, 400 mm high (at shin level), lightweight coffee table, with four corners presenting potential collision hazards.
We conducted a three-way ANOVA (conditions × direction × order) on the average clearance distance. First, this ANOVA revealed an effect of conditions, F(2, 223) = 36.927, p < 0.001, showing a higher clearance distance during condition 2 (mean = 0.780 m) compared to condition 1 (mean = 0.685 m) and condition 3 (mean = 0.679 m). Second, the walking direction impacted clearance distance, with shorter distances during the return phase (mean = 0.728 m) than during the forward phase (mean = 0.702 m), F(1, 223) = 5.416, p = 0.021. Interestingly, a direction × order interaction was found, F(1, 223) = 323.315, p < 0.001, showing (Figure 7A) an opposite trend between forward and return directions, depending on which obstacle came first. For forward trajectories, the first obstacle (RT) induced larger clearance distances, but for return trajectories, the second obstacle (also RT) induced larger distances. This interaction clearly signifies that the large round dining table, through its volume, height, and/or weight, imposed a more secured trajectory with less risk of collision than the small, square, and light coffee table, in line with existing research (Austin et al., 1999; Fink et al., 2007; Michalak et al., 2009). Finally, this interaction was also modulated by the walking conditions, F(2, 223) = 24.089, p < 0.001, showing that Condition 2 (see Figure 7B), in which ST was displaced without the explicit knowledge of the participants, created a large increase in clearance distance [post-hoc C1-C2 (mean difference = -0.098m), C2-C3 (mean difference = 0.104 m), test pBonferroni for all ps < 0.001].
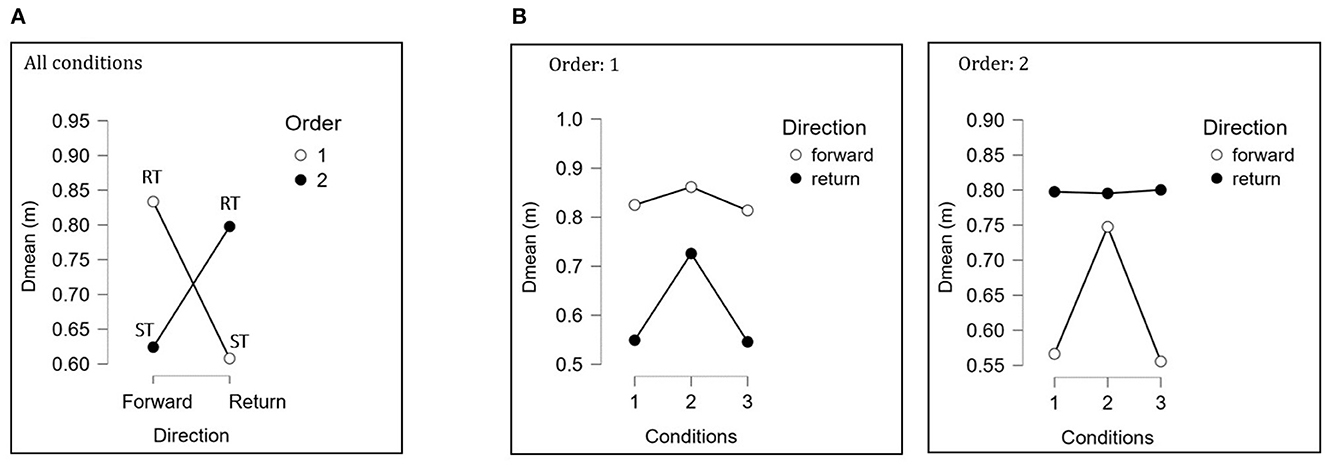
Figure 7. Visualization of the direction x order interaction (A) and of the conditions x direction x order (B) on Clearance distance Dmean. (A) Simple interaction: Influence of obstacle order on clearance distance. RT is the first obstacle to clear on the forward direction, but the second on the return direction, and vice versa for ST. (B) Double interaction: In the first box (Order 1), the upper white line represents the distance to RT, and the lower black line represents the distance to ST. In the second box (Order 2), the white line represents the distance to ST, and the black line represents the distance to RT. For further details, refer to the text.
These results demonstrate a modulation of our participants' gait both along their trajectories and across repetitions. Some obstacles, particularly RT, appeared to be perceived as more dangerous, requiring a greater clearance distance. On the other hand, moving ST in condition 2 seems to have altered the affordance associated with this obstacle, also leading to an increased clearance distance. This aligns with the ecological approach to perception (Gibson and Crooks, 1938) and reflects the principles of affordances developed by Gibson (Gibson, 1977; Reed, 1988). The differences in obstacle properties and their order on the trajectory seem to create unique affordances, influencing individuals to adapt their walking behavior accordingly.
Our interior space, which has restrictions due to its furnishings, imposes spatial constraints that are rarely altered over time, as furniture such as dining tables, sofas, and worktops are seldom moved. Consequently, we follow repetitive trajectories on a daily basis, and the temporal evolution of walking metrics, such as clearance distance, could reveal locomotor adaptations at home, enhancing our understanding of mediated human-environment interactions. In this section, we give a closer look to two of these metrics, the change in clearance distance of repetitions, and the trajectory variability.
As mentioned in the Section 3 (Figure 5), a linear regression model was fitted to the Clearance distance vs. Trial data for each participant, direction and condition. Figure 8 below represents the cummulated occurrence frequency (between 0 and 1) of all regression slopes (both negative and positive), for the two obstacle orders (first, second) and the two directions (forward, return). Overall, the slope of the regression was negative (mean = −0.031, SD = 0.07), indicating a general gradual decrease over time in the distance to the obstacle, with however important differences between direction and order. For instance, 69.16% of slopes were negative for the first obstacle (mean = −0.04, SD = 0.077), but only 65% for the second obstacle (mean = −0.022, SD 0.06), independently of obstacle size, and this difference was significant, F(1, 227) = 4.124, p = 0.043. In addition, the adaptation over trials was greater for the forward phase (mean = −0.04, SD = 0.07) than for the return phase (mean = −0.022, SD = 0.069), F(1, 227) = 4.364, p = 0.043. Together, these results suggest a more effective visual regulation in obstacle avoidance during forward trajectories and with the first obstacle, supporting the idea of greater perceptual control in those conditions.4
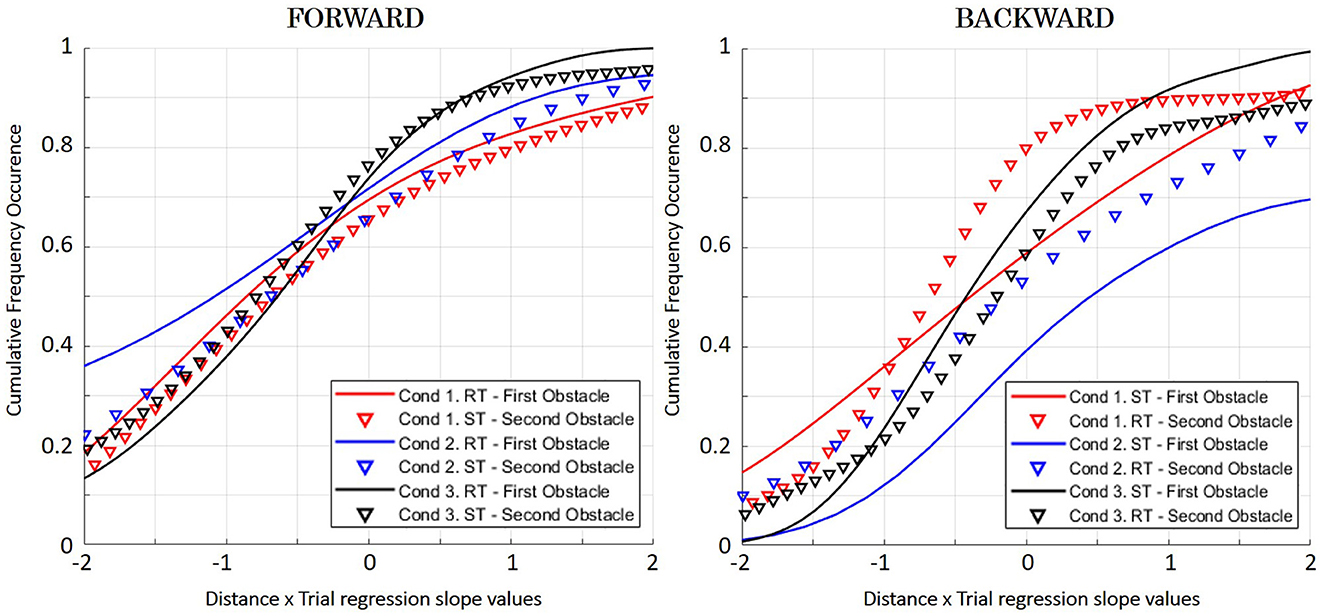
Figure 8. Cumulated frequency occurrence of Distance × Trial regression slope values. Conditions are represented by colors (C1 in red, C2 in blue, C3 in black) and order obstacle by lines (first obstacle: full line, second obstacle: discontinuous line). The x-axis represents the slope of the Distance-Trial regression. The y-axis is the cumulative frequency of observations of the slope values, between 0 and 1.
By projecting the trajectories onto a 2D plane of the apartment, we were able to determine the average trajectory followed by the participants and its dispersion—represented as the variability tube—for each direction and condition (see Section 3, Figure 4). The total path was divided into frequency intervals (FI) of 0.05 to analyze not only the width of the tube at the meridian of the obstacle, but also its evolution during curvilinear forward and return walking under each condition. To achieve this, we calculated the derivative of our “Tube Width” for each interval and determined the median sign of that derivative in each FI. A positive sign indicates an increase in the width of the variability tube, while a negative sign indicates a decrease in the width of the variability tube, suggesting reduced variability during passage and thus better locomotor control. Obstacle 1 (O1) was located at FI0.3 and obstacle 2 (O2) was located at FI0.7.
First, the analysis of the tube widths revealed similar variability of the trajectories' tube at the obstacle meridians for the two obstacles (meanRT = 160.48mm, SD = 51.67; meanST = 162.44mm, SD = 51.38). A significant effect of the walking direction was found, F(1, 223) = 9.227, p = 0.003, indicating that the return variability tube (mean = 153.46mm) was smaller than the forward variability tube (mean = 176.10mm).
Second, the analysis of the tube width derivative (Figure 9) reveals clearly visible local minima at the location of the first obstacle, both in the forward phase (for RT) and in the return phase (for ST), testifying to the signature of visuo-locomotor regulation, during table approach (Fajen, 2021). As shown in complex visuo-motor skills (e.g., Bardy and Laurent, 1998), a decrease in inter-trial variability when approaching an obstacle is a sign of a perceptual regulation witnessing a strong coupling with the environment. Secondly, these local minima are also present at or near the second obstacle in five of the six conditions shown in Figure 9, suggesting that a similar pattern of regulation is occurring, albeit on a more modest scale.
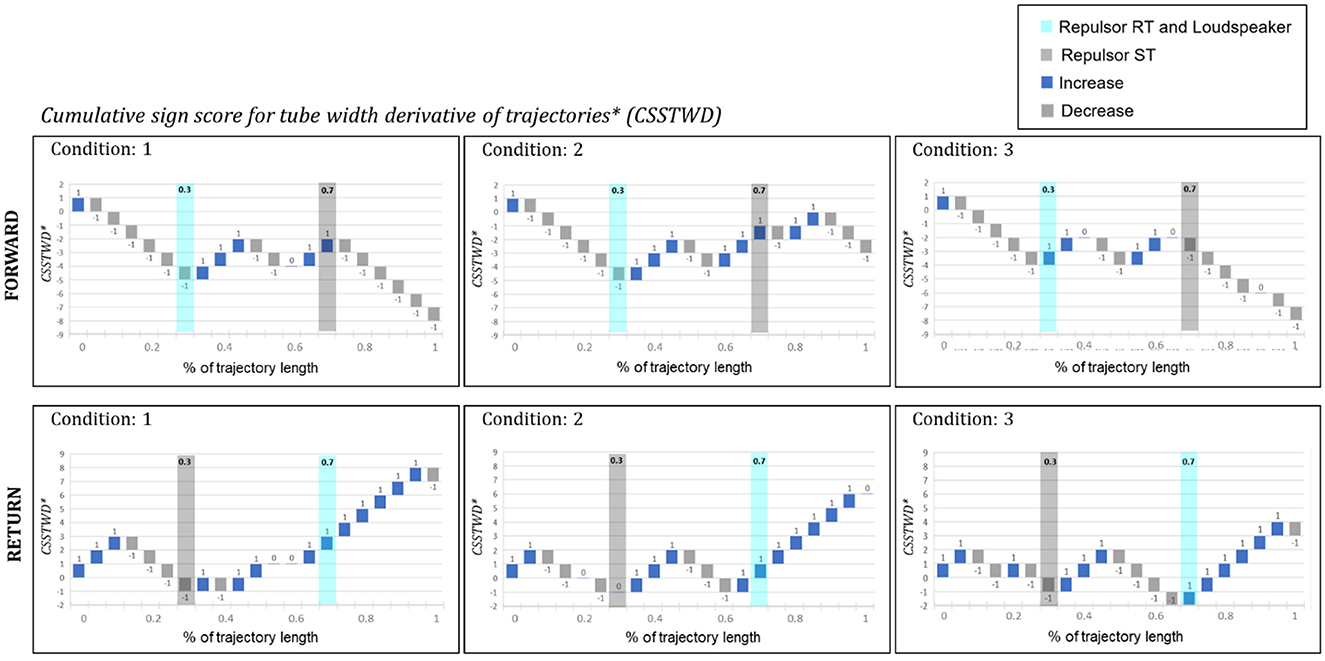
Figure 9. Evolution of the sign of the variability tube derivative by condition and direction. The evolution of the derivative's sign is represented in the form of an evolutive cascade of positive and negative derivatives. The y-axis tracks the Cumulative Signed Score for Tube Width Derivative for each 0.05 interval (CSSTWD). The location of round table RT and square table ST on the trajectories are represented by blue and gray bars respectively. Positive derivative signs are identified by dark blue rectangles and represent an increase in inter-trial trajectory variability, i.e., the variability tube. Gray rectangles, symbols of negative derivative signs, represent a decrease in the variability tube, and therefore a signature of a visuo-motor regulation in the walking pattern, visible at or just before each obstacle.
The reconstruction and visualization of the trajectories quickly revealed occasional errors in task execution (Section 3.4.2.3.1). We isolated those trajectories that did not comply with the instructions. It was immediately apparent that this change in trajectory only occurred during the unexpected obstacle displacement condition (C2). The purpose of moving the obstacle 20 cm along the Y axis was to impose spatial constraints that accentuated the curvature of the initial trajectory. Only the small table was found to induce this misalignment in some participants (n = 6), more frequently for forward trajectories than for return trajectories. Participants instinctively passed by the wrong side of the small table, more often when it was the second obstacle compared to when it was the first obstacle. This behavior may be linked to perception and spontaneous energy saving (Bertram, 2005; Ondrej et al., 2010; Selinger et al., 2015).
Successive lockdown situations have highlighted the need to better understand how we behave at home. Walking is a complex locomotor activity, involving several sub-systems (the motor system, the perceptual system, the cognitive system), and can provide valuable information about our psychological and physical state (Troje, 2002; Delafontaine, 2018). The goal of the present study was to investigate our daily locomotor behavior at home in the presence of obstacles, to better understand the mediated interactions between individuals and interior architecture.
Our research highlights several important findings. First, our curvilinear locomotor trajectories passed closer to large obstacles (RT) than to small obstacles (ST). Second, this clearing distance was not fixed but diminished with repetitions, showing that over time we tend to walk closer to obstacles around us. This trend was not due to changes in walking velocity, which remained unchanged over repetitions. Third, this adaptation was more salient with the first obstacle individuals encountered compared to the second, for both the forward and return phases, regardless of the obstacle size. Fourth, trajectories were more similar to each other during the return phase than during the forward phase. Fifth, these adaptations were clearly the result of an active perceptual regulation, as evidenced by the reduced trajectory variability at or just before the location of the obstacles. All the results above were obtained in the three tested conditions, which did not differ significantly from each other, except in C2, where displacing the small table created a larger clearance distance.
Our home is filled with various obstacles, such as large and small furniture with different shapes like round or rectangular. The arrangement of these obstacles usually does not change much, leading to repetitive, mostly curvilinear, paths when moving around the house. However, slight variations may occur, such as moving a lightweight piece of furniture. The characteristics of these obstacles naturally affect how we control our gait around them (Patla and Rietdyk, 1993; Austin et al., 1999; Zhao and Warren, 2015), in our case a large table requires more space to pass by compared to a small one. When we encounter a small obstacle that has been unexpectedly displaced, it disrupts our typical locomotor pattern by forcing us to take more winding paths, leading to larger clearance distances. This is because the angle of the small table makes it more repellent, requiring us to walk around it with more distance (Fajen and Warren, 2003). In our daily life, the arrangement and characteristics of furniture change their affordances and therefore influence how we walk. If we strategically place large tables in areas with fewer obstacles, it would reduce the need for winding paths. Consequently, obstacles would be less bothersome, allowing for closer and more controlled movement and reducing the risk of collisions inside the house (Fajen and Warren, 2003). In essence, designing large tables in this way would make navigation within our living spaces easier.
In the context of walking at home, navigating through curvilinear paths obstructed by multiple obstacles requires continuous adaptation, which is regulated by the perceptual information picked up in the surroundings (Gibson and Crooks, 1938; Zhao and Warren, 2015). A decrease in distance to the obstacle with each attempt indicates a temporal locomotor adaptation, which is a sign of locomotor learning. In our study, the adaptive behavior was influenced by the order of the obstacles, where the first obstacle on the trajectory led to a greater reduction in clearance distance compared to the second-order obstacle located farther away. Additionally, the direction of walking also played a role, as forward phases facilitated better temporal adaptation than return phase. These findings highlight the continuous temporal learning process, where online visual regulation based on local information in the vicinity and the direction of travel contributes to obstacle avoidance. This dynamic perceptual-motor evidence aligns with the proposal by Fajen and Warren (2003) and Fink et al. (2007). Here, analyzing the temporal evolution of clearance distance to the obstacle could serve as an additional metric to evaluate the interaction between individuals and obstacles, complementing the angle and initial distance to the obstacle (Fajen and Warren, 2003; Fink et al., 2007). Similar locomotor behavior, especially concerning mean speed (except for its variability, which varies significantly under different conditions), and for the trajectory variability tube, was observed in the lab (Pham et al., 2011). These data are also overall compatible with Patla et al.'s model of general trajectory planning regulated by cognitive and perceptual processes (Patla and Rietdyk, 1993). The width of the trajectory variability tube calculated around the obstacles indicates significantly reduced variability during return phases, indicating better direction-dependent locomotor control. These results highlight the strong connection between the environment and human behavior. The affordance of the obstacles on the trajectories guides participants to optimize their movements, reducing the risk of collisions and conserving energy. Differences in locomotor behavior concerning the two obstacles underscore the impact of everyday object affordances on walking in a cluttered indoor environment, providing unique potential for action (Gibson, 1977).
Walking at home involves continuous and active visual-perceptual regulation and is shown to be subject to ongoing adjustments. The strategies used to avoid obstacles demonstrate a flexible and efficient behavior. The fluctuation in the width of the locomotor trajectory tube during walking confirms the adaptability of the trajectory and reactive locomotor control. This is evident through the anticipation of obstacles, indicated by a continuous decrease in the width of the variability tube as the obstacle is approached, reaching a minimum when the obstacle is crossed, or shortly before it. This pattern of trajectory variability resembles the anticipatory locomotor adjustments described by Gérin-Lajoie et al. (2005). They divided obstacle clearance into two phases: the anticipation phase before obstacle clearance and the deletion phase during obstacle crossing. The analysis of the evolution of the variability tube derivative, considering different conditions and directions, clearly demonstrates the presence of anticipatory behavior up to the first obstacle crossing in five out of the six cases studied. The transition phase between the two obstacles also shows a redundancy in locomotor flexibility, characterized by an increase in the width of the variability tube during the passage. Passing the second obstacle shows a similar behavior, with variations in tube width appearing to be temporally shorter. This analysis, along with previous studies, reveals real-time regulation of walking to avoid obstacles, utilizing temporal learning and optimizing clearance distance. Additionally, passage planning with obstacle anticipation is evident, involving a reduction in the width of the trajectory tube to avoid obstacles and ensure safety. These metrics, which have received limited attention in previous research, provide critical information on how individuals negotiate obstacles and should be considered alongside conventional metrics like speed or trajectory adjustments (Gérin-Lajoie et al., 2005).
With the exception of the clearance distance of the ST obstacle in C2 and the speed variability for C3, our experimental disturbance conditions (C2, C3) did not significantly affect our metrics. Similarly, the wellbeing questionnaire did not provide precise indications of the impact of our sound disturbance condition. The WBMMS surveys were conducted only at the beginning and end of the experiment, so we couldn't directly establish the effect of the acoustic disturbance condition on the participants' psychological state and specifically correlate them with the manipulated condition-type factors. This lack of effect may be attributed to the characteristics of the sound we used. We selected a common noise that we often initiate ourselves in daily life. Since voluntary noises are generally perceived more positively, their impact on individuals might be reduced (Timm et al., 2014). Additionally, the duration of sound exposure (continuous for 10 min) may have lessened aversion to the initiated noise (Nelson and Meyvis, 2008). To further investigate this issue, a complementary study could be conducted, focusing on testing condition 3 with less common and more aversive external noises, such as construction noise, car horns, or aircraft noise. These types of noises are commonly associated with real disturbances that often induce irritation, stress, inattention, or anxiety (Tesio and Rota, 2019). Previous studies by Michalak et al. (2009), which examined locomotor behavior based on mood (sad or happy), showed a significant decrease in mean walking speed during sad moods compared to happy moods. It would be interesting to replicate these findings in an indoor environment, considering that speed variability was not extensively explored during sad moods. We speculate that the sound disturbance, though not potent enough to induce a noticeable reduction in the perceived wellbeing according to the questionnaire responses, might still impact the regulation of walking speed in individuals and reduce their flexibility. Further research would be needed to confirm the influence of mood and noise disturbance on walking speed variability.
Additionally, the results of our wellbeing questionnaire are not straightforward. Some metrics, such as self-esteem, mental balance, social involvement, and happiness, increased during the experiment, while others, like self-control and sociability, decreased. These contradictory findings should be interpreted with caution, especially considering that the experiment took place in the midst of the COVID-19 pandemic, which brought about challenging and sometimes conflicting implications concerning social demands and psychological wellbeing.
The pursuit of improved comfort in living environments has led to a diverse range of architectural styles and interior designs (Wu, 2022). Presently, optimizing interior spaces, including comfort, lighting, aesthetics, and layout, has become a significant research focus, necessitating a human-centric approach. To design better living spaces, in line with an adaptable and automated architecture, it is essential to comprehend how individuals live and interact within their interior environments. Our research investigated human locomotor trajectories in an equipped home environment naturally cluttered with obstacles. The findings revealed the influence of obstacle properties on indoor walking, notably the clearance distance being correlated with the size of the objects and inversely correlated with the radius of curvature and return phases. The process of learning and optimization was observed in obstacle clearance, leading to a progressive reduction in the distance to the obstacle with repeated passages. While approaching an obstacle, fine locomotor control was evident, transitioning to greater locomotor flexibility during obstacle clearance. These results enhance our understanding of the relationship between people and indoor obstacles, shed light on how individuals navigate within their living spaces, and provide insights into the perceptual and cognitive strategies employed.
Ultimately, this knowledge can be employed to place inhabitants at the center of design strategies, optimizing living spaces that promote locomotor flexibility, reduce energy costs (Ralston, 1958), and reduce the cognitive load associated with walking regulation. For example, for taller furniture, it may be recommended to use peripheral placement to save space and maintain a more substantial walking area. This approach would also minimize spatial constraints caused by multiple obstacles in a path and encourage linear trajectories, reducing the need for curvilinear paths with smaller radii.
In conclusion, walking at home in a confined and cluttered space, where natural obstacles need to be negotiated daily, is a flexible behavior that requires continuous perceptual adaptations. External disturbances, such as moving furniture or noise pollution, can influence indoor walking, demanding locomotor control that maximizes trajectory regularity (Hicheur et al., 2007; Pham et al., 2011). These findings contribute to our understanding of indoor walking, specifically within home environments under natural conditions. They may in the long term further our knowledge of the connection between physical and mental health and natural walking patterns, which can be significant during periods of confinement, such as pandemics. This research may also have applications in retirement homes and for people under house arrest. Additionally, these results may have consequences for better considering interactions between individuals and architecture.
The raw data supporting the conclusions of this article will be made available by the authors, without undue reservation.
The studies involving humans were approved by Institutional Review Board of EuroMov DHM, N° IRB-EM: 2004B. The studies were conducted in accordance with the local legislation and institutional requirements. The participants provided their written informed consent to participate in this study. Written informed consent was obtained from the individual(s) for the publication of any potentially identifiable images or data included in this article.
MS: Conceptualization, Data curation, Formal analysis, Methodology, Project administration, Writing—original draft, Investigation, Software, Visualization, Writing—review & editing, Resources. SJ: Conceptualization, Formal analysis, Project administration, Resources, Software, Supervision, Validation, Visualization, Writing—original draft, Writing—review & editing. GD: Project administration, Supervision, Validation, Writing—review & editing. PS: Methodology, Resources, Software, Supervision, Validation, Writing—review & editing. BB: Conceptualization, Data curation, Methodology, Project administration, Resources, Supervision, Validation, Writing—review & editing, Formal analysis.
The author(s) declare financial support was received for the research, authorship, and/or publication of this article. This research was conducted as part of the HUman at home projecT (HUT) co-funded by the European Regional Development Fund (ERDF) and the Occitanie Region.
This acknowledgment extends to the support given by Montpellier Méditerranée Métropole.
The authors declare that the research was conducted in the absence of any commercial or financial relationships that could be construed as a potential conflict of interest.
All claims expressed in this article are solely those of the authors and do not necessarily represent those of their affiliated organizations, or those of the publisher, the editors and the reviewers. Any product that may be evaluated in this article, or claim that may be made by its manufacturer, is not guaranteed or endorsed by the publisher.
C1, C2, C3, Condition 1, Condition 2, Condition 3; RT, Round Table; SD, Standard Deviation; ST, Squared Table; WBMMS, Well-Being Manifestation Measure Scale.
1. ^HUman at home projecT HUT. (2022). (online) Available at: https://www.hut-occitanie.eu/ (accessed January 6, 2023).
2. ^Qualisys | Motion Capture Systems. (online) Available at: https://www.qualisys.com/.
3. ^Ministry of Public Health, Decree No. 2017-1244, Chapter VI, Article R1336, Available at: https://www.legifrance.gouv.fr/loda/id/JORFTEXT000035388481/ (accessed January 6, 2023).
4. ^We also conducted an ANOVA on the (Z-transformed) R2 values, which did not reveal any significant effect for individual factors or interactions.
Austin, G. P., Garrett, G. E., and Bohannon, R. W. (1999). Kinematic analysis of obstacle clearance during locomotion. Gait Post. 10, 109–120. doi: 10.1016/S0966-6362(99)00022-3
Bardy, B. G., and Laurent, M. (1998). How is body orientation controlled during somersaulting? J. Exp. Psychol. Hum. Percept. Perform. 24, 963–977. doi: 10.1037/0096-1523.24.3.963
Barliya, A., Omlor, L., Giese, M. A., Berthoz, A., and Flash, T. (2013). Expression of emotion in the kinematics of locomotion. Exp. Brain Res. 225, 159–176. doi: 10.1007/s00221-012-3357-4
Bertram, J. E. A. (2005). Constrained optimization in human walking: cost minimization and gait plasticity. J. Exp. Biol. 208, 979–991. doi: 10.1242/jeb.01498
Bohannon, R. W. (1997). Comfortable and maximum walking speed of adults aged 20−79 years: reference values and determinants. Age Ageing 26, 15–19. doi: 10.1093/ageing/26.1.15
Borelli, E., Paolini, G., Antoniazzi, F., Barbiroli, M., Benassi, F., Chesani, F., et al. (2019). HABITAT: an IoT solution for independent elderly. Sensors 19, 1258. doi: 10.3390/s19051258
Borwein, J. M., Straub, A., Wan, J., Zudilin, W., and Zagier, D. (2012). Densities of short uniform random walks. Can. J. Math. 64, 961–990. doi: 10.4153/cjm-2011-079-2
Chen, Y., and Shen, C. (2017). Performance analysis of smartphone-sensor behavior for human activity recognition. IEEE Access 5, 3095–3110. doi: 10.1109/access.2017.2676168
Choi, Y., Kim, M., and Chun, C. (2015). Measurement of occupants' stress based on electroencephalograms (EEG) in twelve combined environments. Build Environ. 88, 65–72. doi: 10.1016/j.buildenv.2014.10.003
Cohen, J. (1988). Statistical Power Analysis for the Behavioral Sciences, 2nd Edn. Hillsdale, NJ: Erlbaum.
Cornus, S., Montagne, G., and Laurent, M. (1999). Perception of a stepping-across affordance. Ecol. Psychol. 11, 249–267. doi: 10.1207/s15326969eco1104_1
Cutting, J. E., and Kozlowski, L. T. (1977). Recognizing friends by their walk: gait perception without familiarity cues. Bull. Psychon. Soc. 9, 353–356. doi: 10.3758/bf03337021
Delafontaine, A. (2018). Locomotion humaine: Bases fondamentales, évaluation clinique et applications thérapeutiques de l'enfant à l'adulte. Elsevier Health Sciences.
Djaoui, E. (2011). Approches de la ‘culture du domicile'. Gérontologie et société 34, 77–90. doi: 10.3917/gs.136.0077
Emken, J. L., Benitez, R., Sideris, A., Bobrow, J. E., and Reinkensmeyer, D. J. (2007). Motor adaptation as a greedy optimization of error and effort. J. Neurophysiol. 97, 3997–4006. doi: 10.1152/jn.01095.2006
Fajen, B. R., and Warren, W. H. (2003). Behavioral dynamics of steering, obstacle avoidance, and route selection. J. Exp. Psychol. Hum. Percept. Perform. 29, 343–362. doi: 10.1037/0096-1523.29.2.343
Faul, F., Erdfelder, E., Lang, A. G., and Buchner, A. (2007). G* Power 3: a flexible statistical power analysis program for the social, behavioral, and biomedical sciences. Behav. Res. Methods 39, 175–191. doi: 10.3758/BF03193146
Feldman, F. (2006). Daniel Kahneman, Ed Diener, and Norbert Schwarz (eds.), Well-Being: The Foundations of Hedonic Psychology (New York: The Russell Sage Foundation, 1999), pp. xii 593. Utilitas 18, 192–196. doi: 10.1017/S0953820806231972
Feldman, R., Schreiber, S., Pick, C., and Been, E. (2019). Gait, balance, mobility and muscle strength in people with anxiety compared to healthy individuals. Hum. Mov. Sci. 67, 102513. doi: 10.1016/j.humov.2019.102513
Fink, P. W., Foo, P. S., and Warren, W. H. (2007). Obstacle avoidance during walking in real and virtual environments. ACM Trans. Appl. Percept. 4, 2. doi: 10.1145/1227134.1227136
Gérin-Lajoie, M., Richards, C. L., and McFadyen, B. J. (2005). The negotiation of stationary and moving obstructions during walking: anticipatory locomotor adaptations and preservation of personal space. Motor Control 9, 242–269. doi: 10.1123/mcj.9.3.242
Gibson, J. J. (1977). “The theory of affordances,” in Perceiving, Acting, and Knowing: Toward an Ecological Psychology, eds R. Shaw and J. Bransford (Hillsdale, NJ: Lawrence Erlbaum Associates, Inc), 67–82.
Gibson, J. J., and Crooks, L. E. (1938). A theoretical field-analysis of automobile-driving. Am. J. Psychol. 51, 453–471.
Glaister, B. C., Bernatz, G. C., Klute, G. K., and Orendurff, M. S. (2007). Video task analysis of turning during activities of daily living. Gait Post. 25, 289–294. doi: 10.1016/j.gaitpost.2006.04.003
Grinberg, A., Strong, A., Buck, S., Selling, J., and Häger, C. K. (2022). An obstacle clearance test for evaluating sensorimotor control after anterior cruciate ligament injury: a kinematic analysis. J. Orthop. Res. 40, 105–116. doi: 10.1002/jor.25016
Hangland, A., and Cimbalo, R. S. (1997). Human ethology: age and sex differences in mall walking. Percept. Motor Skills 85, 845–846. doi: 10.2466/pms.1997.85.3.845
Hicheur, H., Pham, Q. C., Arechavaleta, G., Laumond, J. P., and Berthoz, A. (2007). The formation of trajectories during goal-oriented locomotion in humans. I. A stereotyped behaviour. Eur. J. Neurosci. 26, 2376–2390. doi: 10.1111/j.1460-9568.2007.05836.x
Hicheur, H., Vieilledent, S., Richardson, M. J. E., Flash, T., and Berthoz, A. (2004). Velocity and curvature in human locomotion along complex curved paths: a comparison with hand movements. Exp. Brain Res. 162, 145–154. doi: 10.1007/s00221-004-2122-8
Janaqi, S., Sannier, M., Dray, G., Raducanu, V., and Bardy, B. G. (2022). “Walking on a capacitive sensing floor,” in SEIA 2022-8th International Conference on Sensors and Electronic Instrumentation Advances (Corfu).
Keyes, C. L. M., Shmotkin, D., and Ryff, C. D. (2002). Optimizing well-being: the empirical encounter of two traditions. J. Pers. Soc. Psychol. 82, 1007–1022. doi: 10.1037/0022-3514.82.6.1007
Knoblauch, R. L., Pietrucha, M. T., and Nitzburg, M. (1996). Field studies of pedestrian walking speed and start-up time. Transport. Res. Rec. J. Transport. Res. Board 1538, 27–38. doi: 10.1177/0361198196153800104
Lavoye, F., and Thellier, F. (2008). “Le confort thermique dans les bâtiments,” in Les fiches techniques PRISME [L'Institut de l'énergie et de l'environnement de la Francophonie (IEPF)].
Lee, D. N., and Lishman, R. (1977). Visual control of locomotion. Scand. J. Psychol. 18, 224–230. doi: 10.1111/j.1467-9450.1977.tb00281.x
Lim, J.-H., Lee, H.-S., and Song, C.-S. (2021). Home-based rehabilitation programs on postural balance, walking, and quality of life in patients with stroke. Medicine 100, e27154. doi: 10.1097/md.0000000000027154
Losing, V., and Hasenjäger, M. (2022). A multi-modal gait database of natural everyday-walk in an urban environment. Sci. Data 9, 473. doi: 10.1038/s41597-022-01580-3
Luo, Y., Coppola, S. M., Dixon, P. C., Li, S., Dennerlein, J. T., and Hu, B. (2020). A database of human gait performance on irregular and uneven surfaces collected by wearable sensors. Sci. Data 7, 219. doi: 10.1038/s41597-020-0563-y
Massé, R., Poulin, C., Dassa, C., Lambert, J., Bélair, S., and Battaglini, A. (1998b). The structure of mental health: higher-order confirmatory factor analyses of psychological distress and well-being measures. Soc. Indic. Res. 45, 475–504. doi: 10.1023/A:1006992032387
Massé, R., Poulin, C., Dassa, C., Lambert, J., Belair, S., and Battaglini, M. A. (1998a). Elaboration and validation of a tool to measure psychological well-being: WBMMS. Can. J. Public Health 89, 352–357. doi: 10.1007/bf03404490
McGeer, T. (1990). Passive dynamic walking. Int. J. Robot. Res. 9, 62–82. doi: 10.1177/027836499000900206
Michalak, J., Troje, N. F., Fischer, J., Vollmar, P., Heidenreich, T., and Schulte, D. (2009). Embodiment of sadness and depression—gait patterns associated with dysphoric mood. Psychosom. Med. 71, 580–587. doi: 10.1097/psy.0b013e3181a2515c
Middleton, A., Fritz, S. L., and Lusardi, M. (2015). Walking speed: the functional vital sign. J. Aging Phys. Act. 23, 314–322. doi: 10.1123/japa.2013-0236
Montepare, J. M., Goldstein, S. B., and Clausen, A. (1987). The identification of emotions from gait information. J. Nonverb. Behav. 11, 33–42. doi: 10.1007/bf00999605
Moreau, S. (2001). La nuisance auditive en milieu urbain, l'exemple du quartier Victoire-Capucins à Bordeaux. Travaux du Laboratoire de Géographie Physique Appliquée 20, 31–64. doi: 10.3406/tlgpa.2001.988
Nelson, L. D., and Meyvis, T. (2008). Interrupted consumption: disrupting adaptation to hedonic experiences. J. Mark. Res. 45, 654–664. doi: 10.1509/jmkr.45.6.654
Olivier, A. H., Marin, A., Crétual, A., and Pettré, J. (2012). Minimal predicted distance: a common metric for collision avoidance during pairwise interactions between walkers. Gait Post. 36, 399–404. doi: 10.1016/j.gaitpost.2012.03.021
Ondrej, J., Pettré, J., Olivier, A. H., and Donikian, S. (2010). A synthetic-vision based steering approach for crowd simulation. ACM Trans. Graph 29, 1–9. doi: 10.1145/1778765.1778860
Patla, A. E., and Rietdyk, S. (1993). Visual control of limb trajectory over obstacles during locomotion: effect of obstacle height and width. Gait Post. 1, 45–60. doi: 10.1016/0966-6362(93)90042-Y
Pecol, P., Dal Pont, S., Silvano, E., Joanna, B., and Argoul, P. (2011). “A 2D discrete model for crowd-structure interaction,” in 4th International Conference Footbridge 2011 (Worclaw).
Peyer, K. E., Brassey, C. A., Rose, K. A., and Sellers, W. I. (2017). Locomotion pattern and foot pressure adjustments during gentle turns in healthy subjects. J. Biomech. 60, 65–71. doi: 10.1016/j.jbiomech.2017.06.025
Pham, Q. C., Berthoz, A., and Hicheur, H. (2011). Invariance of locomotor trajectories across visual and gait direction conditions. Exp. Brain Res. 210, 207–215. doi: 10.1007/s00221-011-2619-x
Pheasant, S. T. (1981). A review of: ‘human walking'. By v. T. Inman, H.J. Ralston and F. Todd. (Baltimore, London: Williams and Wilkins, 1981.) (pp.154.). Ergonomics 24, 969–976. doi: 10.1080/00140138108924919
Ralston, H. J. (1958). Energy-speed relation and optimal speed during level walking. Internationale Zeitschrift für Angewandte Physiologie Einschliesslich Arbeitsphysiologie 17, 277–283. doi: 10.1007/bf00698754
Reed, E. S. (1988). James J. Gibson and the Psychology of Perception. New Haven, CT: Yale University Press.
Roussel, J. (2017). Le confort thermique au coeur de la rénovation (master's thesis). Université Paris-Est, Paris, France, P39–P44.
Said, C. M., Goldie, P. A., Patla, A. E., and Sparrow, W. A. (2001). Effect of stroke on step characteristics of obstacle crossing. Arch. Phys. Med. Rehabil. 82, 1712–1719. doi: 10.1053/apmr.2001.26247
Sannier, M., Janaqi, S., Raducanu, V., Barysheva, V., Haddou, H. A., Pla, S., et al. (2022). Extracting walking trajectories at home from a capacitive proximity sensing floor. IEEE Sens. J. 22, 3695–3703. doi: 10.1109/jsen.2021.3139442
Selinger, J. C., O'Connor, S. M., Wong, J. D., and Donelan, J. M. (2015). Humans can continuously optimize energetic cost during walking. Curr. Biol. 25, 2452–2456. doi: 10.1016/j.cub.2015.08.016
Serfaty-Garzon, P. (2003). “L'appropriation,” in Dictionnaire critique de l'habitat et du logement, ed A. Colin (Paris), 27–30.
Silva, W. S., Aravind, G., Sangani, S., and Lamontagne, A. (2018). Healthy young adults implement distinctive avoidance strategies while walking and circumventing virtual human vs. non-human obstacles in a virtual environment. Gait Post. 61, 294–300. doi: 10.1016/j.gaitpost.2018.01.028
Song, C., Ikei, H., Kagawa, T., and Miyazaki, Y. (2019). Effects of walking in a forest on young women. Int. J. Environ. Res. Public Health 16, 229. doi: 10.3390/ijerph16020229
Stephan, Y., Sutin, A. R., Bovier-Lapierre, G., and Terracciano, A. (2017). Personality and walking speed across adulthood. Soc. Psychol. Pers. Sci. 9, 773–780. doi: 10.1177/1948550617725152
Taleb, T., Bottazzi, D., Guizani, M., and Nait-Charif, H. (2009). Angelah: a framework for assisting elders at home. IEEE J. Select. Areas Commun. 27, 480–494. doi: 10.1109/jsac.2009.090511
Tesio, L., and Rota, V. (2019). The motion of body center of mass during walking: a review oriented to clinical applications. Front. Neurol. 10, 999. doi: 10.3389/fneur.2019.00999
Timm, J., SanMiguel, I., Keil, J., Schröger, E., and Schönwiesner, M. (2014). Motor intention determines sensory attenuation of brain responses to self-initiated sounds. J. Cogn. Neurosci. 26, 1481–1489. doi: 10.1162/jocn_a_00552
Troje, N. F. (2002). Decomposing biological motion: a framework for analysis and synthesis of human gait patterns. J. Vis. 2, 2. doi: 10.1167/2.5.2
Van Opstal, A. A., Casanova, R., Zaal, F. T., and Bootsma, R. J. (2022). Characterisation of visual guidance of steering to intercept targets following curving trajectories using Qualitative Inconsistency Detection. Sci. Rep. 12, 20246. doi: 10.1038/s41598-022-24625-4
World Health Organization (1946). Préambule à la Constitution de l'Organisation mondiale de la Santé. New York, NY.
WSJ (2012). The Stuff of Families: Research on American Home Life | Visualizer. Available online at: https://www.wsj.com/articles/SB10001424052702304708604577504672437027392 (accessed January 6, 2023).
Wu, Y. (2022). Architectural interior design and space layout optimization method based on VR and 5G technology. J. Sensors 2022, 7396816. doi: 10.1155/2022/7396816
Yamaguchi, T., Okamoto, R., Hokkirigawa, K., and Masani, K. (2018). Decrease in required coefficient of friction due to smaller lean angle during turning in older adults. J. Biomech. 74, 163–170. doi: 10.1016/j.jbiomech.2018.04.038
Keywords: walking at home, locomotor trajectories, sensorimotor interaction, obstacle clearance, adaptability, walking affordances, wellness
Citation: Sannier M, Janaqi S, Dray G, Slangen P and Bardy BG (2023) Obstacles shape the way we walk at home. Front. Comput. Sci. 5:1270520. doi: 10.3389/fcomp.2023.1270520
Received: 31 July 2023; Accepted: 09 November 2023;
Published: 07 December 2023.
Edited by:
Ana Tajadura-Jiménez, Universidad Carlos III de Madrid, SpainReviewed by:
Christopher Pagano, Clemson University, United StatesCopyright © 2023 Sannier, Janaqi, Dray, Slangen and Bardy. This is an open-access article distributed under the terms of the Creative Commons Attribution License (CC BY). The use, distribution or reproduction in other forums is permitted, provided the original author(s) and the copyright owner(s) are credited and that the original publication in this journal is cited, in accordance with accepted academic practice. No use, distribution or reproduction is permitted which does not comply with these terms.
*Correspondence: Mélodie Sannier, bWVsb2RpZS5zYW5uaWVyQGdtYWlsLmNvbQ==
†These authors share first authorship
‡These authors have contributed equally to this work and share senior authorship
Disclaimer: All claims expressed in this article are solely those of the authors and do not necessarily represent those of their affiliated organizations, or those of the publisher, the editors and the reviewers. Any product that may be evaluated in this article or claim that may be made by its manufacturer is not guaranteed or endorsed by the publisher.
Research integrity at Frontiers
Learn more about the work of our research integrity team to safeguard the quality of each article we publish.