
95% of researchers rate our articles as excellent or good
Learn more about the work of our research integrity team to safeguard the quality of each article we publish.
Find out more
ORIGINAL RESEARCH article
Front. Comput. Sci. , 11 January 2024
Sec. Human-Media Interaction
Volume 5 - 2023 | https://doi.org/10.3389/fcomp.2023.1254678
 Sara Lenzi1,2,3*
 Ginevra Terenghi3
 Damiano Meacci4,5Aitor Moreno Fernandez-de-Leceta6Paolo Ciuccarelli7
There is a growing need for solutions that can improve the communication between anomaly detection algorithms and human operators. In the context of real-time monitoring of networked systems, it is crucial that new solutions do not increase the burden on an already overloaded visual channel. Sonification can be leveraged as a peripheral monitoring tool that complements current visualization systems. We conceptualized, designed, and prototyped Datascapes, a framework project that explores the potential of sound-based applications for the monitoring of cyber-attacks on AI-supported networked environments. Within Datascapes, two Design Actions were realized that applied sonification on the monitoring and detection of anomalies in (1) water distribution networks and (2) Internet networks. Two series of prototypes were implemented and evaluated in a real-world environment with eight experts in network management and cybersecurity. This paper presents experimental results on the use of sonification to disclose anomalous behavior and assess both its gravity and the location within the network. Furthermore, we define and present a design methodology and evaluation protocol that, albeit grounded in sonification for anomaly detection, can support designers in the definition, development, and validation of real-world sonification applications.
Artificial Intelligence is destined to gain predominance in the near future. In almost every aspect of our daily lives, we are immersed in an unprecedented mass of information: a continuous flow of data, which intricacies require an artificial intelligence able to work at more-than-human scale to support humans in the task of collecting, organizing, and making sense of it. However, hyper-reliance on automated systems and a techno-chauvinistic enthusiasm (Broussard, 2019) tend to hide the fact that, in order to understand and make use of the information provided by AI systems, we still need to translate it into human-scaled knowledge. Design is charged with the task of facilitating such translation (Norman, 1993). Through design artifacts and data representations, final users are put in the condition to leverage their unique, sophisticated human experience to integrate machine systems and machine thinking into everyday life and transform data into knowledge (Masud et al., 2010).
This paper presents the first phase of the framework project “Datascapes”, a collection of design activities that aim at exploring the potential of sonification to support operators of Security Operation Centers (SOC) in detecting anomalous behavior caused by cyber-attacks on digital and digital-physical networks. The project has the objective to explore and define, through a series of design actions (1) a specific use case for sonification for real-time monitoring in AI-supported networked environments and (2) a design process and evaluation protocol for sound-driven anomaly detection. Two Design Actions were conducted during the first phase of the project: the first Action targeted anomaly detection in digital-physical networks, notably, a water distribution system (see also Lenzi et al., 2019); the second Action targeted anomaly detection in digital networks, notably the Internet network of a medium-sized private company. In this paper, the genesis, design, implementation and evaluation of the Datascapes' Design Actions, the definition of the design process and the evaluation protocol, and the experimental results are presented and discussed. The two Actions were conducted in temporal sequence i.e., Design Action 2 followed and was partially informed by the insights gathered during Design Action 1. However, in this paper we present the two Actions “in parallel” to help the reader compare design processes, evaluation strategies, and results toward the definition of a design and evaluation framework for sonification for anomaly detection that is grounded in the two Actions of the Datascapes project.
In Section 1.2, we present previous literature and related work on sonification for anomaly detection. Sections 2 and 3 describe the use case and the design process of the two Actions. In Section 4, we present the experimental protocol for the evaluation of the Datascapes prototypes, conducted in a real-world environment with eight experts in cybersecurity and digital-physical network management, followed by the discussion of the experimental results. We conclude with the proposal (Section 5) of a framework for the conceptualization, design, and evaluation of data sonification applications for anomaly detection in networked environments. This framework, grounded in the Datascapes Design Actions, aims to contribute to the ongoing quest for shared design process and evaluation protocols within the sonification community. As the field of sonification is transitioning from a niche scientific method to a mass-medium for data representation, shared and replicable design tools, processes and protocols are needed to increase the impact of sound-driven human-data interactions in the real world. This paper aims to contribute to this ongoing discussion. The second phase of Datascapes, currently ongoing, will further develop the sonification strategies presented in this paper while continuing applying and validating the design and evaluation framework in other contexts, notably anomaly detection in industrial production, scientific research (astronomy) and healthcare.
There is a growing need for tools that can facilitate the communication between anomaly detection algorithms (i.e., computational solutions that identify behavior that differs from what is considered the regular status of a system) and human operators. Artificial Intelligence and in particular, Deep Learning techniques are being heavily introduced to monitor the behavior of digital and digital-physical networks such as electric grids and water distribution, Internet, and industrial networks with the goal of detecting and predicting anomalies and making better decisions on how to intervene in case of an emergency. In these fields, the use of sound as a substitute or as a complement to visual dashboards has attracted the interest of the research community in the past two decades. Examples of sonification systems (i.e., solutions that use acoustic and psychoacoustic dimensions e.g., pitch, loudness, timbre to represent and communicate values in a dataset) designed to support experts in monitoring tasks cover various fields, including the continuous monitoring of medical applications in healthcare (Ballora et al., 2000, 2004; Ziemer and David, 2017; Shackleton et al., 2023); data monitoring in finance (Nesbitt and Barrass, 2004; Worrall, 2010), cybersecurity (Axon et al., 2017, 2019, 2020; Lenzi et al., 2019), situational awareness in digital (Vickers et al., 2014, 2017; Debashi and Vickers, 2018), physical (Rönnberg et al., 2016) and IoT networks (Roddy, 2018), process monitoring in industrial production (Hermann et al., 2015; Hildebrandt and Rinderle-Ma, 2015). These solutions share a similar use case i.e., sonification is used as a complement to existing visualizations to provide a real-time peripheral monitoring solution while reducing the cognitive overload of human operators provoked by an excess of visual information (Roetzel, 2019).
SOC operators of digital and digital-physical networks are exposed to a large amount of visual information with the consequent risk of an overload that can reduce the operators' attention and performance (Vickers et al., 2014, 2017). Existing dashboards are used to visualize real-time and historical data that the operators use to monitor the state of the network and run other analysis (e.g., trend analysis of the network's activity for internal reports). The current increase of cyberthreats requires yet another monitoring system to be introduced in the operators' daily routine. However, a visual dashboard would seriously increase the overload of information on the visual channel and the connected risks (such as alarm fatigue Johnson et al., 2017). These considerations are driving research and experimentation on monitoring systems that leverage an alternative sensory modality, in our case, sonification. Sound is believed to possess characteristics that make it a suitable means in the context of network monitoring. Sound can release the visual channel by providing a peripheral monitoring system that does not require visual focus (Bakker et al., 2012). Changes in the acoustic patterns in sound events are easily detected by the human ear (Vickers, 2011) and therefore attract the attention of the user while avoiding to further burden the visual channel (Ballatore et al., 2018). Additionally, sound composition is inherently multivariate: a series of acoustic parameters are organized in a time-based sequence where every unit synchronically handles multiple characteristics, for instance, pitch, amplitude, rhythm, timbre. The human ear can quite well distinguish multiple single auditory units when played at the same time for example, while listening to a musical composition or to a natural soundscape (Chion, 2016). Finally, there is evidence that when used for continuous monitoring sound can enhance event prediction (Hildebrandt et al., 2014) thus helping operators prevent problems, instead of reacting to emergencies when they have already occurred. Literature on auditory alarms highlights that “intelligent” alarms should not distract the operators from their main tasks while providing additional information (Edworthy and Stanton, 2020). According to Guillarme (2011) three types of information should be conveyed by sound: firstly, an indication of how serious the failure is i.e., how urgently the situation requires the operator's attention and secondly, what caused the alarm. Lastly, the location of the fault could be an additional useful informative layer for the operator, in order to reduce the time needed to retrieve the relevant information in existing visualization systems.
Two Design Actions were carried out as part of the first phase of the Datascapes project. Both Actions focused on the sonification of real-time (or pseudo-real time) data streaming from digital and physical networks and included the conceptualization, prototyping, and evaluation of a sound-driven solution for the monitoring of anomalous behavior caused by cyber-attacks. This Section summarizes the two Actions describing the genesis, the context, and the objectives of the projects.
In recent years, water supply infrastructure transitioned from a fully physical to a cyber-physical system: networked devices (e.g., digital sensors, industrial computers, telemetry units) are more and more used for monitoring and control purposes in order to increase reliability and controllability. In an average water network of a middle-sized city, sensors are employed to monitor and organize the activity, for instance, to control the level and pressure of water in the tanks or scheduling the quantity of water released from the reservoirs. Figure 1 shows a typical setup for a so-called ‘smart water network' (Taormina et al., 2017) where sensors and programmable logic controllers coexist with tanks, pumps, and valves. The central Supervisory Control and Data Acquisition (SCADA) system controls all the devices across the network. It is this last element that human operators in the control room refer to, in order to monitor the behavior of the network at all times.
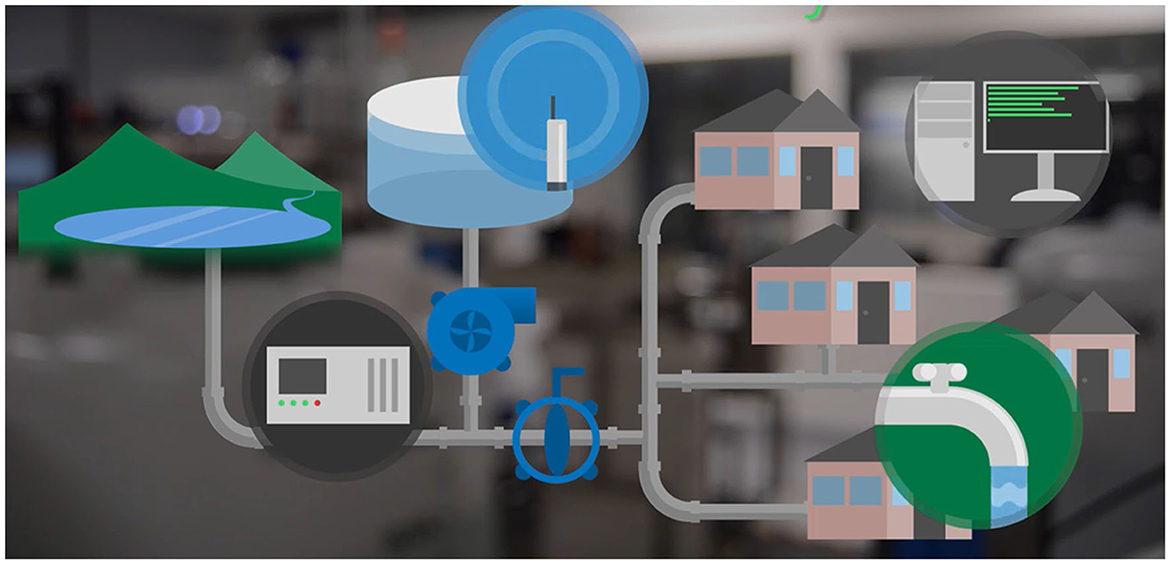
Figure 1. Diagram of an ideal Smart Water Network. In a typical water distribution network of a city, the elements of the physical network (pumps, valves, tanks) are connected through digital sensors and send data to the central Supervisory Control and Data Acquisition (SCADA) systems. Image from Taormina et al. (2017).
The digitalization of key infrastructures such as water plants, as much as it contributes to improve the efficiency and the reliability and reduce costs on water distribution, simultaneously exposes cities and citizens to previously unknown forms of vulnerability such as cyber-physical attacks, “namely, the deliberate exploitation of computer systems aimed at accessing sensitive information or compromising the operations of the underlying physical system” (Taormina et al., 2018). Research centers as well as private enterprises are multiplying the efforts to develop and deploy AI-based solutions to support human operators in disclosing these threats and promptly react, to avoid potentially critical situations that could endanger the economy, local communities, and even public health.
The first Datascapes Design Action was developed in collaboration with the iTrust Center for Research in Cyber Security of the Singapore University of Technology and Design (SUTD). The iTrust research team had engaged on a research project to understand how water distribution systems respond to a wide range of cyber-attacks to devise solutions for preventing the attacks through a purposely designed anomaly detection algorithm (Taormina et al., 2017). An “attack model” i.e., a computer simulation which models different attack scenarios, was designed. Six different attacks were defined and applied to the water distribution network of an ideal city, the so-called “C-Town” (Ostfeld et al., 2012). The C-Town water distribution system is based on a real-world medium-sized water network which includes seven tanks, 11 pumps, four valves and about 430 pipes across five town districts (DMA) (see Figure 2).
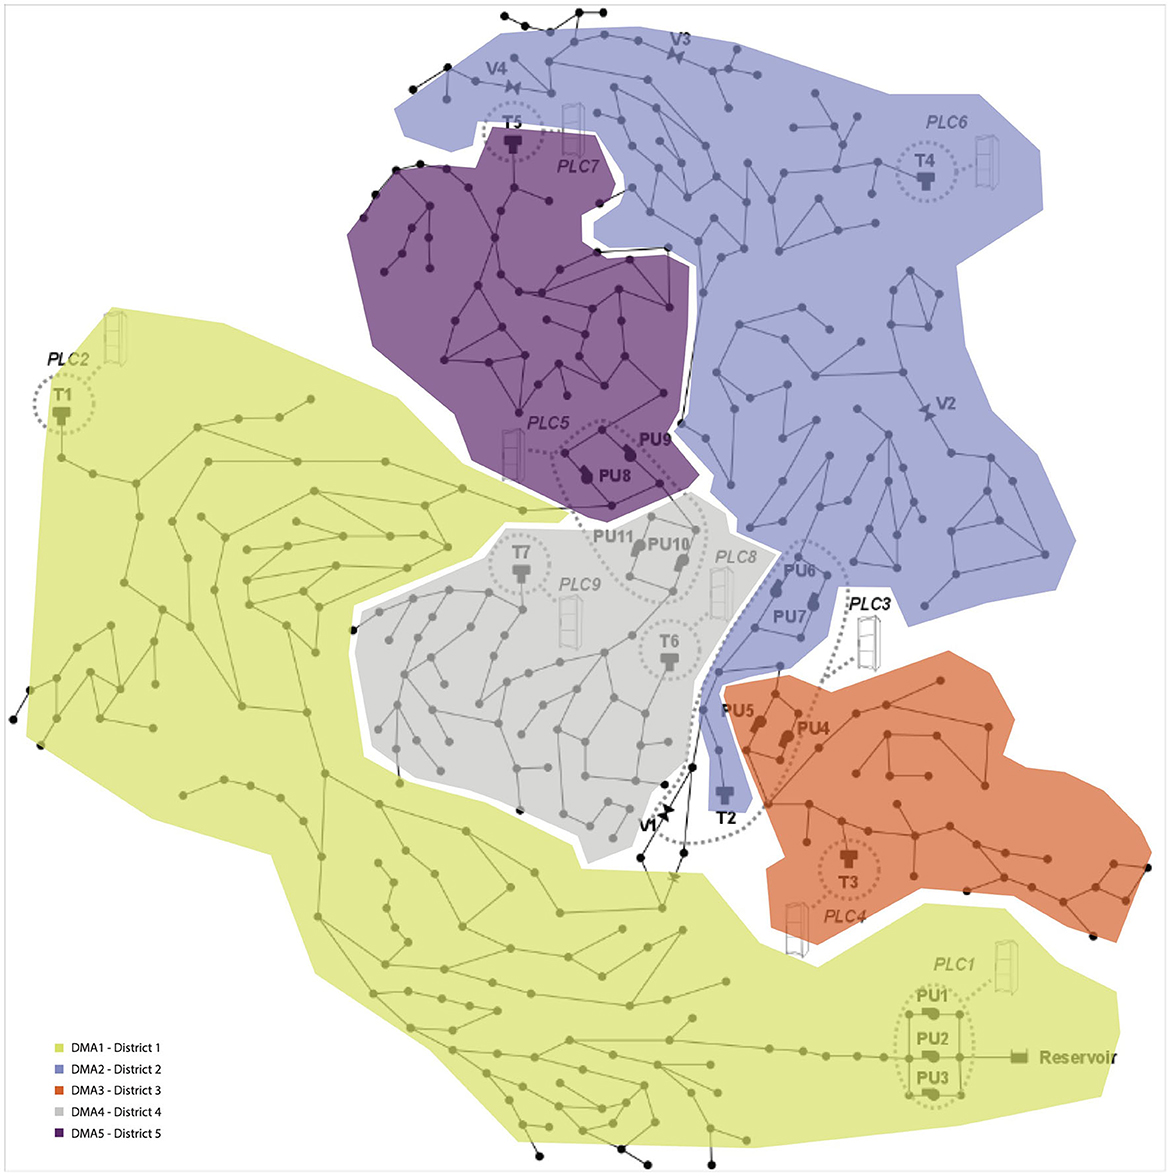
Figure 2. Map of C-Town, a model simulated town with a medium-sized water distribution network proposed by Ostfeld et al. (2012). The C-Town used in this study has five districts, each of them represented by a color in the map.
The six attack scenarios were applied to the C-Town water infrastructure under hundreds of different conditions which resulted in very similar outcomes (malfunctioning of water pumps, decreased level in water tanks or tank overflow). This highlighted how, despite it is relatively easy to spot the consequences of an attack on the functioning of the system while monitoring the network through the SCADA system, it might be quite difficult to identify and locate the source of the attack i.e., the affected component, and intervene on time to preserve the integrity of the network.
In a second phase of the research, an anomaly detection algorithm was developed during an international competition. The competition, known as BATADAL (the Battle of the Attack Detection Algorithms), challenged participants to develop an algorithm for the detection of cyber-physical attacks on the C-Town water infrastructure system (Taormina et al., 2018). As mentioned, one of the goals of the previous phase was to assess the response of water distribution systems to cyber-threats in order to define guidelines for the design of more flexible, resilient infrastructures. The specific goal of BATADAL was to devise solutions for the early detection of all those unforeseeable (i.e., unknown to date) threats for which the systems cannot yet be prepared, while limiting the number of false alarms (which are still a relevant issue in AI algorithms, see Lenzi et al., 2019). The resulting algorithm should be able to (1) identify cyber-attacks and (2) identify which components of the network have been compromised. In fact, even if different cyber-attacks tend to provoke the same response in the network, the affected digital component might be different. Identifying the affected component (and communicating it to the operator) is therefore crucial yet a non-negligible challenge in large water networks (Taormina et al., 2018). Particular attention should be given to avoid false alarms that could (mis)lead operators to take the wrong decision in a moment of danger. Lastly, since all digital components of the network can be affected by an attack including the central SCADA system (whose information would consequently become non-reliable), a separate monitoring system that can bypass the SCADA should be designed to provide the operator with an additional source of control.
The second Design Action was developed within the frame of SUCESO (Machine learning SUpported CyberSEcurity), a publicly funded research project in collaboration with Instituto Ibermática de Innovación (i3B), the R&D unit of the Spanish company Ibermática. SUCESO aimed to explore applications of Machine Learning techniques for cyber-security across a number of different sectors, among which Internet services, financial and healthcare digital infrastructure, and industrial production. The main goal was the ‘creation of a collaborative and shared database of Indicators of Compromise (i.e., traces left in the network by harmful code used to penetrate and take control of digital systems) for each of the involved sectors, with the goal of alleviating the effects of the main threats (known and unknown) to Internet networks' (Hazitek Technical Report, 2018). Primarily, the project aimed at identifying patterns of anomalous behavior unknown to date through ML techniques. Secondly, it aimed at facilitating the disclosure and interpretation of cyber-threats by domain experts who are not necessarily experts in cyber-security, by purposely designing a dedicated dashboard. Within the scope of SUCESO, Ibermática developed PLAGEMODA (PLAtform for the manaGEment and MOdeling of DAta), a tailor-made platform for the collection, storage, and analysis of incoming data which also included a purposely developed anomaly detection algorithm. A scheme of the solution's architecture is shown in Figure 3: the PLAGEMODA platform collects data from a digital network; data are stored, analyzed, and displayed on a visual dashboard to be consulted in real-time by the SOC operators for carrying out routine tasks (e.g., data mining, trend analysis). At the same time, data are also streamed to the anomaly detection algorithm which has been trained to identify cyber-attacks. Data are then extracted from the algorithm's log file and visualized for offline historical and forensic analysis. As we will further detail in this paper (Section 3), the goal of the second Design Action was to add to the system architecture a dedicated sonification solution that leveraged data streaming from the anomaly detection algorithm to provide real-time monitoring of the network's status (Figure 3).
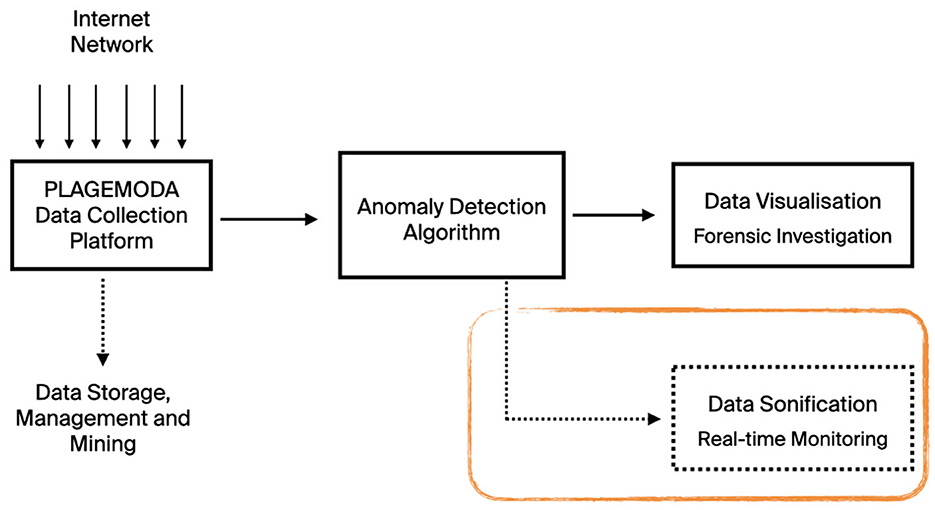
Figure 3. Architecture of the SUCESO solution which includes the collection of real-time data from the digital network, the data storage, management and analysis on the PLAGEMODA platform, the analysis by the dedicated anomaly detection algorithm, and the visualization of information on cyber-attacks for forensic analysis.
The algorithm developed by the SUCESO research team was trained to identify Indicators of Compromise (IoC). Once detected, IoC are analyzed and used to train the algorithm in the prediction of future attacks. The analysis is conducted through a hierarchical approach in which the most common type of attack is assigned to level “Zero” and less common (or unknown) attacks belong to layers of analysis of increased granularity. Within the scope of the second Design Action, we focused the design of the sonification on the Level 0 of analysis. In the case of SUCESO, Level 0 was assigned to attacks carried out by intruding the network through a foreign IP that tries to contact a local IP. The granularity of the database (i.e., the minimum unit of information at which the analysis is performed) is therefore fixed at the semantic couple IP of origin/IP of destination, with incoming data clustered in a one-minute timeframe. All the other parameters of the network identified by the anomaly detection algorithm (e.g., the methods and browsers used by the foreign IP to contact the local IP, the number of attempts within a given timeframe, and so on) are aggregated taking into consideration the granularity and the frequency of Level 0. An excerpt of the dataset used in the second Design Action is available as Supplementary material.
The anomaly detection algorithm generates a global Anomaly Index of the network based on the threats posed by the incoming foreign IP at every minute. Additionally, it identifies the reasons that produce the anomalous behavior, which are represented by the so-called Fields. At Level 0, the algorithm identifies three Fields that are hierarchically ordered: Field 1 represents the main reason responsible for the anomaly, while Field 2 and 3 identify less serious reasons that contribute to, but do not determine, the global Anomaly Index. The Field Impact indicates the relative weight of each Field on the global anomaly level of the network. Lastly, the algorithm gives an indication of whether the anomaly is True or False i.e., whether it is due to a cyber-attack or to non-malicious deviations from an ideal regular behavior, which, after all, is rarely found in real-world situations. Within the SUCESO project, a dedicated visualization tool in addition to the existing SOC dashboards was designed with the goal of providing the operators with analytical information for forensic investigations. However, the tool was not intended to provide real-time information on incoming threats. These alerts would still be conveyed through existing solutions i.e., SMS on mobile phones and emails, which are asynchronous means of communication and can be easily overlooked.
In the context of both physical and digital networks SOC, the addition of a separate monitoring system dedicated to cyber-attacks is known to increase the cognitive load of the visual channel. SOC are already heavily reliant on visual screening for the storage, management, and analysis of incoming data. Thus, adding yet another visual interface dedicated to the real-time monitoring of cyber-threats would confront operators with higher risks of information overload and decreased work performance. Additionally, during their normal working day operators are expected to carry out other (again, mainly visual) tasks such as reading and writing reports, analyzing historical data sets, and interacting with colleagues. As shown in Section 1, sonification as a method to represent large volumes of data in an auditory form holds the potential to both release load from the visual channel and allow operators to peripherally monitor the network behavior while carrying out routine visual-based tasks.
For the two Design Actions, after a preliminary exploration of the specific contexts of the two networks under study and the characteristics of the respective anomaly detection algorithms, we hypothesized that a sonification-based solution for anomaly detection should behave as an intelligent auditory alarm as defined by Guillarme (2011). It should, therefore, provide the network's operators with enough information to:
1. Detect anomalous behavior caused by a cyber-attack (and not by, for instance, faulty components).
2. Assess the gravity of the anomaly and consequently, the urgency of the operator's response.
3. Identify and locate the affected components within the network i.e., the network's physical district in case of the first Action (C-Town) and the Field with its related Field Impact in case of the second Action (SUCESO).
Both sonifications were conceptualized as a complement, and not a replacement, of visualization solutions. In a real-world scenario, once detected anomalous behavior through the sonification, operators would refer to other sources of analytical information (visualizations, log files, etc.) for further analysis. Lastly, we hypothesize in both cases that, over time, by providing continuous monitoring of the network's behavior the sonification will help operators recognize errors from the algorithm and detect unknown threats. Among the differences that were taken into account during the design and prototyping phase (see Section 3), it is worth to note that:
1. While the SUCESO dataset (Action 1) included an explicit indication of a cyber- attack occurrence (i.e., Anomaly True/False), this was not the case for the C-Town dataset, where an increasingly higher value of anomalous behavior in the network is the only information that the operator receives from the algorithm. This difference impacted the design decisions taken during the prototyping phase. In fact, as we will see in the next section, while the second Action (based on SUCESO) explicitly communicates a cyber-attack occurrence by means of an auditory alarm (i.e., the “thunder”), the first Action uses a normalized 1 to 5 data-to-sound mapping scale to represent lower and higher values of anomalous behavior. While level five can be considered a occurring attack, the fact that an explicit decision is not, at this stage of development, taken explicitly by the algorithm (i.e. similarly to the “Anomaly True” of the SUCESO algorithm), led us to represent anomalous values in a non-binary manner so that it is the human operator that takes the final decision on an incoming attack.
2. While the C-Town algorithm provides information only once every hour, the SUCESO algorithm provides real-time data on the digital network's behavior. Consequently, we conceptualized the first Design Action as an “auditory alert” to be played to the operators once every hour as an update on the network's status while, on the other hand, the second Action was conceptualized as a continuous soundscape. We hypothesized that this will also help overcome the limitations of the SUCESO visual dashboard (designed only for standard data mining of the network's performance and forensic analysis on cyber-attacks) and offline alert systems currently in use.
Preliminary research in the context of the first Action showed that operators of SOC tend to silence current acoustic alarms as they are considered excessively intrusive, especially due to the high number of false alarms that ML anomaly detection systems are still subject to. To avoid the sonification to be switched off by the operators, the solution should be designed as a non-invasive background soundscape that attracts the attention of the operator only if needed.
For both Design Actions, the sonification design process was organized in three phases. In the first phase, we explored possible mapping strategies and types of sound by quickly producing a series of prototypes to share during an internal critique session with peers. In the second phase, informed by feedback gathered in the first phase, a second iteration of the prototypes was designed and implemented to be tested in a real environment. In the third phase, the prototypes were evaluated by external experts in a real-world environment based on a purposely defined experimental protocol. This Section defines the requirements and design constraints for each Action, how they led to a first series of sonification sketches and finally, to the development of working prototypes to be used during the evaluation study with domain experts, described in detail in Section 4.
To recap, the main goals of the operator of a water distribution network are to (1) identify a cyber-attack (2) identify which component is compromised and (3) distinguish genuine alarms from false positives. In the first phase of the design process, we identified the following requirements:
1. In accordance with the information provided by the anomaly detection algorithm, the sonification should communicate (1) the existence of an attack and (2) the affected component.
2. The sonification should complement the information already provided by the SCADA, with which operators are very familiar.
Since the SCADA provides extremely analytical information on each component of the network, including its exact position within the city territory, we decided that the sonification should facilitate the retrieval of visual information in the SCADA by the operator by providing auditory complementary information that would function as a “shortcut” to increase efficiency.
3. To limit the impact of false positives, the sonification should not issue a binary alarm (attack yes/no). Rather, it should represent the anomaly level in the network as a continuum so that the operator can judge whether an attack is “true” based on his/her experience and knowledge of the network rather than on the decision of Artificial Intelligence. Since the value of intermediate anomaly levels are not currently provided by the BATADAL algorithm (see Section 2.1), we included it in the mapping strategy by design using the value of the “reconstruction error” (i.e., the difference, calculated by the algorithm, between the actual and the ideal behavior of the network's components).
4. We consider sonification as a potential solution for real-time monitoring. However, in the case of the first Design Action, the algorithm's data resolution was capped at 1 h. Therefore, the sonification prototype would function as an auditory alert (a sort of update on the status of the network) played at regular intervals (every hour at the hour), rather than a continuous sonification played in the background.
5. The operators will listen to the sonification via headphones, as the current working setting, confirmed by experts, seems to include headphone as standard equipment.
Based on these design constraints, we conducted an exploration of different mapping strategies and sound material. Four different strategies were identified, and a prototype of each strategy was produced. In each strategy, five different sounds were used to represent each district, for a total of five sounds with a duration of 3 s each. We hypothesized that the districts' distinct “sound identity” would be a “good enough” amount of information to increase the efficiency of the operator in retrieving more specific information on existing visual maps. The four strategies were defined as follows:
1. Delay: All sounds start at Time 0 (every hour) and in case of no anomaly, they stop playing after 3 s. In case of anomaly, the start of the anomalous sound will be delayed proportionally to the level of the anomaly.
2. Length: The duration of each sound increases proportionally to the anomaly level, up to a maximum duration of 10 s.
3. Repetition: In case of anomaly, the sound of an anomalous district is repeated over 10 s. The frequency of the repetitions (i.e., the accumulation of sound events over time) increases at the increase of the anomaly level.
4. Pitch: The pitch of each districts' sound increases proportionally to the level of anomaly.
The four prototypes were implemented using the open-source Python script MIDI Time 1.1.31 which uses selected data values to determine parameters such as the volume, the duration, and the order of a sound sequence. The MIDI file was imported in the audio production software Ableton Live! 102 that we used to play the corresponding sonification. An excerpt of the dataset containing some days of activity (both regular and anomalous) of the C-Town water distribution network was converted into a MIDI file. In this first phase, the focus was on sketching options of mapping strategies, which we deemed more critical to the project. Hence, the instruments used to sonify the data were as “neutral” as possible e.g., simple synth sounds from the Ableton Live library of MIDI instruments.
After running an internal critique session with peers from different fields (five experts in sound design and engineering, information design, computer science, and water management), the strategies based on Delay and Pitch were discarded. The delayed incipit of the sound of an anomalous district was considered confusing in the absence of a clear reference of the “regular” starting time (i.e., “time zero”) of the sonification (especially in the case of anomalies affecting more than one district). Similarly, the pitch variation would cause a progressive loss of the sound identity originally assigned to each district, thus confusing the listener. We narrowed down the options to the two prototypes which seemed to be more promising: Length and Repetition (Figures 4A, B respectively). These two mapping strategies were deemed clearer in that they presented a clear start and end of the sonification alert and allowed for a clearer identification of the five districts, especially in the context of anomalous behavior affecting more than one district. A demo of all four prototypes can be found at this link.
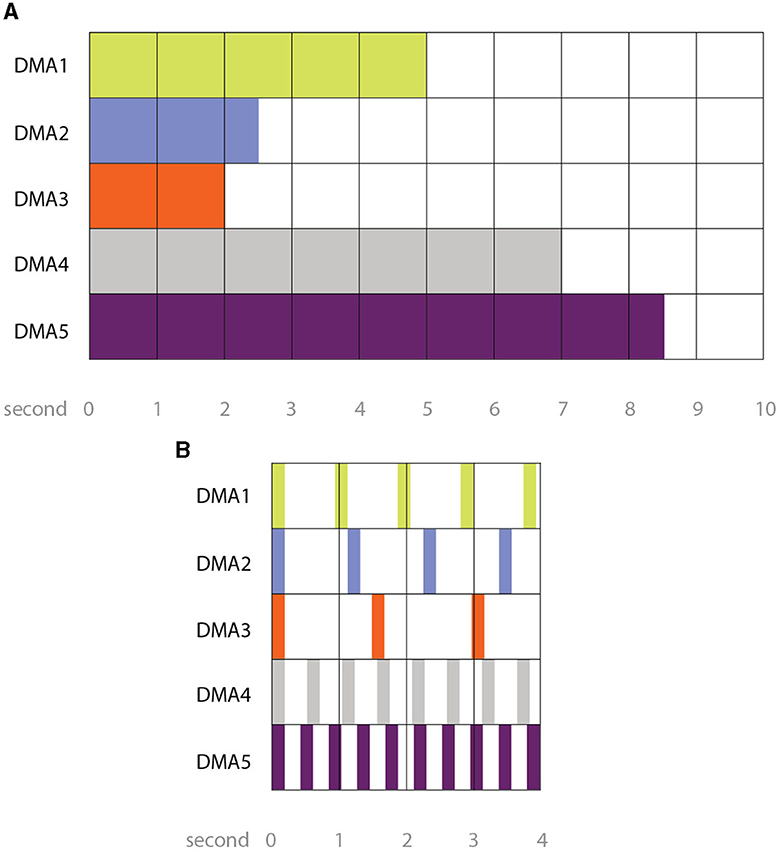
Figure 4. (A) Mapping strategy “Length”. In case of anomalous behavior, the sound sample corresponding to the anomalous district lasts longer than 3 seconds (until a maximum duration of 10 seconds). The longer the sound, the higher the level of anomaly in the corresponding district. (B) Mapping strategy “Repetition”. In case of anomalous behavior, the sound sample corresponding to the anomalous district is repeated at regular intervals over a total duration of 10 seconds. The closer the repetitions (i.e., the shortest the intervals), the higher the level of anomaly in the corresponding district.
In the absence of clear indications from existing literature on the benefits of using musical or concrete sounds in monitoring tasks, we developed the two chosen mapping strategies (Length and Repetition) in two versions using tuned and untuned sound samples thus echoing the difference between an earcon-based and auditory icon-based mapping strategy (Brewster, 2002). The MIDI file was then imported in Ableton Live that we used to play the corresponding sonification. Each prototype was sonified as follows:
1. Length with tuned sounds: chimes, from Ableton Live Sample Library.
2. Length with untuned sounds: glass filtered noise with reverb, Ableton Live Instruments.
3. Repetition, with tuned sounds: piano little one, Ableton Live Instruments.
4. Repetition with untuned sounds: Samples from Ableton Live Drum Kits.
A sound file of each of the four prototypes with the sonification of data corresponding to a full working day (i.e., 8 h) was uploaded to a purposely designed webpage to be later made available to participants to the experimental evaluation. The reader will recall that the smart water network of C-Town is supposed to stream data on cyber-attacks every hour. In our simulation, the sonification would automatically play during eight consecutive hours, at the hour, for a maximum of 10 s. It would then be repeated three times, to make up for distractions or to allow the operator to clarify possible doubts or confirm the interpretation. The prototype took into account that participants would listen to the sonification through headphones. A webpage was purposely designed where the four sound files, one for each prototype, were streamed in such a way that participants could not activate the sonification before the planned time nor listen to it more than once. After hearing the sonification participants were asked to fill in a questionnaire (see Section 4.1). Six international experts in water infrastructure, anomaly detection, and cyber-security took part in the evaluation. An introduction on data sonification with a demo excerpt of both anomalous and regular behavior, and the legend to interpret each sonification strategy, were made available to participants through an online website that the reader can access here. In order to limit memorization and learning effects among participants, two different datasets were used (with different anomalies) for each sonification strategy. Additionally, the evaluation of each prototype was scheduled over a period of 2 weeks to have a few days' interval between each test. Finally, the four prototypes were evaluated in a randomized order.
Section 4 will provide a detailed description of the evaluation protocol defined for the first Design Action (and further applied to the evaluation of the second Action), as well as experimental results. For further reading on the genesis of the first Design Action the reader can refer to Lenzi et al. (2019).
As previously discussed, the goals of the second Design Action are analogous to the first, adapted to the context of a fully digital network. The design requirements included that:
1. The sonification will focus on the representation of the highest level (Level 0) of information provided by the anomaly detection algorithm i.e., incoming foreign IP attacking the network's IP.
2. As in the first Action, we maintained that operators would listen to the sonification via headphones, which are already standard equipment in SOC.
3. We imagined the sonification as a continuous soundscape based on data streaming in real-time. Since the current algorithm caps the analysis of incoming data at a one-minute interval without indication of an order (i.e., data are streamed from different Fields of the network in real-time but the dataset only indicates the minute during which they were collected, see Supplementary material for an example of the dataset), a hierarchical strategy was established which prioritizes information on an attack, which is sonified at the beginning of each one-minute frame, if applicable.
4. During a series of brainstorming sessions with the project partner, a specific request from Ibermática emerged to design the sonification as a data-driven natural soundscape, specifically, the soundscape of a forest, on the claim that this would increase listening sustainability over long shifts while leveraging sounds easily recognizable by untrained listeners.
Following the design process established for the first Design Action, we produced a first data-to-sound prototype that sonified a 15-min excerpt of the SUCESO dataset containing both regular and anomalous values. Experimental results from the first Action (further detailed in Section 4) had shown that users tended not only to perform better but also to engage more with concrete sounds (vs. musical sounds). These results, together with the project partner's request of a natural soundscape and further evidence from literature (Hildebrandt et al., 2014, 2016; Vickers et al., 2014; Debashi and Vickers, 2018), supported the decision to design the first iteration of the prototype as a data-driven forest soundscape where different data categories are represented by different groups of sound sources (e.g. birds, insects) of a typical forest. At this stage, in agreement with the project's industrial partner, no other sound material was explored (e.g., musical sounds, other types of concrete sounds) while focusing instead on the type and quality of the sound material. A simple data-to-sound mapping strategy based on the proportional increase or decrease of the sound intensity (e.g., at the increase of the anomaly level, the sound level increases proportionally) was adopted for this first prototype, based on brainstorming sessions with the project industrial partner. Sounds of various elements of a typical forest (i.e., birds, insects, wind, leaves) were mapped to the network's Fields as identified by the anomaly detection algorithm. The sound of rain was mapped to the network global Anomaly Level with the rain's intensity increasing and decreasing proportionally. Lastly, the sound of a thunder was triggered whenever the algorithm identified an incoming cyber-attack as “True”.
Similarly to the first Design Action, a 15-min demo of the first prototype was shared with an internal group of ten experts in anomaly detection, Machine Learning, cyber-security, and digital network during a critique session. In general, the use of a forest soundscape was well received by the peer group who appreciated the high recognizability of the sounds, their pleasant and relaxing effect on the listener, and their potential for sustained listening over shifts several hours-long. Specifically, the sound of birds and insects to represent the different Fields of the network was positively valued, as well as the sound of rain and thunder to represent an incoming cyber-threat. On the contrary, the mapping rule based on changes in the sound level was considered weak, and potentially misleading. In fact, the perception of loudness is a subjective appreciation (Marquis-Favre et al., 2005) also conditioned by contextual factors such as the quality of the technology used to play the sound, the level of noise in the environment, and so on. Feedback from the critique session was used to refine the network-as-a-forest metaphor and rethink the mapping choices. As mentioned, (and in addition to the project partner's explicit request and evidence from previous literature) the choice of a data-driven soundscape was intended to be both a continuation and an advancement of the strategy applied in the first Design Action, where concrete sounds obtain better results (i.e., the sonification is more efficient and engaging) compared to musically tuned sounds (see Section 4). Additionally, the specific nature of the network under study in the second Action, based on real-time data streaming, allowed for the exploration of a continuous soundscape that, in our research hypothesis (see Section 2), can support operators in taking more informed decisions on the real nature of an anomaly (thus limiting the impact of false alarms) and make predictions on future attacks. In fact, as stated by Vickers et al. (2014, p. 5), and supported by further literature on an ecological and embodied approach to sonification (Gaver, 1993; Roddy, 2015) “we are already used to dealing with everyday background sound and quickly deciding what sounds need attending to and what sounds can be pushed to the attentional background. A soundscape offers the sonification designer the potential to leverage this innate information processing capacity in such a way that important changes in the cyber environment become salient in the soundscape.”
For the second prototype, the data-to-sound strategy was adapted from the “Repetition” strategy (see Figure 4B) that was deemed the most promising during the evaluation process of the first Design Action, meanwhile concluded (Section 4). According to this strategy, individual sound events in a given category (that represents specific elements of the network) progressively accumulate (i.e., increase their density) over a given time proportional to the increase in the value of the anomaly. Figure 5 provides a schematic representation of the mapping strategy adopted for the prototype design.
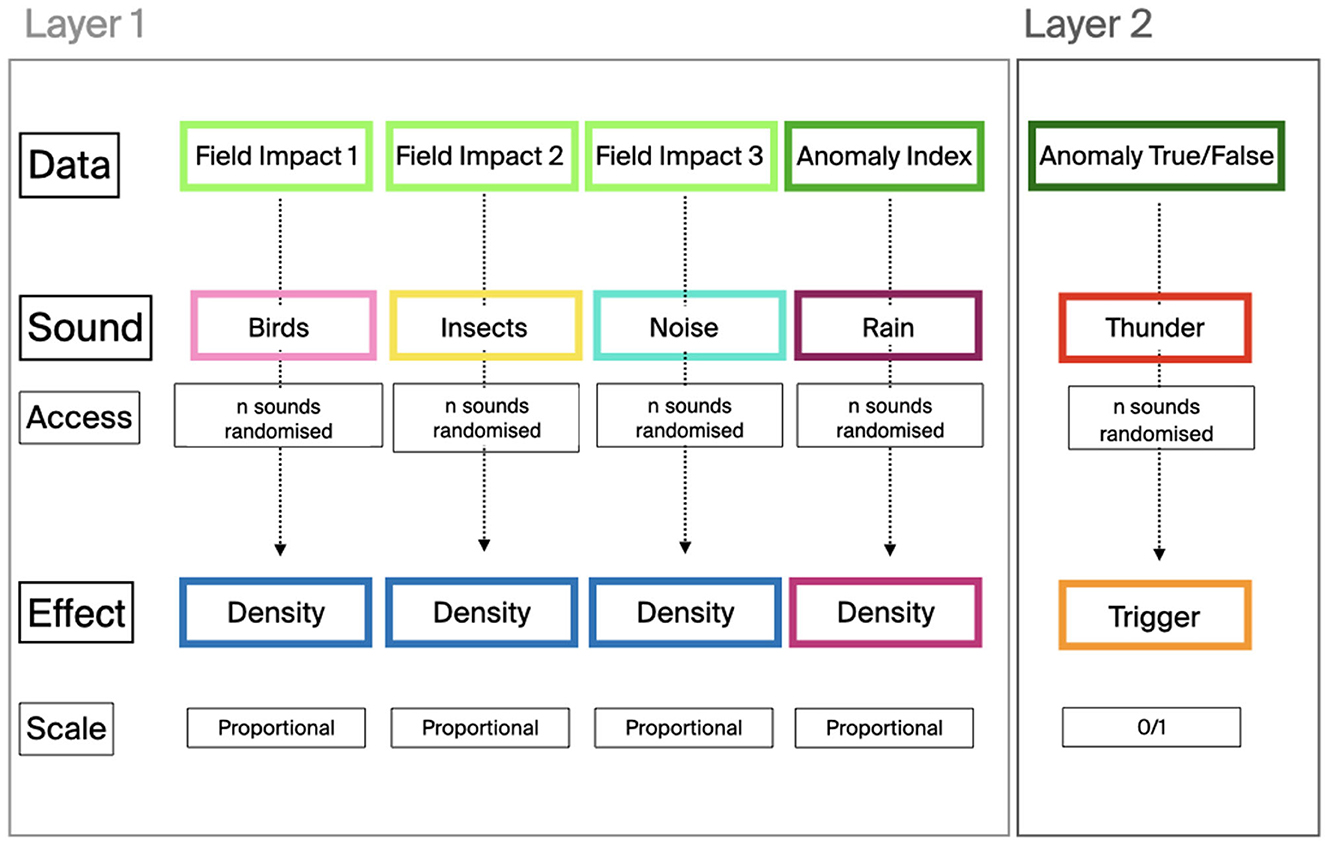
Figure 5. Schematic representation of the data-to-sound mapping strategy for the second Design Action prototype. The sonification is approached as a multi-layered solution in which a continuous sonification based on a progressive accumulation (Density) of sound events over time proportional to the anomaly level within a given category, coexists with an alarm-based sonification in which an auditory alert (the thunder) is triggered in the case of an incoming attack.
Based on the SUCESO algorithm architecture described in Section 2.2, values in the dataset are mapped to element of the forest soundscapes as follows:
1. The three Fields that identify the causes of the anomaly are represented by three different sound categories: birds, insects, and noise of the forest (e.g., wind through the leaves, crackling of wood). When a specific Field is affected by an anomaly, the density of the sound events (i.e., the frequency in repetition over time) increases.
2. The global Anomaly Index of the network is mapped to the sound of rain whose density increases proportionally. The behavior of the rainfall sound increases the operators' situational awareness (Debashi and Vickers, 2018) so that they can focus on current tasks while monitoring whether the network returns to a normal status of calm or else a storm (i.e., a cyber-attack) is approaching and the network requires full attention.
3. Whenever the algorithm detects a cyber-attack on the network (i.e., Anomaly True in the dataset), in addition to the increased density in the rainfall, the sound of a thunder is triggered. The operator, alerted by the auditory cue (Gaver et al., 1991), needs to interrupt the work routine and retrieve specific information on the incoming threat (by either referring to visual dashboards, consulting colleagues, and so on).
The sonification so obtained combines two different mapping strategies that function as overlapping layers in the final soundscape: Layer 1 continuously communicates the status of the network, and informs on the role that each field has, while Layer 2 functions as a “traditional” alarm that is triggered only when the algorithm detects a cyber-attack. This combined solution where continuous data sonification and auditory alarms coexist is meant (similarly to the first Design Action) to provide operators with ‘good enough' information on the status of the network, that the operator will further confirm by referring to other, analytical sources such as existing visualization systems. The reader will recall that auditory alarms are already in use in most SOC but are currently ‘switched off' by operators due to a high volume of false alarms. It is our working hypothesis that our combined strategy will, in the short term, increase the situational awareness of the operator on cyber-threats while minimizing the disruption of the daily routine caused by false alarms. In the medium-long term, the combination of an alarm with a continuous monitoring system will allow human operators to predict cyber-threat and even identify patterns in the attacks.
A digital prototype was implemented on a local network to simulate a live environment. The prototype combined a purposely designed Python script that simulates the streaming of data from the PLAGEMODA platform with a Max/MSP by Cycling ‘743 patch that translates data into sounds. The two applications communicate via the OSC (open sound control) protocol.4 In the current version of the prototype, each sound category (see Figure 5) is composed by a folder of about 20 sound samples. The duration of each sample is 3 seconds. The sound samples are extracted from monophonic recordings sourced from the personal sound library of the first author of this paper and from the Sounds of the Forest project,5 licensed in Creative Commons. The samples were slightly edited (e.g., normalized and equalized) for uniformity of the listening experience. No other manipulation is applied. From the prototype interface, the user can adjust the crossfading between one sample and the other (as the density increases), and the volume of each sound category (i.e., birds, insects, thunder, forest noise). Similarly to the first Design Action, a dedicated website, with an introduction to data sonification, a demo of both regular and anomalous behavior, and access to the prototype was set up for the evaluation phase. The reader can access the content, including a demo of the prototype, at this link.
Following the protocol established for the first Design Action and further detailed in the following section, the research team planned to evaluate the prototype by engaging domain experts (i.e., experts in digital networks, anomaly detection and cybersecurity) in using the prototype during their work routine over a prolonged period (~2 weeks). Due to the events that followed the COVID-19 lockdown in 2021, the experimental phase had to be severely limited. The final evaluation involved only two experts who used the prototype while working from home, for 3 h. However, insights have been collected from both the qualitative and quantitative evaluations that confirm experimental findings from the evaluation of the first Action. In Sections 4 and 5, we argue that the experimental findings, along with the design and evaluation methods used in the two Actions, contribute to the preliminary definition of a design framework that supports designers in applying sonification to the monitoring of anomalies in networked environments.
The evaluation protocol for the Datascapes project combines quantitative testing and qualitative research. Originally designed for the first Design Action (Sections 2.1 and 3.1), it has been further validated in the second Action (Sections 2.2 and 3.2). To recall, all the prototypes, across the two Actions, were designed with the objective that, through the sonification, the operator will be able to:
1. Determine if the network is behaving regularly or anomalously and specifically, understand when the network is under a cyber-attack.
2. Discriminate between different levels of anomaly, thus making better decisions on how to intervene.
3. Locate the area of the network where the attack is taking place or at least the number of different areas involved in the attack (the district in the case of the first Action, the field in the case of the second Action).
The goal of the evaluation was twofold. Firstly, we aimed to experimentally validate the performance of operators in correctly understanding the information conveyed by the sonification. To this purpose, a quantitative test was defined and applied to both Design Actions. The test asked participants to note, on a dedicated spreadsheet, when (1) the network was under a cyber-attack (i.e., attack Yes/No) (2) the network presented anomalous behavior and the level of gravity of the anomaly on a Lickert scale from 1 (i.e. regular) to 5 (i.e. attack in course) and (3) the location of the anomaly in the network (within the five districts in the first Design Action and the three fields in the second Action). Secondly, we aimed to gather as much qualitative feedback on the prototypes as possible, in order to inform further iterations of the two Design Actions toward a Datascapes Proof of Concept applicable to different use cases. On the day after the quantitative testing, participants were reached through virtual platforms (Zoom, Skype or similar) for a 1-h long follow-up interview. The interviewed was loosely organized around three main topics: (1) how users related to the sonification (undoubtedly a novel means of data representation for most domain experts) (2) under what conditions they would integrate it in a real-world scenario and (3) feedback on the design of the sonification, specifically, on the mapping strategy and the choice of sound material.
The experimental protocol was originally inspired by technology and design probes (Hutchinson et al., 2003; Hogan and Hornecker, 2016) inspired, in turn, by Gaver et al.'s (1999) cultural probes. In the field of Human-Computer Interactions, probes satisfy three main goals, which can be considered in line with the Datascapes project: (1) The social science goal of understanding the needs and desires of users in a real-world setting (2) the engineering goal of field- testing the technology, and (3) the design goal of inspiring users and researchers to think about new technologies (Hutchinson et al., 2003). However, probes are introduced at a very early stage of the conceptual development to gain fresh, unstructured insights that could even radically change the course of the prototyping (Boehner et al., 2007). Within the specific time—constraints of Datascapes (and the unexpected events related to the COVID pandemic), the actual evaluation took the form of an “in-the-wild” study (Chamberlain et al., 2012) or phenomenological research (Muratovski, 2015) which has also been previously suggested as a valid qualitative evaluation method for sonification (Vickers and Barrass, 2011).
To recall, six international experts in anomaly detection in water infrastructure and two experts in digital networks and cybersecurity took part in the evaluation of the first and second Design Action, respectively. The quantitative and qualitative study was conducted in a real-world environment during a typical working day while participants were carrying out their regular routine tasks.
In general, participants across the two Design Actions performed well in the quantitative testing with respect to the identification of cyber-attacks and anomalous behavior.
Differences in the peculiarities of each network (see Sections 2.1 and 2.2) that are reflected in different computational strategies for the detection of anomalous behavior also reflect in differences in the performance of the participants. However, these differences (e.g., real-time in case of the second Action, every hour in case of the first Action) do not seem to have an impact on the result. In general, in the case of the first Design Action, the strategy based on Repetition with concrete sounds (Figure 4B) obtained better results in the correct identification of cyber-attacks on the water distribution network represent by white squares in Figure 6, first row (refer to Lenzi et al., 2019 for further details).
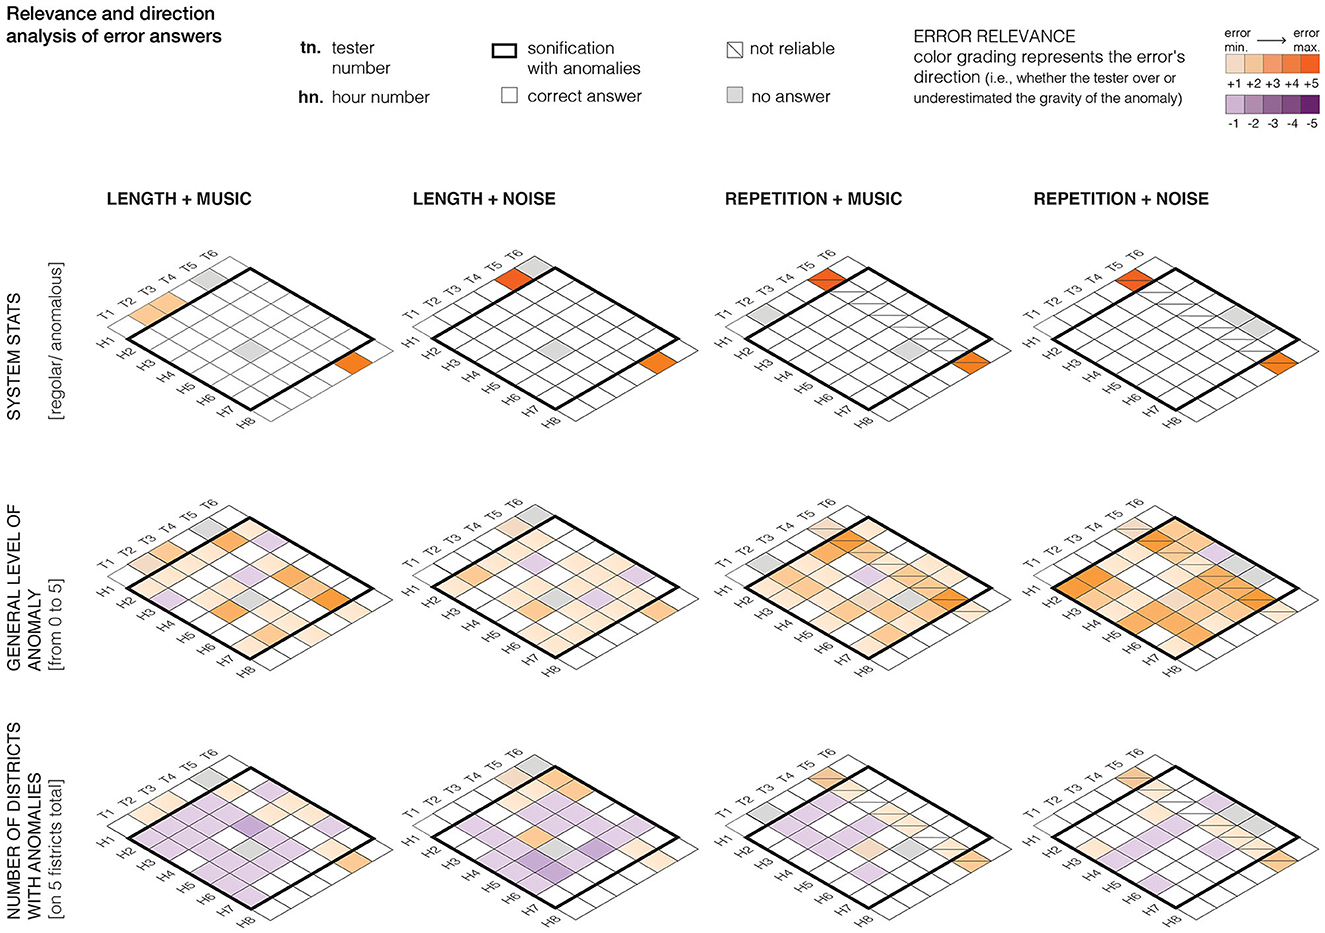
Figure 6. Results from the quantitative testing for the first Design Action. Results for each of the four prototypes are shown vertically. The diagram represents results for each tester (indicated as T1…T6 on the x-axis), for each hour (indicated as H1…H8 on the y-axis). On the three rows, from top to bottom, results are displayed for the three tasks assigned to participants: (1) the identification of a cyber-attack (2) the assessment of the level of gravity of the anomaly and (3) the identification of the affected districts or at least of the number of districts involved. For each task, the purple color indicates when a value was underestimated, the orange color when a value was overestimated. Both colors are graded based on the gravity of under- or overestimation.
The second Action used a similar strategy, and the good results obtained by the participants in identifying cyber-attacks (see Figure 7) corroborate the hypothesis that the increase in the repetition of sound events over a given time could be a successful strategy for the identification of a cyber-attack. While, given the limited number of participants to the evaluation (eight in total) and the limited amount of time (four working days for the first Actions and 3 h for the second) spent using the prototypes, further validation of the mapping strategy is needed, these results are in line with existing literature both on the usage of soundscapes for peripheral monitoring and situational or group awareness (Cohen, 1994; Debashi and Vickers, 2018) and on an embodied approach to sonification (Gaver et al., 1991; Roddy and Furlong, 2014; Roddy, 2015).
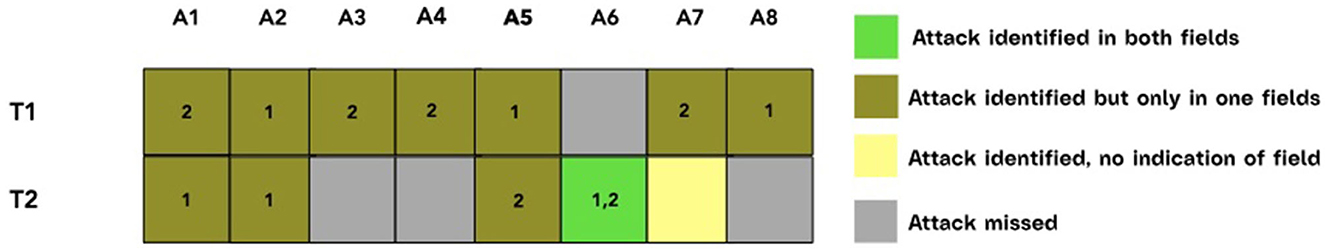
Figure 7. Results of the identification of cyber-attacks during the testing period for each participant to the evaluation of the second Design Action. Participants were asked to identify in which field the attack took place, or at least the number of affected fields. In gray color are the attacks that were missed, in yellow when no indication of a field was noted, in dark green when the number of districts was wrongly identified.
The task of identifying the gravity of the anomaly on a scale 1 to 5 seems to be more complicated. In general, participants to both experiments performed better than they expected i.e., they found the task challenging during testing while the results obtained are fairly positive. The quantitative testing shows that most of the testers could identify a low, intermediate and high anomaly level. The second row of Figure 6 shows in white the correct assessment of the anomaly level, in purple when participant underestimated and in orange when they overestimated the anomaly level. While it seems that in this case, participants obtained better results with the mapping strategy based on delay coupled with the use of tuned sounds further validation is needed, given the limited number of participants and time spent with each prototype. In the case of the second Action (Figure 8) both participants, contrary to their own expectations (shared during the follow-up interview) managed to correctly identify several levels of anomaly. We believe that this would be ‘good enough', in a real-world context, to correctly inform a decision on how to treat the anomaly and which action to perform (i.e., performing further checks or ignoring), especially if combined with visualization (Hermann et al., 2003).
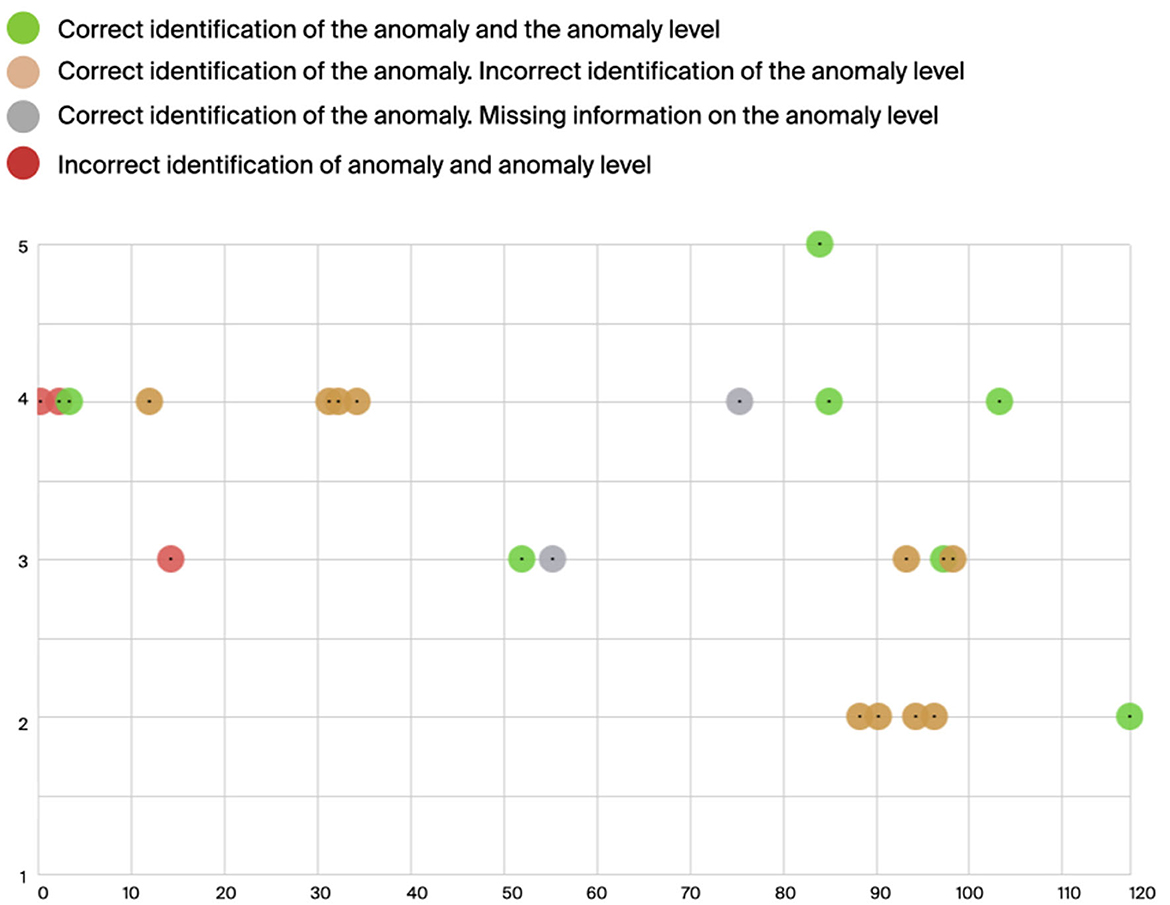
Figure 8. The figure shows results of the assessment of the anomaly level by participants. Given the low number of testers, data are aggregated. In green are the anomalies for which the anomaly level was correctly rated; in orange, the anomaly is correctly identified but with an incorrect level of gravity. In gray color, the testers did not give any indication of anomaly level and in red the entire attack was missed by the tester.
The location of the anomaly in the network is where participants encountered greater difficulty. In general, users managed to identify the number of districts (see third row of Figure 6) or fields (see Figure 9) involved in the attack, but they found it extremely difficult to distinguish one from the other. In general, it comes with no surprise that the error rate is higher at the increase of the number of anomalous districts or fields, when the situation in the network is more confused as the attack is causing more damage. However, we hypothesize that in a real-world situation, the operator would react to the perception of an increasingly serious situation, where more districts are affected, referring to complementary sources of information such as the existing visual dashboards. Furthermore, participants to the second Action questioned the relevance of this layer of information that, according to one expert, is related to the internal functioning of the algorithm rather than to the physical organization of the network. While such insights are, as mentioned above, in line with existing literature on the importance of selecting the appropriate quantity and quality of information to be conveyed by the appropriate display (Hermann et al., 2003; Edworthy and Stanton, 2020) they also open an extremely timely reflection on the role of sonification in understanding Artificial Intelligence processes in the context, for instance, of Explainable AI (Schuller et al., 2021).
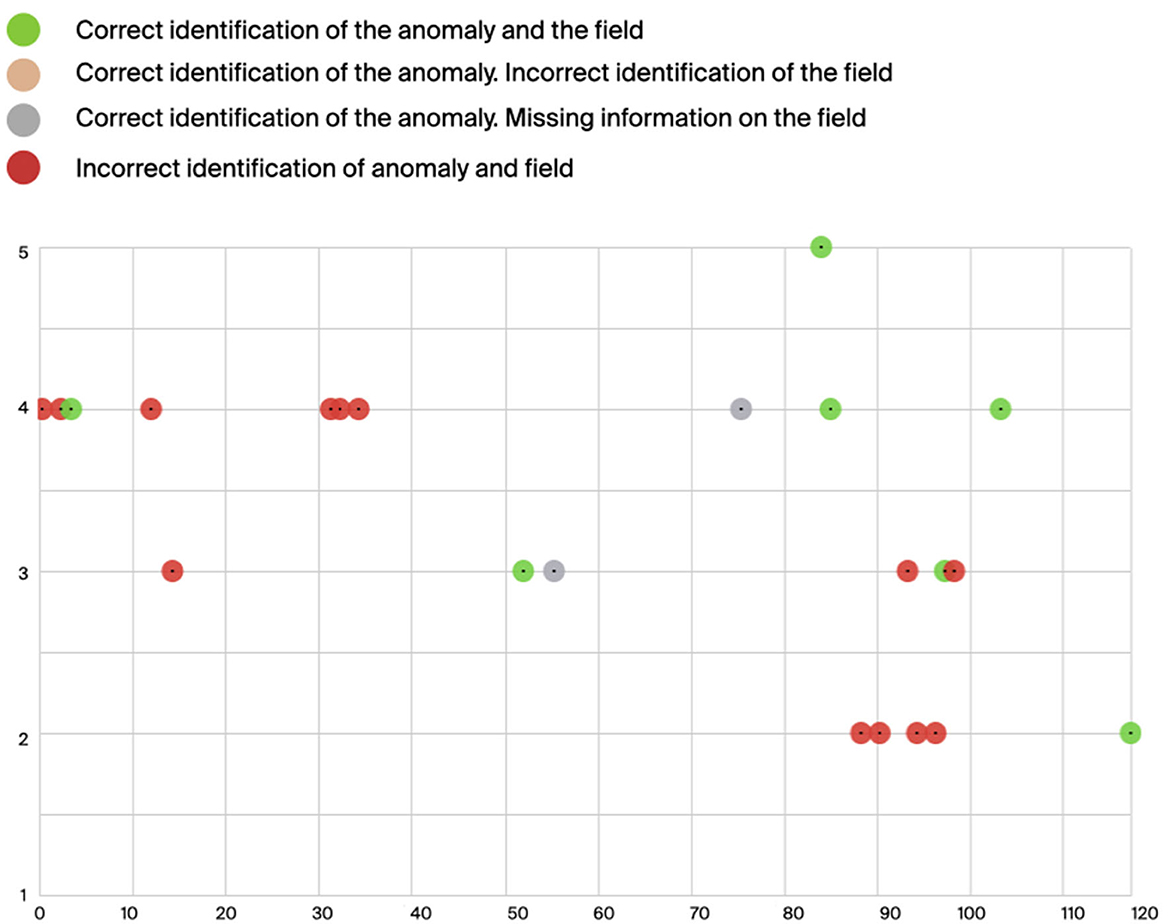
Figure 9. Identification of the location of the attack i.e., the field. Green color indicates when an anomaly was correctly detected with the corresponding anomaly level and also assigned to the correct field; in red are the anomalies that were both incorrectly assessed and assigned to the wrong field. In gray are the anomalies where no indication of the field was given by participants.
A separate reflection should be dedicated to the prototype of the second Action. Designed as a data-driven forest soundscape, the sonification has the ambition to provide listeners with a multi-layered representation of the network's behavior which includes both continuous (e.g., the rain or the presence of birds) and discrete sounds (e.g., the thunder triggered by an attack). As Gaver et al. (1991, p. 1) point out this approach presents difficulties as different auditory icons compete to attract the attention of the listener, and particular attention should be paid to the design of an ecology of sounds so that each sound event contributes to the holistic understanding of the network's status. The quantitative testing together with the participants' comments during the interviews (see below), while confirming the users' interest in an ecological approach based on familiar and pleasant sounds, also highlights that work has still to be done to select an amount of information that is both useful and understandable for the operator, and a sound material that is unintrusive (rather than pleasant or unpleasant), intelligible and familiar enough as to require minimum cognitive effort. Considering the sonification requirement for Datascapes (i.e., to combine and not replace existing visualization systems), a new iteration of the prototypes must be designed by analyzing and comparing the mapping strategies of the visualization and the sonification tool, and how they can work together to provide operators with a comprehensive solution. Regrettably, at this stage of the project, given the different time plans for the development of the visualization (in the case of the second Action) were not aligned with the time constraints of the sonification design, the integration of the two modalities was not deemed feasible.
While the reduced numbers of participants does not allow for a full validation of the strategies adopted in Datascapes, we believe these results raise valuable points on the requirements and potential of a sonification real-world application in the context of continuous monitoring in SOC. To recall, we designed the sonifications targeting domain experts i.e., users with several years of experience in network monitoring and hence, with an extremely sophisticated knowledge of the network they control. With the introduction of AI-based solutions for the detection of cyber-attacks, experts are expected to rely more and more on decisions taken within the algorithm' black box, their personal knowledge accumulated over the years, relegated to the second row. By communicating the behavior of the network to the human operator (for instance, the intermediate anomaly levels) rather than the algorithm's final decision, we want to empower humans to leverage their accumulated experience. This, combined with the algorithm's evaluation, will enable operators to take better, more informed and responsible decisions. Furthermore, we hypothesize that by listening to the sonification operators would be able, over time, to identify nuances in the network's behavior thus recognizing patterns, discover unknown threats, make predictions on future attacks, and discriminate between true and false alarms issued by the algorithm. During the follow-up interviews several testers pointed at the fact that judgment on the severity of the anomaly by listening to the sonification is inevitably subjective. We welcome this and similar comments as a confirmation of what we aim at with the design of Datascapes: to help human operators leverage their personal, subjective knowledge of the network and take back the responsibility of the decision.
The importance of the design of sounds used in the sonification was highlighted by the participants to both Actions. In terms of choice of sound material, results were not conclusive for the first DA as listeners shared mixed feelings toward the choice of tuned and untuned sounds (“The use of different musical instruments could help identify the districts”; “It would be good to use annoying concrete sounds to play anomalies and nice sounds for regular activities”). In some cases, participants attributed meaning based on personal memories and preferences to the non-tuned sounds (“It reminded me of video games I used to play”, “I associated it to a comic I used to read as a kid”), which they believed increased memorability and recognition. A direct relationship between like/dislike judgment and aesthetic considerations was highlighted by one of the participants (“I chose the preferred scenario mainly based on the aesthetics of the sound”) while another one problematized the use of pleasant sounds that would not convey a sense of urgency, proposing that annoying sounds are used to represent anomalies while pleasant sounds represent regular behavior. In the second DA, the natural sounds used in the sonication were defined as relaxing, pleasant, and emotional, to the point that listening made “my other tasks more pleasant and enjoyable”. Overall, these insights highlight once more the importance of the role of aesthetic choices in sonification design—not as a mere cosmetic operation but as a fundamental aspect of the relationship with the user, as highlighted on several occasion by members of the sonification community (Vickers and Barrass, 2011; Barrass, 2012; Roddy and Furlong, 2014; Nees, 2019; Roddy and Bridges, 2020).
In both DA there was general agreement on which specific sounds made participants “feel uneasy”. While insights from the qualitative analysis seem to indicate that positive feelings about the design of sounds in the sonification would greatly influence the motivation to adopt the sonification in a real-world context, a comparison between the quantitative testing and the qualitative judgment of like-dislike does not showed correlation i.e., against their own expectations participants did not perform better with sounds they liked most (or vice versa). This is in line with Walker and Kramer (1996) seminal study where the authors note that “We were surprised to see that the ‘Bad' ensemble actually led to the fastest performance. The supposedly ‘Intuitive' and ‘Okay' ensembles led to the poorest performance, overall, while the ‘Random' ensemble led to the best performance”.
In general, the frequency of the sonification, i.e., real-time in case of the second Actions and every hour in case of the first Action, was judged appropriate by the participants. Experts highlighted how this aspect is highly dependent on the characteristics of the network under study (in particular the failure time after an attack) which conversely stresses the importance of a thorough definition of the design requirements and constraints of the specific use case for a sonification project. As for the data-to-sound mapping as mentioned in the previous paragraph, results from the quantitative testing seem to indicate that the use of repetition/accumulation of sounds is a promising strategy although it should be tested with more users and across different use cases. Although the authors of this paper acknowledge that an increase in the density of sound events might be perceived as inconsistent (or unrealistic) with the real-world experience of a forest during a storm (when, for instance, the activity of animals tends to decrease and with it the sound level), participants to the evaluation did not consider this aspect as problematic. This might be related, as Chion (2016) posits to the impact of cinema, through which we learn to recognize and react to sound experiences that we never experienced before. In movies, sound conveys much more than a realistic experience—it adds to the narrative, communicates emotions and context (e.g., when the protagonist is intoxicated or scared, and everyday sounds feel “distorted”). With this intention, the sound events' accumulation is designed to transmit the feeling of chaos and disorder as a dangerous event (i.e., the storm, which represents the cyber-attack) is approaching. As the design of sound emerges from the Design Actions evaluation as of critical importance for the user, a new iteration of Datascapes will have to focus on all and each aspect of the sonic experience. While a multi-layered ecological approach will be maintained (as it proved successful both during the evaluation and in literature), we plan to move away from the use of “literal” sounds such as recorded birds and insects toward an “autographic” approach (Lenzi et al., 2023; Offenhuber, 2023) to the sonification of network by, for instance, using abstract sounds of electronic connections (i.e. the digital network communicating, see Gaver et al., 1991; Cohen, 1994). Lastly, more than one participant acknowledged an increased familiarity with the sonification over the course of the day, and a consequent increased capacity to distinguish nuances (e.g., differentiate the districts in the water network or intermediate levels of anomaly in the Internet Network). Additionally, they highlighted the importance, in a real-world application of the sonification, of specific training for the operators.
The evaluations confirmed the use of headphones in the specific context of sonification for process monitoring, which gives precious indications for the sonification design. In particular, the usage of spatialization of sounds for example in relation to the localization of the anomaly (as in Edward and Ville, 2003; Iber et al., 2020), could be explored in future iterations of the prototypes. However, the use of headphones might present other issues. In the context of the first Design Action (water network SOC), one of the participants partially missed the sonification as she had to leave her desk for a few hours. Another participant had to lower the volume due to an unexpected phone call incoming through the same headphones. In the case of the second Action (tested during COVID-19), participants took the test from home using noise-canceling headphones in a quiet environment, a situation that might be different from the real world, as results from the first Action show. A future iteration of Datascapes will explore solutions by design such as the integration of a portable version of the sonification application (e.g., a mobile app) and automatic adaptive volume control. One of the participants proposed, contrary to the current headphones predominance, to broadcast the sonification over the public announcement system so that anyone could react to an emergency, and it would only partially conflict (provided the correct design measure are undertaken) with other activities carried out through headphones (including listening to music, as pointed out by another participant). In a future iteration of Datascapes, the usage of loudspeakers could be explored based on the specific characteristics of the use case (e.g., frequency of the auditory alert, number of people and configuration of the control room). Lastly, participants highlighted—again—the importance of “well designed” sounds toward a real-world adoption of sonification. In particular, sounds should not be too repetitive, should be familiar enough to remain at the periphery while still attracting attention when needed, and should not be intruding on the normal work routine.
During the interview, participants to both Actions were extremely optimistic that sonification can become a widely adopted method of monitoring networks' anomalies thus liberating an overloaded visual channel from the need to “stare at a screen where nothing happens”. Among the reasons, participants quoted that it requires a low cognitive effort, alerts reach you fast, you can use it even when you are busy with other tasks, and it leverages a sensory modality alternative to vision. This confirms one of the main assumptions of both projects i.e., that sound can help reduce overload on the visual channel. In apparent contradiction, one of the participants (to the first Action) shared that “When the auditory alert played, every hour, I had to pause all my other activity to focus on understanding the sound”, however, she also pointed out that “with training this need will be highly reduced and, over time, might disappear”. As mentioned, the quality of the sound design was quoted as one of the main motivations for the adoption of a sonification system during normal work routine. Participants to the second Action confirmed that the use of natural soundscapes is promising as it can seamlessly integrate with the work acoustic environment. However, they also shared that during highly attention-demanding tasks (such as coding or debugging), the soundscape tended to disappear into the background (“I even forgot I was listening to a soundscape”). In their opinion, this might lead to missing intermediate level anomalies, while attacks (that have a dedicated alarm i.e., the thunder) would be noticeable enough not to be missed. This argument confirms that a sonification strategy based on multiple layers of information (in the case of the second Design Action, a layer of continuous sonification and a more traditional auditory alarm as a second layer designed to attract immediate attention), is promising and worth further exploring in a new iteration of Datascapes. Both groups highlighted the importance of training in real-world context in order to refine the capability of understanding the information conveyed by the sonification, and in particular the level of anomaly. Both groups agreed that the sonification should complement, and not replace, existing visual dashboards with which the operators are already extremely familiar. This last point suggests that in a new iteration of Datascapes a specific evaluation of the sonification in combination with existing visualizations is needed.
In conclusion, experimental results encourage the use of sonification for the monitoring of anomalies in the context of digital and digital-physical networks. The strategies we adopted, in particular the usage of repetition/accumulation of sound over time to communicate an increase in the anomaly level, with the addition, in the second Design Action of an auditory alarm to further attract the attention during an emergency seem to be promising. The efficacy of the use of sound to locate the anomaly within the network seems to be highly context-dependent (very useful in physical networks, less interesting and potentially confusing in digital networks) and should be further explored. Overall, the aesthetic quality of the sonic experience and the quality of the sound design emerged as critical for the adoption of the sonification in a real-world context. In the following and final section, we will propose a framework for sonification design where the aesthetic quality of the experience as well as its functionality are defined and validated through a design method that includes specific tools and evaluation protocols in an iterative process that engages the user from the beginning.
Both Design Actions were validated using a combination of quantitative and qualitative methods. In the case of the first Action, six domain experts were engaged in an experiment which took place over 4 days, 8 h a day. Participants were presented with four different early-stage sonification prototypes, which they used to perform several tasks in the context of anomaly detection in a water distribution network. A key requirement of the experiment was that participants used the sonification during a normal working day, in their usual workplace and carrying out routine tasks. Participants were selected based on their familiarity with the domains involved in the study: mainly, water infrastructure engineering and cyber-security. Preliminary to the experiment, all the participants were asked to complete a questionnaire to evaluate their prior knowledge of music and, more in general, their sound culture, as well as to collect other demographic data. Information on the topic of sonification, the context of the project and the experimental protocol was collected on a purposely designed web page and shared with each participant during a training session organized via Skype (or equivalent), followed by a Q&A session in which each participant could ask questions or clarify doubts. As described in detail in Section 4, the evaluation phase included a quantitative testing to evaluate the performance followed by the collection of qualitative data through a semi-structured interview.
The second Design Action, albeit highly limited by the COVID lockdown (which, for instance, made the evaluation in the real working contexts unviable) replicated the same protocol. Grounded in the experience of the two Design Actions, therefore, we define a three-phases evaluation protocol for sonification for anomaly detection which we understand as a critical and necessary part of the sonification design method.
Figure 10 illustrates the general design process followed during Datascapes (further explained below) and recaps on the specific steps established for the evaluation protocol and specifically:
1. Training session: It provides participants with information about sonification in general as well as describing, with examples, the specific project. During Datascapes, we found that sharing this information on a web page to share with the participants beforehand seems like a good solution. In a second step, a session (either one-to-one or in group) can be arranged to recap on the general information and the specific instructions and clarify doubts.
2. Preliminary questionnaire: It gathers demographic information and evaluates the level of expertise of the participants, both in the domain under study and in the regards to music and sound.
3. Quantitative testing: It assesses the participants' performance in using sonification to detect anomalous behavior. Specific tests are designed based on the characteristics of the use case.
4. Qualitative assessment: It assesses and collects feedback through semi-structured interviews that explore areas such as sound design, mapping strategy, user experience. The specific qualitative methods (e.g., interviews, observations, focus groups) should be chosen based on considerations such as the status of the prototype (e.g., early or late-stage, one or more versions), the specific goals of the sonification, and the context of usage (e.g., private or public company, strategic infrastructure), and so on.
5. Analysis of quantitative and qualitative data: It informs future iterations and implementations of the sonification.
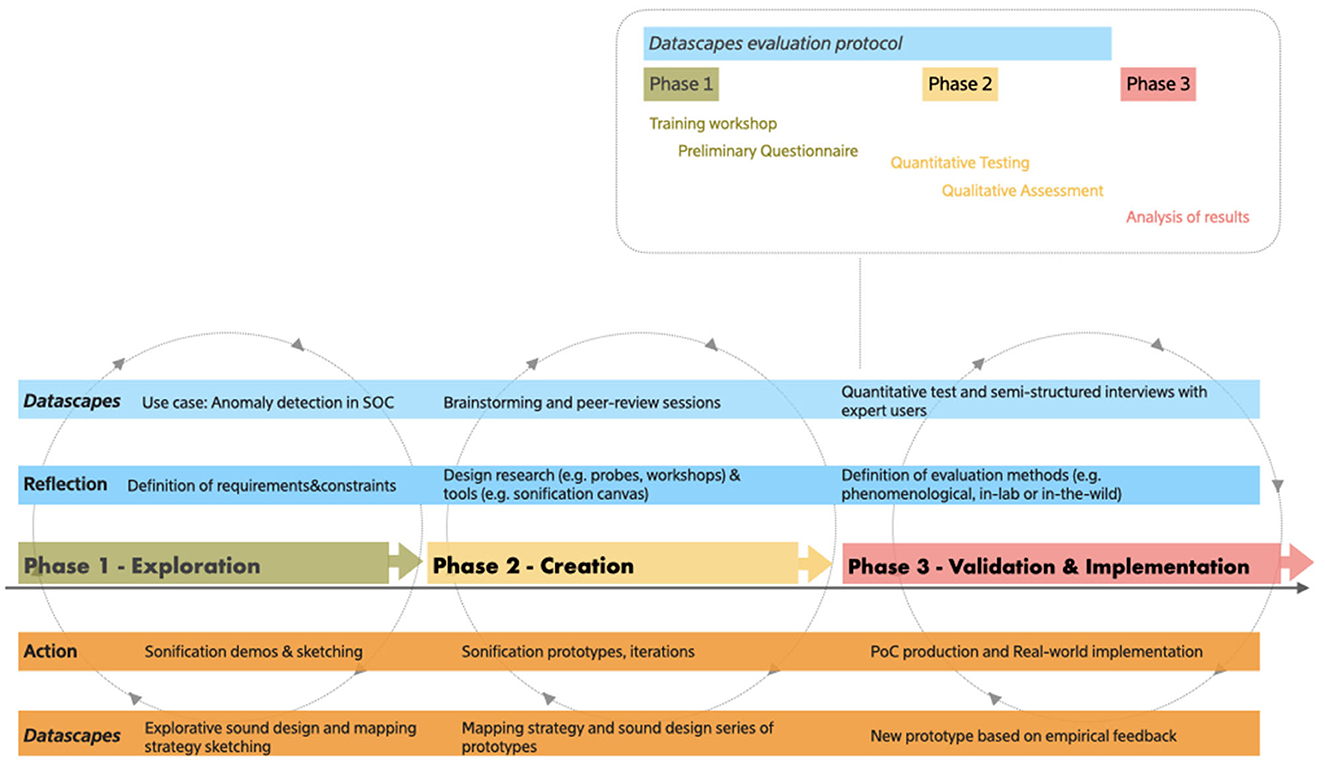
Figure 10. Diagram of the design process followed in Datascapes with the two combined layers inspired by Schön's “reflection in action”. The diagram highlights the general method as well as the correspondence of each phase with the Datascapes project together with the detailed steps of the evaluation protocol. The protocol includes three phases: Phase 1, which includes a preliminary questionnaire and training; Phase 2, which includes the collection of quantitative and qualitative data; Phase 3, which is dedicated to the analysis of results to inform the next steps.
For future applications of the above-described protocol, and to overcome the limitations of the Datascapes study we present in this paper, we suggest that the quantitative evaluation is conducted not only in a real-world environment but also over a prolonged period of time (ideally, several days if not weeks) in line with in-the-wild and phenomenological approaches. The use of probes at an early stage of users' involvement should, as originally planned by the authors, be included in the design method to gather insights before the prototyping phase.
We intended the above-described evaluation protocol as part of an intentional design process i.e., where the designer takes explicit decisions to communicate a specific message to a specific user, in a specific context (Frascara, 2004; Lenzi and Ciuccarelli, 2020). For the two Design Actions, our approach was structured in three phases: Exploration, Creation and Implementation (see Figure 10). Inspired by Schön's (1992) concept of “reflection in action”, we understand this process as characterized by a constant tension between theory and practice, because, with Schön (1992), “When someone reflects-in-action, he becomes a researcher in the practice context. He is not dependent on the categories of established theory and technique but constructs a new theory of the unique case.” (p. 68). While this process largely mirrors a typical design-driven approach already in use in other fields of sound design (see for instance Pauletto, 2014; Susini et al., 2014) it is still largely uncommon among experts in sonification, who typically have diverse backgrounds (Supper, 2012) and do not usually undergo formal training in design methods.
While a design-thinking process has proven to be effective in the first phase of the Datascapes project presented in this article, other methods could be explored by sonification designers. In sound design for film, Sonnenschein (2001) proposes the sound map—where all elements of a movie's narrative (visual, emotional and sonic) are integrated along a timeline—as an iterative support for the sound designer during the creative process.
In auditory display research, Brazil and Fernström (2009) defined a design framework which is divided in two phases (sound creation and sound analysis) where listening to the sounds created in the first phase has a central role as a form of self-evaluation and process iteration. Barrass (2003) described several sonification design patterns inspired by Christopher Alexander's architectural and urban design patterns (Alexander et al., 1977) as a way to catalog good solutions to common sonification problems in a given context, with the additional goal of facilitating the development of a shared technical and design vocabulary for sonification. Other methods already used in design research (and partially in sound design, see for instance Hug, 2020; Misdariis and Hug, 2021) should be explored as the field of sonification moves toward a closer relationship with users/listeners. For instance, co-creation sessions and other participatory design methods already used in data visualization processes (see for instance Jänicke et al., 2020) and research through design methods (Stappers and Giaccardi, 2017) could be adapted to drive the creation of sonification projects, as well as self-reflective methods such as those used in HCI that have also been proposed for sonification (Wirfs-Brock et al., 2021). Specific tools, such as the purposely defined Sonification Canvas (Lenzi and Ciuccarelli, 2023) but also other product, architectural and UX design ideation methods such as SCAMPER or the 6-3-5 (Sádaba, 2019; Sádaba and Collantes, 2023) could be integrated into the process.
The design process used in Datascapes provides an example through which we aim to contribute to the further definition of common design and evaluation methods within the sonification community. This will in turn help create a corpus of best practices in which the field of sonification can ground its roots to sustain a full transition from a niche practice to a widespread data representation method based on common and reproducible principles. This transition will help sonification contribute to building valuable and conscious human-data relationships.
We see sonification as an added value to design more efficient and engaging human-in-the-loop solutions for AI-based systems. Specifically, during the first phase of Datascapes, insights emerged that can form the basis for future design guidelines. A sonification solution that explicitly aims to foster and facilitate human participation in the design, training and improvement of AI systems should:
1. Help humans detect and identify errors committed by the AI.
As seen in the two Design Actions, AI solutions for anomaly detection are still subject to errors that still delay their introduction in the real world. False positives are known to have the largest impact on the routine of a SOC although false negatives, where a cyber-attack gets undetected, can also have harmful consequences. Thus, human operators should double-check the algorithm's “decision” by accessing and understanding its rationale, while—as stated by one of the participants to the Datascapes evaluation—avoiding having to learn technical AI jargon. Recall that operators are not expert in AI but are extremely expert in the network they supervise. An approach as the one adopted in the first Design Action—where, in the absence of an explicit “decision” by the algorithm the sonification conveys information on the gravity of the anomaly so that the operator can intervene—and the second Design Action—where not only the “final” decision of the AI on the “truth” of an attack is conveyed but also all the intermediate values of the anomaly level are sonified—are meant to empower operators to be able to distinguish between false and true alerts, and take a correct decision accordingly.
2. Contribute to the development of a new language to properly communicate with more-than-human intelligences.
Results from the Datascapes evaluation process show that listeners tend to attribute meaning—either based on their memories, or personal experience and background—to the sounds used in the sonification. Sonification designers should focus on designing an appropriate sound to give voice to AI systems in a specific context. This could be done by leveraging simple metaphors and/or everyday sounds that we are extremely familiar with in order to avoid the need for additional training and minimize cognitive effort. Specific attention should be given to multi-cultural context where listeners could interpret sound events and what they represent in different ways. Participants tended to believe that they performed more effectively when they also “liked” the sounds used for the sonification. This was not always the case and should be more investigated in the context of building a “mutual” understanding between humans and other intelligences.
3. Follow an appropriate, accountable and iterative process that takes into account both the functionality and the aesthetics experience of the operators.
Interviews with experts during the evaluation of Datascapes confirmed what from within the sonification community has been advocated for in several occasions over the past decade (see among others Vickers and Barrass, 2011; Roddy and Furlong, 2014; Nees, 2019; Neuhoff, 2019): the aesthetic quality of the sonification experience is as important—if not more—than the functionality of, for instance, the data-to-sound mapping choices. While the latter reflects on the efficiency and effectiveness of the users' performance, the former is key when it comes to a real-world application of the sonification. Comments from the users such as It made me happy, It is a pleasure to listen to, It was funny, It made my other tasks lighter—referred to the sonification prototypes—are clear indicators of the importance of the emotional characteristics of sound. As such, they should be part of the design process from its inception. As the field of sonification gains momentum, an effort has to be collectively made to define a design process for sonification where explicit choices are made not only around the much-debated “mapping problem”, but also on the quality and types of the sounds used to build the sonification (e.g., concrete sounds or synthesis sound), their function (e.g., metaphors or icons, autographs of a phenomenon or abstract symbols a user must learn), and the listening experience they trigger (e.g., does the design expect a listener to causally connect the sound to its source, or symbolically, or..?). These and more questions have to be intentionally asked, answered, and shared with the community for sonification to become an impactful medium of communication between humans, data, and artificial intelligences in the near future.
The original contributions presented in the study are included in the article/Supplementary material, further inquiries can be directed to the corresponding author.
Ethical review and approval was not required for the study on human participants in accordance with the local legislation and institutional requirements. Written informed consent from the participants was not required to participate in this study in accordance with the national legislation and the institutional requirements.
SL: Conceptualization, Investigation, Methodology, Project administration, Writing—original draft & Writing—review & editing. GT: Resources, Data curation, Formal analysis, Methodology, Writing—original draft. DM: Software, Validation, Writing—review & editing. AM: Data curation, Software, Validation, Supervision. PC: Methodology, Supervision, Resources, Writing—review & editing.
The author(s) declare financial support was received for the research, authorship, and/or publication of this article. This research has been conducted with the support of the Department of Design of the Politecnico di Milano, Italy. The SUCESO project was funded under the grant I+D Empresarial Hazitek 2017 of the Government of the Basque Country.
The authors thank iTrust, i3B and Tecnalia for participating in the design, implementation and evaluation of Datascapes, despite the difficulties of the restrictions imposed by the COVID pandemic.
AM was employed by Instituto Ibermática de Innovación (i3B).
The remaining authors declare that the research was conducted in the absence of any commercial or financial relationships that could be construed as a potential conflict of interest.
All claims expressed in this article are solely those of the authors and do not necessarily represent those of their affiliated organizations, or those of the publisher, the editors and the reviewers. Any product that may be evaluated in this article, or claim that may be made by its manufacturer, is not guaranteed or endorsed by the publisher.
The Supplementary Material for this article can be found online at: https://www.frontiersin.org/articles/10.3389/fcomp.2023.1254678/full#supplementary-material
1. ^https://pypi.org/project/miditime/
2. ^https://www.ableton.com/en/shop/live/
4. ^https://en.wikipedia.org/wiki/Open_Sound_Control
5. ^https://timberfestival.org.uk/soundsoftheforest-soundmap/
Alexander, C., Silverstein, M., and Ishikawa, S. (1977). A Pattern Language: Towns, Buildings, Construction. Oxford: Oxford: Oxford University Press.
Axon, L., Al Ahmadi, B. A., Nurse, J. R. C., Goldsmith, M., and Creese, S. (2020). Data presentation in security operations centres: exploring the potential for sonification to enhance existing practice. J. Cybersecu. 6, 1. doi: 10.1093/cybsec/tyaa004
Axon, L., Happa, J., Goldsmith, M., and Creese, S. (2019). Hearing Attacks in Network Data: An Effectiveness Study. Comp. Secu. 83, 367–388. doi: 10.1016/j.cose.2019.03.004
Axon, L., Nurse, J. R. C., Goldsmith, M., and Creese, S. (2017). A formalised approach to designing sonification systems for network-security monitoring. Int. J. Adv. Secur. 10, 26−47.
Bakker, S., van den Hoven, E., and Eggen, B. (2012). Knowing by ear: leveraging human attention abilities in interaction design. J. Multimodal User Interf. 5, 197–209. doi: 10.1007/s12193-011-0062-8
Ballatore, A., Gordon, D., and Boone, A. P. (2018). Sonifying data uncertainty with sound dimensions. Cartography Geog. Inform. Sci. 46, 85–400. doi: 10.1080/15230406.2018.1495103
Ballora, M., Pennycook, B., Ivanov, P. C., Glass, L., and Goldberger, A. L. (2004). Heart rate sonification: a new approach to medical diagnosis. Leonardo 37, 41–46. doi: 10.1162/002409404772828094
Ballora, M., Pennycook, B. W., and Glass, L. (2000). “Audification of heart rhythms in csound,” in The Csound Book: Perspectives in Software Synthesis, Sound Design, Signal Processing, and Programming, eds. R. Belanger (Cambridge, MA: MIT Press).
Barrass, S. (2003). “Sonification design patterns,” in Proceedings of the 9th International Conference on Auditory Display (ICAD2003) (Boston, MA: ICAD).
Barrass, S. (2012). The aesthetic turn in sonification towards a social and cultural medium. AI and Soc 27, 177–181. doi: 10.1007/s00146-011-0335-5
Boehner, K., Vertesi, J., Sengers, P., and Dourish, P. (2007). “How HCI interprets the probes,” in Proceedings of the SIGCHI Conference on Human Factors in Computing Systems (CHI '07) (New York, NY: Association for Computing Machinery), 1077–1086.
Brazil, E., and Fernström, M. (2009). “Subjective experience methods for early conceptual design of auditory display,” in Proceedings of the 15th International Conference on Auditory Display (ICAD2009) (Copenhagen, Denmark: ICAD).
Brewster, S. A. (2002). “Non-speech auditory output,” in Human-Computer Interaction Handbook, eds. J. A. Jacko, and A. Sears (Mahwah, NJ: Lawrence Erlbaum Associates), 220–239.
Broussard, M. (2019). Artificial Unintelligence: How Computers Misunderstand the World. Cambridge, MA: MIT Press. doi: 10.7551/mitpress/11022.001.0001
Chamberlain, A., Crabtree, A., Rodden, T., Jones, M., and Rogers, Y. (2012). “Research in the wild: understanding 'in the wild' approaches to design and development,” in Proceedings of the Designing Interactive Systems Conference (DIS '12) (New York, NY: Association for Computing Machinery), 795–796.
Cohen, J. (1994). “Out to lunch: further adventures monitoring background activity,” in Procedings ICAD 1994 (Santa Fe: Santa Fe Institute), 15–20.
Debashi, M., and Vickers, P. (2018). Sonification of network traffic flow for monitoring and situational awareness. PLoS ONE 13, 1–31. doi: 10.1371/journal.pone.0195948
Edward, C., and Ville, P. (2003). “Using multi-channel spatialization in sonification: A case study with meteorological data,” in Proceedings of the 9th International Conference on Auditory Display (ICAD) (Boston, MA: ICAD).
Edworthy, J., and Stanton, N. A. (2020). Human Factors in Auditory Warnings. First edition 1999. London, UK: Routledge.
Frascara, J. (2004). Communication Design: Principles, Methods, and Practice. New York: New York: Allworth Press.
Gaver, B., Dunne, T., and Pacenti, E. (1999). Design: cultural probes. Interactions 6, 21–29. doi: 10.1145/291224.291235
Gaver, W. (1993). What in the World Do We Hear?: An Ecological Approach to Auditory Event Perception. Ecological Psychology 5:1, 1–29. doi: 10.1207/s15326969eco0501_1
Gaver, W. W., Smith, R. B., and O'Shea, T. (1991). “Effective sounds in complex systems: the ARKOLA simulation,” in Proceedings of the SIGCHI Conference on Human Factors in Computing Systems.
Guillarme, A. (2011). “Intelligent Auditory Alarm,” in The Sonification Handbook, eds. T. Hermann, A. Hunt, J. G. Neuhoff. (Berlin, Germany: Logos Publishing House), 493–508.
Hermann, T., Hildebrandt, T., Langeslag, P., and Rinderle-ma, S. (2015). “Optimizing Aesthetics and Precision in Sonification for Peripheral Process-Monitoring,” in Proceedings of the 21st International Conference on Auditory Display, 317–318.
Hermann, T., Niehus, C., and Ritter, H. (2003). “Interactive visualization and sonification for monitoring complex processes,” in International Conference on Auditory Display (Boston, MA), 247–250.
Hildebrandt, T., Hermann, T., and Rinderle-Ma, S. (2014). “A sonification system for process monitoring as secondary task,” in 5th IEEE Conference on Cognitive Infocommunications (CogInfoCom) (Vietri sul Mare: CogInfoCom), 191–196. doi: 10.1109/CogInfoCom.2014.7020444
Hildebrandt, T., Hermann, T., and Rinderle-Ma, S. (2016). Continuous sonification enhances adequacy of interactions in peripheral process monitoring. Int. J. Human-Comp. Stud. 95, 54–65. doi: 10.1016/j.ijhcs.2016.06.002
Hildebrandt, T., and Rinderle-Ma, S. (2015). “Server sounds and network noises,” in 6th IEEE International Conference on Cognitive Infocommunications (CogInfoCom) (Gyor: CogInfoCom), 45–50.
Hogan, T., and Hornecker, E. (2016). “Feel it ! See it ! Hear it ! Probing Tangible Interaction and Data Representational Modality,” in Des Res Soc. (Florida: Fort Lauderdale), 1–13.
Hug, D. (2020). “How do you sound design? an exploratory investigation of sound design process visualizations,” in Proceedings of the 15th International Audio Mostly Conference (AM '20) (New York, NY: Association for Computing Machinery), 114–121.
Hutchinson, H., Mackay, W., Westerlund, B., Druin, A., Plaisant, C., Lafon, M., et al. (2003). “Technology probes: Inspiring design for and with families,” in CHI03 Proceedings of the Conference on Computer-Human Interaction, 17–24.
Iber, M., Lechner, P., Jandl, C., Mader, M., and Reichmann, M. (2020). Auditory augmented process monitoring for cyber physical production systems. Pers. Ubiquit Comput. 2019, 53–60.doi: 10.1145/3356590.3356600
Jänicke, S., Kaur, P., Kuzmicki, P., and Schmidt, J. (2020). “Participatory visualization design as an approach to minimize the gap between research and application,” in Proceedings of VisGap (Norrköping), 35–42.
Johnson, K. R., Hagadorn, J. I., and Sink, D. W. (2017). Alarm Safety and alarm fatigue. Clini. Perinatol. 44, 713–728. doi: 10.1016/j.clp.2017.05.005
Lenzi, S., and Ciuccarelli, P. (2020). “Intentionality in data sonification of social issues,” Big Data and Society. doi: 10.1177/2053951720944603
Lenzi, S., and Ciuccarelli, P. (2023). “Designing tools for designers: the data sonification canvas,” in Design Research Society Conference. (Boston: Northeastern University).
Lenzi, S., Ciuccarelli, P., and Offenhuber, D. (2023). “Towards a definition of Autographic Sonifications: Listening as an act of knowledge,” in Design Research Society Conference (Boston: Northeastern University).
Lenzi, S., Terenghi, G., Taormina, R., Galelli, S., and Ciuccarelli, P. (2019). “Disclosing cyber-attacks on water distribution systems,” in An experimental approach to the sonification of threats and anomalous data. In Proceedings of the 25th International Conference on Auditory Display (Tyne: Northumbria University), 125–132.
Marquis-Favre, C., Premat, E., and Aubrée, D. (2005). Noise and its effects–a review on qualitative aspects of sound. Part II: Noise and annoyance. Acta Acustica united with Acustica 91, 626–642.
Masud, L., Valsecchi, F., Ciuccarelli, P., Ricci, D., and Caviglia, G. (2010). From data to knowledge: visualizations as transformation processes within the data-information-knowledge continuum. Proc Int Conf Inf Vis. 2010, 445–449. doi: 10.1109/IV.2010.68
Misdariis, N., and Hug, D. (2021). “Sound design methodologies: between artistic inspiration and academic perspiration,” in The Bloomsbury Handbook of Sonic Methodologies, eds. M. Bull, M. Cobussen (New York, NY: Bloomsbury Academic), 685–704.
Muratovski, G. (2015). Research for Designers. A Guide to Methods and Practice. London: Sage Publishing Ltd.
Nees, M. A. (2019). “Eight components of a design theory of sonification,” in Proceedings of the 25th International Conference on Auditory Display, Newcastle-upon-Tyne, UK. Available online at: http://hdl.handle.net/1853/61522 (accessed December 13, 2023).
Nesbitt, K., and Barrass, S. (2004). Finding trading patterns in stock market data. IEEE Comput. Graph. Appl. 24, 45–55. 10.1109/MCG.2004.28. doi: 10.1109/MCG.2004.28
Neuhoff, J. G. (2019). “Is Sonification Doomed to Fail?,” in Proceedings of the 25th International Conference on Auditory Display (ICAD 2019). Available online at: http://hdl.handle.net/1853/61531 (accessed December 13, 2023).
Norman, D. (1993). Things that Make Us Smart: Defending Human Attributes in the Age of the Machine. Boston, MA, USA: Addison-Wesley Longman Publishing Co., Inc.
Offenhuber, D. (2023). Autographic Design: The Matter of Data in a Self-Inscribing World. Boston, Massachusetts: MIT Press.
Ostfeld, A., Salomonas, E., Ornsbee, L., Uber, J., Bros, C., Kalungi, P., et al. (2012). Battle of the water calibration networks. J. Water Resour. Plann. Manage. 191, 523–532. doi: 10.1061/(ASCE)WR.1943-5452.0000191
Pauletto, S. (2014). “Editorial in The New Soundtrack,” in Special Issue Perspectives on Sound Design (Edinburgh: Edinburgh University Press).
Roddy, S. (2015). Embodied Sonification (PhD Thesis). Dublin: University of Dublin, Trinity College. Available online at: http://hdl.handle.net/2262/80558 (accessed December 13, 2023).
Roddy, S. (2018). Ambient Data Monitoring w/Generative Music Systems using Evolutionary Computing and Machine Learning Techniques. Dublin: CSMC 2018.
Roddy, S., and Bridges, B. (2020). Mapping for meaning: the embodied sonification listening model and its implications for the mapping problem in sonic information design. J. Multimodal. User Interf. 14, 143–151. doi: 10.1007/s12193-020-00318-y
Roddy, S., and Furlong, D. (2014). Embodied aesthetics in auditory display. Organised Sound 19, 7–77. doi: 10.1017/S1355771813000423
Roetzel, P. G. (2019). Information overload in the information age: a review of the literature from business administration, business psychology, and related disciplines with a bibliometric approach and framework development. Bus. Res. 12, 479–522. doi: 10.1007/s40685-018-0069-z
Rönnberg, N., Lundberg, J., and Löwgren, J. (2016). “Sonifying the periphery: Supporting the formation of gestalt in air traffic control,” in Proceedings of ISon 2016, 5th Interactive Sonification Workshop, CITEC. (Bielefeld: Bielefeld University), 23–27.
Sádaba, F. J. (2019). “Transversality and Common Ground between Architecture, Design Thinking and Teaching Innovation,” in VII Jornadas sobre Innovación Docente en Arquitectura (JIDA'19), Escuela Técnica Superior de Arquitectura de Madrid, 14 y 15 de Noviembre de 2019, eds. García Escudero, D., and Bardí Milà, B, 290–301.
Sádaba, J., and Collantes, E. (2023). Implementación de metodologías de Design Thinking en el Taller de Arquitectura. XI Jornadas sobre Innovación Docente en Arquitectura (JIDA'23), Escuela Técnica Superior de Arquitectura de Granada, 16 y 17 de Noviembre de 2023: libro de actas, eds. Bardí Milà, B., and Garcia Escudero, D, 623–636.
Schön, D. A. (1992). The Reflective Practitioner: How Professionals Think in Action, 2nd Edn. London: Taylor & Francis.
Schuller, B., Virtanen, T., Riveiro, M., Rizos, G., Han, J., Mesaros, A., and Drossos, K. (2021). “Towards Sonification in Multimodal and User-friendlyExplainable Artificial Intelligence,” in Proceedings of the 2021 International Conference on Multimodal Interaction (ICMI '21) (New York, NY: Association for Computing Machinery), 788–792.
Shackleton, M., Sly, D., Favilla, S., and Walsh, M. (2023). “A spatial audio frequency modulation technique for sonification of epilepsy-related discharges,” in Proceedings of the International Conference on Auditory Display (ICAD2023) (Nörrkoping, Sweden: ICAD).
Sonnenschein, D. (2001). Sound Design: The Expressive Power of Music, Voice and Sound Effects in Cinema. Angeles: Michael Wiese Production.
Stappers, P. J., and Giaccardi, E. (2017). “Research through design,” in The Encyclopedia of Human-Computer Interaction (2nd ed., pp. 1-94), eds. M. Soegaard, and R. Friis-Dam (Aarhus: The Interaction Design Foundation).
Supper, A. (2012). Lobbying for the Ear: the Public Fascination With and Academic Legitimacy of the Sonification of Scientific Data. (PhD Thesis) Maastricht: Univ. Pers Maastricht.
Susini, P., Houix, O., and Misdariis, N. (2014). “Sound design: an applied, experimental framework to study the perception of everyday sounds,” in The New Soundtrack (Edinburgh: Edinburgh University Press), 103–121.
Taormina, R., Galelli, S., Tippenhauer, N. O., Salomons, E., and Ostfeld, A. (2017). Characterizing cyber-physical attacks on water distribution systems. J. Water Res. Plann. Manage. 143, 04017009. doi: 10.1061/(ASCE)WR.1943-5452.0000749
Taormina, R., Galelli, S., Tippenhauer, N. O., Salomons, E., Ostfeld, A., Eliades, D. G., and Ohar, Z. (2018). Battle of the attack detection algorithms: disclosing cyber-attacks on water distribution networks. J. Water Res. Plann. Manage. 144, 2018. doi: 10.1061/(ASCE)WR.1943-5452.0000969
Vickers, P. (2011). “Sonification for process monitoring,” in The Sonification Handbook, eds. T. Hermann, A. Hunt, J. G. Neuhoff (Berlin, Germany: Logos Publishing House), 455–491.
Vickers, P., and Barrass, S. (2011). “Sonification design and aesthetics,” in The Sonification Handbook, eds. T. Hermann, A. Hunt, J. G. Neuhoff (Berlin: Logos Publishing House), 145–171.
Vickers, P., Laing, C., Debashi, M., and Fairfax, T. (2014). “Sonification Aesthetics and Listening for Network Situational Awareness,” in SoniHED — Conference on Sonification of Health and Environmental Data (New York: University of York).
Vickers, P., Laing, C., and Fairfax, T. (2017). Sonification of a networks self-organized criticality for real-time situational awareness. Displays 47, 12–24, doi: 10.1016/j.displa.2016.05.002
Walker, B., and Kramer, G. (1996). Mappings and metaphors in auditory displays: an experimental assessment. ACM Trans. Appl. Perc. 2, 407–412. doi: 10.1145/1101530.1101534
Wirfs-Brock, J., Fam, A., Devendorf, L., and Keegan, B. (2021). Examining narrative sonification: using first-person retrospection methods to translate radio production to interaction design. ACM Trans. Comput.-Hum. Interact. 28, 6. doi: 10.1145/3461762
Worrall, D. (2010). “Using sound to identify correlations in market data,” in Auditory Display: The Proceedings of the 6th International Symposium, CMMR/ICAD 2009, Copenhagen, Denmark. Lecture Notes in Computer Science Book Series (Heidelberg: Springer), 202–218 doi: 10.1007/978-3-642-12439-6_11
Keywords: data sonification, sound design, design methods, anomaly detection, cyber-security, real-time monitoring, smart networks
Citation: Lenzi S, Terenghi G, Meacci D, Moreno Fernandez-de-Leceta A and Ciuccarelli P (2024) The design of Datascapes: toward a design framework for sonification for anomaly detection in AI-supported networked environments. Front. Comput. Sci. 5:1254678. doi: 10.3389/fcomp.2023.1254678
Received: 07 July 2023; Accepted: 19 December 2023;
Published: 11 January 2024.
Edited by:
Kostas Karpouzis, Panteion University, GreeceReviewed by:
Bart Hengeveld, Eindhoven University of Technology, NetherlandsCopyright © 2024 Lenzi, Terenghi, Meacci, Moreno Fernandez-de-Leceta and Ciuccarelli. This is an open-access article distributed under the terms of the Creative Commons Attribution License (CC BY). The use, distribution or reproduction in other forums is permitted, provided the original author(s) and the copyright owner(s) are credited and that the original publication in this journal is cited, in accordance with accepted academic practice. No use, distribution or reproduction is permitted which does not comply with these terms.
*Correspondence: Sara Lenzi, c2FyYS5sZW56aUBkZXVzdG8uZXM=
Disclaimer: All claims expressed in this article are solely those of the authors and do not necessarily represent those of their affiliated organizations, or those of the publisher, the editors and the reviewers. Any product that may be evaluated in this article or claim that may be made by its manufacturer is not guaranteed or endorsed by the publisher.
Research integrity at Frontiers
Learn more about the work of our research integrity team to safeguard the quality of each article we publish.