- Telfer School of Management, University of Ottawa, Ottawa, ON, Canada
Digital media has facilitated information spread and simultaneously opened a gateway for the distribution of disinformation. Websites and browser extensions have been put forth to mitigate its harm; however, there is a lack of research exploring their efficacy and user experiences. To address this gap, we conducted a usability evaluation of two websites and three browser extensions. Using a mixed methods approach, data from a heuristic evaluation and a moderated, task-based usability evaluation are analyzed in triangulation with data collected using summative evaluations. Challenges are identified to stem from users’ inability to understand results due to the presentation of information, unclear terminology, or lack of explanations. As a solution, we recommend four design principles: First is to establish credibility, second is to improve the general visual layout and design of the tools, third is to improve search capabilities, and finally, heavy importance should be given to the depth and presentation of information.
1. Introduction
The spread of false information is not a new phenomenon. Originally spread via word of mouth and newsprint, falsified claims have a history of infiltrating public discourse (Posetti and Matthews, 2018; Hamilton, 2021), with the purpose for its distribution influenced by varying sociological and psychological factors (Islam et al., 2020; Levak, 2021). Historically, division was sown by corrupt politicians to gain power, targeting marginalized communities, fear-mongering, and fueling mistrust for the benefit of the elite. Similar purposes remain, however, with the dawn of the internet and social media, disinformation is distributed on a global scale (Guille, 2013) to benefit a few financially or politically while wreaking havoc on many (Glenski et al., 2018; Levak, 2021). It is particularly of risk to security and public health (Gradoń et al., 2021; Mehta et al., 2021).
While the use of technology, algorithms, natural platform amplification, tracking, and targeting are used by big tech (Spohr, 2017; Grimme et al., 2020) unmaliciously to promote customer engagement and commercialization of many aspects of the internet, it has also been used to incentivize the draw of users’ attention through lies and sensational headlines. Put simply, better user engagement equals higher financial gain for authors and publishers. The commercialization of the news media industry has had especially devastating impacts due to the subsequent loss of credibility and trust in well-known publications. Biased headlines, erroneous information, and unverifiable information spread by major news outlets have resulted in a decreased reliability of news outlets for many citizens (Plasser, 2005). Simultaneously, technologies are used to intentionally deceive the public through deepfakes (Vizoso et al., 2021) and the spread of other forms of disinformation (Himelein-Wachowiak et al., 2021; Innes et al., 2021; Rodríguez-Virgili et al., 2021). With the recent release of ChatGPT, new concerns have been raised about the use of generative artificial intelligence and large language models to create false content that cannot be detected by average users (Goldstein et al., 2023).
Reflecting the numerous forms and intentions behind the creation and spread of false information, multiple terms are utilized in society (Froehlich, 2017; Flores-Saviaga and Savage, 2019; Pierre, 2020). One type is misinformation, where false information is spread without the intent to harm, usually because of carelessness or cognitive biases (Wardle and Derakhshan, 2017; Kumar and Shah, 2018; Mayorga et al., 2020; Meel and Vishwakarma, 2020). Forms of misinformation can include but are not limited to pseudoscience or satire. Alternatively, disinformation refers to knowingly false or incorrect information that is spread with deliberate intent to harm or deceive (Fallis, 2015; Wardle and Derakhshan, 2017; Kumar and Shah, 2018; Mayorga et al., 2020; Meel and Vishwakarma, 2020; Kapantai et al., 2021). Examples include false news, conspiracy theories, propaganda, clickbait, and deepfake videos of politicians and celebrities edited to appear as though they are making statements that they have not made (Innes et al., 2021; Vizoso et al., 2021). While less commonly known, malinformation defines the use of genuine or true information deliberately manipulated or taken out of context with the intent to deceive and cause harm (Wardle and Derakhshan, 2017; Mayorga et al., 2020; Hinsley and Holton, 2021). Such cases represent forms of harassment, leaks, and hate speech (Wardle and Derakhshan, 2017). To emphasize the high level of information distortion and significant challenges with establishing the veracity of information, many researchers refer to the current issues related to misinformation, disinformation, and malinformation as information disorders (Wardle and Derakhshan, 2017; Gaeta et al., 2023). For purposes of this article, we adopt the term disinformation in a similar broad context of information disorder, irrespective of the information creator’s intent.
To identify and counter the spread of digital disinformation, tools have been developed by private sector companies, non-profit organizations, and civil society organizations. These tools range from websites powered by human fact-checkers to verify the accuracy of information, to bot and spam detection tools that can identify automated bot activity on social media, to automated artificial intelligence applications that can detect and label disinformation (Pomputius, 2019: RAND Corporation, n.d.). These tools help information consumers navigate today’s challenging information environment by separating reliable information sources from false or misleading information to help consumers evaluate information and make more informed decisions (Goldstein et al., 2023). While the advent of disinformation-countering tools shows promise (Morris et al., 2020; Lee, 2022), there is a dearth of academic and industry research on the efficacy of these tools, both in terms of their functionality and usability. As such, several calls have been made for their assessment from both academic and practitioner communities (Wardle and Derakhshan, 2017; Kanozia, 2019; RAND Corporation, 2020).
To explore the efficacy of disinformation-countering tools, we refer to the field of user experience (UX), which, simply put, focuses on how something works and what contributes to its success (Garrett, 2010). More specifically, the field of UX assesses users’ behaviors and sentiments while using a product or service (Hassenzahl and Tractinsky, 2006; Law et al., 2009) and includes all emotions, beliefs, physical and psychological responses, behaviors, and performances experienced before, during, and after using a product or service (Technical Committee ISO/TC 159, 2019). The aspects considered are “…influenced by the system structure, the user and context of use” (Technical Committee ISO/TC 159, 2019, 43). Among the techniques for UX assessment, usability evaluations are used to assess the “holistic experience” (Rosenzweig, 2015, 7) of the user and to identify any areas of weakness. To assess usability, the effectiveness, efficiency, and extent to which a user is satisfied should be assessed (Technical Committee ISO/TC 159, 2019).
To address the lack of research on disinformation-countering tools, we select several tools and carry out an exploratory usability evaluation to assess their efficacy in addressing digital disinformation. Specifically, the objectives of our usability evaluation are to:
• Identify common user experience challenges faced by different types of users while utilizing online disinformation-countering tools.
• Formulate recommendations for an optimized creation of disinformation-countering tools for users with varying levels of technological competence to improve their resilience to disinformation.
2. Materials and methods
For our exploratory usability evaluation, as per recommendations for using multiple methods of data collection in usability evaluations (Gray and Salzman, 1998; Hartson et al., 2003; Lazar et al., 2017), and particularly as an exploratory study, it was intended that each of the methods utilized will contribute toward a thorough discovery of users’ experiences and any usability problems. Moreover, using a mixed methods approach “…can provide rich data that can identify the big picture issues, patterns, and more detailed findings for specific issues” (Rosenzweig, 2015, 145). A further benefit of data collection utilizing multiple methods is that when analyzed in triangulation, the reliability of findings is enhanced (Lazar et al., 2017).
To elaborate on each of the methods adopted, the following sub-sections separately discuss each method of data collection and analysis.
2.1. Heuristic evaluations
Carried out by experts, heuristic evaluations assess components of a product or service, comparing it against best practices to produce a rating and recommendations, if necessary (Rosenzweig, 2015). While not an in-depth form of evaluation, usability heuristics provide a quick assessment of an interface. To conduct the heuristic evaluations, the recommended approach when using it alongside other methods of data collection is to conduct it early in the research process (Jeffries and Desurvire, 1992). Thus, as a first step, research team members (n = 4) individually assessed each tool using established heuristics (Nielsen, 1994; Law and Hvannberg, 2004). In cases of disagreement in assessment, tools are revisited to reach a mutually agreed upon severity rating. Further cases of disagreement result in the mean severity rating being taken as the final rating. With guidelines recommending three to four evaluators to increase the reliability of the mean severity rating (Nielsen, 1994), our use of four evaluators meets these criteria.
2.2. User testing
To facilitate the testing of software tools through potential scenarios that are typically encountered by end users, black-box software testing methods (Nidhra, 2012) using a task-based approach are used to assess how a user would interact with digital disinformation-countering tools using a real-life situation (Rosenzweig, 2015). This approach assists in the assessment of the overall efficacy of disinformation-countering tools to meet the contextual, technical, and cognitive needs of individuals using them as part of their daily information consumption activities. Remote-moderated testing using a think-aloud protocol was selected as it provides for direct observation of user experiences, note-taking, asking clarifying questions, and assisting if an explanation is needed (Rosenzweig, 2015; Riihiaho, 2017; Lewis and Sauro, 2021). We use the platform Loop11 to facilitate the sessions as it prompts scenarios and tasks while recording participants’ screens and audio.
Before conducting the usability evaluation with the main participants, moderators (n = 2) created an evaluation script for use during evaluations. A pilot study with four participants identified deficiencies in scenarios and questions. Modifications were made according to feedback.
2.3. Summative evaluation
2.3.1. SUS questionnaire
System Usability Scale (SUS) is a questionnaire using a Likert scale rating to provide an overall assessment of the usability of a product or service (Brooke, 1996). The benefit of using the SUS is that while it provides a quick method of evaluating users’ opinions across 10 questions, the questions form a comprehensive assessment of various areas that contribute toward the effectiveness and efficiency in carrying out its intended use. Questions also address users’ overall satisfaction experienced while using the tool, while limiting the frustrations of lengthy evaluations (Brooke, 1996). Moreover, the SUS is flexible, in that it can be used to assess a variety of applications, with high reliability and validity (Lewis, 2018).
To reduce the length of the evaluation and the cognitive burden of completing multiple tasks and questions, only five questions relevant to the tools and objectives of our study were included. Past research has indicated that the exclusion of questions does not affect the final score, as long as the adjustment is made during result calculations (Lewis, 2018).
2.3.2. Multiple choice questions
As a method to quickly gain participants’ opinions (Patten, 2016), multiple choice questionnaires are used after user testing (De Kock et al., 2009). While they have a limitation of only providing a brief overview of participants’ opinions (Patten, 2016), used alongside other data collected, it can help further explore their experiences.
Accordingly, upon completion of tool evaluation using the previously mentioned methods, several multiple choice questions are asked to identify which tool appears to be most up-to-date, the easiest to use, and most likely to use in the future.
2.4. Participants
While conducting research into the success of information systems, it is recommended to consider the technical abilities of the users (Weigel and Hazen, 2014). Thus, considering our intent to explore the usability of digital tools to represent users with varying technical proficiency, we establish three categories of technical capability, “beginner,” “intermediate,” or “advanced” information technology users. Selected participants self-identified according to the high-level definition provided.
To determine a representative number of participants, we refer to the opinion that 5–8 people can find most of the usability issues for qualitative evaluations (Nielsen and Landauer, 1993; Rosenzweig, 2015), whereas qualitative survey evaluations are recommended to have a minimum of 20 participants for a statistically representative sample (Rosenzweig, 2015). Thus, we aimed to have 15–20 participants. A call for participation was shared with peers and publicly posted on networking and social media platforms to solicit participants. Those interested were asked to complete an online form with their name, email, and level of technical competence.
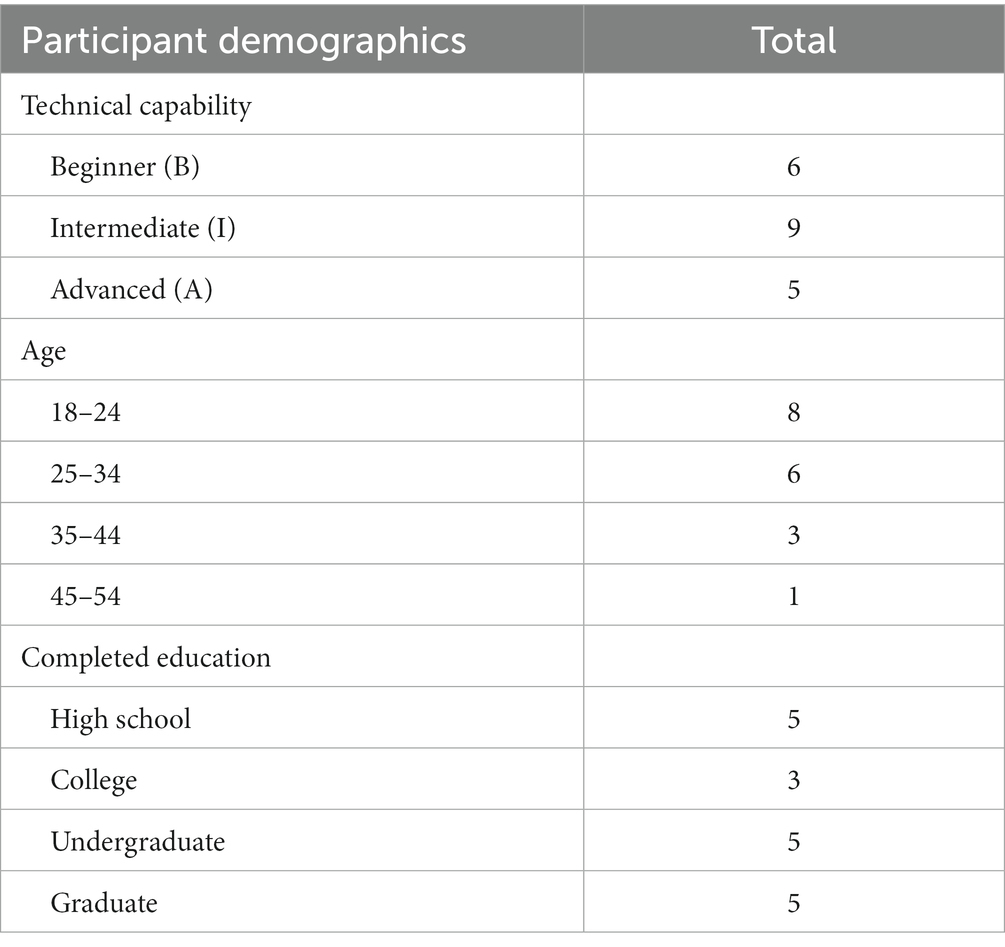
Using purposive sampling, we ensured that the minimum requirement for each persona was fulfilled (Tashakkori and Teddlie, 2003). Moreover, to seek heterogeneity in the final sample and maximize the generalizability of the results, participants of varying age and education levels were preferred (Lewis and Sauro, 2021). As compensation, a $40 participant-selected Amazon or Starbucks gift card was given to each participant. Eighteen participants took part in the usability evaluation, and their demographics are provided in Table 1.
2.5. Tasks and scenarios
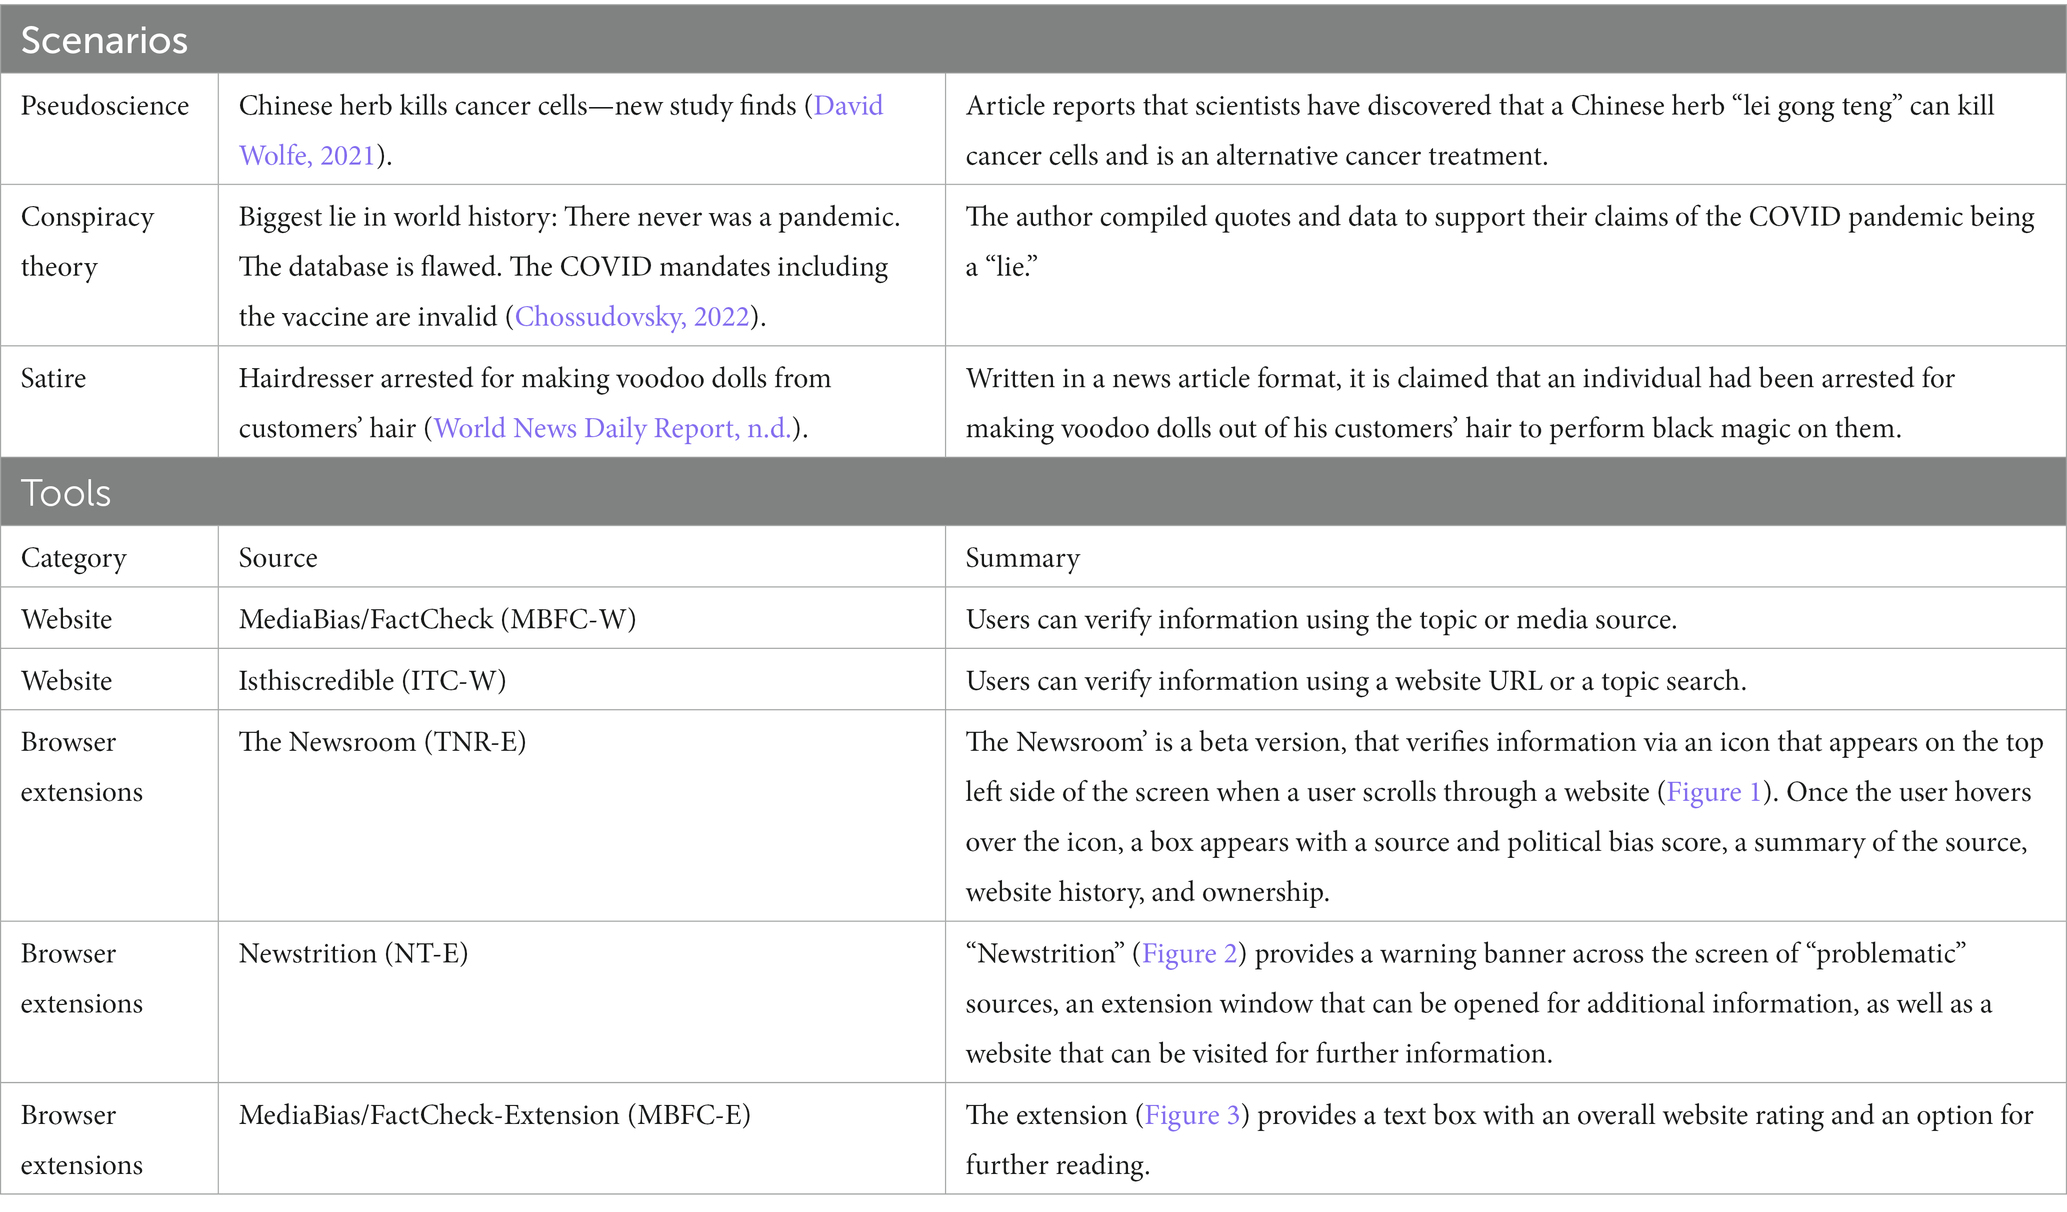
To represent real-life situations, scenario-based tasks were used to uncover potential issues experienced while information credibility checking. As summarized in Table 2, three articles were used for fact-checking and were selected based on the diverse forms of disinformation that individuals could be subjected to in their daily lives, either through social media posts or received from friends or family. As news with sensational headlines is most likely to be accessed and shared (Burkhardt, 2017), articles with such headlines were selected. They include Chinese Herb Kills Cancer Cells (pseudoscience), Biggest Lie in World History: There Never Was A Pandemic (conspiracy theory), and Hairdresser Arrested for Making Voodoo Dolls from Customers’ Hair (satire).
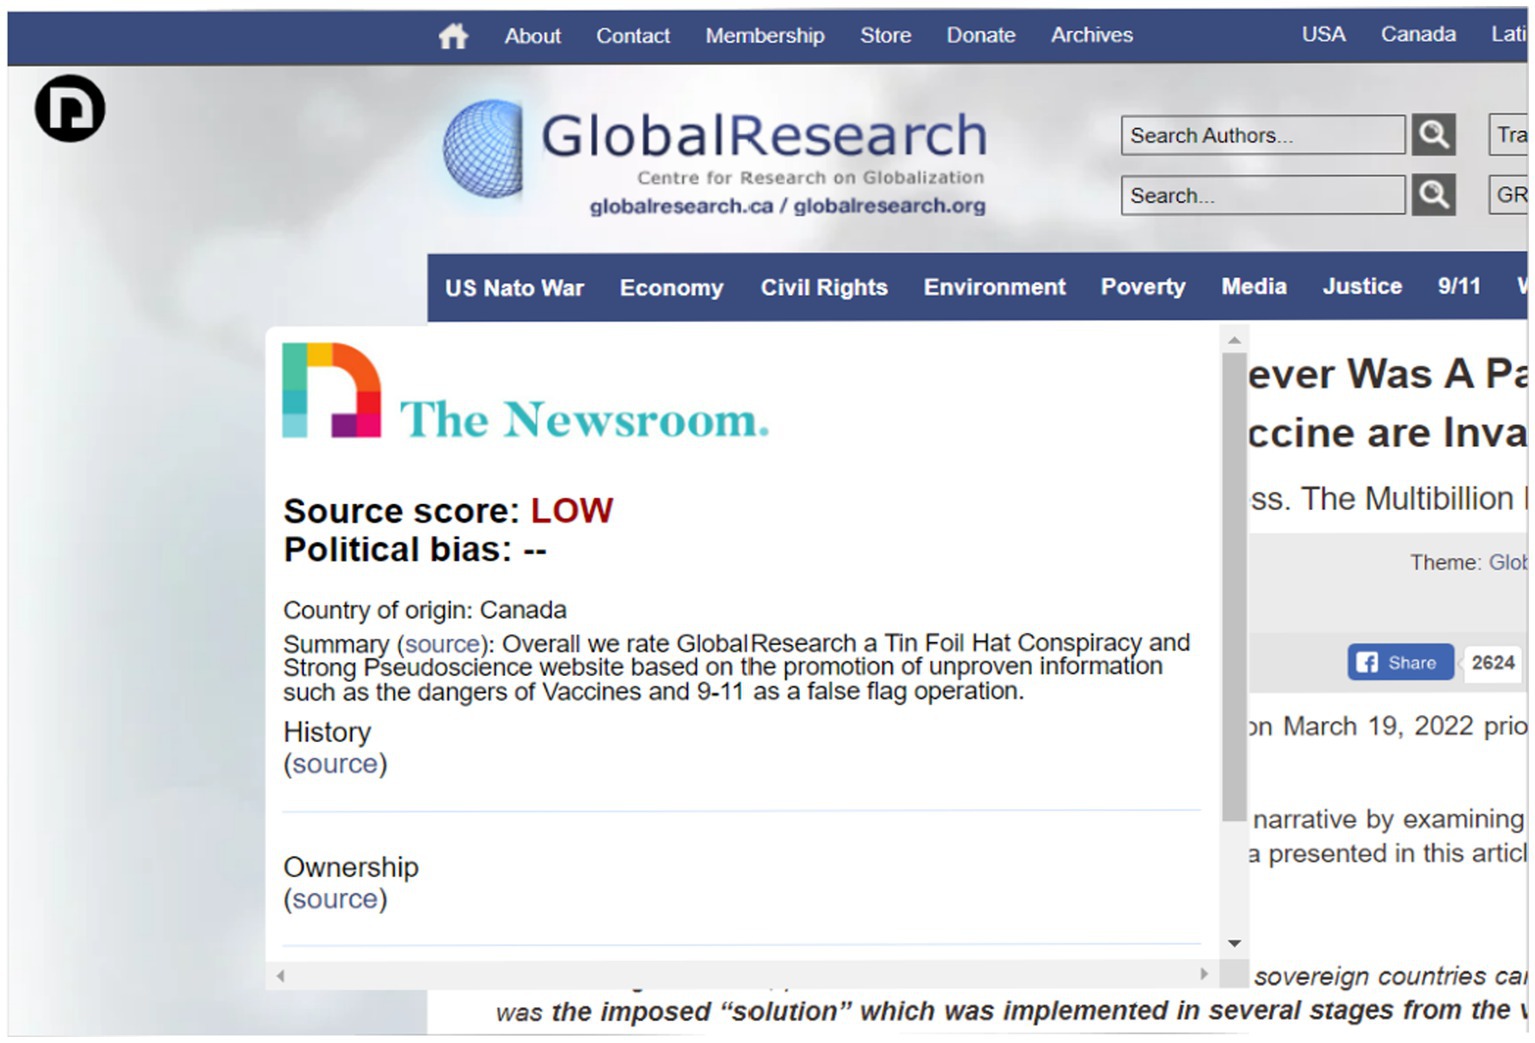
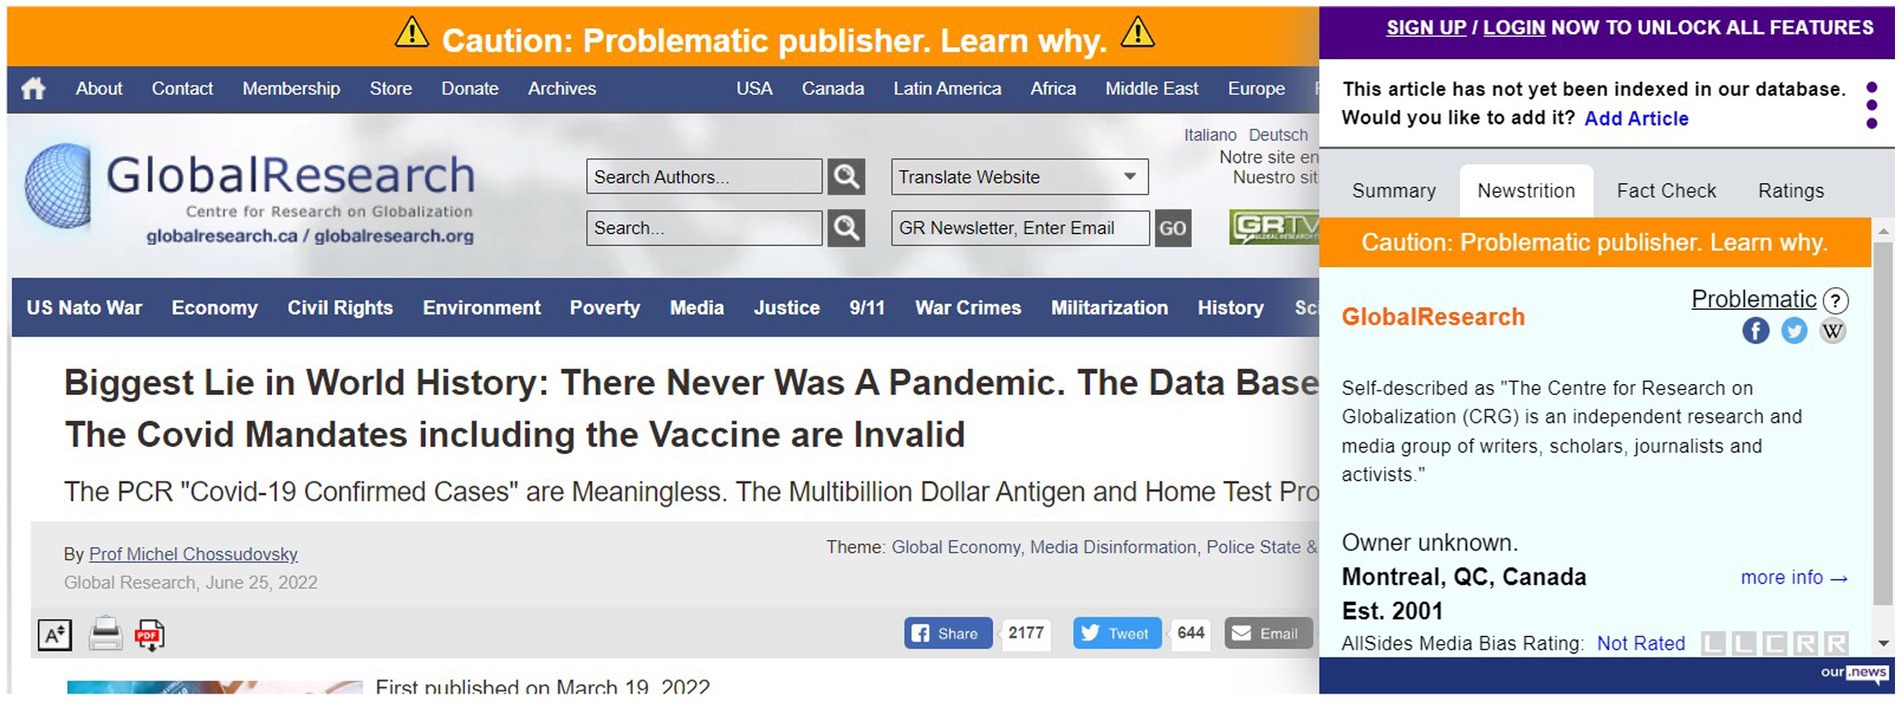
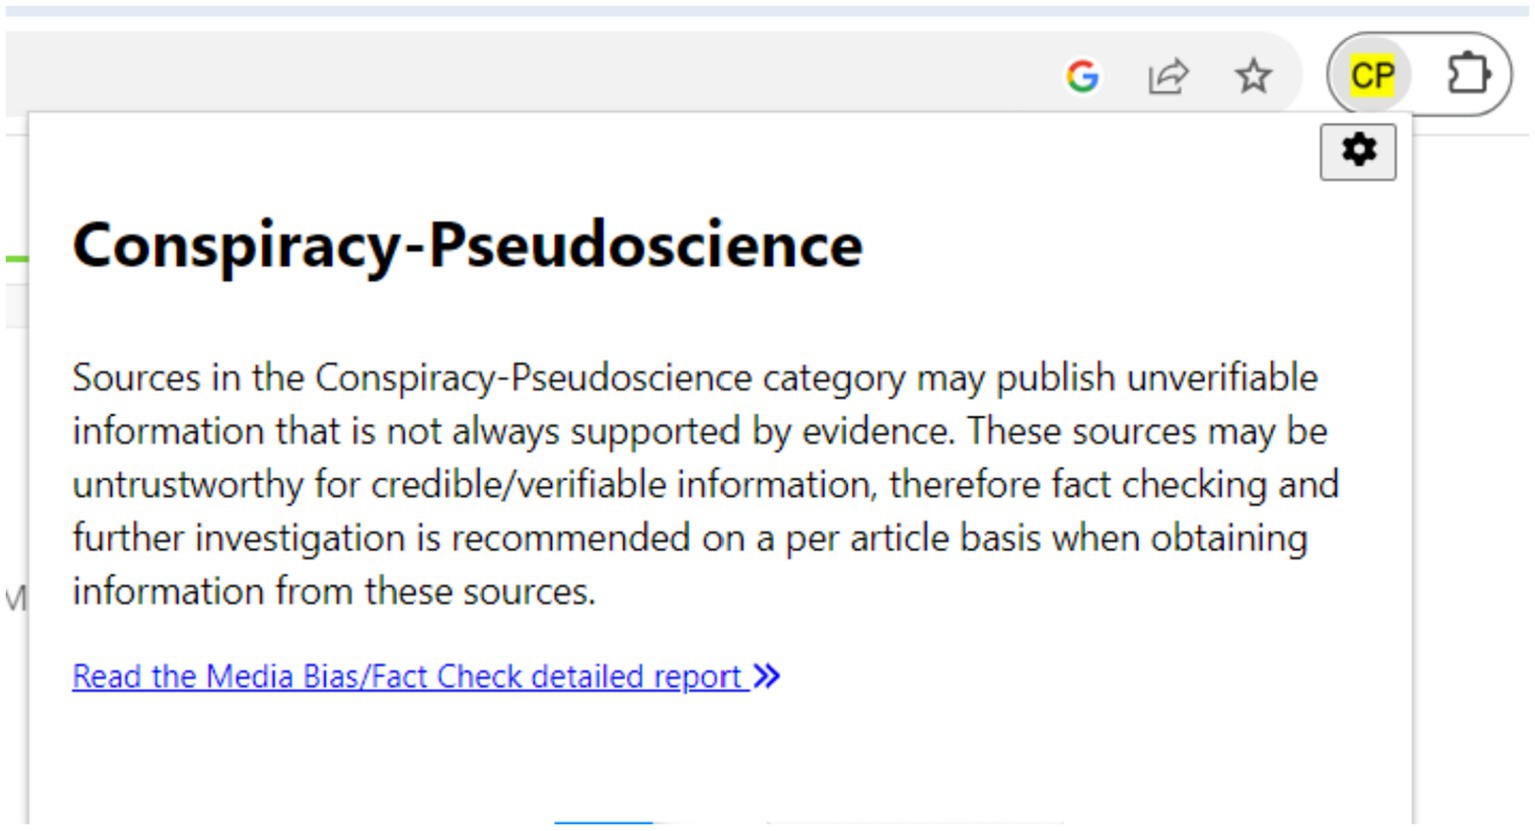
We chose to use browser extensions and stand-alone websites to investigate different modalities of use for countering disinformation, as well as to ascertain user preferences and the functional efficacy of each style of tool. Based on our initial testing, three browser extensions and two websites were selected (Table 2; Figures 1–3).
2.6. Protocol
Participants first met via Zoom to receive information on the study and tasks to be completed. Once agreed, participants electronically signed the consent form and returned it to the moderator via email. Upon receipt, the evaluation was carried out in Loop11.
Participants began by answering several demographic questions (5 min), followed by the tasks (30–45 min). To validate claims made within the identified articles, participants first visited selected websites, followed by the browser extensions. As the browser extensions require additional steps for installation, participants were instructed to install the extension and had an opportunity to review any developer-provided information guides. Participants then opened identified articles to assess how the extension interacts with the website and/or authenticates information.
Upon completion of tasks for each tool, summative questions were asked to collect participants’ final opinions, which included the shortened SUS (5 min) and multiple choice questions (5 min). Debriefings were held via Zoom to thank participants and answer final questions.
To analyze the task-based usability evaluation data, thematic content analysis was used to identify ideas, patterns, or trends (Krippendorff, 2012, 2018). Extracted data were then quantified for quasi-statistical consideration to demonstrate the frequency of occurrence (Becker, 1970). Results of the quantitative questions collected in Loop11 are to be exported to Excel for analysis. SUS questionnaire results are to be analyzed using a programmed spreadsheet (Excel Spreadsheet for Calculating SUS Scores, 2008) and then represented using adjective-based scoring to facilitate understanding (Bangor et al., 2008).
3. Results
As our first research objective is to identify common challenges faced by users of varying technical proficiency, in this section, we will present the results and findings from our methods of evaluation.
3.1. Heuristic evaluation
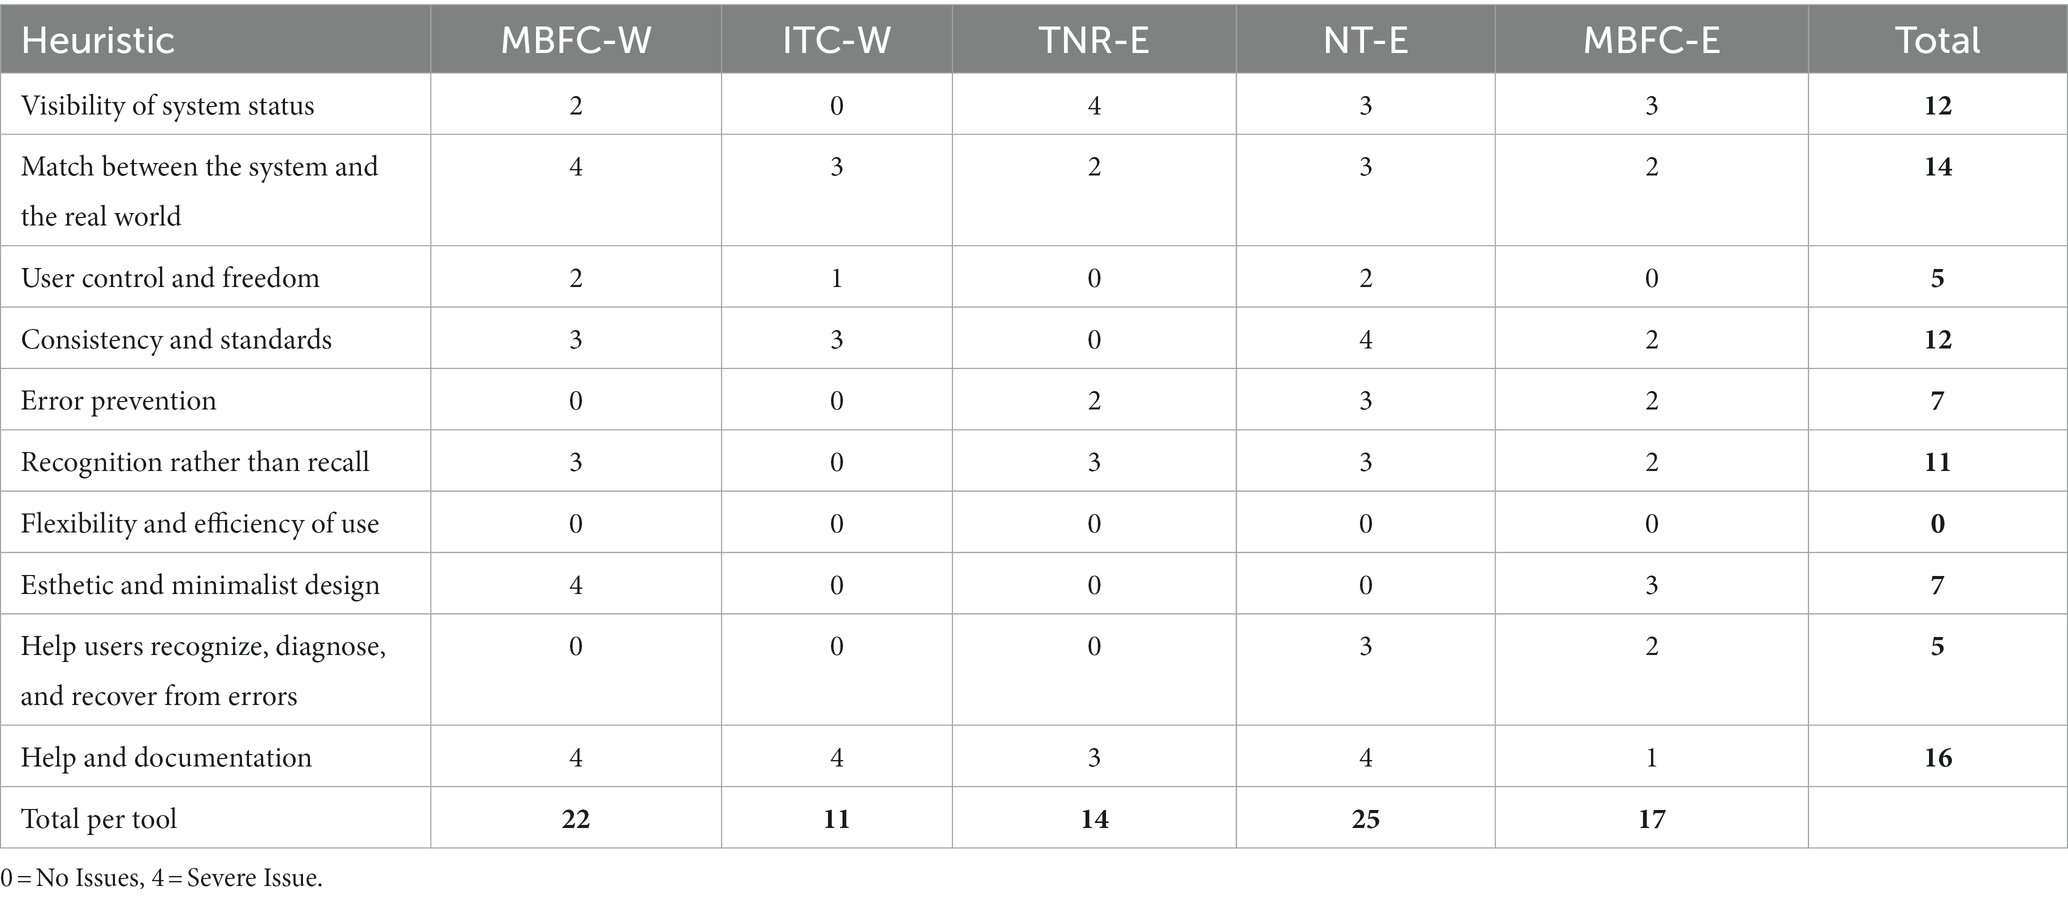
As highlighted in Table 3, a numeric score ranging from zero, where no issues were found, to four, which represents a severe issue, was assigned for each heuristic. Considering the severity of ratings, the poorest performing heuristic is the lack of help and documentation, followed by a lack of match between the system and the real world. The third worst-rated heuristic is a tie between the visibility of system status and consistency and standards.
To elaborate on the lack of help, while some tools have some form of “faq,” “how it works,” or an overview of the extension, Table 3 shows that apart from MBFC-E, the tools have little support on how to use it. Considering the lack of match between the system and the real world, all tools had poorly represented information and had an insufficient explanation of what terms meant, leading to confusion. The visibility of system status was rated poorly across all but the ITC-W, due to either a lack of knowing how to open the extension or whether a search is being executed when queries are entered. Finally, except for TNR-E, the lack of consistency and standards was rated poorly again across tools due to their lack of consistency in the terms used and forms of interaction. While the tools should reduce user’s cognitive load by being designed in a way that users are familiar with, and are intuitive (Nielsen, 2020), most tools were not designed in a way that is easy to understand, particularly when receiving results.
Considering ITC-W has the lowest overall severity ratings, it may suggest that the website is a more user-friendly tool than the others, potentially indicating that it may provide a more appreciable experience and may be a better option for disinformation-countering. Nevertheless, with the severity rankings being high across several tools, this suggests serious deficiencies, which may hinder their use. Acknowledging the importance of these tools and the need for amplifying their use to circumvent the harms of disinformation, it is evident that improvements are required.
3.2. User testing
Given that a major aspect of user experience relates to users’ overall satisfaction and how efficiently tasks can be performed, we collected participants’ feedback and challenges experienced while attempting to verify claims made within the articles provided.
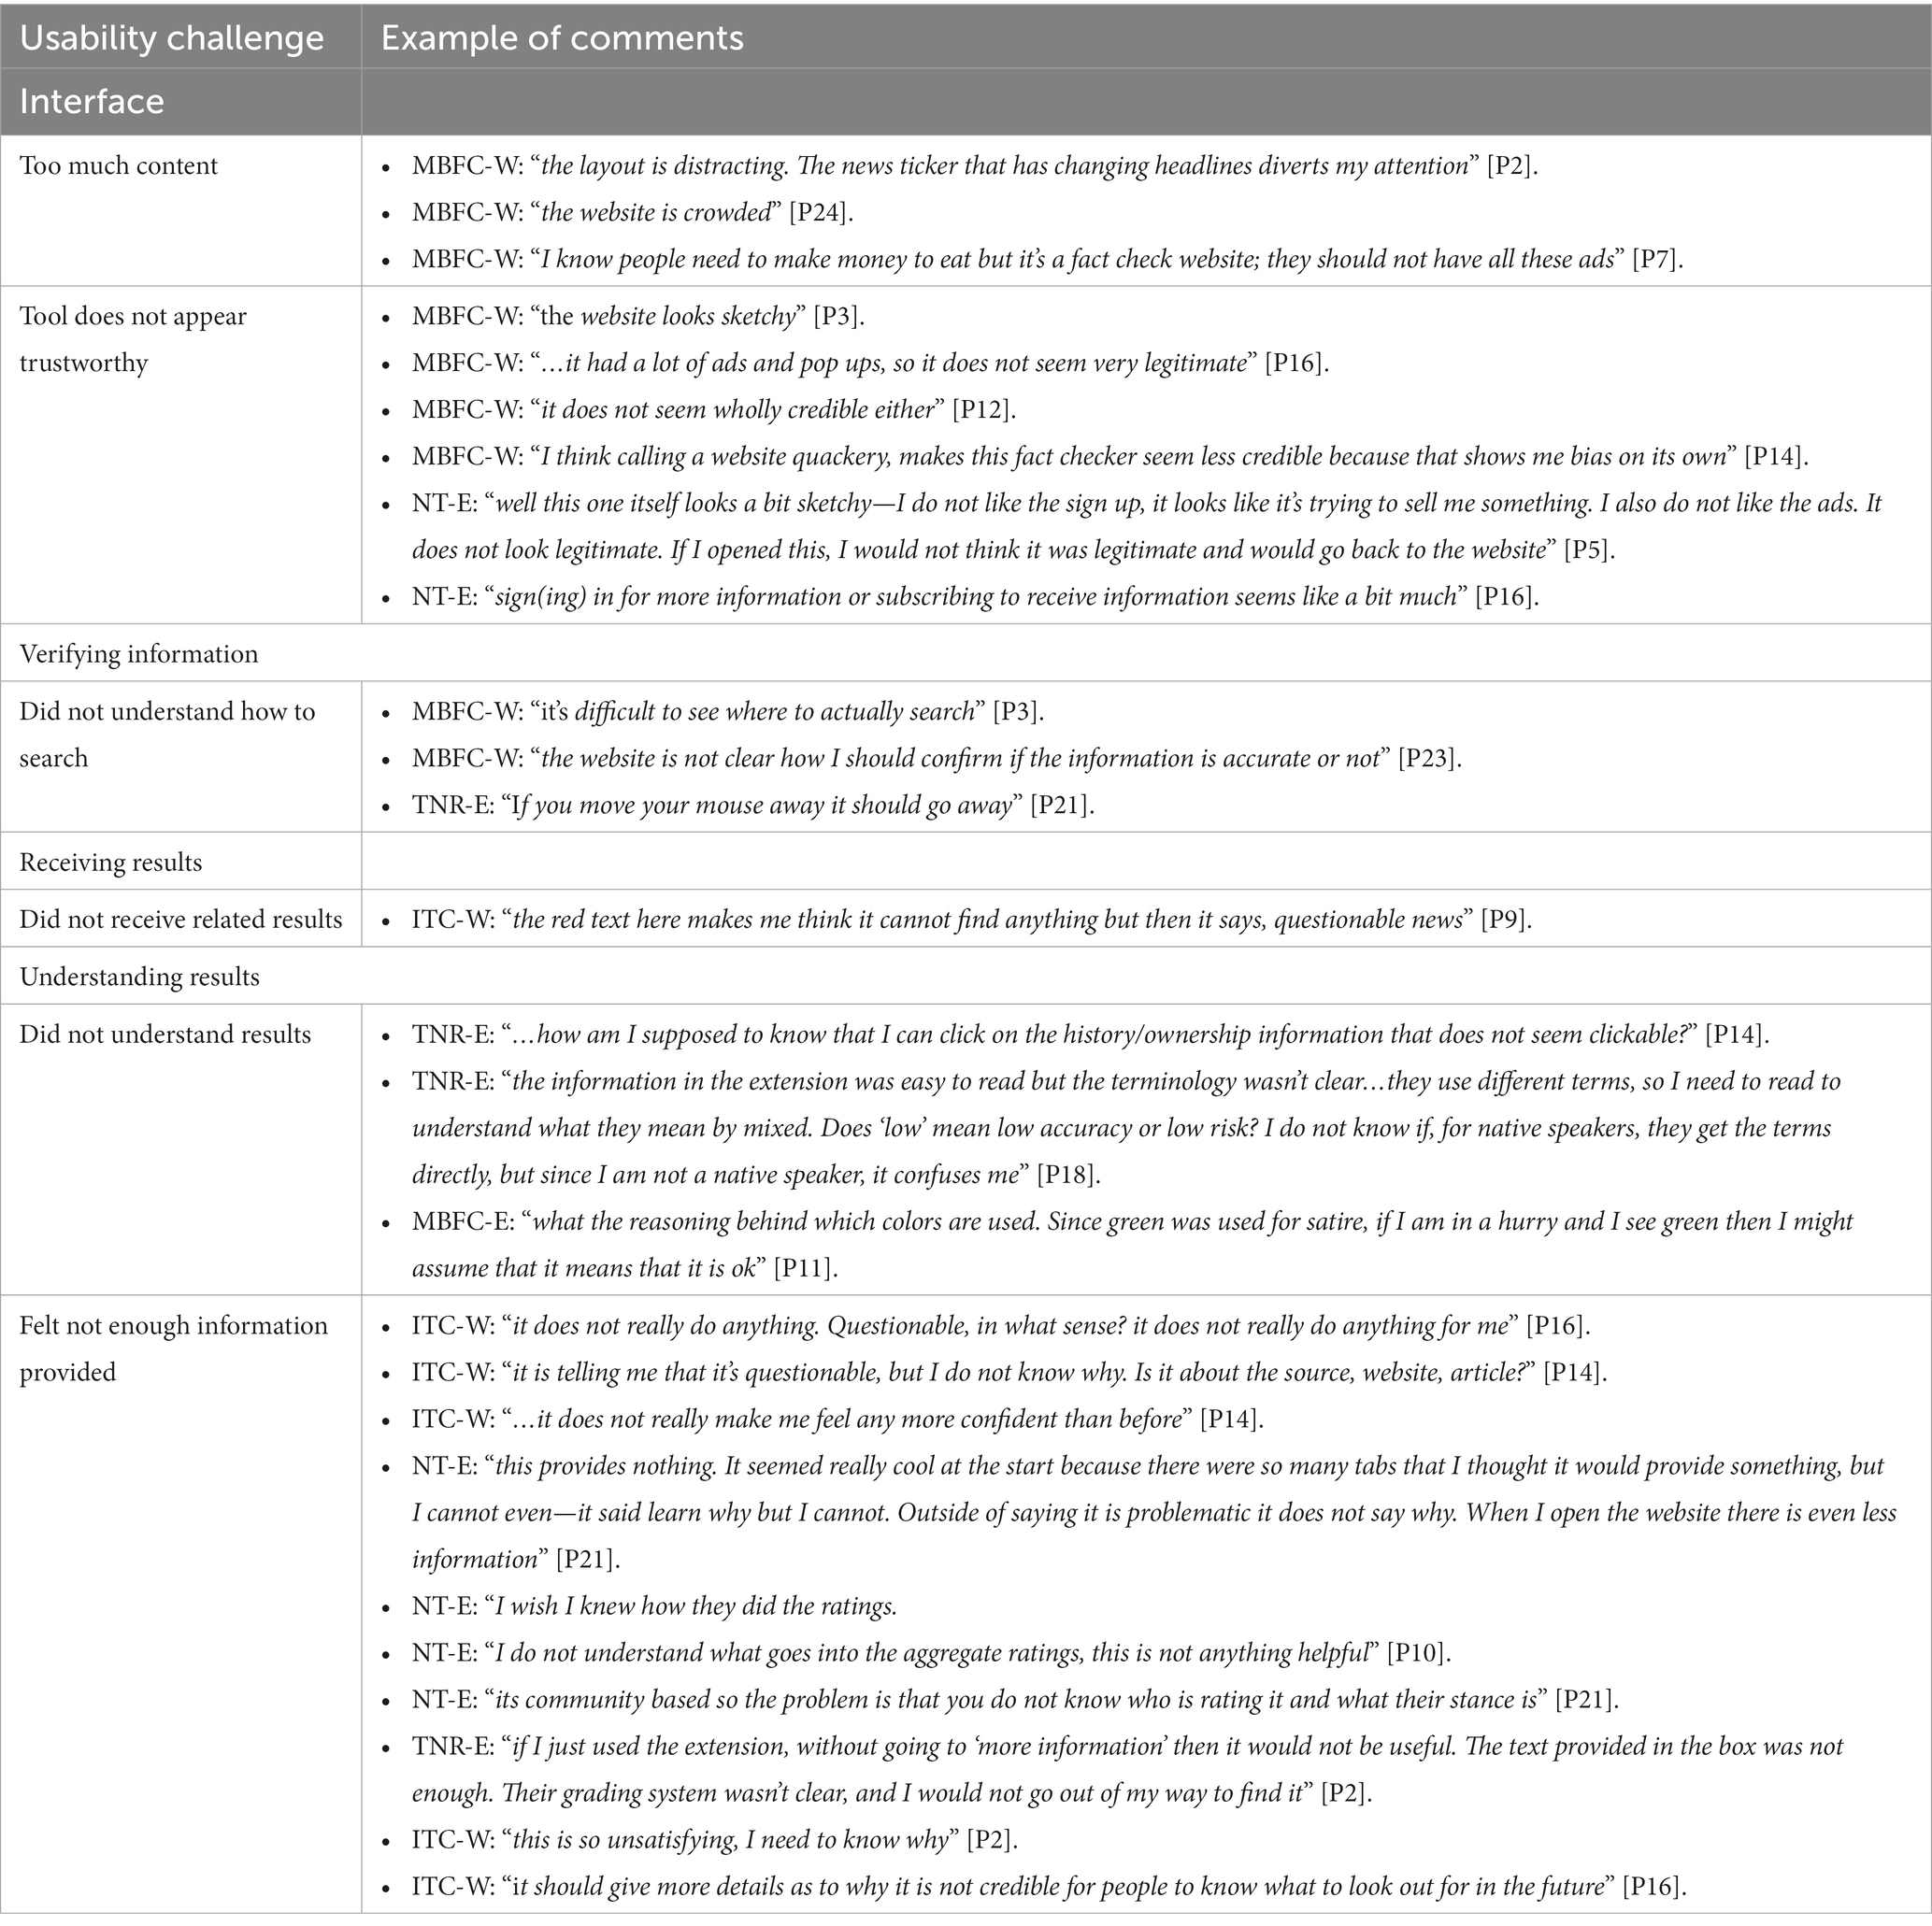
Upon analysis of the data collected, it became evident that the challenges experienced were concentrated across four main categories, including, issues related to the design of the interface, how to verify information, receiving results, and then understanding the results received. Each of these will be discussed, with a sample of participant commentary highlighted in Table 4.
3.2.1. User interface
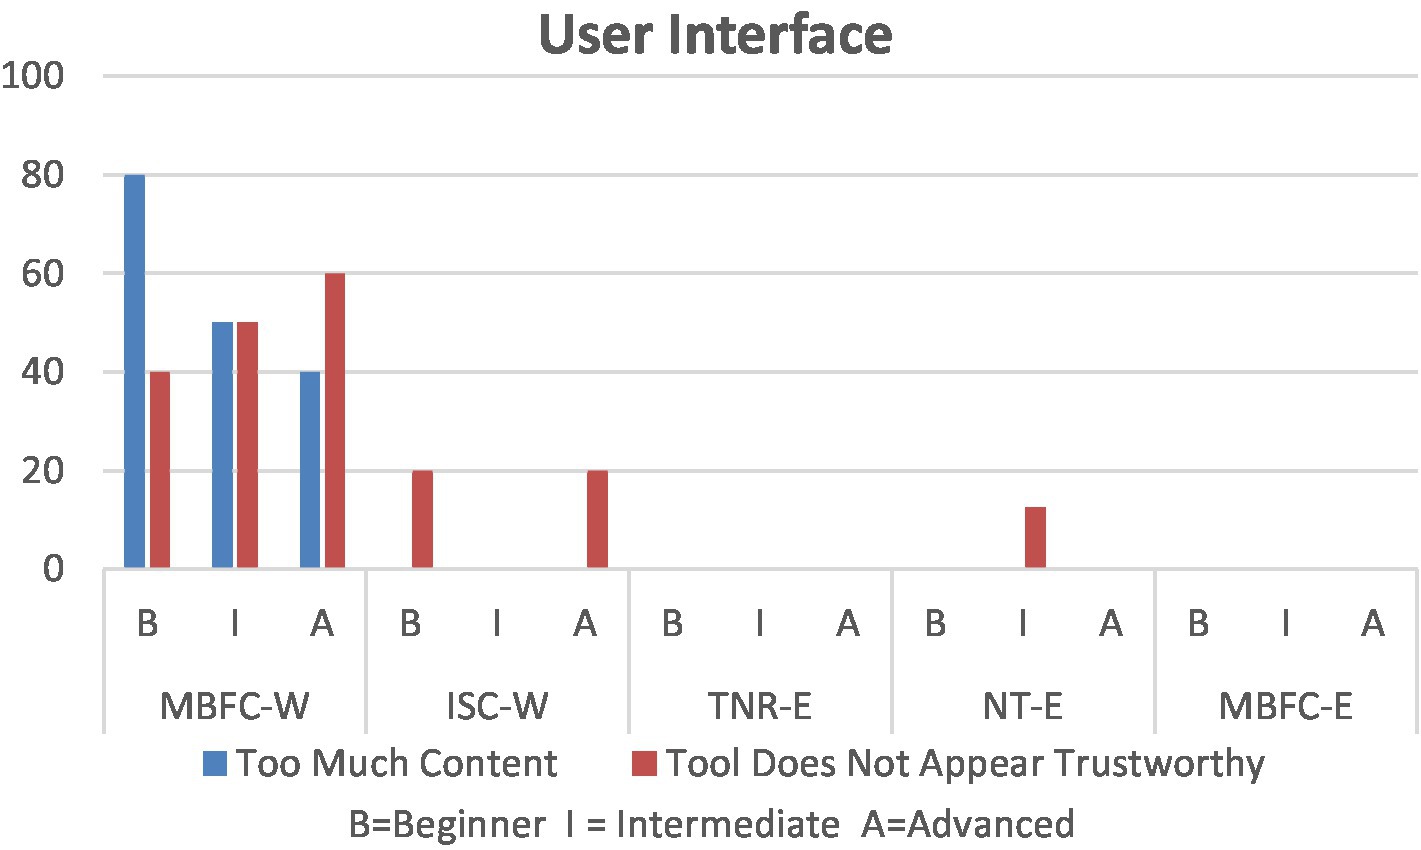
As the interface is the point of interaction between humans and a product, it plays a major role in successful interactions. At the outset, as demonstrated in Figure 4, participants expressed two main concerns related to the interface. Mostly relating to MBFC-W, the first complaint was due to overwhelming content, which, in turn, led participants to question its trustworthiness. The website has an extensive number of advertisements and cluttered text, resulting in difficult navigation.
Although it was not a direct usability concern, opinions on tool trustworthiness were documented as it became apparent that it influences the likelihood of tool adoption. As expressed in the sample of participant comments in Table 4, the general layout and extensive use of advertisements led participants to question the legitimacy of MBFC-W itself.
3.2.2. Verifying information
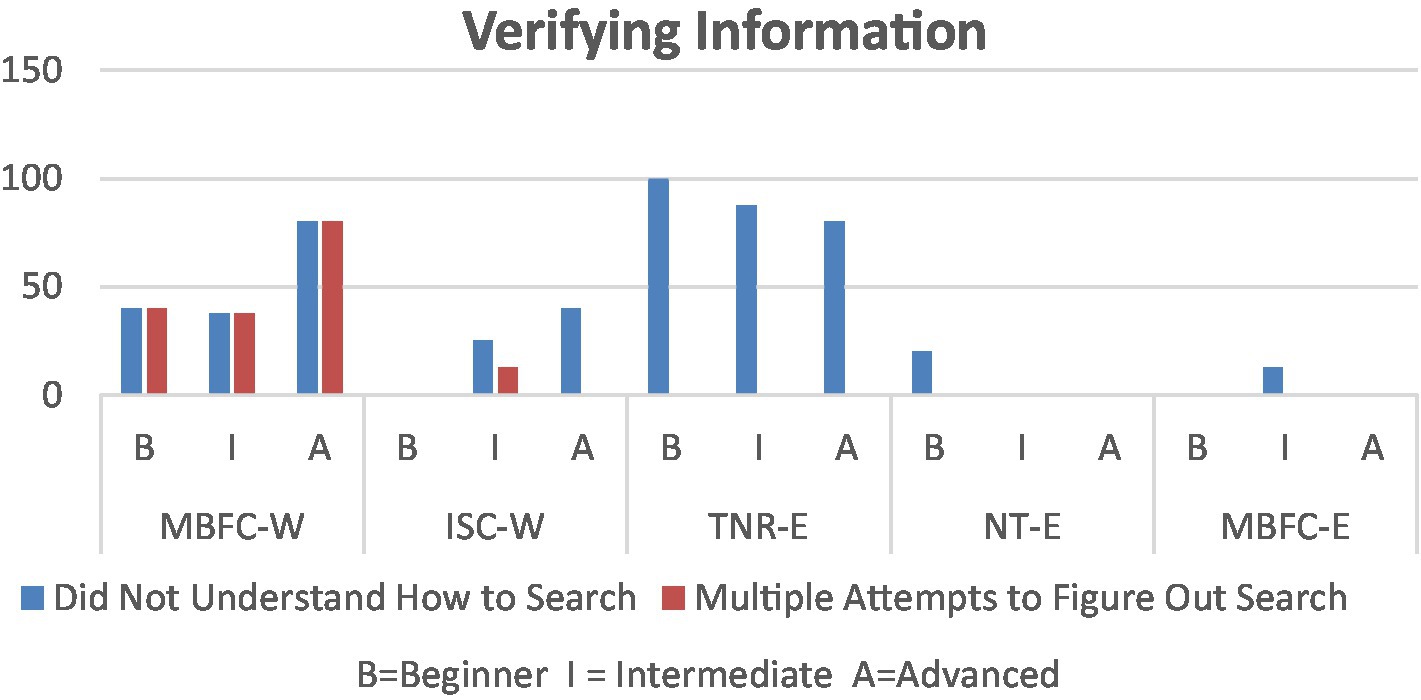
The search process presented further challenges, with participants unsure of how to formulate an operative search query. Despite instructions, MBFC-W URL searches did not provide results, nor did they appear to be able to fact-check. Rather, searches could only be performed using a source’s name, which was not clear to participants. Surprisingly, despite ITC-W’s minimalistic design, multiple participants did not notice the option to search using a URL. Those who did recognize that they must be performed in a specific manner that is not indicated on the website. One participant entered “www.globalresearch.ca” that returned “not able to analyze.”
As shown in Figure 5, MBFC-W particularly required multiple search attempts and forms of queries before participants could verify information. Overall, both MBFC-W and ITC-W appear to only accept specific queries to return relevant results, which increased errors and impacted participants’ ability to perform searches.
Opening the extensions then became a difficulty, with most complaints centering around TNR-E. Only after users scroll through a website does an icon appear, thus, how it works was not immediately clear. Once noticed, participants enjoyed the ease of use, however, once open, the icon’s window often did not close, which obstructed participants from being able to continue reading from the website.
3.2.3. Receiving results
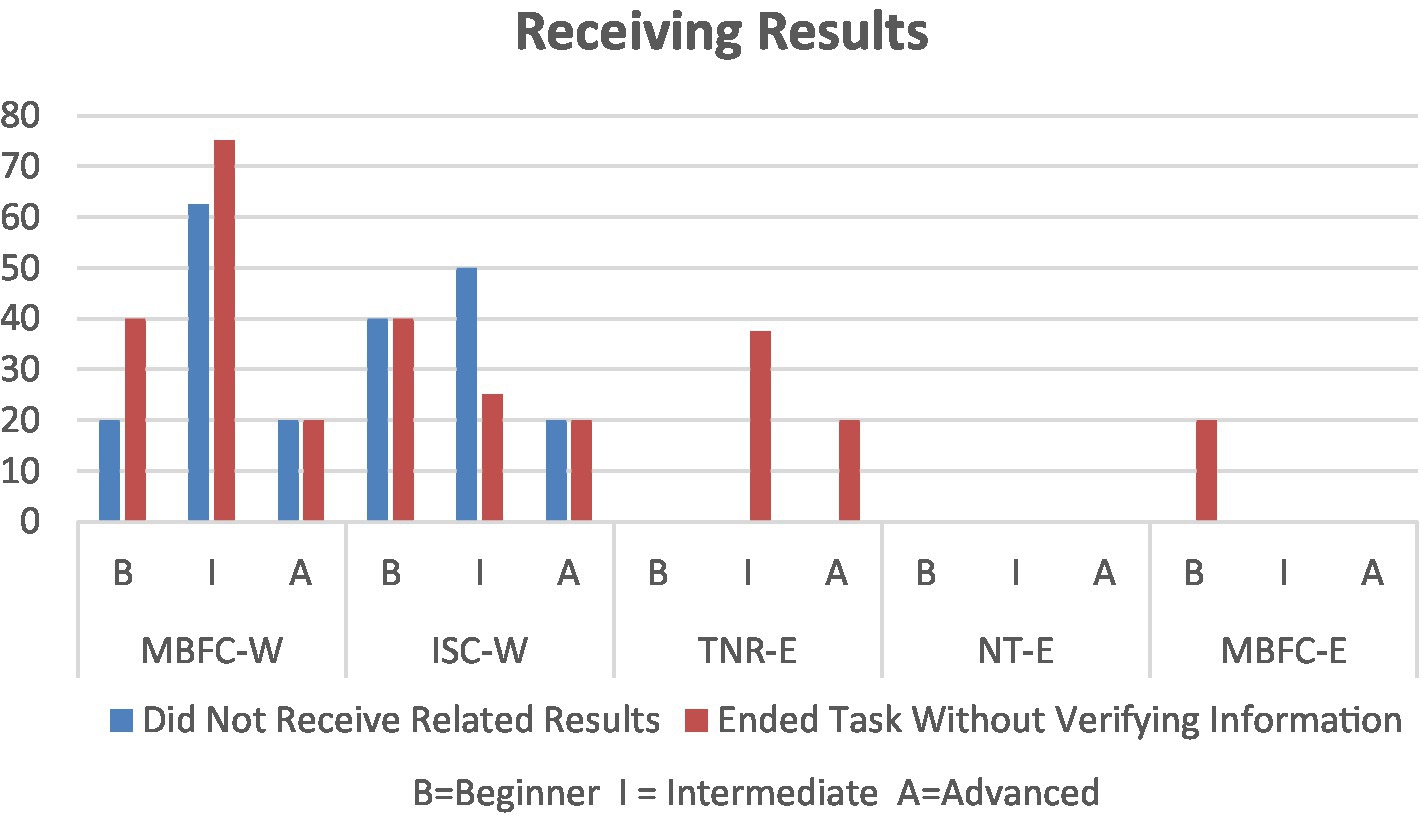
Likely stemming from confusion on how to perform a search, participants were more likely to not receive relevant results while using the websites (Figure 6). Although topic searches were promoted in MBFC-W, searches using “Chinese herb kills cancer” or “covid is a lie” returned somewhat related results, however, the connection between the topic searched and the results received was not always clear. Similarly, although ITC-W promotes topic searches, no participants received relevant results. In addition, impacting the ability to recognize results is ITC-W responding to successful searches via a red box that highlights the search bar and with “questionable news” written in small, red font. Given the format, several participants did not notice the feedback at all, with some thinking it was an error message.
In such situations, the beginner and intermediate participants often ended the task without being able to verify the scenario article’s claims. For the browser extensions, likely owing to the lack of need to formulate a search query, only a limited number of participants ended task(s) without verifying information. Such reasons included the inability to see or open the icons.
We note that the researchers’ independent verification of ITC-W using “mainstream” news provided better fact-checking with more elaborate reasoning, thereby suggesting that ITC-W could be more useful for mainstream news stories, rather than verifications of information originating from satire, pseudoscience, or conspiracy theories.
3.2.4. Understanding results
After overcoming the initial challenges and pertinent results were received, participants continued to encounter challenges.
3.2.4.1. Lack of understanding
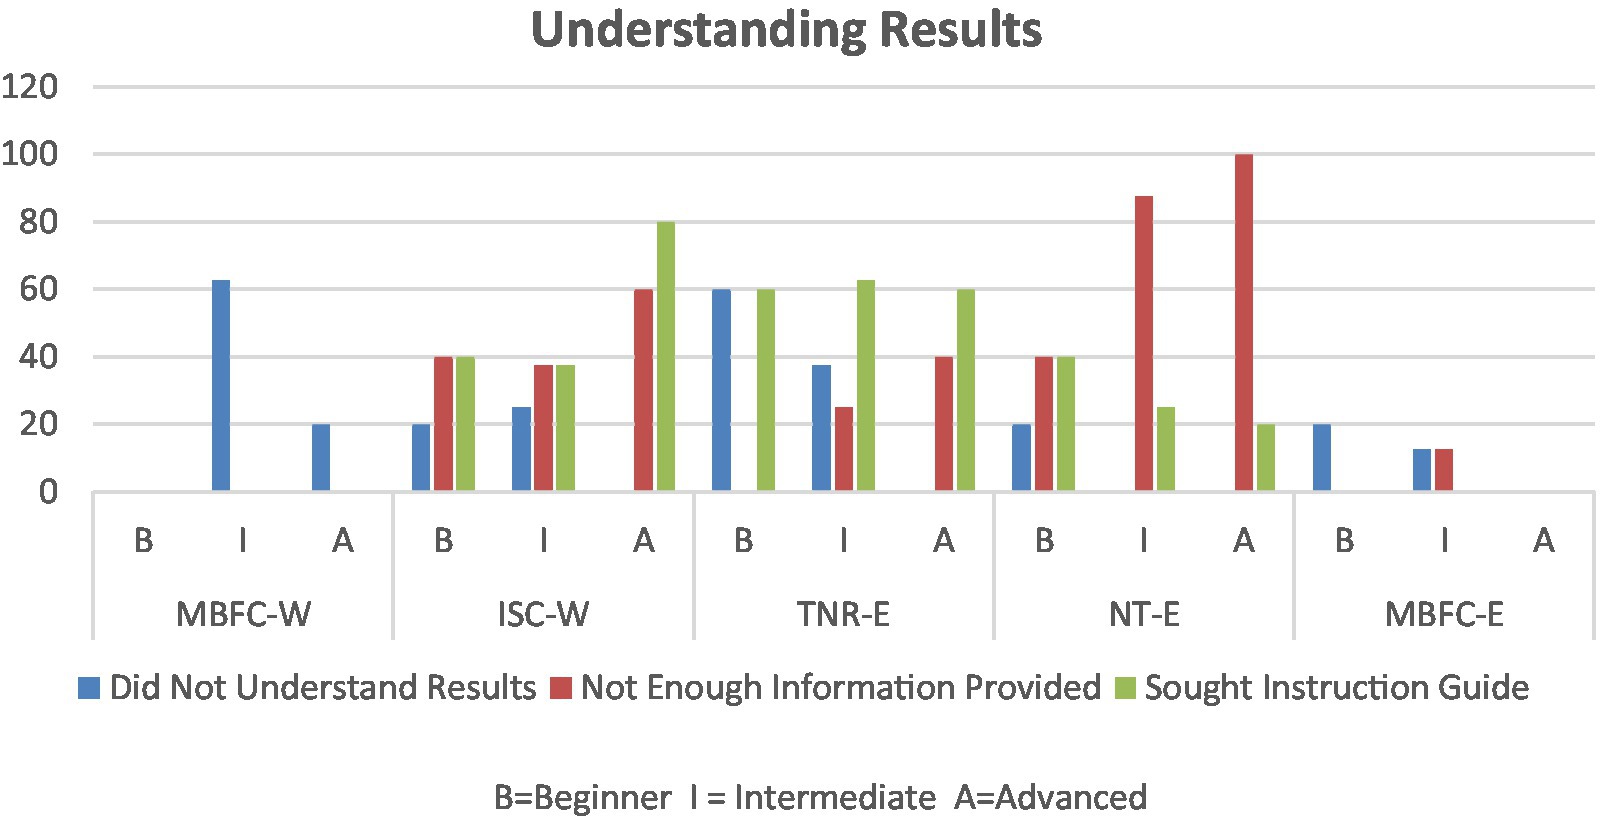
The first source of difficulty was understanding what the tool’s terminology signifies. ITC-W, the most confusing tool for intermediate users (Figure 7), merely returned “questionable news” in response to search queries, which left participants with more questions than answers. Within MBFC-W and TNR-E (which sources the ratings from MBFC-W), some participants were unsure of what “tin foil hat” and “quackery” meant, particularly non-native English speakers. It was noted that slightly less confusion was experienced using MBFC-W, which may be due to the visualized rating scale and additional content that helped participants understand the context. Initially, participants appeared to prefer TNR-E due to how information was visually presented; however, without the additional context to support an understanding of terminology, participants were left more confused.
As it is brief and to the point, MBFC-E was better received. Participants noted they could immediately see a rating if it was pinned to their browser; however, with green used for a “satire” rating, as indicated in the representative comments (Table 4), users may wrongly assume that green indicates that a website is good or trustworthy. In addition, the rating being a description of the article’s categorization is confusing. For example, articles deemed to be “satire” received a satire label and a short paragraph defining the term, without any reference to the article being verified.
Although MBFC-W, MBFC-E, and TNR-E provide more details if you click “read more,” not all saw the option, whereas others felt informed enough by initial results. Those who read the additional context, appreciated it more, such as the scenario websites’ owners and/or funders.
3.2.4.2. Not enough information provided
Further contributing to a lack of understanding was the absence of information to support verification outputs. Considering ITC-W and notes in the sample of comments (Table 4), participants were unsure of whether it was the scenario website that was questionable or if it was the article itself. Without additional context, participants did not understand what the rating meant. Despite most participants originally liking ITC-W, the lack of information was a deterrent to fully embracing it as an option for fact-checking.
Albeit Newstrition (NT-E) providing an initial rating via an orange banner spanning across the top of the website, a text box with additional information enabled by the extension and a website, the intermediate and advanced participants found the content provided to be lacking information (Figure 7). Only a small number of participants relied on the banner alone, with a large number opening the extension window in the hopes of obtaining additional insight. The extension itself presented multiple “tabs” under which it was expected that information would be found, however, both the extension and the website that was supposed to provide further information were lacking. While it appeared that more information could be received once registering an account, participants saw that as a barrier and did not wish to do so.
3.2.4.3. Sought instruction guide
Due to the lack of explanation, as seen in Figure 7, ITC-W and TNR-E had the highest levels of seeking an instruction guide. Particularly within ITC-W, participants sought an explanation for what terminology meant, whereas confusion over how to open the extension led participants to seek a manual in TNR-E. The reason for seeking additional information in NT-E was due to the ratings being calculated based on feedback from users, to which some were concerned with biases manipulating the ratings.
3.3. Summative evaluation
Once participants completed tasks, they were asked to provide SUS ratings and answer multiple choice questions. Thus, in addition to participants’ thoughts, opinions, and a count of the frequency of which an issue occurred, these scores provide a quantitative score for each tool assessed.
3.3.1. SUS score
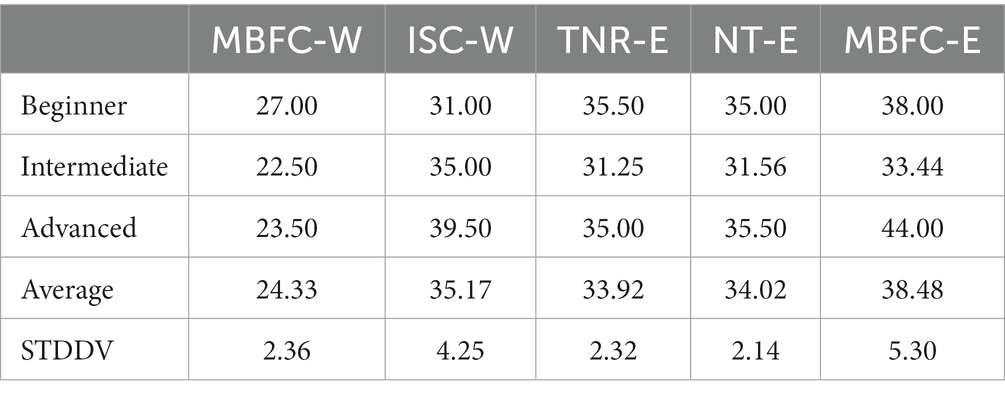
As demonstrated in Table 5, upon answering five SUS questions, the lowest score across all users is MBFC-W, while MBFC-E was rated the highest for both beginners and advanced users. Intermediate participants rated ITC-W as the highest, which is interesting considering the complaints of their peers. We note that the highest rates of standard deviation are between the same tools, with MBFC-E having the highest rate at 5.30, followed by ITC-W at 4.25 points, suggesting a difference in preference for tools.
While it is apparent that MBFC-E is the preferred tool to assess the overall user experience, we consider the interpretation of the usability rating. On this account, guidelines confer that anything rated below 60 is considered a failing grade. More specifically, anything between 25 and 39 is poor, whereas any score between 39 and 52 is rated as “ok,” but still not acceptable (Bangor et al., 2008). Given MBFC-E’s score of 44, it still falls within an unacceptable rating from a usability perspective.
3.3.2. Multiple choice rating questions
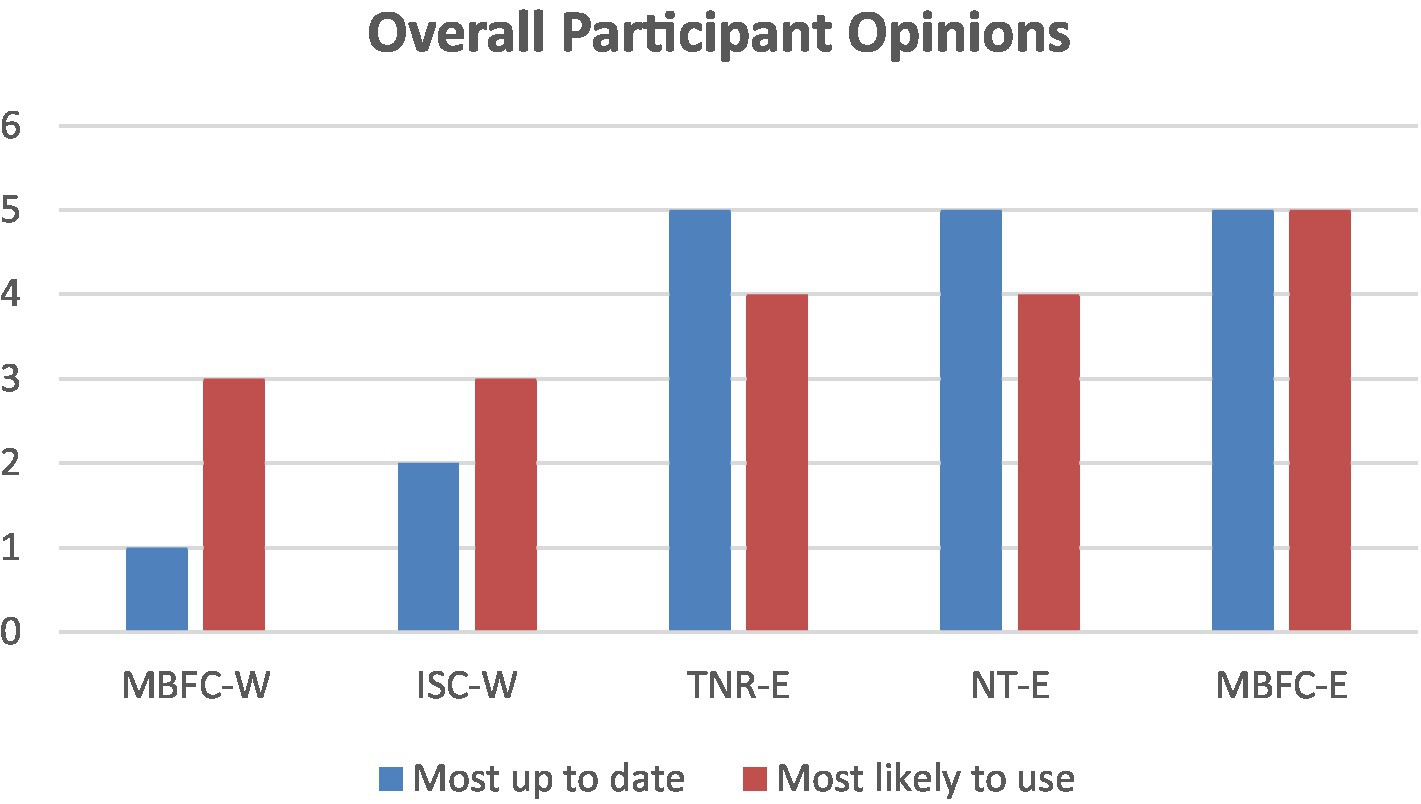
In addition to the SUS scores, to ascertain which tool participants thought would provide them with the most current information to assist them in the verification process, participants were asked to rate which website or extension they found to be most up-to-date. Figure 8 surprisingly shows that despite ISC-W having the second-highest SUS score, it had the second-lowest ranking for being up-to-date. Moreover, although MBFC-W provided the source information for MBFC-E and TNR-E, it was considered the least up-to-date, which may suggest that the format in which information is presented influences users’ perception of its quality. We also asked which tool participants would be more likely to use in the future, in which MBFC-E had only a slight lead over NT-E and TNR-E.
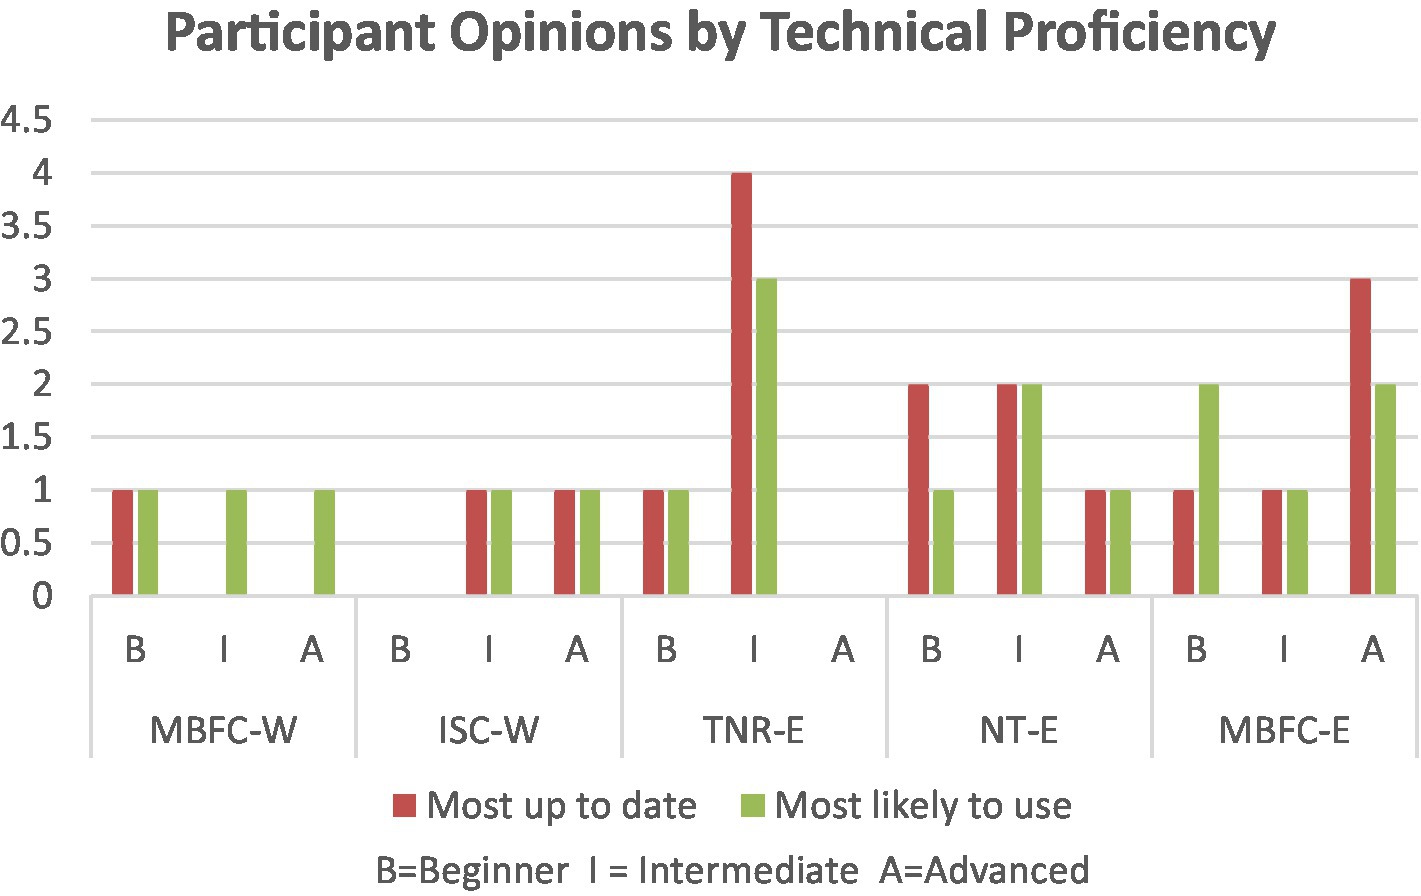
While it is surprising that TNR-E and NT-E would be included in the list of tools considered most up-to-date and most likely to be used post-evaluation, Figure 9 demonstrates that although NT-E was considered up-to-date by beginner and intermediate participants, overall, they were more likely to use a different tool.
4. Discussion
For a comprehensive usability evaluation, we compare results from our multiple methods of data collection.
The heuristic evaluation indicated that the tool with the least number of usability violations was ITC-W, in which case it was initially expected to be a better option for disinformation-countering. However, while engaged in the usability evaluation, it was revealed to be the opposite. Despite having a better design, participants eventually preferred MBFC-W with the greater number of usability challenges due to the information it provided. Comparing MBFC-W with browser extensions, it was immediately clear that extensions provided a much-improved experience as search query challenges were eliminated. Despite an initial appreciation for TNR-E’s visual design, a full analysis of the usability evaluation data revealed that the usability of MBFC-E was better than other tools reviewed. Albeit demonstrating that it is unacceptable from a usability standards perspective, the SUS score further confirmed the usability evaluation and summative results that MBFC-E is a better option for disinformation-countering.
Although ITC-W had the second-highest SUS score, when asked which tool participants thought was most up-to-date and would be more likely to use, it fell to second last and last place, respectively. While MBFC-E received a higher ranking in the usability evaluation and the SUS score, the final question on which tool participants would more likely use, it had only one more vote than TNR-E and NT-E. Such variance in results confirms the need, as mentioned, for multiple forms of evaluation in usability assessments as receiving similar results across different forms of assessment strengthens the validity of findings.
4.1. Challenges faced by users
To determine whether certain users fare better or worse in the use of disinformation-countering tools, our objective was to identify usability challenges faced by users of varying technical proficiency. In this regard, we have found inconsistency in experiences, suggesting that all users face challenges regardless of their technical abilities.
To elaborate, we mention several occurrences where participants had greater discrepancies in their experiences. First, considering challenges experienced within the user interface, as seen in Figure 4, beginners more often complained of being distracted by the content in MBFC-W than their counterparts. While attempting to verify information, advanced users had more difficulty figuring out how to perform a search in MBFC-W and required multiple attempts (Figure 5). When results of search queries or feedback from the browser extension were received, due to their inability to execute a successful search query or recognize that results had been received, the intermediate participants were more likely to end the task without verifying information in MBFC-W and TNR-E (Figure 6).
Considering whether participants understood the meaning of the search results or feedback from the extensions, beginners only slightly lacked an understanding of the results in TNR-E, compared to others, whereas intermediates were behind their peers while interacting with MBFC-E (Figure 7). For those who complained of not enough information being provided, intermediate and advanced were more likely to complain of not enough information in TNR-E, whereas the advanced users had similar complaints using ITC-W and further sought an instruction guide to try to understand the results received (Figure 7).
Thus, given the inconsistencies in challenges experienced, it appears that user performance relates more to the individual tool interacted with, the depth of information they wish to see, and their ability to interpret results, rather than their technical proficiency. Moreover, many cases wherein participant experiences were all closely aligned suggest the severity of the usability issues in the disinformation-countering tools. In this case, it cannot be stated that one group of user profiles fares better than the others.
4.2. Recommendations
To address our second research objective, in this section, we address recommendations for both tool developers and researchers to optimize the creation of disinformation-countering tools to improve resilience to disinformation. To the best of our knowledge, recommended design principles and guidelines have yet to be put forth for the design of disinformation-countering tools. Therefore, whereas our findings in the results and discussion sections pertain specifically to our study and investigation of disinformation-countering tools, our recommendations section integrates our findings with existing literature to put forth comprehensive suggestions for tool design.
4.2.1. Recommendation for tool design
Recommendations in the form of design principles and guidelines have long been established for user interfaces. Design principles, which are the general goals to be met in user interface design, were created to maximize usability and the effective design of user interfaces. Design guidelines then provide specific instructions on how to incorporate the goals within a design (Galitz, 2007).
To address the identified usability challenges, Table 6 provides a list of design principles and guidelines that were selected and adapted from Galitz (2007), Mayhew (1991), and the U.S. Department of Health and Human Services (2006) to address digital disinformation-countering tools. Based on the identified challenges, several guidelines were added to ensure comprehensiveness in addressing existing shortcomings in the design of digital disinformation-countering tools.
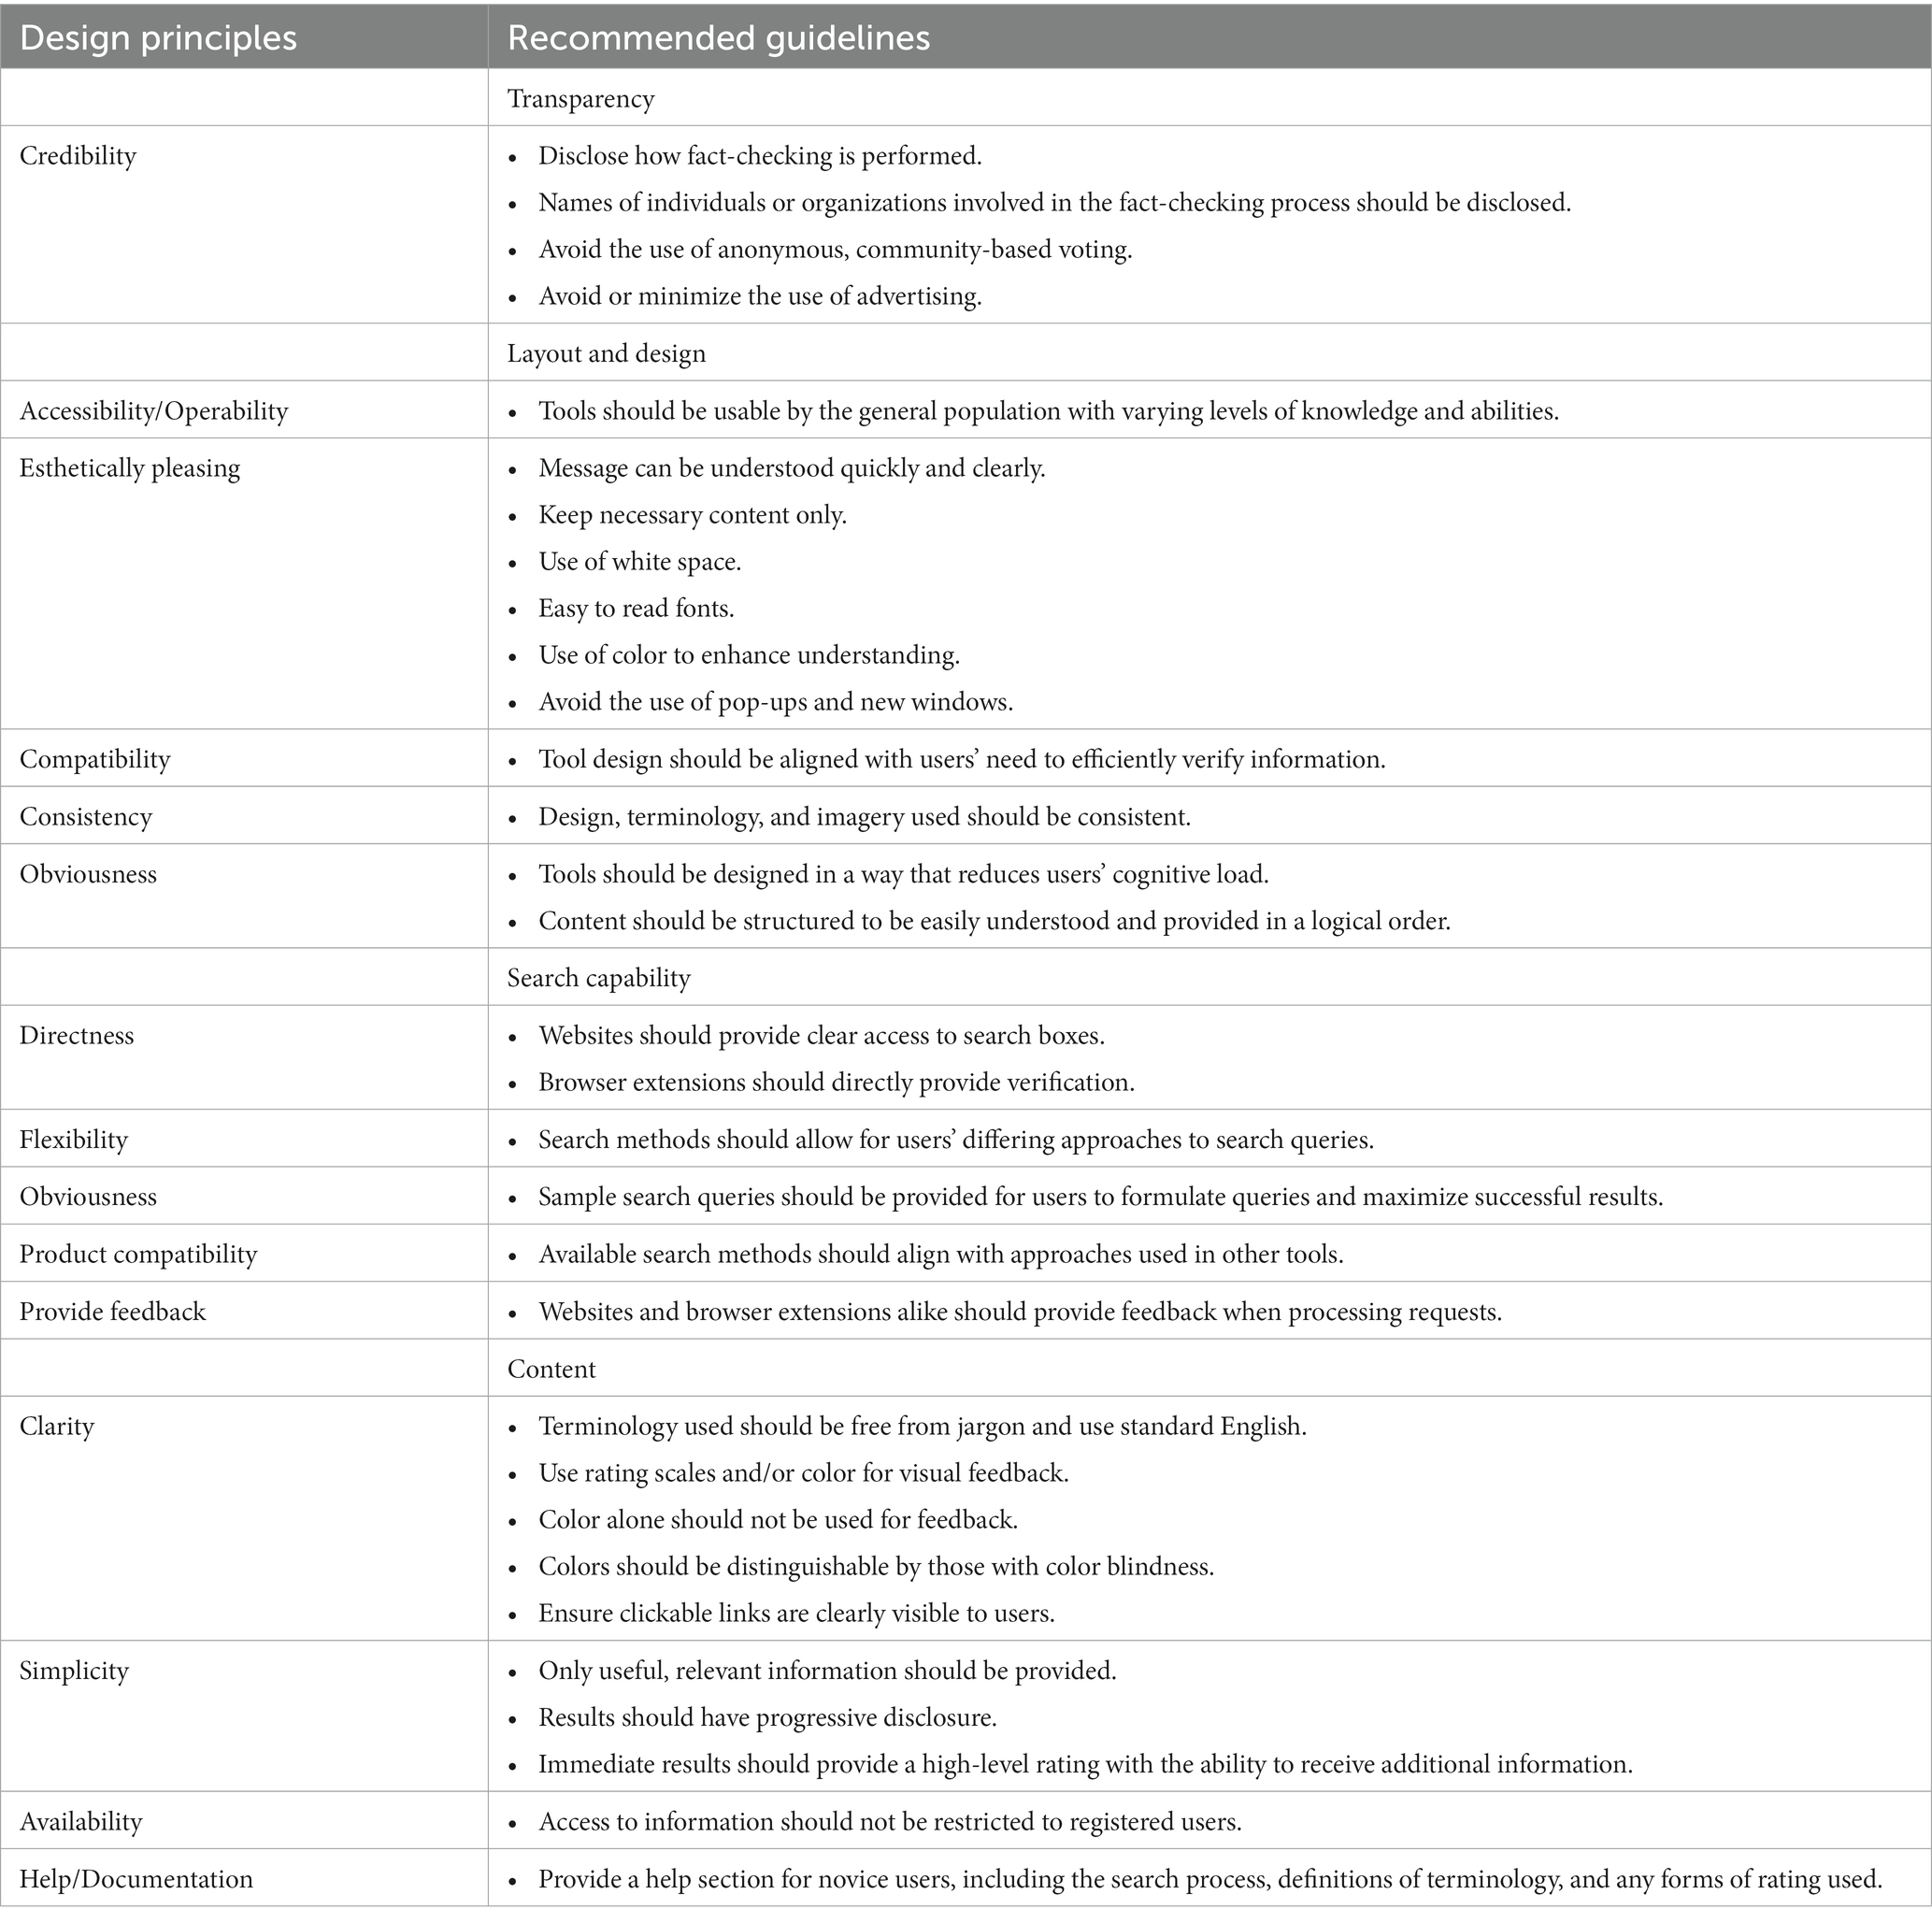
Table 6. Recommended design principles and guidelines for disinformation-countering tools (synthesis of key literature and our study’s research findings).
Once the recommended design principles and guidelines as mentioned below are applied to existing and/or new disinformation-countering tools, a usability evaluation should follow to assess whether the implementations have led to better usability and overall improvements to the user’s experience.
4.2.1.1. Transparency
As some participants raised the concern of individual biases with heavy importance to promote trust and encourage uptake of digital disinformation-countering tools, the most important task is to establish the credibility and trustworthiness of the tool (U.S. Department of Health and Human Services, 2006). While it is understood that developers require funding to create and maintain the tools, the placement of extensive advertisements conjures less credibility. Accordingly, advertisements should be avoided or kept to a minimum, if necessary.
Furthermore, developers should clearly present how fact or source “checks” are performed, including whether it is human-based, machine (learning)-based, or a combination of methods. Moreover, data sources, criteria, or rating scales utilized in the verification process should be communicated. We conjure that it is not advisable to allow anonymous, community-based voting on the credibility of information or sources. If it is used, it should be clearly indicated, including how feedback influences information provided by the tool and efforts taken to mitigate the risk of feedback from those wrongly informed or with nefarious intent. In addition, the names of individuals involved in the verification process, their roles, educational backgrounds, past work, and any community affiliations should also be provided. Such information would promote transparency and reduce the worry of biased ratings, thus solidifying trust in the tool.
Given that many participants had difficulty either navigating the tool, were initially unsure how to get it to work, or, in some cases, unable to get it to work, attention must be paid to the design and layout of the tool, with specific consideration given to its purpose of facilitating access to information to counter disinformation. Moreover, given the tools’ use by the public, its design should be accessible to optimize usability for as many different users as possible. Most importantly, only necessary information should be provided in a form that is easy to read and find.
4.2.1.2. Search
Since performing searches was a major usability challenge, it should be given importance in tool development. The formats in which searches can be performed should be clearly outlined for users to understand how to search in a manner that will most likely return results directly related to their topic. Considering that many of the participants attempted to perform typical search engine queries, search capabilities must accommodate differing forms of search queries. We also note that the search instructions should be given and match the website’s current search capabilities.
4.2.1.3. Content
With the different types of users and the varying depth of details desired, a brief, informative overall rating should first be presented to provide an initial understanding of the topic being investigated. An option to click for additional information can then be provided for users who prefer further details. We advise against requiring users to create accounts and login to view additional information. As witnessed within our study, those who did notice and commented on it mentioned that they would not likely sign up for such a service. Thus, such requirements may pose a barrier, and further enable disinformation to spread.
4.2.1.4. Layout and design
Rating scales should have simplified terminology for users of differing educational and language levels to understand numeric and/or color rating scales to visually receive initial feedback. Moreover, rating scales should be consistent not only throughout the tool itself but also across tools to avoid confusion in understanding. While it may be difficult to coordinate across all disinformation-countering platforms, those involved with a centralized body, such as the International Fact-Checking Network, may be better positioned to do so.
As some participants indicated that it may be possible for an untrustworthy website to feature credible information, and vice versa, it should be clarified whether the rating provided is based on the source itself or the specific article or topic being verified. Some participants appreciated knowing who the source website owner was, and their funder, as it helped to provide context of who they are affiliated with or any biases they may have. Providing this information may raise awareness of platforms or authors to directly avoid in the future, without the need for countering tools.
4.2.2. Recommendations for academia
As our study did not establish trends in usability challenges experienced due to technical proficiency, further exploration should be undertaken with a greater number of participants of different age groups and educational backgrounds to determine differences in user characteristics to establish personas. This can help guide the future update and creation of goals to meet users’ specific needs (Mayhew, 1991; U.S. Department of Health and Human Services, 2006; Galitz, 2007). Furthermore, during our study, one participant admitted to believing in conspiracy theories and was observed to particularly question results provided by the tools, while another reflected that the tools were less likely to be useful for those who already believe in conspiracies. Considering these points, in addition to creating tools to counter disinformation, the role of mental models, including pre-existing beliefs in conspiracy theories, should be explored in relation to the use of disinformation-countering tools to assess their role and whether there are other criteria to consider in the uptake of said tools.
Efforts must also be made to establish effective methods of developing critical thinking skills in individuals of varying demographics. This will assist in taking a comprehensive approach to addressing the challenges imposed by disinformation and preventing individuals from reaching the stage where disinformation-countering tools may be rejected.
As identified, the user experience, particularly ITC-W, is quite improved while using mainstream news sources; therefore, further study should explore experiences verifying different types of disinformation sources. Simultaneously, we recommend a review of the availability and usability of disinformation-countering tools for Mac operating systems (macOS), as well as Android and IOS mobile devices.
While the heuristic evaluations addressed many of the usability challenges, given the final preference for a tool that provided better information, we posit that the use of heuristic evaluations alone may not be a useful approach to assessing the usability of information-based tools. Rather, as witnessed in our study, and long recommended by researchers (Gray and Salzman, 1998; Hartson et al., 2003; Lazar et al., 2017), a mixed method approach wherein more than one form of evaluation should be undertaken to strengthen research findings.
4.3. Limitations of our study
Our study is not without limitations. We first mention that had we used mainstream news sources, the tools generally would have provided better information and a particularly much-improved experience. Our results would likely have fewer identified usability challenges and are strongly in favor of ITC-W. Moreover, consideration was not given to the format in which the news articles may be received and read, as well as any pre-existing opinions the participants may hold, nor their awareness of and caution toward potential disinformation. Furthermore, the tools selected for our study only form a small sample of the disinformation-countering websites, browser extensions, and applications created. Therefore, with the limited number of articles and types of information verified, our findings may not present a full image of the capabilities offered by disinformation-countering tools. As such, our results cannot be generalized to all currently available tools.
On this note, we also mention that the NT-E tool was discontinued at the end of our period of study and the MBFC-W has since been updated with fewer advertisements, thus limiting future replicability of our study. Finally, given that we had less than the 20 participants required to establish statistically significant findings for our summative questions, the results can be considered informative, however, not statistically significant. Financial and time limitations prevented the inclusion of additional participants in our study.
5. Conclusion
In the hope of enhancing their uptake to counteract the harms of disinformation, we have answered calls from researchers to explore the usability of disinformation-countering tools. In addition to addressing the gap in the academic literature on the usability of disinformation-countering tools, by incorporating a mixed-method approach to our usability evaluation, we simultaneously address a gap in incorporating multiple methods within a study. To the best of our knowledge, no other study has followed such a strategy for research on digital disinformation-countering tools.
Our findings indicate that all tools featured some form of usability challenges, with the main areas of contention being the layout of the user interface, how to verify information, recognizing that results were received, and fully comprehending the meaning of the results. To address these challenges, we put forth several design recommendations to improve the development of disinformation-countering tools.
First, we have identified that as disinformation-countering tools, the need for transparency and background information on the developers of the tools is paramount to promoting trust in their use. Therefore, the first of our recommendations is to establish the credibility of the tools, followed by improvements to the layout and design of the tools. This includes the creation of tools with a focus on how to verify information quickly and efficiently, with content structured logically and in a manner that could be generally understood by all users. Moreover, the design should be esthetically pleasing to enhance their experience.
Following is the need to drastically improve a website’s search capabilities where users can execute their queries using standard search engine approaches and/or receive visual indications of accepted forms of queries. Finally, information should be structured in a manner that reduces users’ cognitive load and first presents information for initial verification, followed by the option to incrementally obtain in-depth contextual information. The use of color, rating scales, and simplified, standardized terminology will further assist users in quickly verifying information.
With the ongoing distribution of disinformation and the consequences of its spread, multiple approaches and tools are necessary to address its harms, wherein the disinformation-countering tools explored in our study form one such approach. Given our findings, we hope that developers will recognize the need for their improvement and implement recommendations to enhance the usability of disinformation-countering tools. Through their improvement, we further hope for their increased uptake to educate society with factual evidence and dispel the spread of erroneous, harmful information.
Data availability statement
The original contributions presented in the study are included in the article/supplementary material, further inquiries can be directed to the corresponding author.
Ethics statement
The studies involving humans were approved by University of Ottawa Research Ethics Board. The studies were conducted in accordance with the local legislation and institutional requirements. The participants provided their written informed consent to participate in this study.
Author contributions
UR contributed to the conceptual design of the study and wrote the sections of the manuscript. KN and UR were involved in the literature review. KN conducted the data collection, performed data analysis, summarized and interpreted the results, and wrote the first draft of the manuscript. All authors contributed to the article and approved the submitted version.
Funding
This research was supported by the Canadian Heritage Digital Citizen Contribution Program (Grant Number 1340696).
Acknowledgments
The authors thank R. Kalantari who assisted in initial data collection for this project.
Conflict of interest
The authors declare that the research was conducted in the absence of any commercial or financial relationships that could be construed as a potential conflict of interest.
Publisher’s note
All claims expressed in this article are solely those of the authors and do not necessarily represent those of their affiliated organizations, or those of the publisher, the editors and the reviewers. Any product that may be evaluated in this article, or claim that may be made by its manufacturer, is not guaranteed or endorsed by the publisher.
References
Bangor, A., Kortum, P. T., and Miller, J. T. (2008). An empirical evaluation of the system usability scale. Int. J. Hum. Comput. Interact. 24, 574–594. doi: 10.1080/10447310802205776
Becker, H. S. (1970). “Field work evidence,” in Sociological Work Method and Substance. ed. H. S. Becker, 1st Edn. (New Brunswick, NJ: Transaction Books Routledge).
Brooke, J. (1996). “SUS: a ‘quick and dirty’ usability scale” in Usability Evaluation in Industry. eds. P. W. Jordan, B. Thomas, I. L. McClelland, and B. Weerdmeester, (London: CRC Press), 207–212.
Chossudovsky, M. (2022). Biggest lie in world history: there never was a pandemic. The data base is flawed. The covid mandates including the vaccine are invalid. Global Research Centre for Research on Globalization. Available at: https://www.globalresearch.ca/biggest-lie-in-world-history-the-data-base-is-flawed-there-never-was-a-pandemic-the-covid-mandates-including-the-vaccine-are-invalid/5772008
David Wolfe (2021). Chinese herb kills cancer cells—new study finds. Available at: https://www.davidwolfe.com/chinese-herb-kills-cancer-40-days/.
De Kock, E., Van Biljon, J., and Pretorius, M. (2009). “Usability evaluation methods: mind the gaps” in Proceedings of the 2009 Annual Research Conference of the South African Institute of Computer Scientists and Information Technologists. Vanderbijlpark Emfuleni South Africa: ACM, 122–131.
Excel Spreadsheet for Calculating SUS Scores (2008). Measuring UX. Available at: https://measuringux.com/sus/SUS_Calculation.xlsx.
Flores-Saviaga, C., and Savage, S. (2019). Anti-Latinx computational propaganda in the United States. Institute of the Future. arXiv [Preprint]. doi: 10.48550/ARXIV.1906.10736
Froehlich, T. J. (2017). A not-so-brief account of current information ethics: the ethics of ignorance, missing information, misinformation, disinformation and other forms of deception or incompetence. Textos Universitaris de Bibliotecomia i Documentacio 39. Available at: http://temaria.net/simple.php?origen=1575-5886&idioma=en
Gaeta, A., Loia, V., Lomasto, L., and Orciuoli, F. (2023). A novel approach based on rough set theory for analyzing information disorder. Appl. Intell. 53, 15993–16014. doi: 10.1007/s10489-022-04283-9
Galitz, W. (2007). The Essential Guide to User Interface Design: An Introduction to GUI Design Principles and Techniques, 3rd Edition. Indianapolis, IN: Wiley Publishing Inc.
Garrett, J. J. (2010). The Elements of User Experience: User-Centered Design for the Web and Beyond. 2nd Edn. Indianapolis, IN: New Riders
Glenski, M., Weninger, T., and Volkova, S. (2018). Propagation from deceptive news sources who shares, how much, how evenly, and how quickly? IEEE Transac. Comput. Soc. Syst. 5, 1071–1082. doi: 10.1109/TCSS.2018.2881071
Goldstein, J. A., Sastry, G., Musser, M., DiResta, R., Gentzel, M., and Sedova, K. (2023). Generative language models and automated influence operations: Emerging threats and potential mitigations. arXiv [Preprint]. doi: 10.48550/arXiv.2301.04246
Gradoń, K. T., Hołyst, J. A., Moy, W. R., Sienkiewicz, J., and Suchecki, K. (2021). Countering misinformation: a multidisciplinary approach. Big Data Soc. 8, 205395172110138–205395172110114. doi: 10.1177/20539517211013848
Gray, W. D., and Salzman, M. C. (1998). Damaged merchandise? A review of experiments that compare usability evaluation methods. Hum. Comp. Interact. 13, 203–261. doi: 10.1207/s15327051hci1303_2
Grimme, C., Preuss, M., Takes, F. W., and Waldherr, A. eds. (2020). Disinformation in open online media: First multidisciplinary international symposium, MISDOOM 2019, Hamburg, Germany, February 27–March 1, 2019, revised selected papers. Cham: Springer International Publishing Available at: http://link.springer.com/10.1007/978-3-030-39627-5 (Accessed October 9, 2022).
Guille, A. (2013). “Information diffusion in online social networks” in Proceedings of the 2013 Sigmod/PODS Ph.D. Symposium on PhD symposium—SIGMOD’13 PhD symposium (New York, New York, USA: ACM Press), 31–36.
Hamilton, K. (2021). “Interrupting the propaganda supply chain” in 1st International Workshop on Knowledge Graphs for Online Discourse Analysis (KnOD), Collocated with TheWebConf (WWW) 2021 (Ljubljana, Slovenia: ARROW@TU DublinContent Analysis: An Introduction to its Methodology), 7.
Hartson, H. R., Andre, T. S., and Williges, R. C. (2003). Criteria for evaluating usability evaluation methods. Int. J. Hum. Comput. Interact. 15, 145–181. doi: 10.1207/S15327590IJHC1501_13
Hassenzahl, M., and Tractinsky, N. (2006). User experience—a research agenda. Behav. Inform. Technol. 25, 91–97. doi: 10.1080/01449290500330331
Himelein-Wachowiak, M., Giorgi, S., Devoto, A., Rahman, M., Ungar, L., Schwartz, H. A., et al. (2021). Bots and misinformation spread on social media: implications for COVID-19. J. Med. Internet Res. 23, e26933–e26911. doi: 10.2196/26933
Hinsley, A., and Holton, A. (2021). Fake news cues: examining the impact of content, source, and typology of news cues on People’s confidence in identifying Mis- and disinformation. Int. J. Commun. 15, 4984–5003.
Innes, M., Dobreva, D., and Innes, H. (2021). Disinformation and digital influencing after terrorism: spoofing, truthing and social proofing. Contemp. Soc. Sci. 16, 241–255. doi: 10.1080/21582041.2019.1569714
Islam, A. K. M. N., Laato, S., Talukder, S., and Sutinen, E. (2020). Misinformation sharing and social media fatigue during COVID-19: an affordance and cognitive load perspective. Technol. Forecast. Soc. Chang. 159:120201. doi: 10.1016/j.techfore.2020.120201
Jeffries, R., and Desurvire, H. (1992). Usability testing vs. heuristic evaluation: was there a contest? SIGCHI Bull. 24, 39–41. doi: 10.1145/142167.142179
Kanozia, D. R. (2019). Analysis of digital tools and technologies for debunking fake news. J. Content Commun. Commun. 9, 114–122. doi: 10.31620/JCCC.06.19/16
Kapantai, E., Christopoulou, A., Berberidis, C., and Peristeras, V. (2021). A systematic literature review on disinformation: toward a unified taxonomical framework. New Media Soc. 23, 1301–1326. doi: 10.1177/1461444820959296
Krippendorff, K. (2012). “Content analysis” in Encyclopedia of Research Design. ed. N. J. Salkind (Thousand Oaks: Sage Publications Inc.), 234–238.
Krippendorff, K. (2018). Content Analysis: An Introduction to its Methodology. 4th Edn. Thousand Oaks: SAGE Publications Inc.
Kumar, S., and Shah, N. (2018). False information on web and social media: A survey. arXiv [Preprint]. doi: 10.48550/arXiv.1804.08559
Law, E. L.-C., and Hvannberg, E. T. (2004). “Analysis of strategies for improving and estimating the effectiveness of heuristic evaluation” in Proceedings of the third Nordic conference on Human-computer interaction. Tampere Finland: ACM, 241–250.
Law, E. L.-C., Roto, V., Hassenzahl, M., Vermeeren, A., and Kort, J. (2009). “Understanding, scoping and defining user eXperience: a survey approach” in Proceedings of the SIGCHI Conference on Human Factors in Computing Systems. Boston, MA, 719–728.
Lazar, J., Feng, J. H., and Hochheiser, H. (2017). Research Methods in Human-Computer Interaction. 2nd Edn. Cambridge, MA: Morgan Kaufmann
Lee, J. (2022). The effect of web add-on correction and narrative correction on belief in misinformation depending on motivations for using social media. Behav. Inform. Technol. 41, 629–643. doi: 10.1080/0144929X.2020.1829708
Levak, T. (2021). Disinformation in the new media system – characteristics, forms, reasons for its dissemination and potential means of tackling the issue. Medijska Istraž. 26, 29–58. doi: 10.22572/mi.26.2.2
Lewis, J. R. (2018). The system usability scale: past, present, and future. Int. J. Hum. Comput. Interact. 34, 577–590. doi: 10.1080/10447318.2018.1455307
Lewis, J. R., and Sauro, J. (2021). “Usability and user experience: design and evaluation” in Handbook of Human Factors and Ergonomics. eds. G. Salvendy and W. Karwowski (USA: John Wiley & Sons, Inc.), 972–1015.
Mayhew, D. J. (1991). Principles and Guidelines in Software User Interface Design. Upper Saddle River, NJ: Prentice-Hall Inc
Mayorga, M. W., Hester, E. B., Helsel, E., Ivanov, B., Sellnow, T. L., Slovic, P., et al. (2020). “Enhancing public resistance to ‘fake news’: a review of the problem and strategic solutions” in The Handbook of Applied Communication Research. eds. H. D. O’Hair and M. J. O’Hair (Hoboken, NJ: John Wiley & Sons, Inc. Wiley), 197–212.
Meel, P., and Vishwakarma, D. K. (2020). Fake news, rumor, information pollution in social media and web: a contemporary survey of state-of-the-arts, challenges and opportunities. Expert Syst. Appl. 153:112986. doi: 10.1016/j.eswa.2019.112986
Mehta, A. M., Liu, B. F., Tyquin, E., and Tam, L. (2021). A process view of crisis misinformation: how public relations professionals detect, manage, and evaluate crisis misinformation. Public Relat. Rev. 47:102040. doi: 10.1016/j.pubrev.2021.102040
Morris, D. S., Morris, J. S., and Francia, P. L. (2020). A fake news inoculation? Fact checkers, partisan identification, and the power of misinformation. Politics Groups Identit. 8, 986–1005. doi: 10.1080/21565503.2020.1803935
Nidhra, S. (2012). Black box and white box testing techniques—a literature review. IJESA 2, 29–50. doi: 10.5121/ijesa.2012.2204
Nielsen, J. (1994). “Enhancing the explanatory power of usability heuristics” in Usability Inspection Methods. In Proceedings of the ACM CHI ’94: conference companion on human factors in computing systems; Boston, MA: ACM, 152–158.
Nielsen, J., and Landauer, J. (1993). “A mathematical model of finding the usability problems” in CHI ‘93: Proceedings of the INTERACT ‘93 and CHI ‘93 Conference on Human Factors in Computing Systems (Amsterdam), 206–213.
Pierre, J. M. (2020). Mistrust and misinformation: a two-component, socio-epistemic model of belief in conspiracy theories. J. Soc. Polit. Psychol. 8, 617–641. doi: 10.5964/jspp.v8i2.1362
Plasser, F. (2005). From hard to soft news standards?: how political journalists in different media systems evaluate the shifting quality of news. Harv. Int. J. Press/Politics 10, 47–68. doi: 10.1177/1081180X05277746
Pomputius, A. (2019). Putting misinformation under a microscope: exploring technologies to address predatory false information online. Med. Ref. Serv. Q. 38, 369–375. doi: 10.1080/02763869.2019.1657739
Posetti, J., and Matthews, A. (2018). A short guide to the history of ‘fake news’ and disinformation. International Center for Journalists. Available at: https://www.icfj.org/sites/default/files/2018-07/A%20Short%20Guide%20to%20History%20of%20Fake%20News%20and%20Disinformation_ICFJ%20Final.pdf
RAND Corporation (2020). Fighting disinformation online: Building the database of web tools. RAND Corporation Available at: https://www.rand.org/pubs/research_reports/RR3000.html
RAND Corporation (n.d.). Tools that fight disinformation online. RAND Corporation Available at: https://www.rand.org/research/projects/truth-decay/fighting-disinformation/search.html
Riihiaho, S. (2017). “Usability Testing” in The Wiley Handbook of Human Computer Interaction. eds. K. L. Norman and J. Kirakowski (USA: John Wiley & Sons), 257–275.
Rodríguez-Virgili, J., Serrano-Puche, J., and Fernández, C. B. (2021). Digital disinformation and preventive actions: perceptions of users from Argentina, Chile, and Spain. Media Commun. 9, 323–337. doi: 10.17645/MAC.V9I1.3521
Rosenzweig, E. (2015). Successful User Experience: Strategies and Roadmaps. Waltham, MA, USA: Morgan Kaufmann
Spohr, D. (2017). Fake news and ideological polarization: filter bubbles and selective exposure on social media. Bus. Inf. Rev. 34, 150–160. doi: 10.1177/0266382117722446
Tashakkori, A., and Teddlie, C. eds. (2003). Handbook of Mixed Methods in Social and Behavioral Research. Thousand Oaks, CA: SAGE Publications Inc.
Technical Committee ISO/TC 159 (2019). ISO 9241-210:2019, 3.2.3. Available at: https://www.iso.org/obp/ui/#iso:std:iso:9241:-210:ed-2:v1:en
U.S. Department of Health and Human Services (ed.) (2006). Research-based web design & usability guidelines. Version 2. Washington, D.C: U.S. Dept. of Health and Human Services: U.S. General Services Administration Available at: https://www.usability.gov/sites/default/files/documents/guidelines_book.pdf.
Vizoso, Á., Vaz-Álvarez, M., and López-García, X. (2021). Fighting Deepfakes: media and internet giants’ converging and diverging strategies against hi-tech misinformation. Macromolecules 9, 291–300. doi: 10.17645/mac.v9i1.3494
Wardle, C., and Derakhshan, H. (2017). Information disorder: toward an interdisciplinary framework for research and policy making. Council of Europe Available at: https://rm.coe.int/information-disorder-toward-an-interdisciplinary-framework-for-researc/168076277c
Weigel, F. K., and Hazen, B. T. (2014). Technical proficiency for IS success. Comput. Hum. Behav. 31, 27–36. doi: 10.1016/j.chb.2013.10.014
World News Daily Report (n.d.). Hairdresser arrested for making voodoo dolls from customer’ hair. World news daily report. Available at: https://worldnewsdailyreport.com/hairdresser-arrested-for-making-voodoo-dolls-from-customers-hair/.
Keywords: digital disinformation, misinformation, disinformation countering, information verification, usability, user experience
Citation: Nault K and Ruhi U (2023) User experience with disinformation-countering tools: usability challenges and suggestions for improvement. Front. Comput. Sci. 5:1253166. doi: 10.3389/fcomp.2023.1253166
Edited by:
Michele Sorice, Guido Carli Free International University for Social Studies, ItalyReviewed by:
Donatella Selva, University of Florence, ItalyMattia Zunino, Guido Carli Free International University for Social Studies, Italy
Copyright © 2023 Nault and Ruhi. This is an open-access article distributed under the terms of the Creative Commons Attribution License (CC BY). The use, distribution or reproduction in other forums is permitted, provided the original author(s) and the copyright owner(s) are credited and that the original publication in this journal is cited, in accordance with accepted academic practice. No use, distribution or reproduction is permitted which does not comply with these terms.
*Correspondence: Kimberley Nault, a2ltYmVybGV5Lm5hdWx0QHVvdHRhd2EuY2E=
 Kimberley Nault
 Umar Ruhi