 Mohamed Elkholy1*
 Marwa A. Marzouk2
- 1Faculty of Information Systems and Computer Science, October 6 University, Giza, Egypt
- 2Faculty of Computers and Artificial Intelligence, Information Technology Department, Matrouh University, Matrouh, Egypt
Deep learning shows promising results in extracting useful information from medical images. The proposed work applies a Convolutional Neural Network (CNN) on retinal images to extract features that allow early detection of ophthalmic diseases. Early disease diagnosis is critical to retinal treatment. Any damage that occurs to retinal tissues that cannot be recovered can result in permanent degradation or even complete loss of sight. The proposed deep-learning algorithm detects three different diseases from features extracted from Optical Coherence Tomography (OCT) images. The deep-learning algorithm uses CNN to classify OCT images into four categories. The four categories are Normal retina, Diabetic Macular Edema (DME), Choroidal Neovascular Membranes (CNM), and Age-related Macular Degeneration (AMD). The proposed work uses publicly available OCT retinal images as a dataset. The experimental results show significant enhancement in classification accuracy while detecting the features of the three listed diseases.
1 Introduction
CNN, a type of deep learning neural network, has shown promising results in the field of image classification (Qin et al., 2020). CNN has the capability of extracting underlying non-linear structures of image data which are widely found in different medical images (Bogunovi et al., 2019). Hence, CNN is able to classify eye images that are considered complex and have multiple pixel dependencies throughout (Karthik and Mahadevappa, 2023). Accurate classification leads to accurate prediction of different diseases (Madbouly et al., 2020). Similar to the human brain, CNN contains several neurons that are arranged in layers (Ting et al., 2018; Zhao et al., 2020). The main three layers of CNN are the convolution layer, pooling layer, and fully connected layer (Ting et al., 2018). The convolution layer is responsible for primary filtering (Kernel filtering) of the input data (Orlando et al., 2018; Ting et al., 2018; Karthik and Mahadevappa, 2023). It takes the image as input and applies a kernel filter on it to give a convolved matrix as output (Chan et al., 2017; Bogunovi et al., 2019; Karthik and Mahadevappa, 2023). The main benefit of the convolution layer is to extract the major image features from the input image (Mohamed and Mohamed, 2021; Zobair et al., 2022). The convolution layer can also include a padding layer to control the edges of the convoluted matrix (Wang et al., 2023). The second layer is the pooling layer which applies a filter to reduce the size of the Convolved Feature, thus decreasing the computational power required to deal with it (Mohamed and Marzok, 2022; Wang et al., 2023). The third layer is the fully connected layer which is responsible for learning non-linear features of the output of the convolutional layer. The output of the convolution layer is the classification of the input images to a set of classes (Alqudah and Alqudah, 2021; Tayal et al., 2021).
The ability of CNN to extract non-linear features and semantic relations between neighbor pixels allows it to classify different diseases according to medical images (Mohamed and ElFatatry, 2015; Ting et al., 2018). In the field of ophthalmology, analyzing retinal images can predict eye diseases early (Tong et al., 2020). Such early prediction is critical for better treatment and avoids damaging tissues that leads to permanent degradation of sight (Mohamed and ElFatatry, 2019). The harmful impacts of eye diseases which are included in this work are discussed below.
In the human eye, the retina is responsible for sending images to the brain via the optic nerve (Ting et al., 2019). At the center of the retina there is the macula, which is responsible for gathering image information (Bogunovi et al., 2019; Ting et al., 2019). The retina processes this information and converts it to a neural signal to be passed to the brain. Several diseases can affect macular health, leading to sight problems (Storås et al., 2022). AMD, CNV, and DME are considered the major subjects of irreversible vision loss (Chan et al., 2017; Mohamed and ElFatatry, 2019; Ran and Cheung, 2021). Such diseases lead to geographic atrophy that affects the retina (Awais et al., 2017). The proposed work is motivated to use CNN to extract features from retinal images that predict the presence of these diseases.
According to WHO estimates, around 422 million people worldwide have diabetes (WHO, 2019). Diabetes is a set of metabolic illnesses characterized by high blood glucose levels (Le et al., 2020; Storås et al., 2022). Diabetic Macular Edema (DME) is a diabetic condition that can cause substantial damage to blood vessels in the retina, which can result in serious blindness (Akil et al., 2021). Another frequent disorder that affects the center of vision is Age-related Macular Degeneration (AMD; Prabhakar et al., 2021; Ran and Cheung, 2021). People in their 50's and 60's are frequently the first to be affected. It does not result in complete blindness. It has been associated with smoking, hypertension, being overweight, and having a family history of AMD (Zhang et al., 2020). The estimated number of persons infected with the illness was 196 million in 2020, predicted to rise to 288 million in 2040 (Pinazo-Durán et al., 2016). Choroidal Neovascular Membranes (CNVM) are new, potentially harmful blood veins that form beneath the retina. The choroid is where these blood vessels develop. They are capable of breaking through the choroid-retina barrier (Pinazo-Durán et al., 2016). They cause visual loss when they leak or bleed in the retina. CNVM may recur in 15–30% of individuals, resulting in a hemorrhagic or serous macular degeneration with accompanying vision loss (Boldt et al., 1990).
In order to avoid the danger of late diagnoses of the listed eye diseases, the proposed work designs and implements a deep-learning-based diagnostic system. The diagnostic system analyzes OCT images to detect common curable blinding retinal disorders (Le et al., 2020). OCT is a commonly used integral imaging technique (Wang et al., 2021). The main reason for using OCT is its ability to provide a cross-sectional retinal image with high resolution. Such high-resolution images of biological tissues allow CNN to extract features that indicate the presence of abnormal retina and thus allows early detection of eye diseases (Akil et al., 2021; Ran and Cheung, 2021). Figure 1 presents different OCT images of the three mentioned diseases and the normal retina. The OCT technique uses light wave's reflections to provide cross-sectional images of the macula and optic nerve as well as a clear image of blood vessels. The normal eye is characterized by a normal retinal shape without any fluid and normal blood vessels shape. AMD is characterized by retinal thickness, intraretinal fluid, and subretinal fluid. Fluid appears in OCT images as black holes on the white surface of the retina. DME images are characterized by the presence of interretinal fluid pockets, while CNVM images show abnormal sizes of blood vessels.
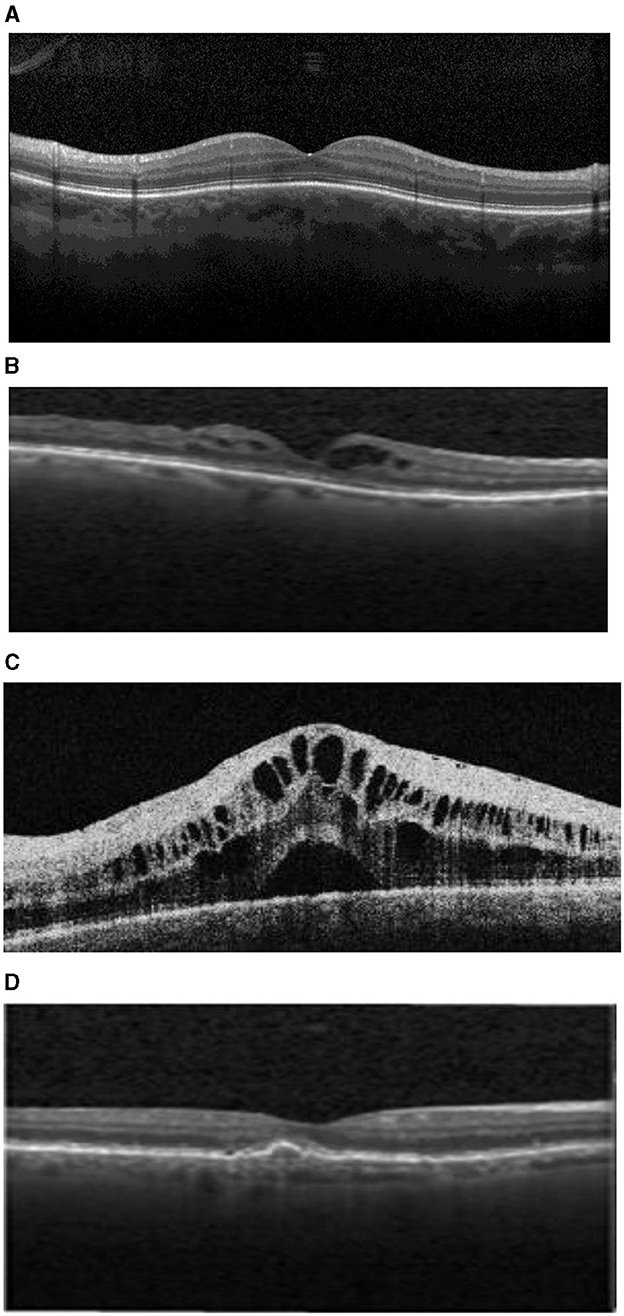
Figure 1. (A) Normal retina. (B) Drusen age-related macular degeneration (AMD). (C) Diabetic Macular Edema (DME). (D) Choroidal Neovascular Membranes (CNM).
CNN transfer learning methodology is employed by using convolutional layers to train a neural network with a training set of data containing OCT images (Wang et al., 2021). This work contributes to designing CNN layers to be able to extract features that indicate the presence of each of the three mentioned diseases from retina images. The proposed design overcomes the complexity and non-linearity of features composing retinal images as well as the semantics of neighbor pixel relationships. A manual analysis of the OCT images with specialists is time consuming and is subject to human errors.
This main objective of this work is to diagnose early three eye disorders: DME, CNM, and AMD. Such early and accurate detection of the mentioned diseases is important for several reasons. First, it can help ensure that patients receive the most effective treatment possible. Second, it can help to rule out potentially serious conditions such as blindness. Finally, making an accurate diagnosis can provide peace of mind for both patients and their families.
The rest of the paper is structured as follows: Section 2 discusses the related work. Section 3 provides information on the Efficient Perturbation Inference and Expandable Network (EPIE-Net), while Section 4 presents experiments. In Section 5, we summarize our work and go through possible future research areas.
2 Related work
Several studies have been conducted to develop expert systems that automate disease diagnoses processes (Hasan et al., 2021). The objective of such systems is to obtain an accurate and fast response. In the area of medical images, CNN shows promising results. The complexity of retinal images attracted several researchers to develop machine learning systems to deal with them. In Waudby et al. (2011) and Peissig et al. (2012) researchers used written data to perform Natural Language Processing techniques to detect cataract disease without surgery. Electronic reports were used to describe the data associated with each patient including specific fields that can predict cataract disease. They concluded that eye diseases can be predicted using different Machine learning algorithms.
An early work to use OCT is presented in Ginsburg (2006). Authors used OCT imaging data for detecting intraocular lenses and refractive surgery. The authors used machine learning to identify specific eye diseases. After that, several machine learning solutions were employed for the detection of certain eye diseases such as age-related macular degeneration and automatic detection of diabetic retinopathy and automatic optical disc localization using image classification with support vector machines (Farooq and Sattar, 2015).
In Al-Mohtaseb et al. (2021) a study was conducted to find the relationship between signs and diagnoses of dry eyes disease. The researchers employed Independent Component Analysis (ICA) and Pearson correlations. Each component of the ICA indicates the negligible remaining data. Hence, no steady relationship was found among the foremost regularly utilized signs and indications.
In Ting et al. (2017) designed a deep learning system diagnostic for detecting referable AMD; their study used Fovea-centered images without macula segmentation collected from 38,189 patients. However, few patients in their sample had referable AMD. Moreover, their CNN lacks a step for image processing that includes filters to extract deep features of OCT images.
In Burlina et al. (2017) reported high diagnostic accuracy by pre-segmenting the macula region prior to training and testing step. They used the National Institutes of Health AREDS data set that contains color fundus photographs that were captured from patients. The used images included stereo pairs taken from both eyes. Both AlexNet and OverFeat models for CNN were employed to classify the input images; the authors clarified that AlexNet showed better performance.
The concept of segmentation was also applied to blood vessels to allow early detection of eye diseases. In Moccia et al. (2018) authors used a machine-learning methods model that performed a vessel segmentation process to extract features that lead to the prediction of eye diseases. Their work adopted a segmentation algorithm to overcome the drawbacks of noise and low contrast when dealing with eye images.
In An et al. (2019) introduced a machine learning technique for detecting glaucoma. The authors used three-dimensional (OCT) data as well as color fundus images to detect the abnormal features of eye retina. A segmentation algorithm was used to generate thickness and deviation maps. Then (CNN) transfer learning was applied to a set of input images such as gray-scale optic disc fundus image, retinal nerve fiber layer, and retinal ganglion cell complex. CNN is trained using data augmentation. Then a random forest (RF) was trained by combining the results of each CNN model. Their model showed high accuracy to detect glaucomatous subjects based on features extracted from images.
Prasad et al. (2019) introduced a deep neural network model that is able to recognize features associated with diabetic retinopathy and glaucoma in the early stages. They aimed to advise the patients to consult an ophthalmologist to be sure of the presence of the mentioned eye disease. However, they did not focus on obtaining high accuracy for their work.
Thus, the related work show the need for a model that can efficiently predict different widely spread types of eye disease. Such a model should be able to use famous and commonly used retinal images devices such as OCT images.
3 Proposed methodology and CNN design
This section clarifies the design of the proposed CNN to detect the three mentioned types of diseases from CRT images. The proposed model starts with image processing for image enhancement. Then the enhanced images are fed to a CNN to apply deep learning methodology to predict and classify input images to four categories. Hence the output of the model is to classify the image as a normal retinal image or as a retinal image that suffers from DME, CNM, or Drusen. The diagnoses and classification criteria depend on the features extracted from OCT images. The proposed model is trained to classify each image that shows intraretinal fluid or subretinal fluid to be classified as an AMD image. If the fluid is in the form of several distributed pockets, the image is classified as DME. However, if the image shows larger sizes of blood vessels than the normal size the image is considered CNM. Otherwise, the image is considered a normal eye image. The training data set focuses on the previous features to classify the retinal images. The proposed model contributes to predicting the three most common eye diseases in only one model with higher accuracy and performance to other models up to now. Such a higher performance is achieved with enhancement of the image before connecting images to the implemented CNN. Image enhancement techniques were based on two basic concepts. The first is the characteristics of OCT images which depend on light reflection. The second is the features that should be abstracted to predict eye disease are blood vessel edges and fluid shape. The model also enhances performance and accuracy by performing fine tuning and optimization to the model output.
3.1 Image processing
Image processing is used to improve or extract useful information from an input image (Awais et al., 2017). It is a sort of signal processing in which the input is an image and the output might be an image or image characteristics/features.
3.1.1 Image enhancement
OCT images are complex images that contain semantic relationships between neighbor pixels (Prabhakar et al., 2021). Features that help in predicting eye diseases from OCT images depend on the shape of blood vessels and the amount of abnormal fluid surrounding the retina. In order to enhance OCT images and increase the weight of required features in OCT, two successive processes are applied to each image. The proposed model starts by highlighting the important hidden details in an image such as contrast and brightness adjustment. OpenCV and PIL were used to enhance the brightness and contrast of OCT images; however Open CV showed better brightness. The proposed model uses both point operator and neighborhood operators and applied higher weight to the neighbor pixels in determining the value of each pixel. Figures 2–4 illustrate the enhancement of OCT images using the first step of the proposed preprocessing. Such enhancement allows using the enhanced images to predict the three different mentioned diseases using the proposed model.
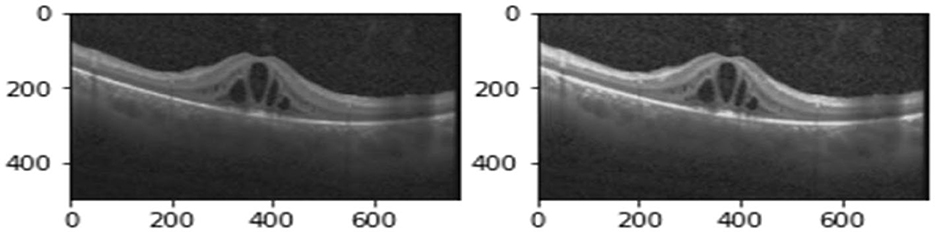
Figure 2. Brightness using PIL.
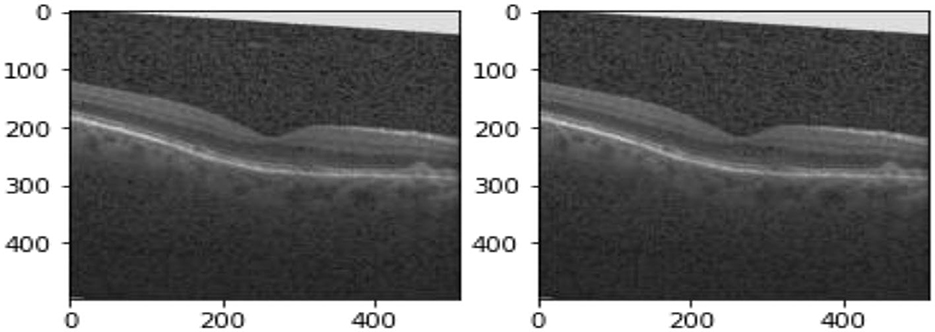
Figure 3. Contrast using PIL.
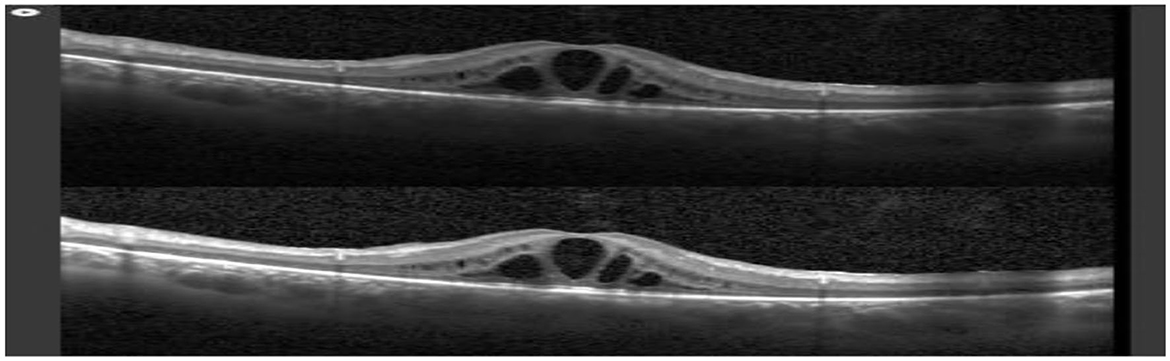
Figure 4. Brightness and contrast using OpenCV.
The second process applies enhanced Multiscale Retinex Algorithm (MRA). Each pixel in the image p (x, y) is combined with the average weight of the surrounding pixels to remove the illumination component. The dynamic range of each fluctuating pixel can be compressed via image weighted average transformation. The weighted transformation also offers effective extinction of the dark pixels. Thus, it is suitable to be applied to OCT images that depend mainly on light reflection. Hence, the weighted average can select the optimal pixel in the image, so as to enhance the weight of required features of OCT images.
3.1.2 Image restoration
This step deals with improving the appearance of OCT images by removing noise or blur from images. There are different types of smoothing such as Gaussian Blur, blur, Median blur, and Bilateral blurring. Noise can be Gaussian Noise (which arose due to different lighting conditions). This work employed Gaussian Blur to apply a simple weighted mean to OCT images. OCT images are characterized by significant non-linear relationships between pixels. Such relationships are important in accurate determination of the eye disease. Neighborhood pixels that are closer to the core pixel provide greater weight to the central pixel average. OpenCv was used to apply a Gaussian Blur algorithm to improve the quality of OCT images, especially for blood vessels. Comparing OCT images before and after applying the Gaussian Blur filter offers enhancement after applying the filter. The edges of blood vessels and fluid holes become clearer and free of noise. Figure 5 illustrates OCT image enhancement after applying Gaussian Blur.
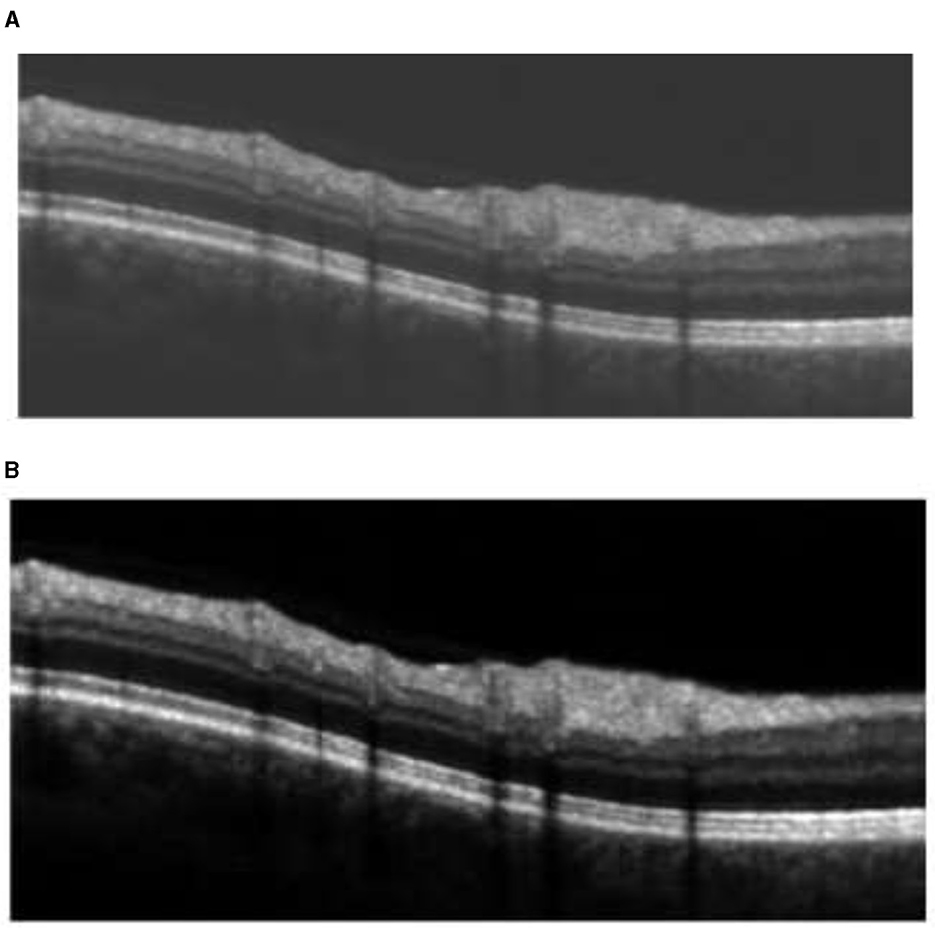
Figure 5. (A) Before applying Gaussian Blur. (B) After applying Gaussian Blur.
3.2 Convolutional neural network
The proposed work employs CNN as a deep learning technique to classify OCT images to four categories. The first three categories include the mentioned diseases: DME, CNM, and Drusen. The fourth category represents the normal eye images. The adopted layers are listed below.
• Convolutional Layer.
• ReLU Layer.
• Pooling Layer.
• Flatten Layer.
• Softmax Layer.
3.2.1 Convolutional layer
The convolutional layer is the core building block of a CNN. It is the first layer that processes defined filters on the input data. In the proposed work, the input images have three dimensions which are height, width, and depth corresponding to RGB in an image. Moving across the image's receptive fields, a feature detector (also known as a kernel filter) is utilized to determine whether the feature is there. By examining the image's size, the kernel size is selected. The used filter is >3*3 if the image size is larger than 128*128. When an image is <128 x 128, 1*1 or 3*3 filters are used. A two-dimensional (2-D) array of weights acting as the feature detector represents a portion of the image. The size of the filter is commonly a 3x3 matrix; however, it can be other sizes. The filter is then applied to an area of the image, and the dot product between the input pixels and the filter is computed. After that, the dot product is loaded into an output array. The filter then moves by a stride and repeats the operation until the kernel has swept across the whole image. As seen in Figure 6, the final output of the sequence of dot products from the input and the filter is known as a feature map.
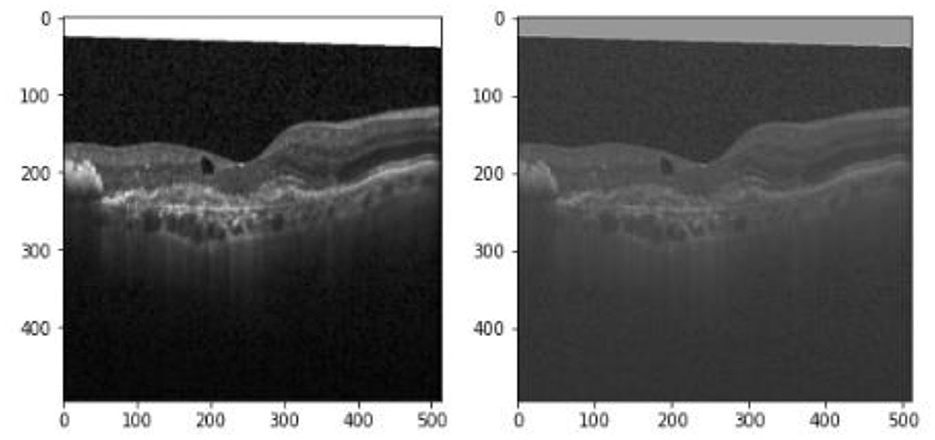
Figure 6. Original image and image after the convolutional layer.
3.2.2 ReLU function
This work uses ReLU (Rectified Linear activation function) as a non-linear function to change any negative value in the feature map matrix to zero without any changes to positive values. It is Mathematically Expressed as:
For values less than (negative values) or equal to zero, 0.0 is returned, and the positive value is returned in its original form. After plotting ReLU, it seems to be a linear function at first glance. However, as it is a non-linear function, the training data must be used to help it recognize and learn complex relationships. For positive values, it behaves as a linear function; for negative values, it behaves as a non-linear activation function. The output of ReLU function is represented in Figure 7.
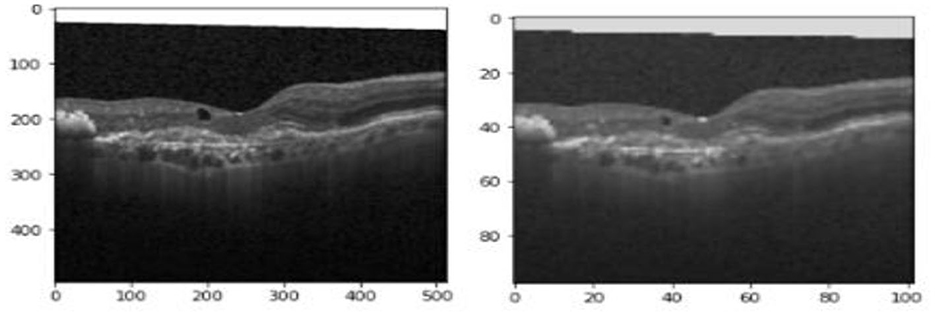
Figure 7. Original image and image after the convolutional layer and ReLU.
3.2.3 Pooling layer
The pooling layer is used to reduce the size of the feature maps. A filter size of 2x2 is used to decrease the elements of the featured matrix to its fourth. As a result, the number of parameters to learn in the CNN is significantly decreased. Hence, a significant enhancement to performance is achieved. The output of the pooling layer is the summary of characteristics in the featured map, leading to simplicity in the fully connected layers. Pooling is classified into three types: maximum pooling, minimum pooling, and average pooling. The suggested approach utilities a Max pooling layer because Max pooling selects the biggest element from the feature map region covered by the filter. As a consequence, the max-pooling layer's output would be a feature map containing the most significant properties of the preceding feature map obtained after applying the convolutional layer and the ReLU layer. Hence, a significant reduction in the number of parameters in the network is achieved without affecting the important features of the OCT images.
3.2.4 Flatten layer
To pass the featured map after applying max pooling to the fully connected layer it should be converted to a single dimension array. In order to create a single long continuous linear vector, the flattening method is utilized for combining all of the 2-Dimensional arrays obtained from pooling feature maps. The fully connected layer obtains the flattened matrix as input to classify the image.
3.2.5 Softmax layer
In order to deal with multiclass classification problems (four categories of eye images) the proposed work uses softmax layer. Softmax is used as an activation function that changes the weight of each output node to a probability vector. Thus, each node in the output layer is given a probability value to be closer to one of the four mentioned categories. The neural network's prediction is the node with the highest value.
3.2.6 Optimization
Back propagation and forward propagation are both used to train the CNN. For each iteration the loss function is calculated. The loss function is the difference between the actual and predicted output. Thus, backward propagation is used to decrease this error using an optimizer. The optimizer function updates the weights of CNN nodes to decrease the error. It also changes the learning rate after every iteration by calculating the loss function. The neural network may not learn well if the learning rate is too fast and vice versa. Hence, the proposed work uses Adam Optimizer to optimize learning speed.
3.2.7 Transfer learning
Transfer learning involves using an already trained model as a starting point for another model (Elkholy and Elfatatry, 2018). The proposed work uses transfer learning to speed up training and improve the performance of the deep learning model. Reusing the parameters and weights that a model has learned significantly saves time in implementation and training (Ghosh et al., 2023). The proposed work uses Keras application in which it is possible to instantly apply the required model and all of its previously trained weights.
The proposed work adopts VGGA16 fully connected layers. OCT images can be handled by VGGA16 because it combines numerous smaller layers rather than a single large layer. As a result, additional non-linear activation layers accompany the convolution layers, which improve the decision functions and speeds up convergence (Figure 8).
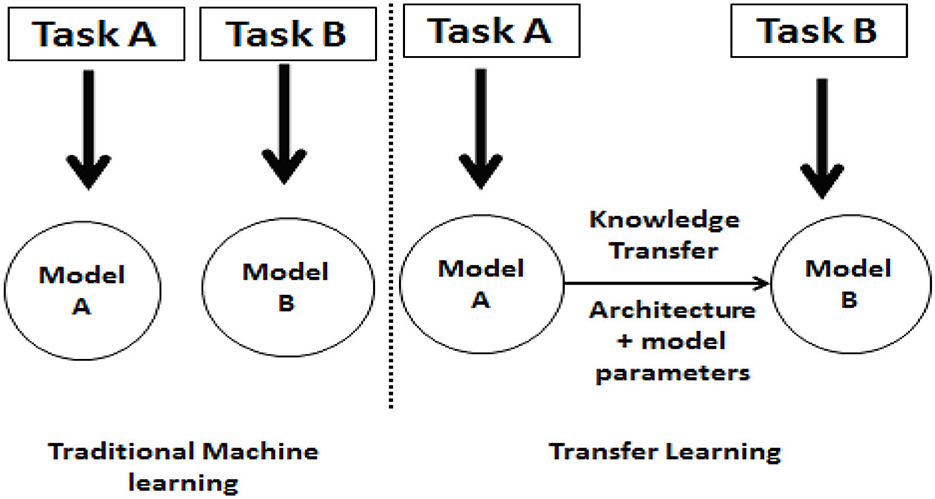
Figure 8. Traditional ML and transfer learning.
3.2.8 Fine tuning
Fine tuning is used to improve the model's efficiency by linking the output of one fully connected layer as an input to another fully connected layer (Sarki et al., 2020; Marzuok and Elkholy, 2023). First, from the pre-trained CNN (the “head” of the network where the class label predictions are returned), the final set of fully connected layers is severed. The head is then changed out for a new set of linked layers. The weights of the layers below the head cannot be altered since they are all frozen. Then, the network has been trained with a small learning rate so that the newly learnt convolutional layers can learn patterns from the prior learned convolutional layers. Pre-trained networks may be used to distinguish classes that they were not initially trained on by applying fine-tuning. Compared to transfer learning by feature extraction, this approach can provide results with better accuracy.
4 Implementation
The proposed work depends on CNN to implement a deep learning model to classify eye diseases from OCT images. The used data is collected from publicly available data sets for OCT images. The system block diagram is presented in Figure 9. The proposed model was implemented using Keras, a high-level API of “Tensor Flow” platform on a PC with Intel core i7 CPU 12700H 14 cores and 32 GB RAM and NVIDIA GTX 1070 GPU.
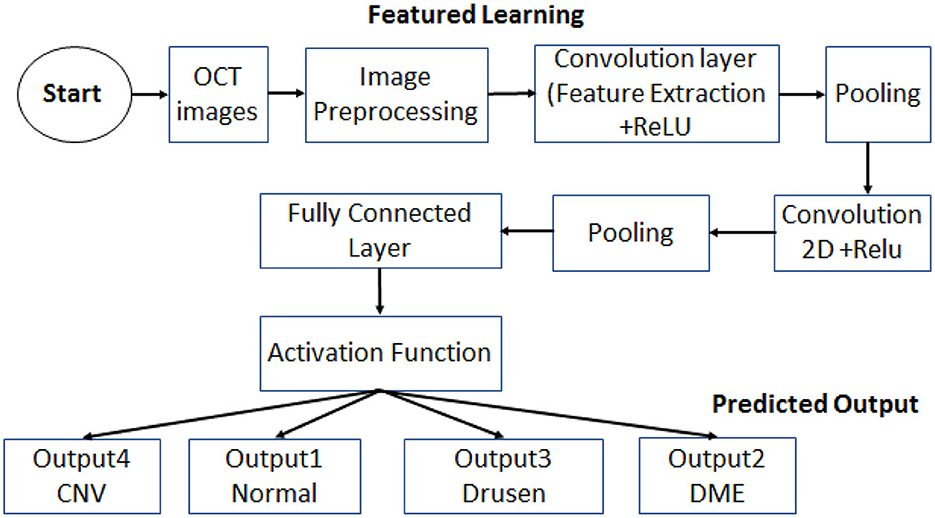
Figure 9. Block diagram for system design.
4.1 The dataset
The data used in the proposed work is collected from a publicly available dataset. Used data is collected from Kaggle, which is a large data science community supported with powerful tools to help researchers and developers. Used data is available at the following link and can be accessed for free https://www.kaggle.com/datasets/paultimothymooney/kermany2018. The used dataset consists of OCT images for the normal retina and three different retinal diseases. OCT provides high-resolution cross sections of human retinas. Each image was graded by ophthalmologists. OCT images are considered high quality images as the capturing process depends on light reflection. The captured images are not biased by any way to any one of the three disease categories labeled with the diagnosis. Images were then split into four directories: CNV, DME, DRUSEN, and normal.
The total number of images is 35,468. The images are divided as follows:
• 8,867 images for the normal retina along with preserved foveal contour and no retinal fluid/edema (NORMAL).
• 8,867 images for choroidal neovascularization (CNV) with neovascular membrane and accompanied sub-retinal fluid.
• 8,867 images for the Diabetic Macular Edema in addition to retinal-thickening-associated intra-retinal fluid (DME).
• 8,867 images for numerous drusen present in the early stages of age-related macular degeneration (DRUSEN).
The criteria behind choosing the same number of images for each category are to prevent the model being biased toward any of the four categories. Image sets then were further split into training and test sets. From each class, 250 test images were taken, making 1,000 test images in total, while the rest of the images were for training.
4.2 Implementation environment
The proposed model was implemented using Keras, which is a deep learning API written in Python. Keras provides high performance and scalability for deep learning development. It also provides essential building blocks for developing and shipping CNN models. The required functionalities of CNN implementation were imported as predefined libraries to improve code productivity. Listing 1 shows the set of imported libraries.
“source”: [
“import os\n,”
“from glob import glob\n,”
“import pandas as pd\n,”
“import numpy as np\n,”
“from numpy import expand_dims\n,”
“import matplotlib.pyplot as plt\n,”
“import matplotlib.image as mpimg\n,”
“import seaborn as sn\n,”
“from skimage.transform import resize\n,”
“from skimage.color import gray2rgb\n,”
“from sklearn.metrics import classification_report, confusion_matrix\n,”
“from IPython.display import SVG\n,”
“import keract\n,”
“from tensorflow import keras\n,”
“from tensorflow.keras import applications, optimizers\n,”
“from tensorflow.keras.models import Model, Sequential, load_model\n,”
“from tensorflow.keras.preprocessing.image import ImageDataGenerator, load_img, img_to_array\n,”
“from tensorflow.keras.layers import Dense, Flatten, Dropout\n,”
“from tensorflow.keras.applications.vgg16 import VGG16, preprocess_input\n,”
“from tensorflow.keras.utils import to_categorical, model_to_dot, plot_model\n,”
“from tensorflow.keras.callbacks import ModelCheckpoint, EarlyStopping, CSVLogger, ReduceLROnPlateau\n,”
“from keras.applications.vgg16 import preprocess_input\n,”
“from keras.applications.vgg16 import decode_predictions\n,”
“from keras.applications.vgg16 import VGG16\n”
]
Listing 1: Imported libraries.
After importing the libraries, the data are loaded to the model. The important libraries needed for implementation are imported, and the VGG16 pre-trained model is named. The flatten layer and Adam optimizers are also implemented; listing 2 shows the implementation of the flatten layer. After all functionalities are implemented, the model training is started.
X=Flatten() (vgg.out)
predection= Dense(len(folder), activation = ‘softnax')(x)
model = Model (input = vgg.input, output= prediction)
model.summary()
Listing 2: Implementation of the flatten layer.
4.3 Experimental results
After training the proposed model it was tested using the testing dataset. The first results showed that the model suffers from an under-fitting problem. Hence, to overcome this problem the duration of training was increased. After that, the model showed high efficiency in predicting the four types of images. The model accuracy was about 94% and, after fine tuning, it approaches 97%. VGG16 showed higher accuracy as is more suitable to extracting non-linear features and neighbor relations between pixels in OCT images. The proposed model was tested using different OCT images and showed the same high accuracy for different datasets. Figures 10, 11 represent the accuracy before and after fine tuning. Such high accuracy was achieved by applying the suitable preprocessing of images regarding the characteristics of OCT images and the features required to be abstracted from it. In addition, the model performs fine tuning and optimization to get more accurate results.
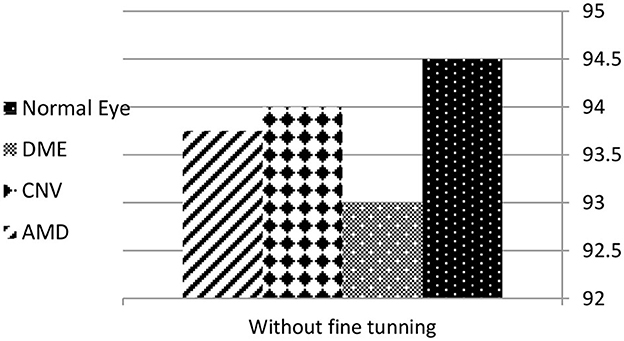
Figure 10. Accuracy of detecting the four classes before fine tuning.
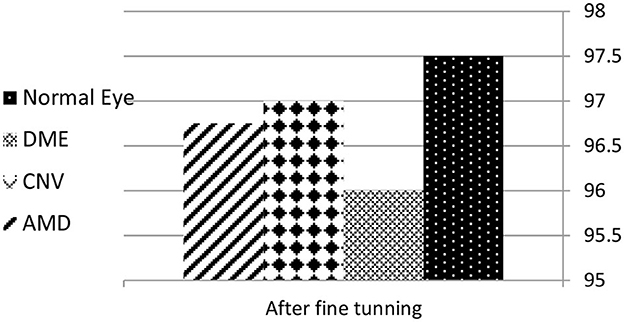
Figure 11. Accuracy of detecting the four classes after fine tuning.
4.4 Comparative analysis
To get an accurate evaluation of our model for eye disease classification, a comparative analysis was done with recent research in the area of eye disease detection. Several studies focused on detecting one or two types of eye diseases. Other studies needed few medical examinations before producing the final results. However, we attempted to get a meaningful comparison with three other studies.
The work done in An et al. (2019) in which CNN was used to detect only Glaucoma showed promising results. The authors of the research used VGG-19 as a transfer learning model without using optimizer function and fine tuning. Their result for detecting Glaucoma was 0.953 for OCT images. In Prasad et al. (2019) multiple eye disease detection using a deep neural network was demonstrated. The authors created a system that could detect Glaucoma and Diabetic Retinopathy at an early stage. Their results showed 80% accuracy by using CNN, however, their paper did not mention the data sample. In Burlina et al. (2017) authors presented a model to detect two different types of AMD. They used deep Convolutional Neural Networks in their work and got results with 92% accuracy. According to this comparison, we claim that the proposed model achieved higher accuracy than several recent models in the literature.
The performance of the proposed model to discriminate images related to the three mentioned diseases from normal eye images is evaluated using a Receiver Operating Characteristic (ROC) curve. For each disease the true positive, true negative, false positive, and false negative are calculated. In Figure 12, the (ROC) curve represents the relation between sensitivity and (1- specificity). Sensitivity is calculated as the true positive fraction while (1- specificity) is calculated as false positive fraction. The area under the curve shows the high performance of the model in classifying OCT images related to different eye diseases.
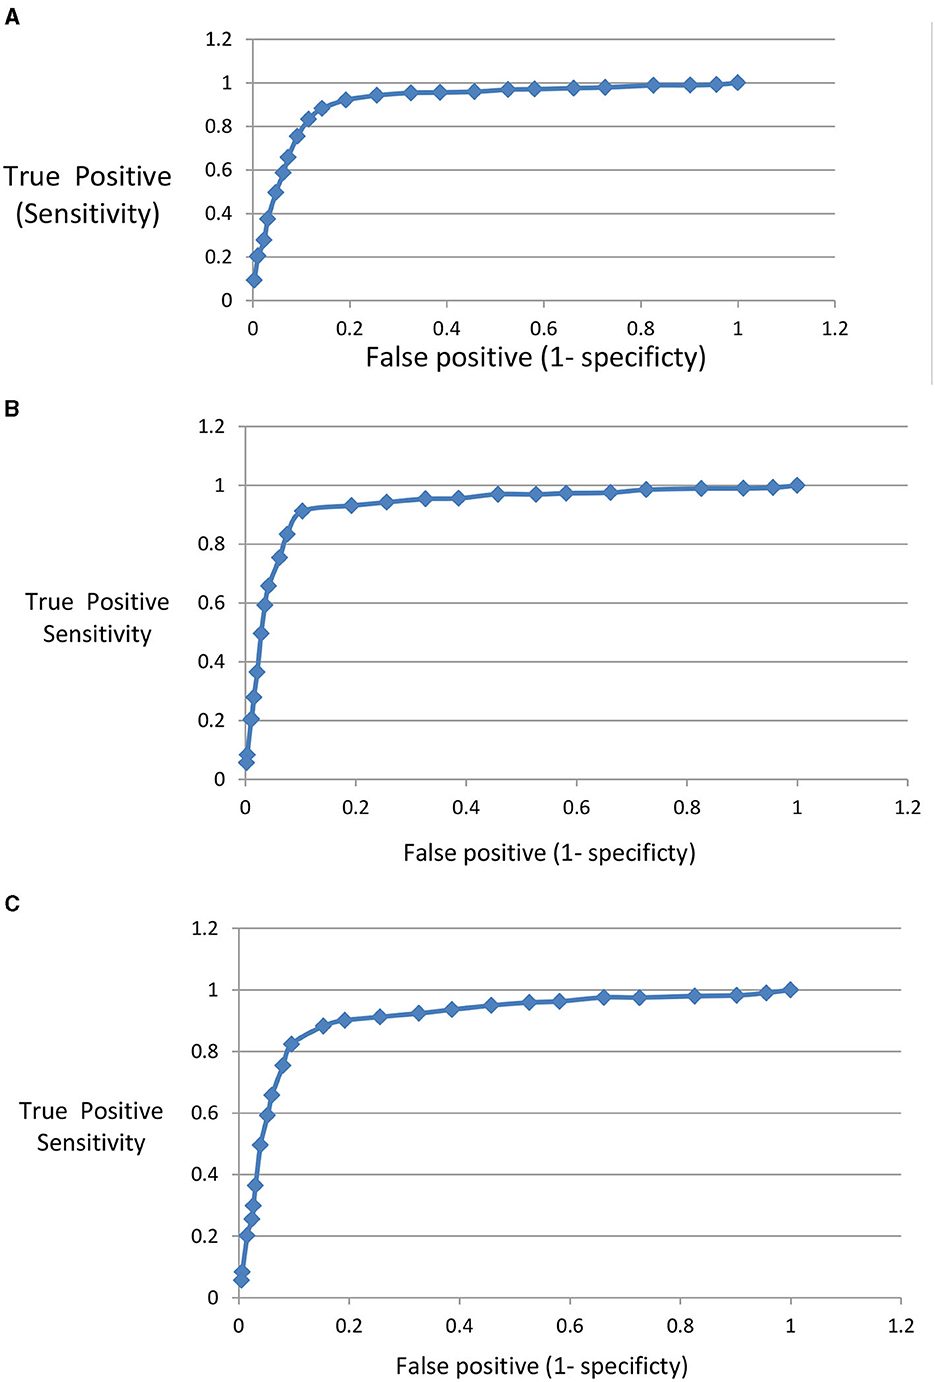
Figure 12. (A) ROC for AMD disease detection. (B) ROC for DME disease detection. (C) ROC for CNV disease detection.
5 Conclusion
The proposed work shows the ability of CNN to predict different eye diseases early using OCT images with an accuracy that reached 97%. The experimental results showed the higher accuracy of the proposed model over other models listed in the literature. The model classifies retinal OCT images into four classes: normal eye retina, DME, NVM, and AMD. Early eye disease detection prevents dangerous effects of eye diseases that may lead to complete loss of sight. The deep-learning model was implemented using Python libraries including Keras, OpenCV, NumPy, and matplotlib. The proposed model has the potential to be evolved by adding new diagnoses and new symptoms.
Future work will focus on adding new diseases and their symptoms to the model. We will also try to deeply classify the infection of mentioned diseases. The classification will include elementary and urgent cases. Urgent cases are cases that require urgent treatments or surgeries.
Data availability statement
Publicly available datasets were analyzed in this study. This data can be found at: https://www.kaggle.com/datasets/paultimothymooney/kermany2018.
Author contributions
All authors have participated in (a) conception and design or analysis and interpretation of the data, (b) drafting the article or revising it critically for important intellectual content, and (c) approval of the final version.
Conflict of interest
The authors declare that the research was conducted in the absence of any commercial or financial relationships that could be construed as a potential conflict of interest.
Publisher's note
All claims expressed in this article are solely those of the authors and do not necessarily represent those of their affiliated organizations, or those of the publisher, the editors and the reviewers. Any product that may be evaluated in this article, or claim that may be made by its manufacturer, is not guaranteed or endorsed by the publisher.
References
Akil, M., Elloumi, Y., and Kachouri, R. (2021). State of the Art in Neural Networks and their Applications. Academic Press. doi: 10.1016/B978-0-12-819740-0.00002-4
Al-Mohtaseb, Z., Schachter, S., Lee, B. S., Garlich, J., and Trattler, W. (2021). The relationship between dry eye disease and digital screen use. Clin. Ophthalmol. 2021, 3811–3820. doi: 10.2147/OPTH.S321591
Alqudah, A., and Alqudah, A. M. (2021). Artificial intelligence hybrid system for enhancing retinal diseases classification using automated deep features extracted from OCT images. Int. J. Intell. Syst. Appl. Eng. 9, 91–100. doi: 10.18201/ijisae.2021.236
An, G., Omodaka, K., Hashimoto, K., Tsuda, S., Shiga, Y., Takada, N., et al. (2019). Glaucoma diagnosis with machine learning based on optical coherence tomography and color fundus images. J. Healthc. Eng. 2019, 4061313. doi: 10.1155/2019/4061313
Awais, M., Müller, H., Tang, T. B., and Meriaudeau, F. (2017). “Classification of SD-OCT images using a deep learning approach,” in 2017 IEEE International Conference on Signal and Image Processing Applications (ICSIPA) (Malaysia: IEEE), 489–492.
Bogunovi, C., Venhuizen, F., Klimscha, S., Apostolopoulos, S., Bab-Hadiasher, A., Bagci, U., et al. (2019). Retouch-the retinal OCT fluid detection and seg-mentation benchmark and challenge. IEEE Trans. Med. Imag. 38, 1858–1874. doi: 10.1109/TMI.2019.2901398
Boldt, C. H., Bressler, S. B., Fine, S. L., and Bressler, N. M. (1990). Age-related macular degeneration. Curr. Opin. Ophthalmol. 1, 247–257. doi: 10.1097/00055735-199006000-00008
Burlina, P. M., Joshi, N., Pekala, M., Pacheco, K. D., and Freund, D. E. (2017). Automated grading of age-related macular degeneration from color fundus images using deep convolutional neural networks. J. Am. Med. Assoc. Ophthalmol. 135, 1170–1176. doi: 10.1001/jamaophthalmol.2017.3782
Chan, G. C. Y., Muhammad, A., Shah, S. A. A., Tang, T. B., Lu, C. K., and Meriaudeau, F. (2017). “Transfer learning for diabetic macular edema (DME) detection on optical coherence tomography (OCT) images,” in 2017 IEEE International Conference on Signal and Image Processing Applications (ICSIPA) (IEEE), 493–496.
Elkholy, M., and Elfatatry, A. (2018). Change taxonomy: a fine-grained classification of software change. IT Professional 20, 28–36. doi: 10.1109/MITP.2018.043141666
Farooq, U., and Sattar, N. Y. (2015). “Improved automatic localization of optic disc in Retinal Fundus using image enhancement techniques and SVM,” in Proceedings of the IEEE International Conference on Control Systems, Computing and Engineering. Penang, 532–537.
Ghosh, I., Sanyal, M. K., and Pamucar, D. (2023). Modelling predictability of airbnb rental prices in post COVID-19 regime: an integrated framework of transfer learning, PSO-based ensemble machine learning and explainable AI. Int. J. Inform. Technol. Decision Mak. 917–955, 22. doi: 10.1142/S0219622022500602
Ginsburg, A. P. (2006). Contrast sensitivity, determining the visual quality and function of cataract, intraocular lenses and refractive surgery. Curr. Opin. Ophthalmol. 17, 19–26. doi: 10.1097/01.icu.0000192520.48411.fa
Hasan, D. A., Zeebaree, S. R. M., Sadeeq, M. A. M., Shukur, H. M., Zebari, R. R., and Alkhayyat, A. H. (2021). “Machine learning-based diabetic retinopathy early detection and classification systems-a survey,” in 2021 1st Babylon International Conference on Information Technology and Science (BICITS) (Babil: IEEE), 16–21.
Karthik, K., and Mahadevappa, M. (2023). Convolution neural networks for optical coherence tomography (OCT) image classification. Biomed. Signal Process. Control 79, 104176. doi: 10.1016/j.bspc.2022.104176
Le, D., Alam, M., Yao, C. K., Lim, J. I., Hsieh, Y. T., Chan, R. V., et al. (2020). Transfer learning for automated OCTA detection of diabetic retinopathy. Transl. Vis. Sci. Technol. 9, 35.
Madbouly, M., Elkholy, M., Gharib, Y. M., and Darwish, S. M. (2020). “Predicting stock market trends for Japanese candlestick using cloud model,” in Proceedings of the International Conference on Artificial Intelligence and Computer Vision, AICV 2020, Advances in Intelligent Systems and Computing, vol. 1,153 (Cham: Springer).
Marzuok, M. A., and Elkholy, M. (2023). Deep image: an efficient image-based deep conventional neural network method for android malware detection. J. Adv. Inform. Technol. 14, 838–845. doi: 10.12720/jait.14.4.838-845
Moccia, S., De Momi, E., El Hadji, S., and Mattos, L. S. (2018). Blood vessel segmentation algorithms-review of methods, datasets and evaluation metrics. Comput. Methods Progr. Biomed. 158, 71–91. doi: 10.1016/j.cmpb.2018.02.001
Mohamed, E., and ElFatatry, A. (2015). “Intelligent broker: a knowledge based approach for semantic web services discovery,” in Proceedings of the 10th International Conference on Evaluation of Novel Approaches to Software Engineering (ENASE-2015) (Barcelona), 39–44.
Mohamed, E., and ElFatatry, A. (2019). Framework for interaction between databases and microservice architecture. IT Professional 21, 57–63. doi: 10.1109/MITP.2018.2889268
Mohamed, E., and Marzok, M. A. (2022). Light weight serverless computing at fog nodes for internet of things systems. Indonesian J. Electr. Eng. Comput. Sci. 26, 394–403. doi: 10.11591/ijeecs.v26.i1.pp394-403
Mohamed, E., and Mohamed, A. (2021). Efficient security model for RDF files used in IoT applications. Int. J. Adv. Comput. Sci. Appl. 12, 2021. doi: 10.14569/IJACSA.2021.0120431
Orlando, J. I., Prokofyeva, E., del Fresno, M., and Blaschko, M. B. (2018). An ensemble deep learning based approach for red lesion detection in fundus images. Comput. Methods Programs Biomed. 153, 115–127. doi: 10.1016/j.cmpb.2017.10.017
Peissig, P. L., Rasmussen, L. V., Berg, R. L., Linneman, J. G., McCarty, C. A., Waudby, C., et al. (2012). Importance of multi-modal approaches to eeffectively identify cataract cases from electronic health records. J. Am. Med. Inf. Assoc. 19, 225–234. doi: 10.1136/amiajnl-2011-000456
Pinazo-Durán, M. D., Zanón-Moreno, V., García-Medina, J. J., Fernando Arévalo, J., Gallego-Pinazo, R., and Nucci, C. (2016). Eclectic ocular comorbidities and systemic diseases with eye involvement: a review. BioMed Res. Int. 2016, 6215745. doi: 10.1155/2016/9519350 doi: 10.1155/2016/6215745
Prabhakar, B., Singh, R. K., and Yadav, K. S. (2021). Artificial intelligence (AI) impacting diagnosis of glaucoma and understanding the regulatory aspects of AI-based software as medical device. Computer. Med. Imag. Graph. 87, 101818. doi: 10.1016/j.compmedimag.2020.101818
Prasad, K., Sajith, P. S., Neema, M., Madhu, L., and Priya, P. N. (2019). “Multiple eye disease detection using Deep Neural Network,” in TENCON 2019 - 2019 IEEE Region 10 Conference (TENCON) (Kochi), 2148–2153. doi: 10.1109/TENCON.2019.8929666
Qin, J., Pan, W., Xiang, X., Tan, Y., and Hou, G. (2020). A biological image classification method based on improved CNN. Ecol. Informat. 58, 101093. doi: 10.1016/j.ecoinf.2020.101093
Ran, A., and Cheung, C. Y. (2021). Deep learning-based optical coherence tomography and optical coherence tomography angiography image analysis: an updated summary. Asia-Pacific J. Ophthalmol. 10, 253–260. doi: 10.1097/APO.0000000000000405
Sarki, R., Ahmed, K., Wang, H., and Zhang, Y. (2020). Automated detection of mild and multi-class diabetic eye diseases using deep learning. Health Inf. Sci. Syst. 8:32. doi: 10.1007/s13755-020-00125-5
Storås, A. M., Strümke, I., Riegler, M. A., Grauslund, J., Hammer, H. L., Yazidi, A., et al. (2022). Artificial intelligence in dry eye disease. Ocular Surf. 23, 74–86. doi: 10.1016/j.jtos.2021.11.004
Tayal, A., Gupta, J., Solanki, A., Bisht, K., Nayyar, A., and Masud, M. (2021). DL-CNN-based approach with image processing techniques for diagnosis of retinal diseases. Multimedia Syst. 7, 1–22. doi: 10.1007/s00530-021-00769-7
Ting, D. S. W., Cheung, C. Y., Lim, G., Tan, G. S. W., Quang, N. D., Gan, A., et al. (2017). Development and validation of a deep learning system for diabetic retinopathy and related eye diseases using retinal images from multiethnic populations with diabetes. J. Am. Med. Assoc. 318, 2211–2223. doi: 10.1001/jama.2017.18152
Ting, D. S. W., Liu, Y., Burlina, P., Xu, X., Bressler, N. M., and Wong, T. Y. (2018). AI for medical imaging goes deep. Nat. Med. 24, 539–540. doi: 10.1038/s41591-018-0029-3
Ting, D. S. W., Peng, L., Varadarajan, A. V., Keane, P. A., Burlina, P. M., Chiang, M. F., et al. (2019). Deep learning in ophthalmology: the technical and clinical considerations. Progr. Retinal Eye Res. 72, 100759. doi: 10.1016/j.preteyeres.2019.04.003
Tong, Y., Lu, W., Yu, Y., and Shen, Y. (2020). Application of machine learning in ophthalmic imaging modalities. Eye Vis. 7, 1–15. doi: 10.1186/s40662-020-00183-6
Wang, B., Wei, W., Qiu, S., Wang, S., Li, D., and He, H. (2021). Boundary aware U-Net for retinal layers segmentation in optical coherence tomography images. IEEE J. Biomed. Health Informat. 25, 3029–3040. doi: 10.1109/JBHI.2021.3066208
Wang, J. Z., Zhang, L., and Yi, A. (2023). Mixture 2D convolutions for 3D medical image segmentation. Int. J. Neural Syst. 2023, 599. doi: 10.1142/S0129065722500599
Waudby, C. J., Berg, R. L., Linneman, J. G., Rasmussen, L. V., Peissig, P. L., Chen, L., et al. (2011). Cataract research using electronic health records. BMC Ophthalmol. 11:32. doi: 10.1186/1471-2415-11-32
Zhang, X., Xiao, Z., Higashita, R., Chen, W., Yuan, J., Fang, J., et al. (2020). “A novel deep learning method for nuclear cataract classification based on anterior segment optical coherence tomography images,” in 2020 IEEE International Conference on Systems, Man, and Cybernetics (SMC) (IEEE), 662–668.
Zhao, S., Blaabjerg, F., and Wang, H. (2020). An overview of artificial intelligence applications for power electronics. IEEE Trans. Power Electr. 36, 4633–4658. doi: 10.36227/techrxiv.12431081.v2
Keywords: artificial intelligence, CNN, deep learning, OCT images, eye diseases, convolution layer
Citation: Elkholy M and Marzouk MA (2024) Deep learning-based classification of eye diseases using Convolutional Neural Network for OCT images. Front. Comput. Sci. 5:1252295. doi: 10.3389/fcomp.2023.1252295
Received: 03 July 2023; Accepted: 27 December 2023;
Published: 18 January 2024.
Edited by:
Pier Luigi Mazzeo, National Research Council (CNR), ItalyReviewed by:
Emanuele Frontoni, University of Macerata, ItalyShaista Hussain, Agency for Science, Technology and Research (A*STAR), Singapore
Copyright © 2024 Elkholy and Marzouk. This is an open-access article distributed under the terms of the Creative Commons Attribution License (CC BY). The use, distribution or reproduction in other forums is permitted, provided the original author(s) and the copyright owner(s) are credited and that the original publication in this journal is cited, in accordance with accepted academic practice. No use, distribution or reproduction is permitted which does not comply with these terms.
*Correspondence: Mohamed Elkholy, TW9oYW1lZC5FbGtob2x5LkNzQG82dS5lZHUuZWc=