- Department of Computer Science, Virginia Polytechnic Institute and State University, Blacksburg, VA, United States
Data and visualizations are powerful tools that provide insights, analysis, and conclusions in a logical and easy-to-understand manner. However, the current school curriculum lacks adequate preparation for students to understand, analyze, interpret, or create complex data visualizations, which can hinder their potential careers in data science. To address this gap, our project aimed to develop a user-friendly web-based tool that provides interactive lessons on data and visualizations for elementary school children. The website consists of 12 lessons, categorized by grade levels (1st–2nd grade, 3rd–4th grade, and 5th–6th grade), and includes an interactive question-answer section. Users can scroll down after reading the lessons and practice questions based on the visualizations. The website also has the potential to incorporate games related to data and visualization. The lessons are implemented using React.js and Java with the Spring framework, and new lessons can easily be added by storing them in a markdown folder. The website features a navigation bar with tabs for Home, Lessons, Games, About, and Contact. Additionally, a feedback form is included to gather user feedback for further improvements. The website is currently in the testing stage, and future surveys for teachers and elementary school students will be added to enhance the features provided. Our study presents preliminary findings and serves as a foundational exploration. We acknowledge that further research and experimentation are required to validate and expand upon the results discussed herein.
1. Introduction
The main objective of our work is to provide an engaging tool for kids in 1st to 6th grade to learn about data visualization. We utilize bright colors, hand-drawn cartoon pictures, and interesting lesson content to captivate their attention. The curriculum is structured differently for each grade level, catering to the unique learning needs of students at different stages. Our target audience is elementary school students, specifically grades one through six, who can independently or with the guidance of their parents and teachers learn data visualization and interact with data on our website.
Our expected deliverable is to successfully develop an online data visualization tool that offers twelve different lessons, with two lessons designed for each grade level. We also have plans for a future full website that will include all the games and data visualization lessons.
To ensure the successful development of our program, we are launching a kids' data visualization recruitment campaign. We are enrolling students from kindergarten through fifth grade, along with their parents, who reside in the NRV area of Virginia to participate in our Virginia Tech study. During the event, kids will try out different lessons to learn data visualization, and parents will provide their feedback through a “parent permission” form and a survey about their kids' experiences. This interaction with the system will help us further refine and expand our courses and games. We have already obtained IRB approval for these activities, and we anticipate possible future extensions to the system.
In this paper, we present initial findings from our ongoing research into data visualization for kids. It is important to note that our work is preliminary, and this study represents the initial stage of a more comprehensive research effort. Subsequent papers will delve deeper into the details and provide more robust conclusions.
2. Related work
Previous studies have utilized workshops as a means to enhance data visualization literacy for children, including teaching them how to identify and name different types of charts and graphs. These workshops often involved showing children various types of graphs and providing them with opportunities for hands-on sketching and games, which were found to promote their enthusiasm for learning (Schwabish, 2020). Similarly, a half-day tutorial on data science was conducted for children in grades 5–9 (ages 10–15) to expose them to the entire data science cycle, including data collection, data visualization, model building, and testing. However, the researchers faced challenges in finding suitable datasets that were interesting and understandable for the target age group and concluded that datasets with no more than 3–4 independent variables would be ideal to teach essential data science skills while minimizing computational complexity (Srikant and Aggarwal, 2017).
In recent studies, Scratch, a visual programming tool, has been used to help children build narratives and create visual-based stories. However, these studies had limitations such as a small sample size and assumed that the students already had the necessary storytelling skills but lacked the tools for illustration (Whyte et al., 2019; Gonzalez-Maldonado et al., 2022). Another tool called Viscuit, which is a visual image rewriting tool, was used to teach elementary school students computational thinking. However, the study found that the complexity and sophistication of concepts that children of different ages can understand and implement varies, with conditional programming being too complex for students aged 4–6 years. Despite this, the study showed that children were able to grasp computational thinking through assignments and simple movements to illustrate their narratives (Watanabe et al., 2020).
Another approach involved the creation of an app called “C'est La Vis” which aimed to teach kids how to interpret visualizations of data. The researchers used a concreteness fading approach, where they transcribed data visualizations from textbooks into their tool and classified them into different degrees of abstraction. Although the sample size was small and limited to one elementary school, the findings were encouraging as teachers reported that students were engaged with the app, although verbalization of knowledge was challenging for younger students. The researchers concluded that the tool was successful and had the potential for further improvement (Alper et al., 2017).
Using the open-source programming tool Scratch, researchers developed Scratch Community Blocks, which added data science functionality to aid in teaching kids data science. The central design goal of the project was to empower children as data scientists and enable them to ask and answer their own questions using data. While the researchers focused on teaching programming, mathematical, and critical-thinking concepts rather than data visualization, they added specific Blocks to assist with data analysis tasks, such as a “for-each” block for iteration. Initial user feedback was positive, with users reporting high engagement, although the project lacked documentation and responsiveness. Nevertheless, the researchers concluded that their tool has the potential to reduce barriers to entry for young data scientists in an engaging manner (Dasgupta and Hill, 2017).
In a pilot study conducted in Brazil, researchers utilized the Data-viewer Scratch Extension tool to better understand programming learning trajectories in data science. They provided access to the tool to four students aged eleven to thirteen and monitored their interactions. The researchers developed a tool that analyzed the students' screen activity to determine their grasp of the task based on the number of blocks used, presence of actual functions, pace of progress, and attempts at debugging. Despite the small sample size, the researchers found their tool promising in assessing students' progress (Fernandez et al., 2022).
In India, data science courses are offered to computer science undergraduate students in their later semesters, to get first-year undergraduate students experienced in data science without taking the proper requisite courses. To address this issue, researchers have developed a tool called MetaData to abstract away all the implementation and technical details, enabling a better teaching of the bare brass concepts. MetaData is designed to help faculties teach data science to first-year students, with a simplified design that allows first-year undergrads to appreciate concepts in data science with a mathematical and statistical understanding as rudimentary as high school. MetaData enables users to preview and report the data being analyzed, and offers a learning module to help familiarize users with the tool. Overall, students who used the tool had positive interactions with it, with little variability within the data. However, due to its focus on first-year computer science undergraduates, it implies some programming, math, and statistics background is necessary, making it potentially unsuitable for children. Nevertheless, the idea is novel and can be built upon for further development (Nair et al., 2020).
This paper focuses on designing novel learning environments to help demystify machine learning technologies for K-12 students, and investigating opportunities for maximizing machine learning accessibility through integration with STEM education. The researchers have developed the SmileyCluster tool to better teach children in grades K-12 about machine learning. SmileyCluster is a hands-on collaborative learning environment that utilizes glyph-based data visualization and superposition comparative visualization to assist in learning an entry-level machine learning technology, specifically k-means clustering. Initial findings show that SmileyCluster led to an increased understanding of machine learning concepts and practices, as observed in a sample of high schoolers in a pre-college summer program. The paper presents results that demonstrate participants' improved understanding of key machine-learning concepts after using the tool and also highlight the engagement of students in meaningful scientific inquiry through in-app discussions. The researchers express their findings as promising and plan to continue further development (Wan et al., 2020).
The Kids as Global Scientists Project explores the learning potential of emerging web-affiliated tools, including professional conferencing software, Java Applets for real-time weather imagery, and online classroom activities that are continuously updated with new scientific information. Students use their own data collection devices and visualization software to collect, share, and analyze real and near-time data, as well as interpret and use infrared and visible satellite imagery, temperature, and wind vector maps weather animation to predict the path of a recent hurricane and interpret the degree of damage while developing scientific explanations of the occurrence. This provides a great opportunity for evaluating, discussing, and analyzing dynamic and currently-occurring science (Churach, 1999).
Using visualizations with color and visual cues can help students understand fundamental database concepts, including relational databases, querying, and designing. The learning tools emphasize the customization of visualizations for various STEM disciplines, enabling teachers in diverse disciplines to customize the content of example data, supporting text, and formative assessment questions to promote relevance to their students. The tools have a positive impact on conceptual learning as well as attitudes toward learning databases (Dietrich et al., 2021).
Because our main target group includes children, as children, what we want to give is not esoteric knowledge but encouragement for continued learning. We can encourage children to continue learning through a variety of media interactions including learning outcomes, assessment, guidance, and encouraging recording. At the same time, many learning resources are not open source, sometimes it is difficult to access or change the resources. What is more important for children's learning methods is to be open and free to use their own imagination and opinions.
3. Existing data visualization systems
Children lack a foundational understanding of data analysis, which raises the question of how to introduce them to the world of data. One effective approach is to provide them with hands-on experiences through interactive games based on Tableau workbooks. Activity 1 involves counting and analyzing the colors of candies in a bag of M&M's, calculating their probabilities, and strengthening their foundational skills. Activity 2, titled “Find the Perfect Dog,” encourages kids to view and interact with data to solve problems, such as determining the ideal dog type for a hypothetical future owner. This activity facilitates exploratory data analysis (EDA), where kids can examine various attributes of different dog breeds, such as lifespan, compatibility with children, hair type, height, weight, and more.
Furthermore, knolling, which is the natural tendency of some children to arrange physical objects in an orderly manner, can be leveraged as a teaching tool for data visualization, data handling, and data cleaning concepts in a simplified form. By utilizing this innate habit of young learners, data-related concepts can be introduced in a visually appealing and engaging manner, without requiring prior knowledge of computer science. Activities that incorporate knolling as a teaching strategy have the potential to effectively educate the younger generation about data-related concepts.
In addition, digital resources such as ccssgames.com have proven to be highly valuable for digital education. This website offers data games that enable kids to analyze saved data and develop math and data skills while also enjoying the process of playing games. The website provides short videos that explain how to play each game and use data from gameplay to develop winning strategies. This contextual approach makes math and statistics relevant and motivating for kids, while also providing teachers with resources related to various topics, such as two-way tables, conditional probability, linear and quadratic models, and rational expressions of polynomials.
Another noteworthy resource is Topmarks, a UK-based company that offers exceptional educational online resources for children. With a focus on math and literacy, Topmarks provides tools for kids to practice multiplication tables, mental math, problem-solving, and handwriting. The website offers engaging and safe learning experiences, including a handwriting presentation tool that allows kids to practice calligraphy on the computer screen. Topmarks is a comprehensive learning resource that effectively engages children and facilitates learning through play.
Finally, Search Educational Resources provides printable worksheets, games, and guided lessons, with a specific emphasis on graphical representations of basic mathematical operations and data tables. The website offers over 30 games categorized by grade level and subject, with graphical representations of simple data tables and 2D images for upper grades. The lessons cover a wide range of subjects, with multiple subtopics presented through engaging graphical games.
4. Our system: KiData system
Our platform is specifically designed to offer interactive and engaging lessons on data visualization for elementary school students. It offers a wide range of lesson plans, games, and quizzes that cover topics such as bar graphs, pie charts, and fundamental mathematics. Our lessons are carefully curated to help students develop their data literacy and critical thinking skills in a fun and engaging way.
To create an inviting learning environment, we have chosen a bright color scheme and designed the system with React.js and Java using the SpringBoot framework. Our team of Virginia Tech students, under the guidance of an expert in Computer Science Digital Education, has developed the system to provide a user-friendly and secure experience for young learners. We regularly update and maintain the website to ensure its relevance and effectiveness.
One of our key features is the curated set of lessons that are tailored to hone in on specific skills and further instill these abilities. We understand the importance of providing a safe and accessible learning experience, which is why our platform is available for free and can be accessed from any device with an internet connection.
4.1. Home page
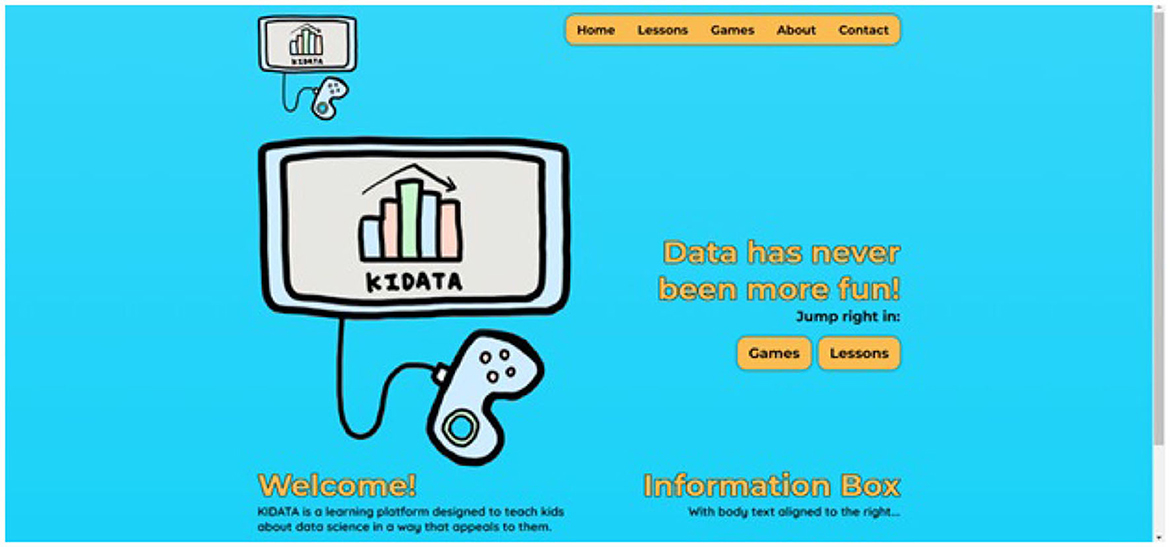
The enlarged image is our logo. The screen shows the data and the system's name, “KIDATA” (Figure 1). The gamepad and cable are like a “K.” There is a navigation bar at the top where users can go to the Home page, Lessons page, Games page, About page, and Contact page. Since our site primarily lets kids learn about data visualization and keeps them interested, there are quick shortcuts to Games and Lessons on the right side of the logo.
4.2. About page
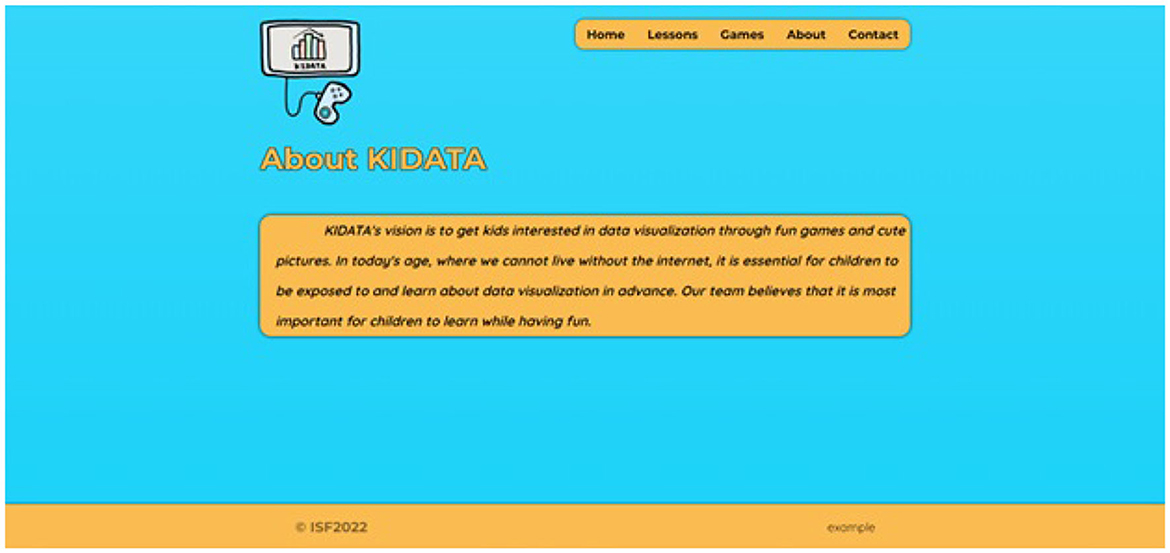
We give a brief introduction or overview of the website and its purpose on the About page (Figure 2).
4.3. Lesson page
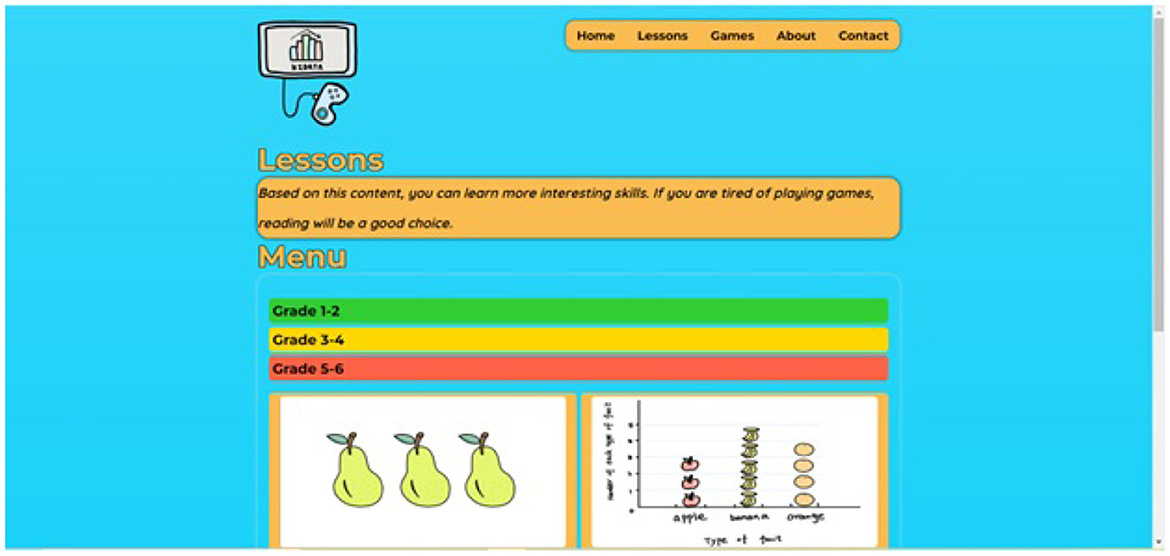
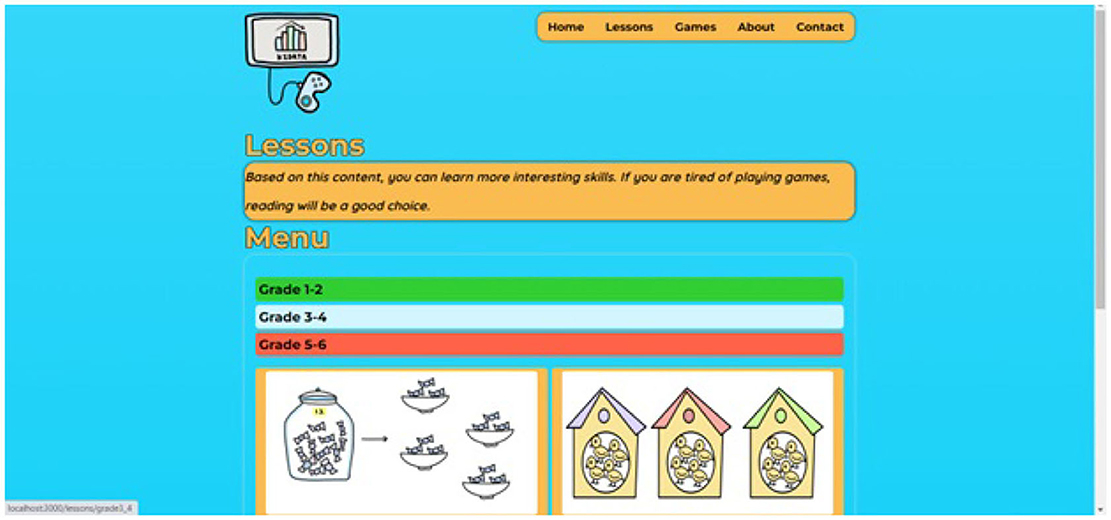
At the top of the lesson, the list is a concise introduction to the Lesson page (Figure 3). In the Lesson list, grades one through six are divided into grades one through two, three through four, and five through six. A preview of the Lessons and their names are displayed below the Lesson list (Figure 4).
4.3.1. When we open the lessons successfully
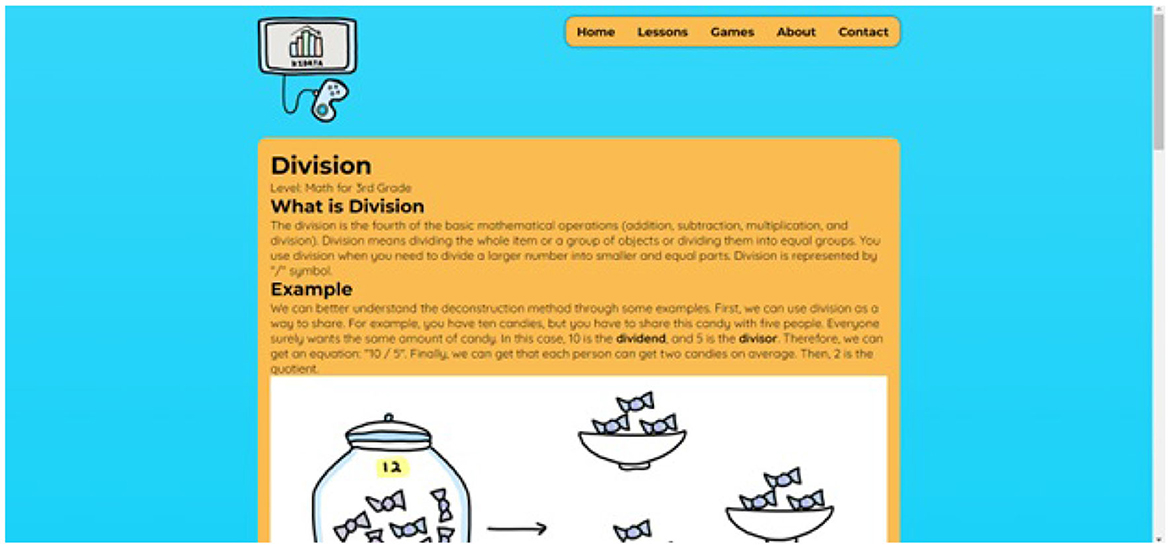
The lessons' content page will be displayed when we click on the lessons' names (Figure 5). Lessons are written by us in markdown files and then rendered out from the back end. We are engaging kids with color and fun graphics, so each lesson will contain cartoon pictures drawn by our hands. The cartoons not only help children understand the text of the lessons better but also keep them from being disinterested in data visualization by the dense text.
4.3.2. While the lesson is being loaded
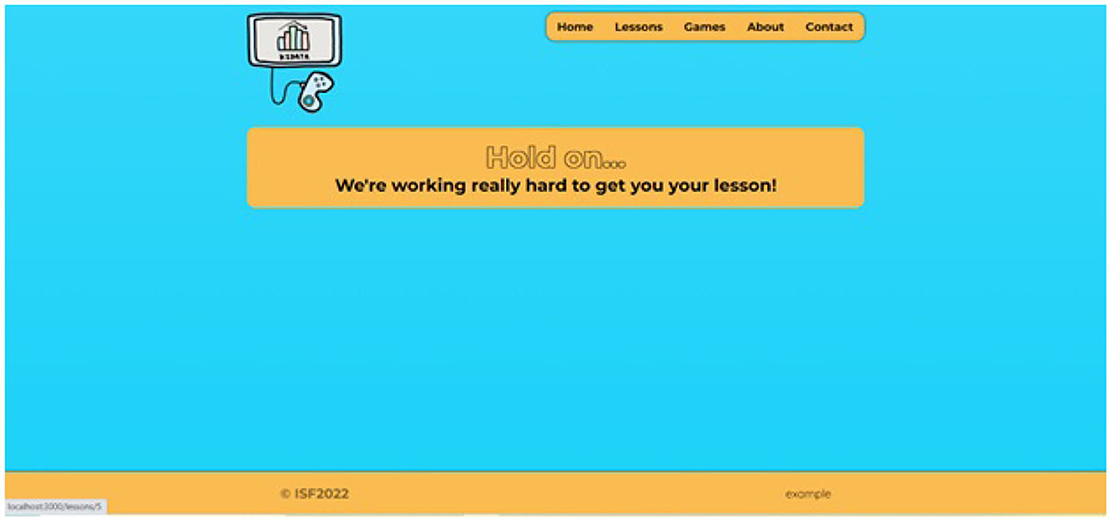
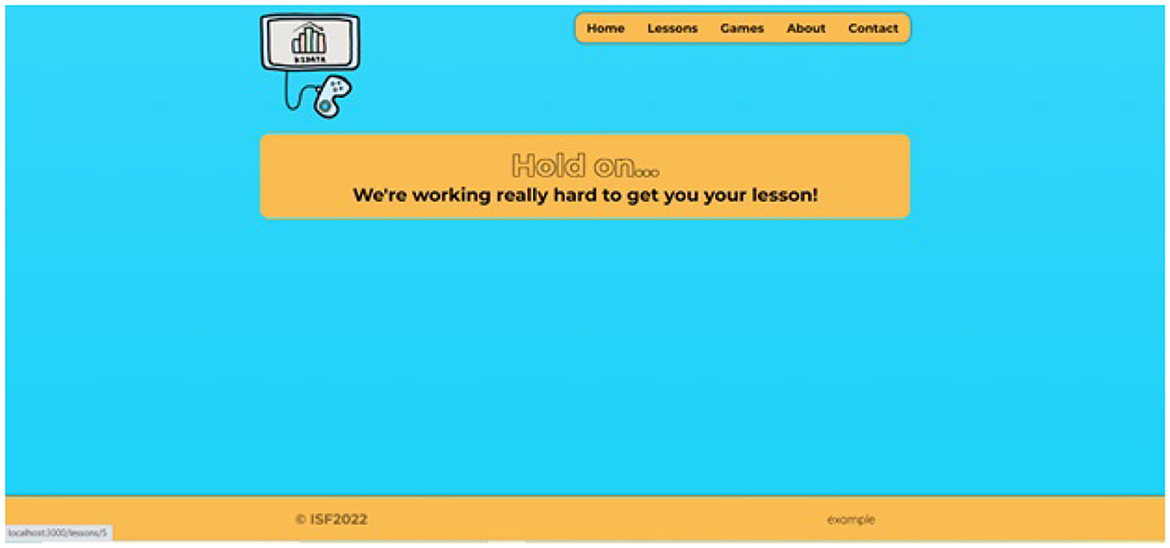
It is not necessary for a website to display anything while the content is being loaded (Figure 6). However, we believe it can be beneficial in terms of user experience. Users expect the content to load quickly and smoothly when they visit our website. If the content takes too long to load, the user may become frustrated and leave the website. Therefore, displaying something while the content is being loaded can help to keep the user engaged and reduce the likelihood of them abandoning the website. When kids click on a lesson, this loading page will be displayed.
4.3.3. Fail to load the lesson
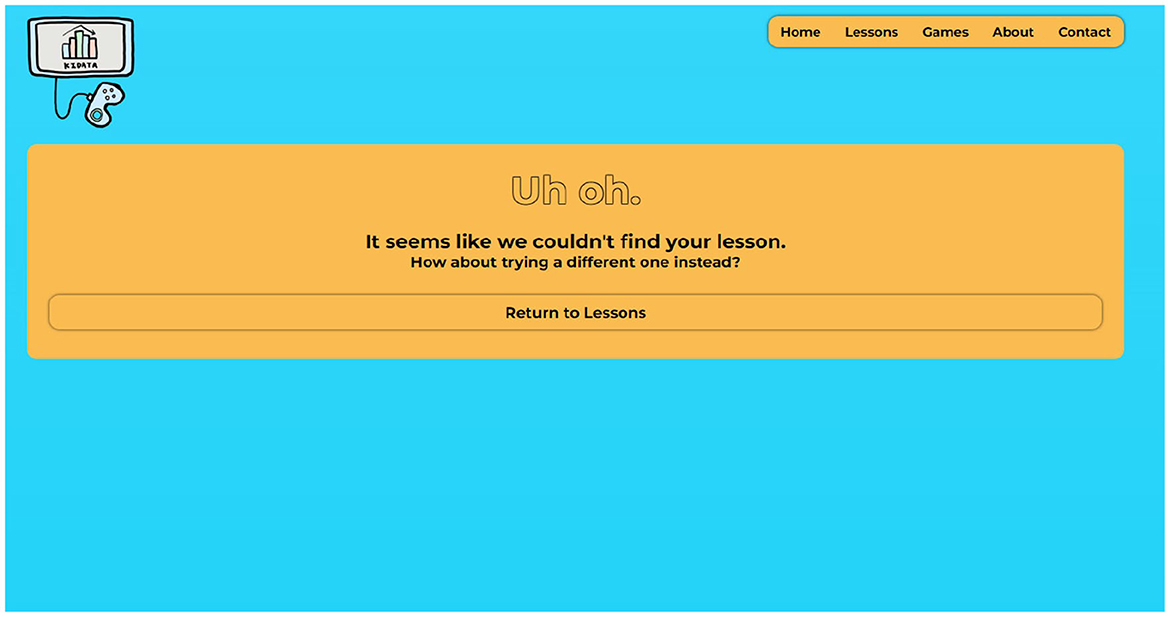
This page is displayed when there is an error in our system or when lessons are missing to appear (Figures 7, 8). And below the explanation is a shortcut button to help kids return to the Lesson page.
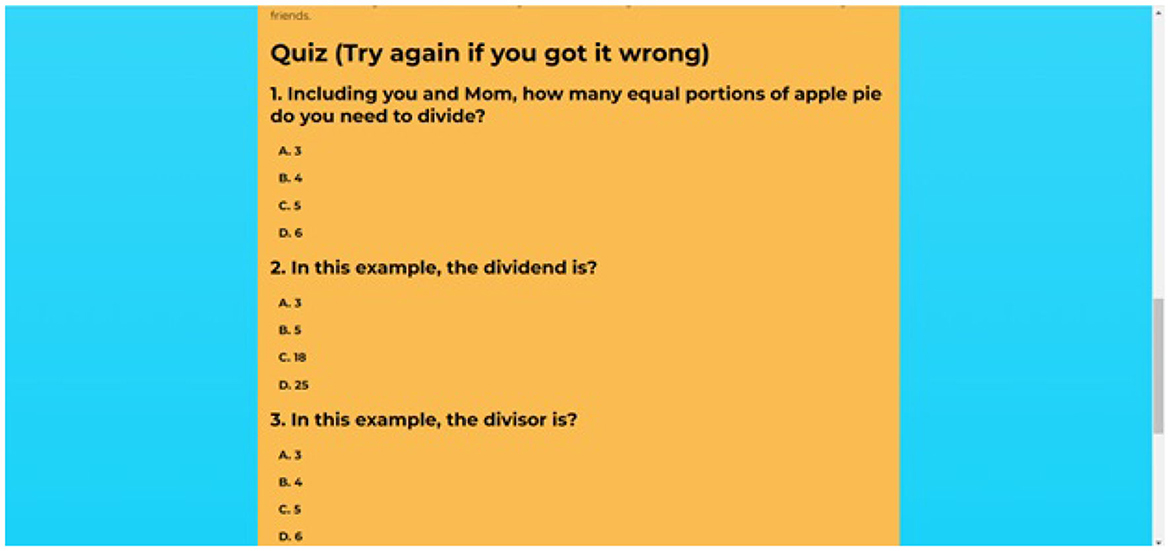
4.3.4. Quiz under the lessons
There is basically this quiz under each lesson (Figure 9).
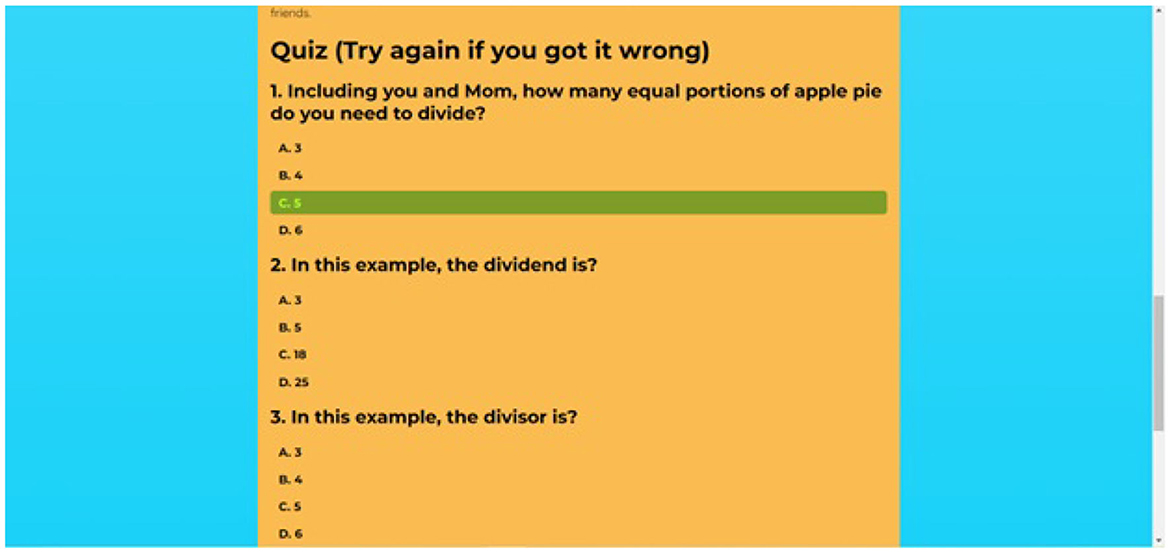
4.3.5. When kids click the correct answer!
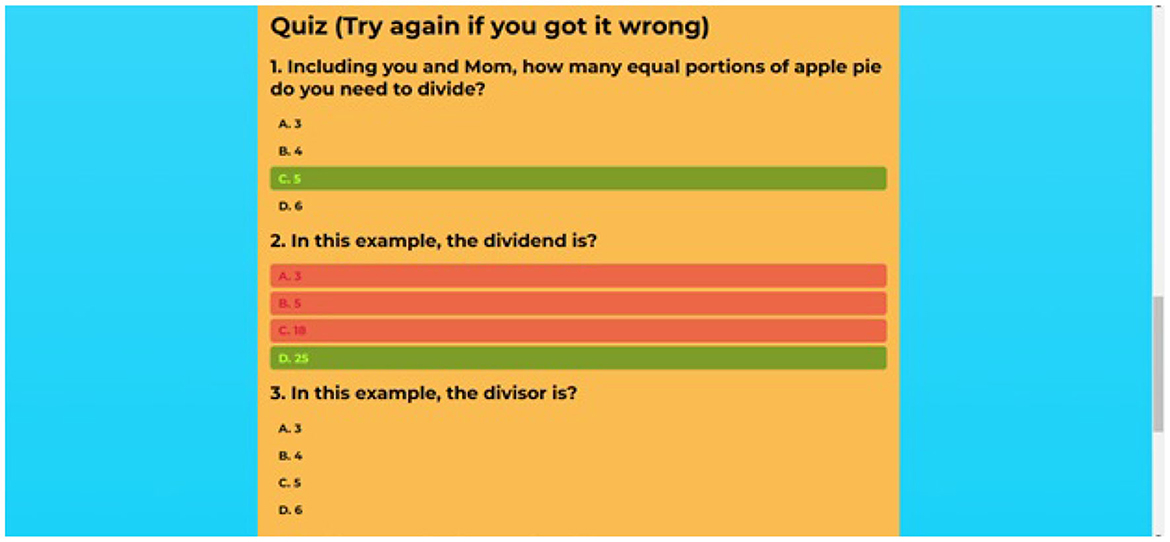
When children select the correct answer, then our system will present that choice in green (Figure 10).
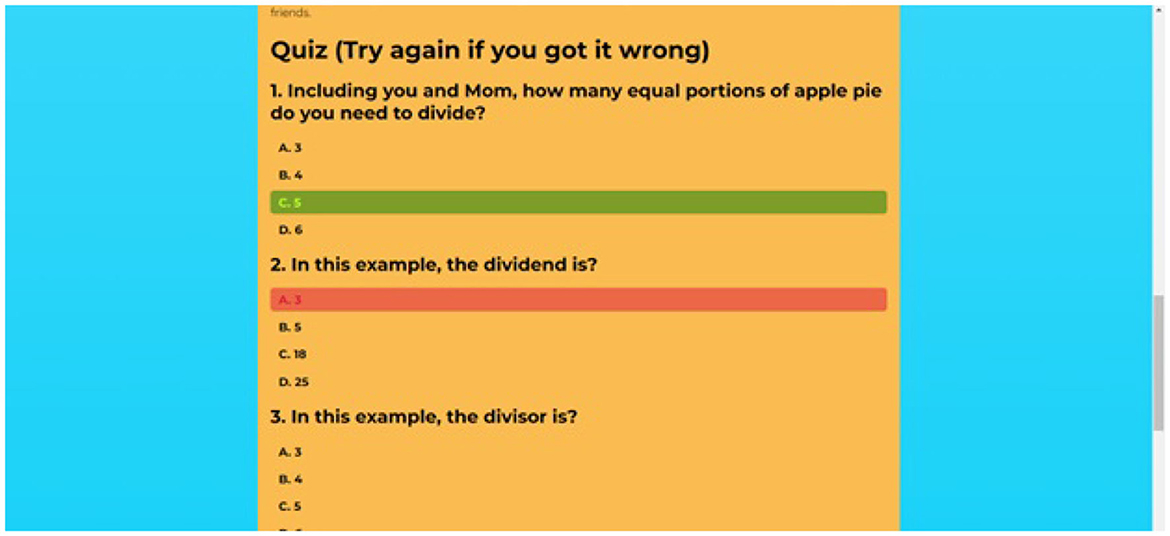
4.3.6. When kids click the wrong answer!
When children select the wrong answer, then our system will present that choice in red (Figure 11).
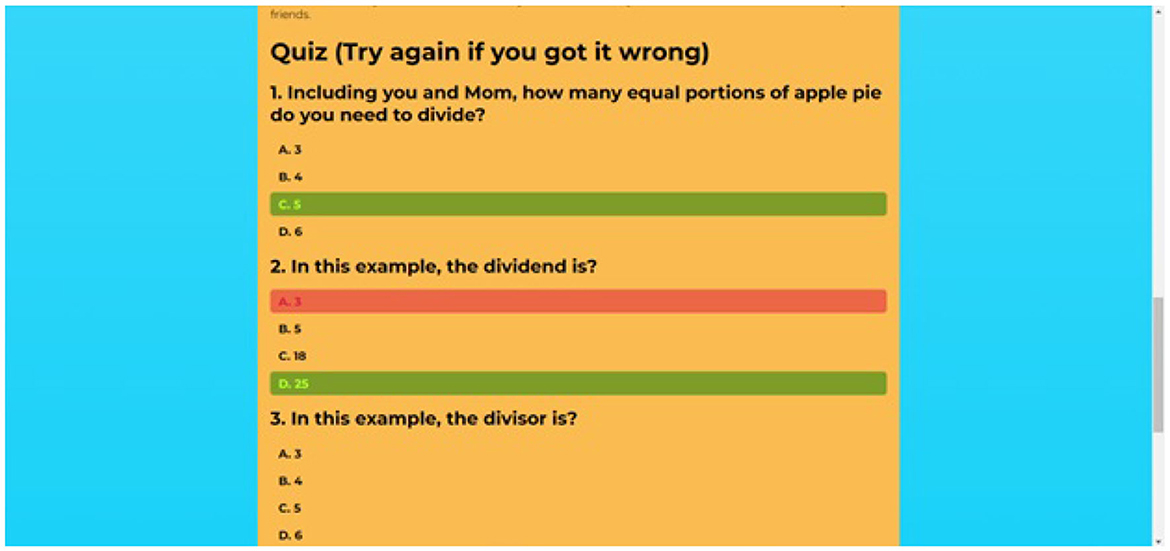
4.3.7. All answers can be shown they are correct or wrong
Even if kids choose wrong the first time, they can still continue to click on other answers. Finally, the red and green colors will distinguish the right answers from the wrong ones (Figures 12, 13).
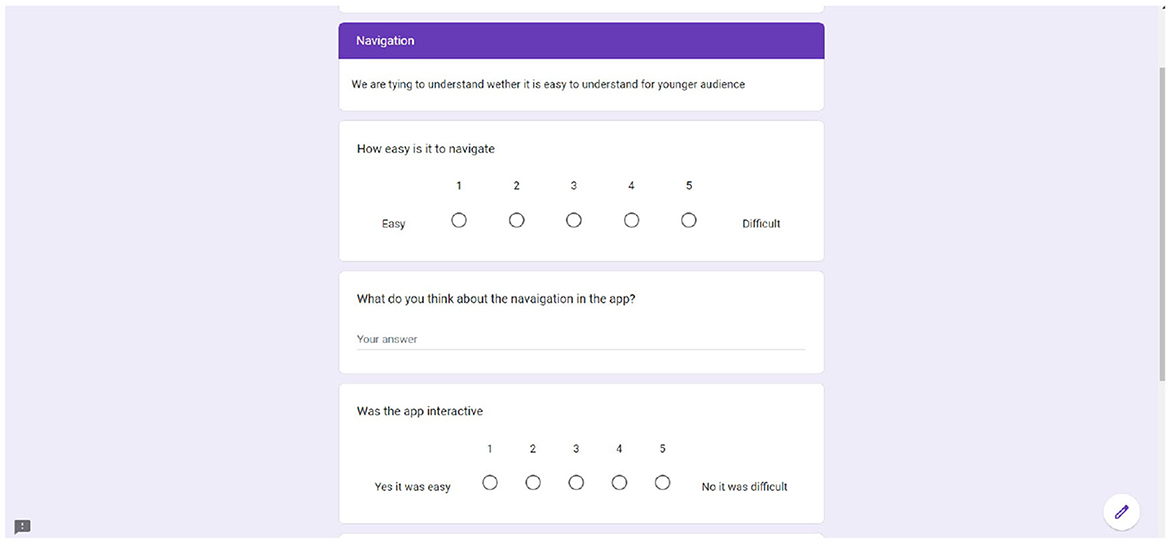
4.3.8. Feedback
See Figure 14 for feedback.
5. Methodology
5.1. Research and planning
The first step in the development of the website was to conduct thorough research on the topic of data visualization and the target audience. This involved studying various data visualization techniques and tools, as well as analyzing the learning needs and preferences of elementary school kids. Based on the research findings, appropriate content and tools were selected for the website.
5.1.1. Design and development
The website was designed with a user-friendly interface and interactive features to engage and educate young users. This involved creating a visual layout for the website and incorporating interactive elements, such as games and quizzes, to make the learning experience fun and engaging. React.js was used for the front end, as it is a popular and efficient JavaScript library for building user interfaces. Java with SpringbBoot (Restful API) was used for the backend, as it provides a powerful and secure platform for building web applications.
5.1.2. Testing and evaluation
After the website was developed, it was tested for functionality and user experience. This involved conducting usability tests with a sample group of elementary school kids to evaluate the effectiveness and relevance of the website. The feedback collected from the tests was used to identify and fix any issues or improve the website.
5.1.3. Launch and maintenance
Once the website was tested and evaluated, it was launched for use by the target audience. The website is regularly maintained to ensure its functionality and relevance to the target audience. This involves monitoring the website for any technical issues, updating the content to keep it current and relevant, and incorporating new features and tools based on user feedback.
Overall, the methodology used in the development of the data visualization education website for elementary school kids was focused on creating a fun and engaging learning experience for young users. This involved conducting research, designing and developing a user-friendly interface, testing and evaluating the website, and maintaining its functionality and relevance over time.
The system will be tested on elementary school kids and we are going to seek feedback from elementary school teachers. The results will be reported in a future study.
6. Conclusion
In conclusion, the methodology employed in the development of the data visualization education website for elementary school kids followed a systematic approach, encompassing research, design, development, testing, and ongoing maintenance. The key steps included:
1. Research and planning: Thorough research was conducted on data visualization and the target audience's learning needs. This informed content and tool selection for the website.
2. Design and development: The website was designed with a user-friendly interface and interactive features to engage young users. React.js and Java with Spring Boot were utilized for front-end and back-end development, respectively.
3. Testing and evaluation: The website underwent rigorous testing to ensure functionality and user-friendliness. Usability tests were conducted with elementary school kids to gather feedback and make necessary improvements.
4. Launch and maintenance: After successful testing and evaluation, the website was launched for the target audience. Ongoing maintenance ensures its continued relevance and functionality.
Looking forward, the system will be further evaluated by elementary school kids, and feedback will be sought from elementary school teachers in a future study. This iterative approach underscores our commitment to refining and enhancing the educational experience, with the ultimate goal of providing a valuable resource for young learners in the field of data visualization.
In conclusion, it is essential to emphasize that our work is ongoing, and the results presented here are not exhaustive. We intend to follow up with more comprehensive research to confirm and refine our findings, contributing to a more thorough understanding of best practices to teach elementary school kids data visualization concepts.
Data availability statement
The original contributions presented in the study are included in the article/supplementary material, further inquiries can be directed to the corresponding author.
Ethics statement
We are approved by the Virginia Tech Human Research Protection Program (HRPP). We have not conducted human trials at the time of this documentation but are planning to conduct small scale tests for the tool.
Author contributions
All authors listed have made a substantial, direct, and intellectual contribution to the work and approved it for publication.
Acknowledgments
We would like to thank our Instructor and Client SH, for working with us throughout the semester, and consistently giving feedback that helped us take better decisions for the project. We would like to thank the kids and their parents on which the website was being tested.
Conflict of interest
The authors declare that the research was conducted in the absence of any commercial or financial relationships that could be construed as a potential conflict of interest.
Publisher's note
All claims expressed in this article are solely those of the authors and do not necessarily represent those of their affiliated organizations, or those of the publisher, the editors and the reviewers. Any product that may be evaluated in this article, or claim that may be made by its manufacturer, is not guaranteed or endorsed by the publisher.
References
Alper, B., Riche, N. H., Chevalier, F., Boy, J., and Sezgin, M. (2017). “Visualization literacy at elementary school,” in Proceedings of the 2017 CHI Conference on Human Factors in Computing Systems, CHI '17 (New York, NY: Association for Computing Machinery), 5485–5497. doi: 10.1145/3025453.3025877
Churach, D. N. (1999). Internet Usage in Science Classrooms in Hawaii Catholic High Schools [PhD thesis]. Bentley, WA: Curtin University.
Dasgupta, S., and Hill, B. M. (2017). “Scratch community blocks: supporting children as data scientists,” in Proceedings of the 2017 CHI Conference on Human Factors in Computing Systems, CHI '17 (New York, NY: Association for Computing Machinery), 3620–3631. doi: 10.1145/3025453.3025847
Dietrich, S. W., Goelman, D., Broatch, J., Crook, S., Ball, B., Kobojek, K., and Ortiz, J. (2021). Introducing databases in context through customizable visualizations. Front. Educ. 355, 719134. Frontiers. doi: 10.3389/feduc.2021.719134
Fernandez, C., Freitas, J. A., Lopes, R. D., and Blikstein, P. (2022). “Using video analysis and learning analytics to understand programming trajectories in data science activities with Scratch,” in Interaction Design and Children, IDC '22 (New York, NY: Association for Computing Machinery), 253–260. doi: 10.1145/3501712.3529742
Gonzalez-Maldonado, D., Pugnali, A., Tsan, J., Eatinger, D., Franklin, D., and Weintrop, D. (2022). “Investigating the use of planning sheets in young learners' open-ended scratch projects,” in Proceedings of the 2022 ACM Conference on International Computing Education Research-Volume 1 (New York, NY: ACM), 247–263. doi: 10.1145/3501385.3543972
Nair, R., Chugani, M. N., and Thangavel, S. K. (2020). “MetaData: a tool to supplement data science education for the first year undergraduates,” in Proceedings of the 2020 8th International Conference on Information and Education Technology, ICIET 2020 (New York, NY: Association for Computing Machinery), 153–160. doi: 10.1145/3395245.3396409
Schwabish, J. (2020). “Teaching data visualization to kids,” in VisActivities: IEEE VIS Workshop on Data Vis Activities at IEEE VIS, volume 2020.
Srikant, S., and Aggarwal, V. (2017). “Introducing data science to school kids,” in Proceedings of the 2017 ACM SIGCSE Technical Symposium on Computer Science Education (New York, NY: Association for Computing Machinery), 561–566. doi: 10.1145/3017680.3017717
Wan, X., Zhou, X., Ye, Z., Mortensen, C. K., and Bai, Z. (2020). “SmileyCluster: supporting accessible machine learning in K-12 scientific discovery,” in Proceedings of the Interaction Design and Children Conference, IDC '20 (New York, NY: Association for Computing Machinery), 23–35. doi: 10.1145/3392063.3394440
Watanabe, T., Nakayama, Y., Harada, Y., and Kuno, Y. (2020). “Analyzing viscuit programs crafted by kindergarten children,” in Proceedings of the 2020 ACM Conference on International Computing Education Research (New York, NY: Association for Computing Machinery), 238–247. doi: 10.1145/3372782.3406253
Whyte, R., Ainsworth, S., and Medwell, J. (2019). “Designing for integrated k-5 computing and literacy through story-making activities,” in Proceedings of the 2019 ACM Conference on International Computing Education Research (New York, NY: Association for Computing Machinery), 167–175. doi: 10.1145/3291279.3339425
Keywords: kids, data visualization, elementary school, CS teaching, data analysis, kids lessons
Citation: Hamouda S, Kancharla S, Singh G, Yang L, Wang Z, Zhang S, Nirjhar R and Golden J (2023) KiData: simple data visualization tool for future data scientists. Front. Comput. Sci. 5:1209515. doi: 10.3389/fcomp.2023.1209515
Received: 20 April 2023; Accepted: 04 October 2023;
Published: 23 October 2023.
Edited by:
Tom Crick, Swansea University, United KingdomReviewed by:
Mohamed Mostafa, Jiva AI for Healthcare, United KingdomNabila Khodeir, Electronics Research Institute, Egypt
Copyright © 2023 Hamouda, Kancharla, Singh, Yang, Wang, Zhang, Nirjhar and Golden. This is an open-access article distributed under the terms of the Creative Commons Attribution License (CC BY). The use, distribution or reproduction in other forums is permitted, provided the original author(s) and the copyright owner(s) are credited and that the original publication in this journal is cited, in accordance with accepted academic practice. No use, distribution or reproduction is permitted which does not comply with these terms.
*Correspondence: Sally Hamouda, c2hhbW91ZGFAdnQuZWR1
 Sally Hamouda
 Sahith Kancharla
 Gurkirat Singh
 Lin Yang
 Siliang Zhang
 Raseen Nirjhar
 John Golden