 Carlos Casanova
 Esteban Schab
 Lucas Prado
 Giovanni Daián Rottoli
- Computational Intelligence and Software Engineering Research Group, Information Systems Department, Concepción del Uruguay Regional Faculty, National Technological University, Concepción del Uruguay, Entre Ríos, Argentina
Introduction: When solving multi-objective combinatorial optimization problems using a search algorithm without a priori information, the result is a Pareto front. Selecting a solution from it is a laborious task if the number of solutions to be analyzed is large. This task would benefit from a systematic approach that facilitates the analysis, comparison and selection of a solution or a group of solutions based on the preferences of the decision makers. In the last decade, the research and development of algorithms for solving multi-objective combinatorial optimization problems has been growing steadily. In contrast, efforts in the a posteriori exploration of non-dominated solutions are still scarce.
Methods: This paper proposes an abstract framework based on hierarchical clustering in order to facilitate decision makers to explore such a Pareto front in search of a solution or a group of solutions according to their preferences. An extension of that abstract framework aimed at addressing the bi-objective Next Release Problem is presented, together with a Dashboard that implements that extension. Based on this implementation, two studies are conducted. The first is a usability study performed with a small group of experts. The second is a performance analysis based on computation time consumed by the clustering algorithm.
Results: The results of the initial empirical usability study are promising and indicate directions for future improvements. The experts were able to correctly use the dashboard and properly interpret the visualizations in a very short time. In the same direction, the results of the performance comparison highlight the advantage of the hierarchical clustering-based approach in terms of response time.
Discussion: Based on these excellent results, the extension of the framework to new problems is planned, as well as the implementation of new validity tests with expert decision makers using real-world data.
1. Introduction
The ISO/IEC/IEEE Software and Systems Engineering Vocabulary (SEVOCAB) defines software engineering as the application of a systematic, disciplined, quantifiable approach to the development, operation, and maintenance of software; that is, the application of engineering to software (Bourque and Fairley, 2014). The scientific community has been making an effort for a realistic definition of software engineering problems. The first step in any scientific methodology is problem definition. Without a proper definition of the problem, there is a risk of finding an elegant solution to a problem that does not exist. Some common characteristics that can be identified particularly in software engineering problems are (Harman et al., 2012):
• There is a need to balance objectives that compete against each other, that is, the problems are classified as multi-objective optimization problems.
• There is a need to deal with incomplete, imprecise, or inconsistent information from the formulation of the problems. This scenario is typical in human environments.
• There are many potential solutions, usually characterized by a combinatorial explosion of decision variables.
In this context, Search-Based Software Engineering (SBSE) is a discipline that aims to help software engineers build high quality software through the application of search methods (Harman and Jones, 2001). Solving this kind of problems is a computationally intensive task, requiring specialized algorithms to deal with them. A particular type of these algorithms is preference-based algorithms, which incorporates human preferences, intuition, emotion or psychological aspects in the optimization process (Takagi, 2001). The preferences are provided by the Decision Maker (DM). These preferences allow the algorithm to make focus on regions of interest for the DM.
The application of preference-based approaches to multi-objective optimization in the context of software engineering (SE) problems has become especially relevant since the work by Ferreira et al. (2017), where Preference-based SBSE (PSBSE) is presented. PSBSE can be defined as the SBSE sub-research field devoted to the application of preference and search-based algorithms to solve SE problems. PSBSE approaches refer to the incorporation of the user preferences in the solution generation process, as illustrated in Figure 1. So, to the usual three main components of the SBSE approach, i.e., (i) a representation of the problem, to allow its manipulation by the search algorithm; (ii) a set of manipulation operators; and (iii) a fitness function to evaluate the quality of the solutions, which generally rely on software metrics, it is required a fourth element for a PSBSE: (iv) a way to incorporate the DM's preferences (Ferreira et al., 2017).
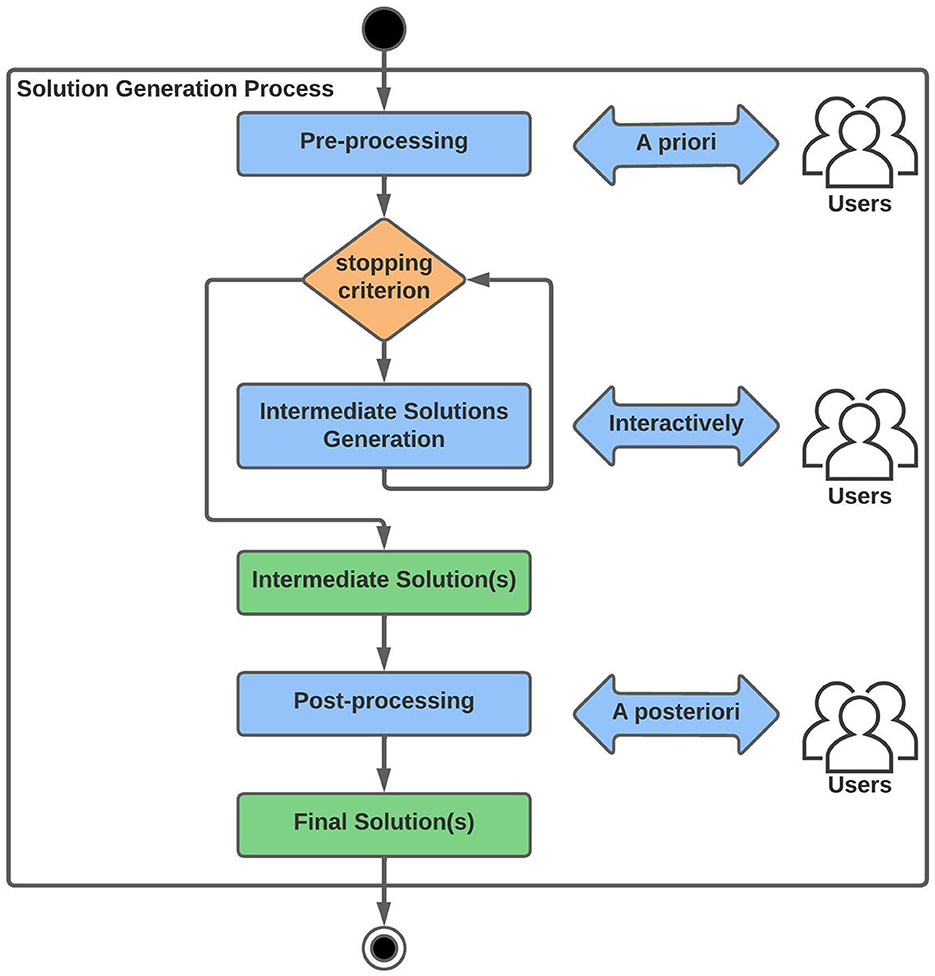
Figure 1. PSBSE framework, adapted from Ferreira et al. (2017).
The details of how and when preferences are incorporated into a search algorithm are left for the Section 2.2. Relevant references to representatives of the various approaches are included in Section 5.1. They are not included here so as not to make this contextual introduction too long. Briefly, however, it can be said that the earlier in search the preferences are incorporated, the faster the algorithms move toward the region of interest represented by the preferences.
Nonetheless, DMs may not have a prior bias toward where to direct the search, or may not have a direct way of translating their preferences. In this scenario, an alternative may be to explore the solution space to try to recognize a solution that satisfies the DM's preferences, following the “I'll know it when I see it” principle. The drawback is, without preference information, search algorithms can only use much weaker forms of comparisons, such as the dominance relation. The expected result of a dominance-based algorithm is a Pareto front, that is, a set of solutions not dominated by any other (found) solution. However, a Pareto front can contain many solutions. Hence, a systematic approach to this Pareto front exploration is necessary.
It is worth mentioning that, although the motivation here arises from the line of search-based software engineering, the difficulty in exploring Pareto fronts is not unique to it, so the contributions presented in this paper can be generalized with minimal effort.
According to the classification proposed in Wieringa et al. (2006), this paper presents a Proposal of Solution to help DMs choose a solution or a group of solutions of a multi-objective combinatorial optimization problem according to their preferences by exploring the Pareto front of the problem of interest. The first part contains the design of an abstract process for Pareto front exploration based on hierarchical clustering concepts. In order to apply this type of clustering algorithm, a similarity measure between solutions is required. Then, the extension of the proposed framework for the Bi-objective Next Release Problem (NRP) is described. Here a structural similarity measure is defined for NRP solutions, that is, a measure that not only takes into account the values of the objectives (basically, cost and profit) but also the requirements to be implemented and the stakeholders to be satisfied. Finally, a realization of the extension is shown in the form of a web-based dashboard, which is used on a semi-synthetic NRP instance for demonstration purposes. With this instance, an empirical study was performed in order to show that the dashboard is effective for what it was designed to do.
The rest of the paper is organized as follows. Section 2 presents the theoretical framework for this work. Section 3 introduces the problem that has been addressed. Section 4 describe the framework proposed as a solution for that problem and demonstrate how that proposal works on a concrete case. Section 5 discusses the design and compares it with the state of the art. Section 6 lists threats to validity. Lastly, in Section 7, conclusions and future works are presented.
2. Background
2.1. Mono and multi-objective optimization
A commonly used optimization approach consists in selecting as objective function one of the system's attributes and using it to define the (total) order of preferences of the feasible solutions, resulting in a mono-objective problem. The rest of the attributes are modeled in some other way, e.g., as constraints.
Formally, an optimization problem instance can be seen as a pair (S, f), where S is the feasible solution set (also called search space) and f is a mapping f:S → ℝ that has to be maximized (or minimized) (Papadimitriou and Steiglitz, 1998). Using a mathematical programming-fashioned notation, an optimization problem instance can be stated as
An optimal solution to (S, f), assuming the maximization case, is a solution s* such that ∀s∈S, f(s*)≥f(s).
As an example, consider the next release problem (Bagnall et al., 2001), where a subset of requirements and customers that maximize profit has to be selected from an n-requirement set and m-customer set, subject to a budget constraint. This problem can be stated using the structure shown in Equation 1 as follows.
Let R = {r1, r2, …, rn} be a requirement set and C = {c1, c2, …, cm} a customer set. Let ui be the utility associated to each customer ci, and ej the cost associated to each requirement rj. Also let xj and yi be binary variables where xj = 1 means that the requirement rj is selected to be implemented in the next release, and xj = 0 otherwise. Moreover, yi = 1 means that all the requirements in which the customer ci is interested are implemented, yi = 0 otherwise. Let p be a scalar representing the available budget. Furthermore, let Prec⊆R2 be a precedence relation between requirements, where each pair (r1, r2) in the relation represents that the requirement r1 must be implemented if the requirement r2 is selected for being included in the next release. Finally, let Int⊆R×C be a binary interest relation, where each pair (r, c) represents that customer c is interested in requirement r. An instance of the next release problem is, hence, a pair (S, f), where f is to be maximized, and
Using a mathematical programming notation:
This NRP problem is reducible to the knapsack problem (Bagnall et al., 2001) and therefore constitutes an NP-hard optimization problem.
On the other hand, the multi-objective optimization approach uses several attributes as objective functions and the optimal solution should maximize (or minimize) simultaneously all these objectives. This can be formally stated as follows. A k-objective optimization problem instance is a tuple (S, f1, f2, …, fk) where S is the feasible solution set and each fi, with i∈{1, …, k} is a mapping fi:S → ℝ that has to be maximized (or minimized). In this context, a solution s1 dominates a solution s2 if and only if (∀j∈{1, …, k}, fj(s1)≥fj(s2))∧(∃i∈{1, …, k}, fi(s1)>fi(s2)), assuming all objectives to be maximized. This dominance relation states when a solution is objectively better than another, without relying on DM's preference information. In this sense, an optimal solution to a multi-objective problem instance is a solution s* such that ∀s∈S, s*is not dominated bys. Using again a mathematical programming-fashioned notation, a k-objective optimization problem instance can be stated as:
Usually the objectives compete with each other, and the dominance comparison defines a partial order on the search space where there are solutions that are not comparable a priori. The non-dominated solutions are the maximals (minimals) of the order relation, and the set of all these solutions is called Pareto Front (Neumann and Witt, 2013).
The NRP can be stated as a bi-objective optimization problem as follows:
This formulation is presented originally in Zhang et al. (2007) and has been studied previously by the authors in Casanova et al. (2019).
Henceforth, this bi-objective formulation will be referred to simply as NRP, unless the context requires clarification.
2.2. Preference-based approaches
When solving a multi-objective combinatorial problem through search, there exists at least three aspects that may present difficulties:
1. Modeling difficulties: in some cases, it is not so easy to define the objective functions. This is because such functions need to capture all the information used to guide the search, but there are situations, in which some specific characteristics of the problem cannot be mathematically modeled, or the user opinion is important to find a solution in the search space (Ferreira et al., 2017), e.g., about the negotiation with customers or business policies.
2. Solving difficulties: the Pareto front may contain exponentially many solutions (Neumann and Witt, 2013). As in the case of optimization problems, one may be satisfied with approximate solutions, and there are plenty of algorithms to perform this task, such as NSGA-II (Deb et al., 2000), FMOPSO (Casanova et al., 2019), IBEA (Zitzler and Künzli, 2004), etc. However, in practice, the DM can implement only one solution of the whole Pareto front.
3. Implementation difficulties: when a search-based approach produces one or more solutions, it is assumed that they satisfy the user but, in practice, the user may reject them and not recognize the produced solutions as good, because his or her preferences were not taken into account in the solution generation process (Ferreira et al., 2017).
In order to mitigate these difficulties, one proposal is to incorporate human preferences, intuition or emotion in the optimization process. Such processes are called preference-based algorithms (Takagi, 2001). To this end, the DM plays an important role, since the DM is the person (or a group of persons) who provides the human preferences. It is supposed the DM has better insights on the problem and is the person who can express preference relations between different solutions.
In order to incorporate the DM's preferences, two decisions must be made: how and when. How the preferences can be incorporated is a question of the choice of a preference model. Examples of preference models are:
• Weights, which represent priority between objectives and usually are embedded in the objective function;
• Reference point, which guides the search toward a region that is proximal to such point in solution or objective space;
• Solution set(s), in which solutions are classified by the DM (accepted, rejected, to be modified);
• Solution scores, in which the DM provides ranks (as in star scoring) to solutions;
• Solution ordering, in which the DM provides a ranking of solutions;
• Constraints, through which the DM discards the portions of the space that are not of interest to them.
In Ferreira et al. (2017) these various models are summarized as “information required from the DM”.
On the other hand, determining when to incorporate the DM's preferences is a decision over three alternatives: a priori, interactive or a posteriori. As stated by Ferreira et al. (2017), they are not exclusive and can be combined:
In the a priori way, the user's preferences information must be specified before the intermediate solution generation phase. Such approaches usually aim at reformulating the multi-objective problem as a single-objective one using some aggregation function over the different objectives. This allows the use of algorithms that in their formulation are single-objective. Ferreira et al. (2017) reports the application through this approach of Evolutionary Algorithms (EA), Differential Evolution (DE), Ant Colony Optimization (ACO), and Multiple Hill Climbing (HCM), among others. This approach is especially useful when the DM has some expertise in optimization and the preferences between objectives are well-known.
In the interactive way (also known as human-in-the-loop), the user preferences are provided during the intermediate solution generation phase. Intermediate solution(s) are formed after repeated finite interactions. After few iterations, some alternatives (e.g., the current population or the best solutions) are given to the user and their preferences are asked. Here, the most reported algorithm by Ferreira et al. (2017) is the Interactive Genetic Algorithm (IGA), followed by the Interactive ACO.
In the a posteriori way, the user must specify their preference information after the intermediate solutions generation phase. This approach is particularly useful when there is no information about preferences, and it can be used in an exploratory way in order to identify interesting regions or solutions in the Pareto front. Ferreira et al. (2017) reports only one paper with an a posteriori approach, using NSGA-II in combination with a later ranking algorithm.
2.3. Clustering analysis
Cluster analysis is the process of partitioning a set of data objects into subsets (clusters), so that objects in a cluster are similar to one another, yet dissimilar to objects in other clusters (Han et al., 2011). The similarity and dissimilarity between data objects are measured based on their attributes values by using a distance function that considers domain-specific knowledge about the objects that are being studied (James et al., 2013). A classical example of application of clustering arises in marketing to perform market segmentation by identifying subgroups of people who might be likely to purchase a particular product, based on their personal and economical attributes.
There is a great number of clustering methods and algorithms that can be basically classified into the following categories, according to Han et al. (2011), Aggarwal (2015):
2.3.1. Partitioning methods
A partitioning method constructs k partitions of a given n-dimensional dataset, where each partition represents a cluster (k ≤ n). In basic partitioning methods, each object must belong to exactly one group.
2.3.2. Hierarchical methods
A hierarchical method creates a hierarchical decomposition of the given set of data objects either in an agglomerative way, forming groups by merging subgroups in each iteration, or in a divisive way, starting from a single big group that is split in each iteration. These methods are rigid, so a formed cluster cannot be undone, which is useful because it leads to smaller computational costs, but incorrect decisions cannot be corrected.
2.3.3. Density-based methods
These methods can be used to find clusters not by using a distance function, but a density function. The idea is to grow a cluster as long as the density (number of objects in a neighborhood) exceeds some threshold. Density-based methods can divide a set of objects into multiple exclusive clusters, or a hierarchy of clusters.
2.3.4. Grid-based methods
Grid-based methods quantize the object space into a finite number of cells that form a grid structure, so then density-based methods or hierarchical methods can be used.
Selecting an algorithm or family of algorithms from these categories has to be done taking into consideration the characteristics of the problem to be solved. This work is centered on hierarchical methods for the reasons discussed in Section 5.
3. Problem definition
As stated above, in multi-objective combinatorial optimization problem-solving, a DM can use his or her preferences in order to guide the search toward a region of interest (ROI).
A priori approaches require information before starting the search. When information about preferences is lacking, building a significant preference model can be difficult, and it could take many executions with different preference settings in order to find a compliant solution. Furthermore, even when preferences are clear and certain, recent studies show that a priori approaches based on weights can be harmful to the search (Chen and Li, 2022).
On the other hand, interactive approaches can be more adequate than a priori ones in this scenario, because by interacting with the DM the preferences can be somehow elicited. However, the early decisions can introduce an undesirable and unfounded bias in the search process, missing relevant solutions that can be identified if the DM visualizes them. Moreover, when using metaheuristic search, it can be confusing for the DM that it is not guaranteed that the same solutions are found once the search is restarted, i.e., in order to explore another slightly different region of the Pareto front.
Thus, when preference information is scarce or unavailable (either due to lack of prior preferences or inability to translate them), a priori and interactive approaches can be inadequate. Consequently, the DM must manually select the solution from the entire Pareto front (or an approximation thereof), a laborious task.
In this information-lacking context, a posteriori approaches seem far more adequate, because the Pareto front can be fixed at this moment and the DM can interact with it, if a proper interface is provided, in order to explore it. Providing a proper interface is key for interactive exploration of the obtained solutions, and so it is the objective of this work. In this line, the utilization of clustering techniques a posteriori has been proposed in Harman et al. (2012) in order to group similar solutions and thus facilitate the front exploration. However, in our review we found that the subject has been treated sparsely, and has been dealt with by fairly straightforward, if unsophisticated, approaches and, therefore, improvements can be proposed. The related works are summarized in Section 5.
In summary, this work aims to improve the decision-making process by designing an abstract model that, when extended, helps DMs explore the Pareto front of a multi-objective combinatorial optimization problem in order to select the solution that best meets their preferences. In addition, it is shown how to extend the abstract model for the exploration of solutions of the well-known bi-objective Next Release Problem.
4. Framework design
Considering the absence of previous information about the DM's preferences, the process shown in Figure 2 is proposed.
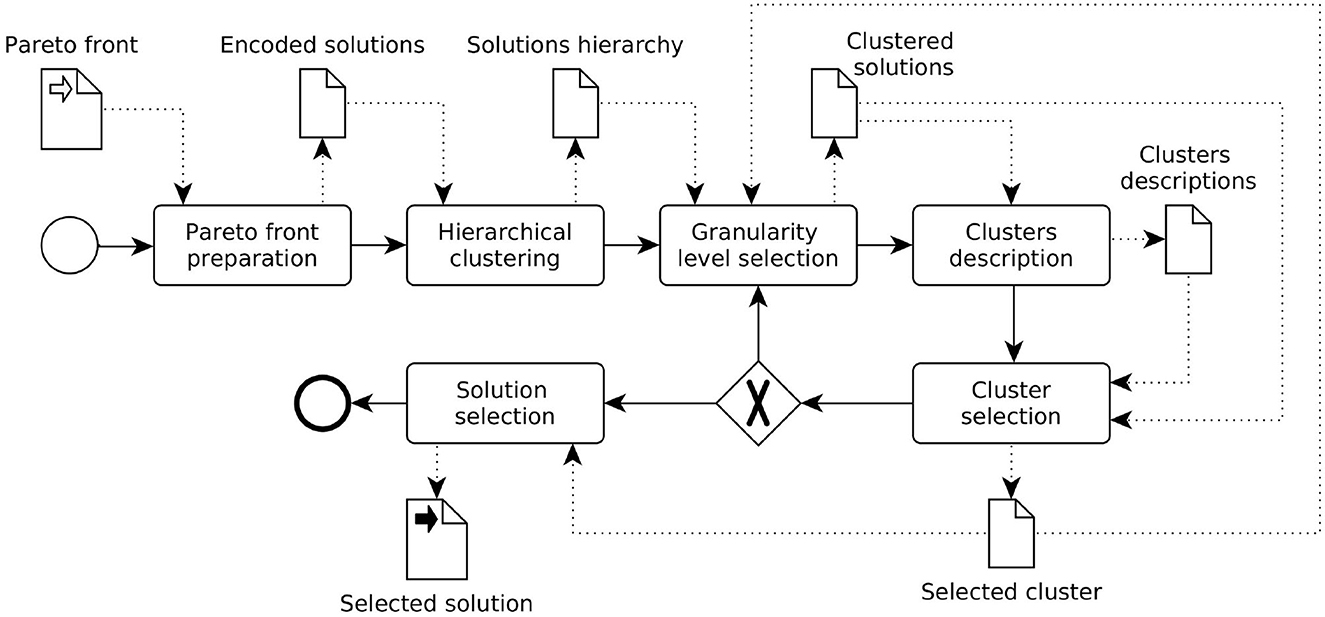
Figure 2. Proposed clustering-based process.
This process starts once the solution set to be explored is obtained by executing a multi-objective combinatorial optimization algorithm. It is important to note that this set does not need to be comprised of Pareto-optimal solutions, approximated solutions can be used.
Each of the solutions must be codified into some structure with information about its characteristics and the values of the objectives of said solution. For example, for the NRP problem, the cost, the profit, the set of selected requirements and the set of satisfied stakeholders are attributes of the found solution set.
Then, a hierarchical clustering algorithm is applied on the solution set in order to explore it, searching for regions of interest (Han et al., 2011). For this, as was mentioned before, it is necessary to use a similarity measure taking into account the data that the DM considers relevant, which can be a mixture of both the value of the objectives and the configuration of the solutions. This measure, in consequence, depends on the addressed problem and is a parameter (input) of the process. In Section 4.1, a similarity (distance) measure for the NRP is proposed.
As mentioned before, the main characteristic of hierarchical clustering is the possibility of exploring different clusters configurations depending on the granularity level, so different alternatives can be explored by using visualization tools, for example, in order to decide how many clusters will be constructed. This particularity is highly relevant in the context of an a posteriori exploration, so the DM can observe the behavior of the whole front before bounding it.
Once the clusters were established, it is possible to describe them by using statistical descriptors, visualization techniques or supervised learning (e.g., classification techniques like top-down induction of decision trees algorithms; Garćıa-Mart́ınez et al., 2013; James et al., 2013). This description allows the DM to explore the particularities of each portion of the Pareto front. The way of characterizing the clusters is another parameter of the process and depends on the problem's characteristics.
After choosing a cluster, the number of solutions is reduced, and it may be possible to select one solution to be implemented, without fatigue for the DM. Nevertheless, if the selected cluster still has a big number of possible solutions, another reduction can be performed through a new granularity level selection, using the same hierarchy that was calculated before. This iterative process can be performed until the DM finds the number of solutions manageable. Furthermore, if a compliant solution cannot be identified by the DM in the chosen cluster, the exploration can return to a previous state in order to select another cluster.
In summary, following this process, the Pareto front is reduced to smaller and smaller regions, providing information not only about the values of the objectives, but also about the characteristics of the solutions in the context of the problem, until the DM can select a single solution or a group of similar solutions.
4.1. Framework extension to address the bi-objective NRP
In this section, the proposed artifact is demonstrated by using a sample case where a Pareto front of an instance of the NRP problem is involved. The purpose of this explanation is to illustrate the exploration of the front by using the proposed framework, so the resolution method used to get it is not relevant and, hence, does not produce a generality loss.
As stated above, the components that need to be specified in order to extend the model are the similarity measure or distance function, and the way to characterize each cluster. For the proposed case study we have used the following distance function. Assuming NRP as defined in (5), let and non-dominated solutions of an NRP instance. The distance function dist(s1, s2) is defined as follows.
being maxCost and maxProfit the maximum values in the solution set for Cost and Profit respectively.
This measure takes into consideration the Euclidean distance between the attributes cost and profit, and the number of requirements and stakeholders they have in common, calculated using the Jaccard Distance operator (1 minus the quotient of the cardinals of the intersection over the union). All the dimensions were normalized in [0,1] interval.
Continuing with the extension of the abstract model, to characterize the clusters of this problem we used:
• Visualization of the hierarchy by a dendrogram, with colors differentiating each cluster. This visualization assists in selecting an appropriate number of clusters, as it shows the clusters distribution. This can be seen in Figure 3.
• Visualization of the objective values of the solutions in a scatterplot, with colors differentiating each cluster. This can be seen in Figure 4.
• Collection of statistics: number of solutions, arithmetic mean and standard deviation of cost and profit within the cluster. This can be seen in Figure 5.
• Visualization of the solutions' composition of each cluster using Treemaps. This can be seen in Figure 6.
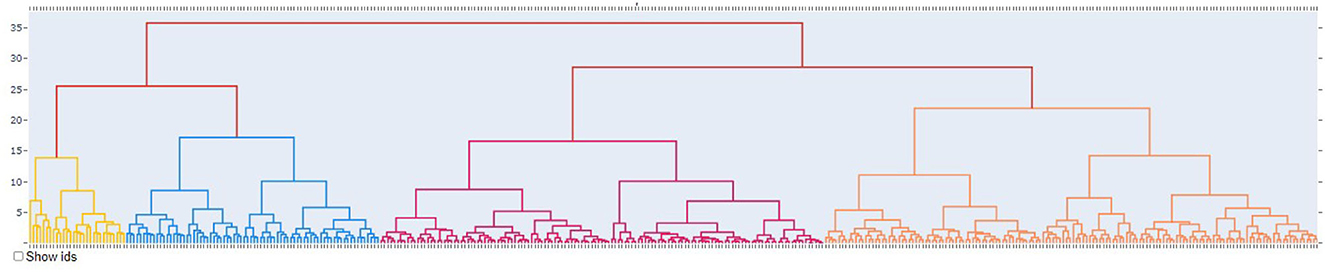
Figure 3. Close up of the cluster arrangement represented using a dendrogram with one color per cluster.
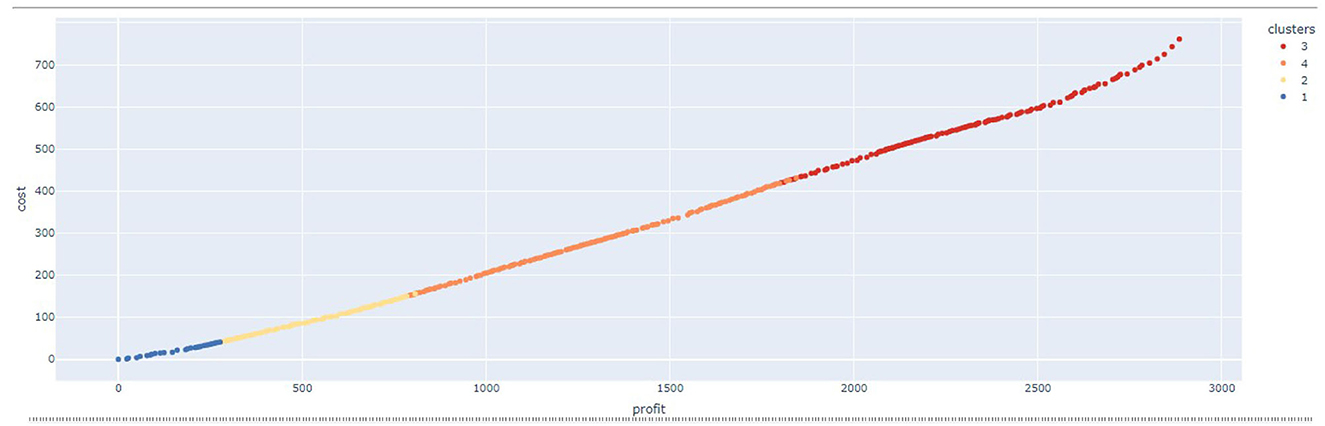
Figure 4. Close up of the Pareto front distribution with one color per cluster.
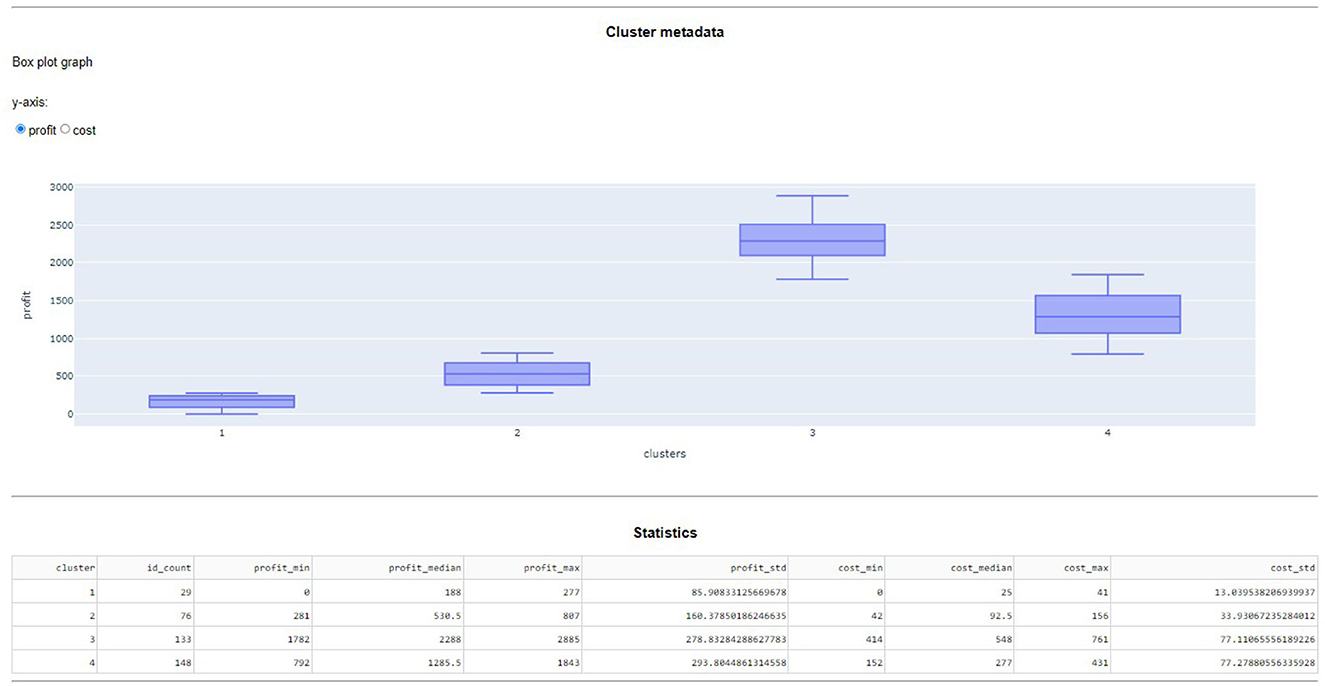
Figure 5. Close up of the statistical data of each cluster using a box plot and statistical descriptors.
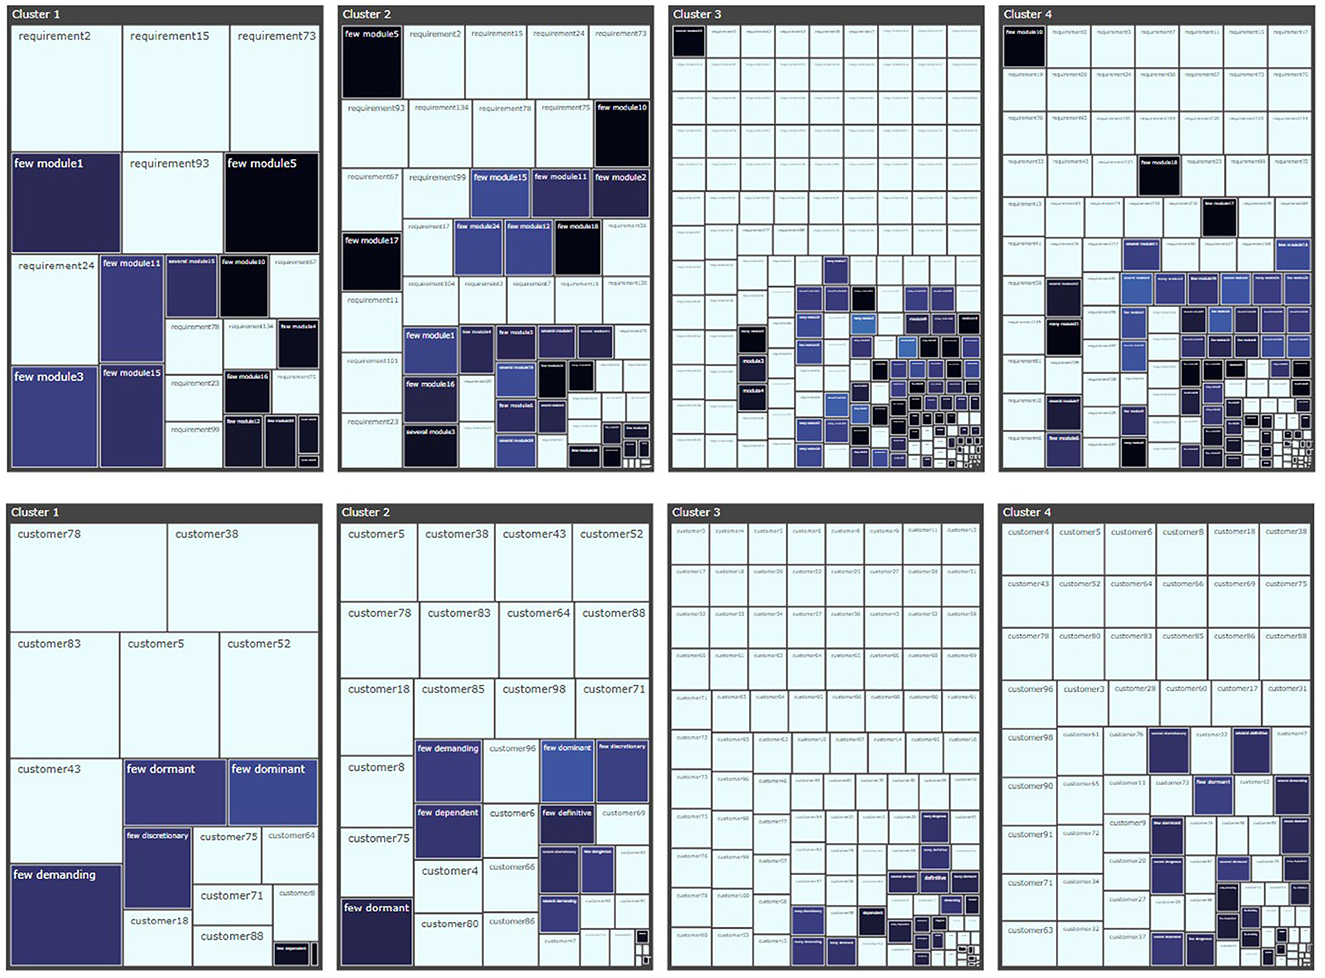
Figure 6. Close up of the solutions' composition in each cluster using Treemaps.
Regarding the Treemaps it is necessary to make several precisions. Two Treemaps are shown for each cluster, one associated to the requirements and the other to the stakeholders. To build these treemaps, metadata randomly generated by the authors were used, associating one module for each requirement and one category for each stakeholder of the 7 categories proposed in Sudevan et al. (2014). In this way, the modules and categories function as groupers. In addition, for each module, fuzzy quantifiers “few”, “several”, “many”, “all” (although in the dashboard “all” is shown as ”, the empty string) were generated according to the proportion of requirements present in each solution. Each of these labels are modeled with symmetric triangular fuzzy sets with maximum possibility values of 0.25, 0.5, 0.75, and 1, respectively, and support [0, 0.5], [0.25, 0.75], [0.5, 1], and [0.75, 1]. Thus, each pair (quantifier, module) is a fuzzy set that maps membership values for each solution of the NRP problem according to the proportion of requirements of the module in question that such solution indicates should be implemented in the next release.
Let Q be the set of terms representing fuzzy quantifiers and M be the set of modules. Let further C(s, m) be the proportion of requirements of module m selected by the solution s with respect to the total number of requirements of module m, and C(m) be the total number of requirements of module m. The fuzzy set corresponding to the quantifier q∈Q and the module m∈M for a solution s∈K (being K⊆S a cluster) has by membership function:
i.e., a triangular fuzzy set with kernel b and support [a, c].
Two measures of these fuzzy sets are represented in each treemap: the cardinality and the fuzziness. The former measure is represented by the size of the corresponding area of the treemap, and it is calculated as follows:
being Ãq, m the fuzzy set with membership value μq, m(s).
On the other hand, the fuzziness is represented by the color of the area and is calculated as follows:
with being the 0.5-cut of the fuzzy set.
This measure takes values in the interval [0, 1], with 0 representing classical sets with binary membership, and 1 representing sets as fuzzy as possible, with all their membership values at the critical level of 0.5. Everything described on fuzzy logic can be consulted in reference (Klir and Yuan, 1994).
Regarding the colors, the “less fuzzy” (or more crisp) sets have a black color, while the “most fuzzy” sets have a light blue color, ranging in a continuous scale. To facilitate the inspection of this visualization, the requirements are represented with the white color. Finally, what has been explained for the requirements and their modules is also valid for the stakeholders and their categories, since they are represented in the same way.
The resulting concrete model (i.e., the extension of the abstract model described so far) was implemented in a web-based application that enables the exploration by means of adequate controllers. These controllers include setting the number of clusters, zooming in to a selected cluster, and going back to previous clusters for selection. The application's initial screen can be seen in Figure 7.
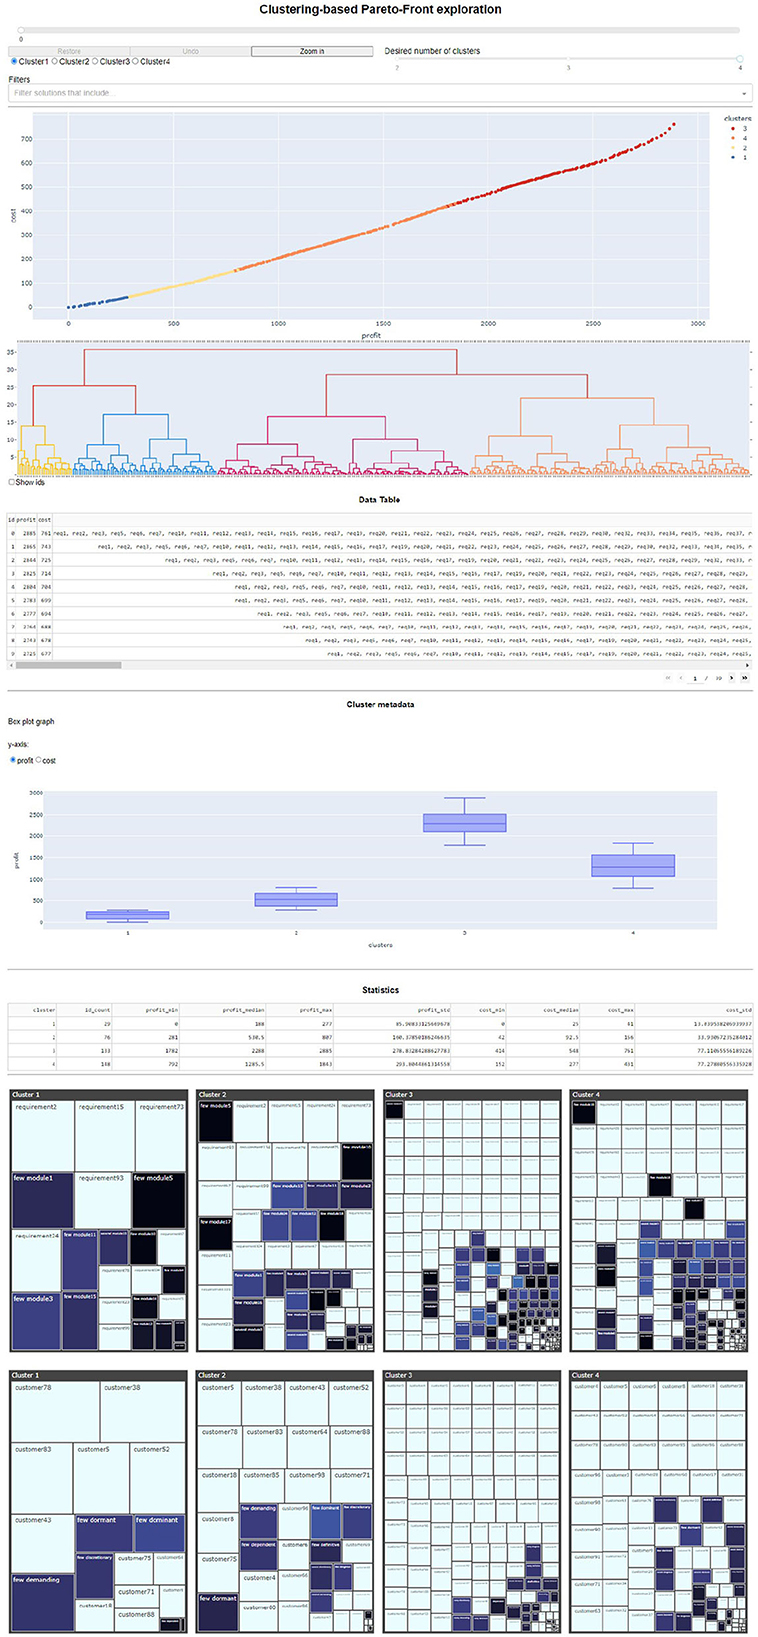
Figure 7. Screenshot of the initial version of the web-based application used for the artifact demonstration.
All the implementation was done using Python (http://python.org) and its libraries: dash and scikit-learn. All the source code is publicly available in Casanova et al. (2023). The dataset employed is an adaptation of the one tagged as nrp1 in Xuan et al. (2012) augmented with metadata randomly generated (requirement's modules and stakeholders' categories).
The implementation allowed to graphically see the distribution of the solutions in a 2D scatterplot (Figure 4). Additionally, this scatterplot graph was automatically updated using colors as visual codes for each cluster, also having the possibility of obtaining information about each particular solution by hovering the points in the graph.
Regarding the plots that were used, it can be noted that scatterplots only work for data with two numeric dimensions, so this tool needs to be adapted to be able to manage more objectives in case of necessity. This can be easily done selecting a pair of variables dynamically before plotting the graph, or even a scatterplot matrix could be preferable.
With all this information, the DM could decide which cluster is of their interest to keep exploring it. The application allows us to repeat the process with the selected cluster, i.e., once a cluster is selected, then a new clustering is derived for the reduced dataset and all the visualizations refreshed. Additionally, the application allows us to go back to previous and more general clusters, in case the one selected by the stakeholder was not satisfying enough or just to compare the solutions from different subclusters.
4.2. Empirical study and guidelines for user validation
An empirical initial validation of the concrete model for the NRP was conducted. This validation is intended as a guideline to help other authors to validate upcoming extensions of the framework.
As said, we selected an NRP instance and augmented it with metadata randomly generated (requirement's modules and stakeholders' categories). The base instance was the one tagged as nrp1 in Xuan et al. (2012). Then, we specified five preference scenarios. Such scenarios are loose guides of which solutions are interesting for a prototype DM. The scenarios are described next:
1. A solution with a very good cost/benefit ratio, with a cost between 300 and 350 including customers 4, 5, 6, and 8.
2. Solutions with a very good cost/benefit ratio including requirements 10–15, which are the ones the team labeled as the next MVP.
3. Solutions with a low mix of different modules.
4. The solution with minimum cost that includes requirements 51 and 53, and customers 40 and 42.
5. Solutions including as much as possible of modules 5 and 18, and customers 46 and 47.
Next, we gathered a group of five experts to use the application to search for solutions for these 5 scenarios, one at a time. The experts were advanced students and graduates of Information Systems Engineering that had some basic background about NRP, multi-objective optimization and fuzzy logic.
We wanted to know:
RQ1: Is it possible to consistently locate solutions through the application, given imprecise preference scenarios?
RQ2: Are the visualizations presented understandable to users, and can they be used appropriately?
RQ3: What effort is required in each case?
The study followed the outline below:
1. The experts were left to explore the tool by themselves.
2. The NRP problem, the purpose of the tool, the visualizations and the interactions that can be carried out were briefly explained.
3. The scenarios were presented one at a time, and the experts were asked to give the IDs of the solutions that they felt best suited each scenario.
4. They were asked what they understood they should look for in each case to detect possible discrepancies in interpretation.
As they performed each task, the authors observed the use of the tool and took the time taken for each task. The time taken by each expert is shown in Table 1, while the solution's IDs can be found in Table 2.
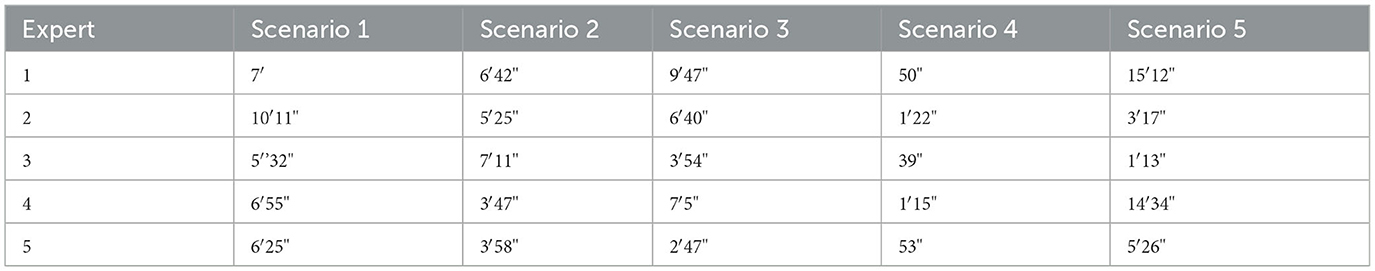
Table 1. Time taken by each expert in each scenario of use.
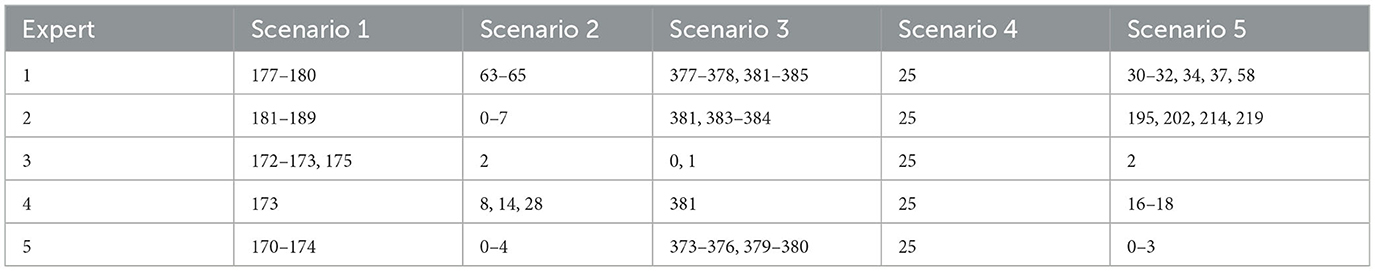
Table 2. Solution's IDs identified by each expert in each scenario of use.
As it can be seen, all the experts completed all the tasks in their first contact with the tool, only having previously had a brief explanation of about 15 min on its operation and the interpretation of the visualizations. The tool is therefore effective in answering questions similar to those posed here. Furthermore, the solutions found in each scenario coincide for the most part (except expert 1 in scenario 2, expert 3 in scenario 3), even considering the intentional ambiguity with which they were formulated. The only one scenario that is more inconsistent is scenario 5, that was the hardest one given the visualizations and controls included in this version. Nonetheless, the cases that differ the most had a component of misinterpretation of some terms (“cost/benefit ratio”, “little module mix”, and “as much as possible of modules 5 and 18”).
Regarding the time taken, it is reasonable that the more ambiguous scenarios required more time to resolve in most of the cases (scenarios 3 and 5). Even so, it could be observed that the experts were able to correctly use the visualizations to obtain insights, selecting the most appropriate ones to find them in the different cases (filters, boxplot, and scatterplot in scenarios 1, 2, and 4, treemaps in scenario 3, and filters and treemaps in scenario 5).
So, in summary:
RQ1: Is it possible to consistently locate solutions through the application, given imprecise preference scenarios? The solutions reported by the experts are similar when the preferences were interpreted in a similar way. There are some exceptional cases where the found solutions were not similar due to differences in the interpretation of some terms, i.e., what makes a cost/benefit ratio “very good”. Some experts considered “very good cost/benefit ratio” as a solution that has the best possible of both objectives at the same time, i.e., a compromise solution, while others looked for close solutions that distance little in cost and much in benefit, i.e., a knee point.
RQ2: Are the visualizations presented understandable to users, and can they be used appropriately? It could be observed that the experts were able to correctly use the visualizations to obtain insights, selecting the most appropriate ones to find them in the different cases.
RQ3: What effort is required in each case? Table 1 show the mean time taken for each scenario, which, even in the worst case, suggest that the approach requires little effort.
4.3. Performance comparison
Tests were carried out to verify the CPU time consumed by the hierarchical clustering algorithm and it was compared with the K-Medoids algorithm, in order to empirically prove that the former is more adequate than the latter in terms of response time. The reason for the selection of K-Medoids is that it is a partitioning algorithm that accepts any kind of distance function. Although K-Means is by far the most popular of this class of algorithms, it is only suitable for Euclidean distances, while K-Medoids is based on similar principles. On the other hand, density-based algorithms, such as DBSCAN, cannot be compared in a fair way, since it is impossible to know in advance how many clusters will be produced. The key parameters of these algorithms are the minimum number of observations that a group must have to be considered a cluster, and epsilon, which is used to determine the proximity between observations. Therefore, if any of these kinds of algorithms were to be used in the proposed framework, the user would have to be asked for appropriate values for these two parameters, something that, compared to the number of clusters required by partition clustering, requires a more thorough knowledge of how density-based algorithms work. For these reasons, the comparison with DBSCAN and the other algorithms based on similar approaches has been discarded.
The study was performed by simulating random interactions with the tool. Starting from the original data set, clustering was performed considering different number of clusters (parameter labeled as n), and 10 independent runs composed of three consecutive clustering and selection steps were performed, emulating the interaction that a user could perform when using the tool. The step number was labeled h, so that the first clustering and selection corresponds to h = 1, the second step corresponds to h = 2, and the third step corresponds to h = 3. In Figure 8, the averages of the execution times of each algorithm in milliseconds (ms) for each n∈{2, 4, 6} can be seen, disaggregated as stacked bars for h∈{1, 2, 3}.
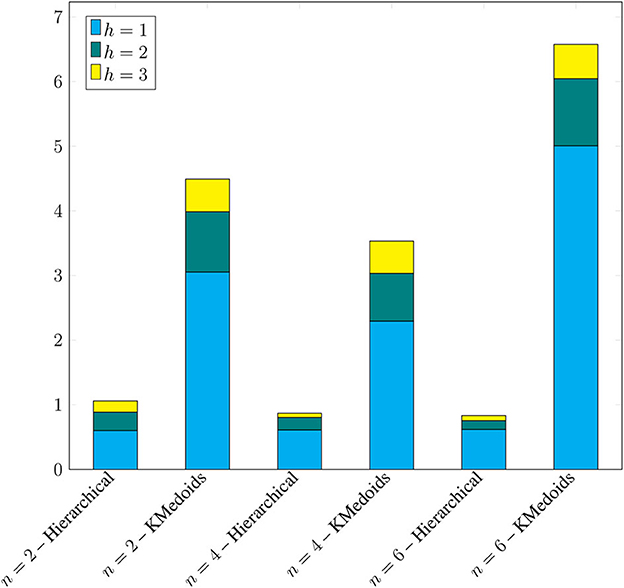
Figure 8. CPU time comparison between hierarchical clustering and K-Medoids clustering.
Although three is a very small number of interactions, the results highlight the advantage of the hierarchical clustering-based approach. The time consumed clearly dominates that of K-Medoids, and the additional initial computation required for the hierarchical clustering computation is quickly amortized. In order to clearly identify this phenomenon, the detailed results of Table 3 are shown in Figure 8. The last column corresponding to each n shows the number of interactions (rounded to the nearest whole integer) that would be necessary in each case to overcome the initial fixed time cost of hierarchical clustering, which averaged 13.76773 ms and is executed only once for each run.
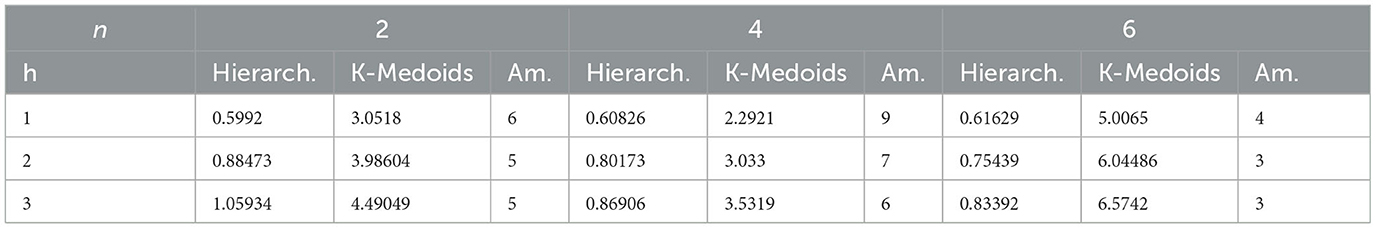
Table 3. Detailed CPU time taken by hierarchical clustering and K-Medoids clustering in ms.
5. Discussion and related work
This section presents the discussion and related work regarding recent psbse approaches, the proposed framework, the framework extension for bi-objective NRP, and finally the web implementation of the model extension.
5.1. Recent preference-based approaches
In addition to the background section on preference-based approaches from Section 2.2, a brief review of the state of the art is included here, including representative references on the subject and highlighting the most recent and relevant research in this field.
Regarding a priori approaches, Luo et al. (2022) present the TopK notion that aims to reduce the number of solutions returned to the DM, and they incorporate such mechanism to NSGA-II and SPEA2, resulting in two novel algorithms, NSGA-II-TopK and SPEA2-TopK. The top-K model is based on a reference point and a “don't care” factor given by the DM. The reference point indicates the region preferred by the DM, and the “don't care” factor shows the minimum distance between adjacent top-K solutions so that the top-K solutions have a certain degree of distinction, which is convenient for DM to choose.
Kaddani et al. (2017) propose the implementation of an a priori approach based on the widely known weighted sum as aggregation function using partial preference information, constructing a weight polytope from the DM's preferences.
Yao et al. (2021) propose a method to solve large-scale Many-Objective Optimization Problems based on dimension reduction and a solving knowledge guided evolutionary algorithm. The base algorithm used is the decomposition-based MOEA/D.
All of these approaches are not adequate for the information-lacking scenario described here, because of the previous information needed in order to apply them. Furthermore, to achieve an exploration of the front multiple executions are needed.
On the side of the interactive algorithms it can be found (Yu et al., 2022), presenting MOEA/D-DPRE, an algorithm built on the MOEA/D-PRE by Yu et al. (2016), which considers preference information as dynamic, and provides a mechanism for the adjustment of preference information by interacting with the DM without the need for a full restart. The preference information is provided as a reference point and a radius within which the solutions are considered inside the ROI in MOEA/D-PRE, making it an a priori approach, while MOEA/D-DPRE allows to change the reference point and the radius interactively.
Two other papers deal with multi-objective combinatorial problems, considering multiple DMs that must reach consensus, and are based on reference points and interactive preference elicitation mechanisms. Tomczyk and Kadzinski (2022) is based on the co-evolution of two populations, one called “primary”, whose role is to discover solutions relevant to the committee, and another called “support”, which approximates the entire Pareto front, revealing a variety of tradeoffs between objectives. On the other hand, Cinalli et al. (2020) is based on collective intelligence reference points obtained by the interaction and aggregation of multiple opinions, and incorporates online and interactive eduction of collective-based preferences in NSGA-II, SPEA2 and the multi-objective S-metric evolutionary selection algorithm (SMSEMOA).
Finally, Hou et al. (2020) propose to reformulate preferences into constraints for evolutionary multi- and many-objective optimization, incorporating the constraints to algorithms capable of constraint-handling. In this same line, Alizadeh and Kessentini (2018) propose an interactive approach combining the use of multi-objective and unsupervised learning to reduce the developer's interaction effort when refactoring systems. An unsupervised learning algorithm (Gaussian Mixture Model) clusters the different trade-off solutions to guide the developers in selecting their region of interests and reduce the number of refactoring options to explore. The feedback from the developer, both at the cluster and solution levels, are used to automatically generate constraints to reduce the search space in the next iterations and focus on the region of developer preferences.
These interactive approaches are better suited to the information lacking scenario described here, specially the last work by Alizadeh and Kessentini (2018). Nevertheless, our proposal have some distinctive factors that must be noted. First of all, the algorithms aim to elicit and refine the preferences of one or several DMs to discover their preferences. However, if the DM is not satisfied with the solutions found in a certain region of the Pareto front and wants to radically change the region of interest, what he should do is to restart the search, since the elicited information is aggregated conjunctively, assuming that, although preferences may change, they do not change abruptly but smoothly. In this scenario the DM should wait until the algorithm finds new solutions, again interacting with it and interrupting the exploration task it was performing. If instead the Pareto front (or an approximation) were already fixed, as in our proposal, this inconvenience would not exist. On the other hand, even after the application of interactive approaches, the number of solutions can be large, in which case our proposal can serve as the final step of a hybrid framework, with interactive and a posteriori incorporation of preferences.
Lastly, from the a posteriori approaches, in Shavazipour et al. (2021a) it is proposed a novel optimization approach for multi-scenario multi-objective robust decision making that enables the decision-makers to explore the trade-off between optimality/feasibility in any selected scenario and robustness across a broader range of scenarios. The addressed problem is the classic shallow lake problem. In this same line, Shavazipour et al. (2021b) propose visualization tools to support the solution of such scenario-based multiobjective optimization problems. It is argued that suitable graphical visualizations are necessary to support managers in understanding, evaluating, and comparing the performances of management decisions according to all objectives in all plausible scenarios. For this, two visualization methods are proposed: an extension of empirical attainment functions for scenarios and an adapted version of heatmaps. They help a decision-maker in gaining insight into realizations of trade-offs and comparisons between objective functions in different scenarios. The ideas behind this approach are similar to ours, however this paper does not propose the exploration of a large Pareto optimal front, nor does it give tools to explore it, but focuses on showing the differences between different scenarios subject to uncertainty.
In Cheng et al. (2015), it is proposed a reference vector-based preference articulation (RVPA) method to obtain additional solutions in preferred regions of the Pareto Front. However, a later mechanism to select the final solution is lacking and the DM has to choose it by himself.
It is believed that knee points are considered to be the naturally preferred solutions when no specific preferences are available, because knee solutions incur a large loss in at least one objective to gain a small amount in other objectives. Yu et al. (2018) proposes a novel method for knee identification, which first maps the non-dominated solutions to a constructed hyperplane and then divides them into groups, each representing a candidate knee region, based on the density of the solutions projected on the hyperplane. Finally, the convexity and curvature of the candidate knee groups are determined and only those having a strong curvature are kept. While the approach is very interesting and useful, it is also not aimed at exploring the Pareto front, but rather at identifying particular solutions, which may or may not be of particular interest to a DM.
Hu and Wang (2011) propose to use an evolutionary algorithm such as NSGA-II to find the front, then reduce it only to M-Pareto-optimal solutions using fuzzy logic, and finally apply Fuzzy C-Means with validity criteria to obtain a representative subset formed by the centroids of the algorithm, so that the DM can select one of them. As in the previous cases, the method is not designed to explore the front but to reduce the number of solutions of interest. In this case it is also possible to lose a very relevant solution in the aggregation of information.
Work by Freire et al. (2019) proposes the usage of clustering algorithms to group Product Line Architecture (PLA) design alternatives, according to their characteristics and assist the decision maker in the choice of one PLA design for the Software Product Line. Here, K-Means++ and DBSCAN are used as clustering algorithms. This approach bears many similarities to our proposal, but it is also not designed for front-end exploration. While it is possible to do so, the proposed clustering algorithms will have to be rerun at each step, a drawback that our proposal overcomes. Another difference is that K-Means is used, and therefore the distance used is Euclidean, which reduces the generality of the approach.
Finally, a clustering-based adaptive MOEA (CA-MOEA) is proposed in Hua et al. (2019) for solving Multiobjective Optimization Problems with irregular Pareto fronts. The main idea is to adaptively generate a set of cluster centers for guiding selection at each generation to maintain diversity and accelerate convergence. For this end, a hierarchical clustering algorithm is embedded in the environmental selection operator of a genetic algorithm similar to NSGA-III. However, as it can be seen, the clustering is not related to the exploration of the Pareto front.
5.2. Framework
As already said, the presented framework shows similarities with some of the previous proposals, but at the same time it can be seen as an extension of them. One of the most important differences is that our method allows to recursively explore through clusters in order to focus the search on the solutions that are interesting for the DM. Especially when the number of solutions is high, the first generated partition can exhibit poor insights about the underlying solutions, and a subsequent partition with filtered data would be of much use. Our approach can derive new partitions with very little computational effort using the structure of the original partition, called linkage matrix, while other partition-based methods must be rerun from scratch and do not allow reusing the information obtained in previous partitions.
On the other hand, Freire et al. (2019) propose using K-Means or DBSCAN algorithms for clustering. It is well-known that DBSCAN can be useful to reduce the number of solutions due to its ability to detect noise in the dataset, i.e., data points that do not belong to any cluster given a certain set of parameters. These noisy data can be removed or ignored if they are not interesting for the DM. However, noise and outliers can be useful in some contexts. The DM's concerns may include detecting odd set of requirements that could be ignored by using a traditional approach. For this, partition-based algorithms like K-Medoids may be a good alternative, but, as said before, these algorithms require multiple executions in order to make an in-depth exploration. In this line of thought, our method can perform multiple iterations and even go back to previous levels without having to re-calculate the distance between data instances, a common problem with interactive approaches. Once the linkage matrix is calculated, multiple partitions can be obtained without excessive computational effort and without the risk of obtaining a partition that may differ considerably from one execution to the next, specifically when heuristic search is used (Takagi, 2001). The comparative study of the previous sections on CPU time consumption empirically supports this claim.
It is worth noting that a common drawback of a posteriori approaches is that determining the whole Pareto front can be computationally intensive. However, an approximation of this front can be obtained using a meta-heuristic if performance improvement is needed. It is even possible to build a hybrid approach using our artifact on a subset of the Pareto front, previously filtered by an interactive process. Also, for the bi-objective NRP particular case, anytime algorithms proposed in Doḿınguez-Ŕıos et al. (2019) or the exact ones proposed in Dong et al. (2022) are perfectly adequate to obtain either the whole Pareto front or else a well-distributed set of non-dominated solutions. In this scenario, our proposal can still be used as the final step of a PSBSE methodology in order to finally select a compliant solution or group of similar solutions.
5.3. Framework extension
Extending the framework to the specific problem requires the definition of the similarity measure or distance function and the way to characterize each cluster was defined. In this context, it must be noted that the distance used in this work does not pretend to be the best possible distance metric, but it is a relevant contribution since it incorporates structural information about the solutions (requirements and stakeholders in common), and not only the values of the objectives. Of course, the distance metric can be enriched using the various metrics proposed in the state of the art (Del Águila and Del Sagrado, 2016). In any case, the definition of the function is a parameter of our framework, and we do not believe that this results in a loss of generality, rather it makes the model more flexible.
On the other hand, our proposal is abstract, and thus is possible to be implemented regardless of the multi-objective combinatorial optimization problem that has been addressed, i.e., it can be applied regardless of the number of objectives, the solution representation, the NRP variant considered, or even whether it is NRP or some other problem. The only adaptation to be done is the distance function definition and the way in which each cluster is characterized, and both of them can be enriched or changed in any way if the problem to be solved is NRP, or defined from scratch if a different problem is addressed.
Regarding cluster characterization, we used:
• Visualization of the hierarchy by a dendrogram that shows their distribution.
• Visualization of the objective values of the solutions in a scatterplot, with colors differentiating each cluster.
• Collection of statistics: number of solutions, arithmetic mean and standard deviation of cost and profit within the cluster.
• Visualization of the composition of the solutions of each cluster using Treemaps.
In certain works like (Del Águila and Del Sagrado, 2016) it is proposed to compare pairwise solutions by means of statistical indicators and visualizations like histograms. This strategy can be very useful when there are few solutions or when you want to compare a pair of solutions in detail. In contrast, our proposal aims for a guided iterative exploration through the observation of the graphs and the analysis of the indicators of the generated clusters when many solutions exist. This facilitates the exploration and search for solutions in large Pareto Fronts. In addition, the application of clustering methods facilitates the search for groups of similar solutions, which share certain characteristics desired by the DM. Consequently, it is possible to obtain a solution with less sensitivity to parameters variation, as well as alternative solutions that allow changes to be made if necessary or the identification of 'slack' requirements that can be postponed if an imponderable arises.
To close this subsection, it is necessary to point out that there are already precedents on other problems that have detected the need for convenient ways to quickly and visually explore search spaces, such as Rebai et al. (2020), where the multi-objective code refactoring problem is addressed.
5.4. Dashboard
A web dashboard that implements the proposed extended framework has been developed using Python. It allows the exploration of clusters and solutions using appropriate controllers: a slider with the desired number of clusters; the zoom in command, that allows the selection of one cluster and continue with further exploration with a new clustering; filters that specify what requirements or stakeholders should be in all solutions of interest; undo, which reverts the last action; and restore, that sends the user to the initial state. For example, en Figure 9 can be seen the result of doing a zoom-in in cluster 1 from the initial state.
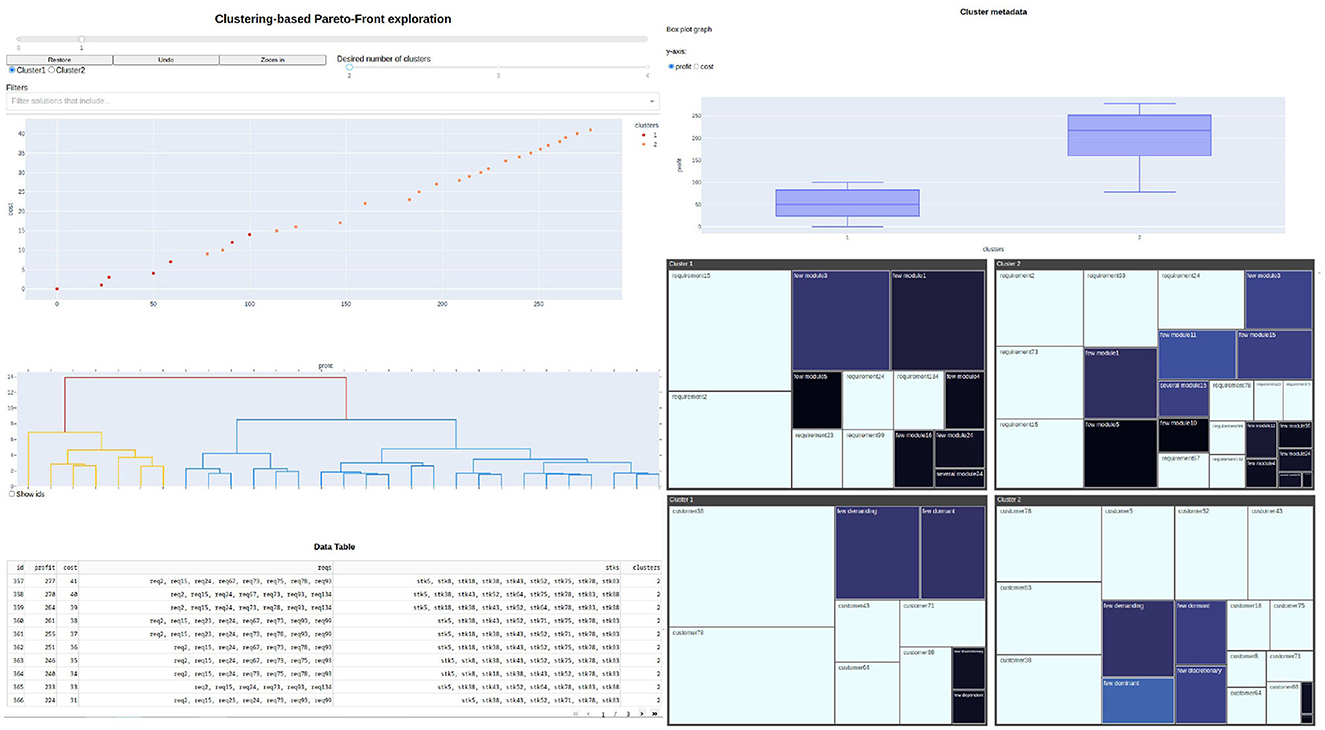
Figure 9. Screenshot of the zoom-in of cluster 1.
Since the proposed framework is a conceptual model, its implementation can be done by using different software tools if necessary. Our proposal uses algorithms and techniques that are well-known today and are implemented in the majority of data mining software tools, including programming languages and its libraries, which contributes with its usability and flexibility.
Lastly, this web-based software tool responds to the need raised by Ferreira et al. (2017) for more context-independent software tools with a user-friendly interface to enable users to make the best decisions. A working version of the software can be found at Casanova et al. (2023).
Taking into account that some aspects of the cluster hierarchy and distribution are communicated to the user via colors, the dashboard uses a colorblind-friendly palette, following accessibility recommendations.
6. Threats to validity
As mentioned above, the multi-objective NRP version used in this work is the original, despite all variants formulated in the state of the art. This decision was made based on the dataset used, but we think that in no way it results in a generality loss, since the framework is designed in an abstract fashion, and the adaptations to be made are necessarily problem-dependent.
On the other hand, the dataset used is large enough to discourage a full inspection, and worthy of a systematic approach. Besides, the experts were not familiarized with it, and it was not of signification for them. It is possible, however, that a real-world backlog or user story collection may be somewhat smaller than the instance used in this paper.
Regarding the experts group, all of them were in the range of 23 and 35 years old, and had some background on the techniques on which the dashboard is based. However, it is unknown how a role in a real software company would adapt to making decisions using these types of approaches, and further testing is needed to ensure that they will adapt correctly. Moreover, the group was small, and it is possible that the results do not generalize well when the sample is expanded.
Finally, it is very difficult to validate an abstract framework without relying on concrete extensions and their subsequent validation, so this kind of external validation is intrinsically incomplete. Nonetheless, further extensions to address new problems can increase the confidence in the framework's effectiveness.
7. Conclusions and future works
In order to facilitate the exploration of non-dominated solutions of multi-objective combinatorial optimization problems, an abstract framework based on hierarchical clustering was proposed and demonstrated in this paper.
This proposal takes as input a set of solutions of a multi-objective combinatorial optimization problem, finds clusters of similar solutions and provides a description for each one of them, in order to summarize the available information. This can be performed recursively until a single solution or a set of similar solutions is selected for implementation.
Then, an extension of the abstract framework aimed at addressing the bi-objective Next Release Problem was presented, and with it, an appropriate Dashboard that realizes such extension. The dashboard was built using modern libraries with the intention that it can be used by potential DMs in the software industry, also taking into account the use of colors following accessibility recommendations.
Besides, two studies were conducted. The first was a usability study performed with a small group of experts, with promising results and directions of future improvement. The experts were able to use the dashboard correctly and to interpret the visualizations adequately in a very short time. The second was a performance analysis based on computation time consumed by the clustering algorithm. The results of the performance comparison highlighted the advantage of the hierarchical clustering-based approach in terms of response time.
Future work may include the extension of the framework to new problems and further statistical validity testing of industry experts using real-world data. The use of recommendation techniques to suggest to the user the exploration of solutions similar to those already selected, and the incorporation of classification techniques to label the dendrogram, in order to make it more useful, are not ruled out.
Data availability statement
The datasets presented in this study can be found in online repositories. The names of the repository/repositories and accession number(s) can be found below: https://github.com/giicis/ClusteringBasedParetoFrontExploration/releases/tag/v.2023.1, doi: 10.5281/zenodo.7692504.
Author contributions
CC conducted this study and mainly wrote the paper with LP, ES, and GR. CC worked on the performance analysis based on computation time consumed by the clustering algorithm. GR developed the first functional version of the web application. CC, LP, and ES worked on the updated version of the dashboard and on the empirical usability study. All authors contributed to the article and approved the submitted version.
Funding
This work was founded by the research project SIECCU0008656TC of the National Technological University, Argentina.
Acknowledgments
The authors want to extend their gratitude to Facundo Federico for his collaboration in coding tasks related to the web-based application and the reviewers of this work for their valuable comments and suggestions.
Conflict of interest
The authors declare that the research was conducted in the absence of any commercial or financial relationships that could be construed as a potential conflict of interest.
Publisher's note
All claims expressed in this article are solely those of the authors and do not necessarily represent those of their affiliated organizations, or those of the publisher, the editors and the reviewers. Any product that may be evaluated in this article, or claim that may be made by its manufacturer, is not guaranteed or endorsed by the publisher.
References
Alizadeh, V., and Kessentini, M. (2018). “Reducing interactive refactoring effort via clustering-based multi-objective search,” in 2018 33rd IEEE/ACM International Conference on Automated Software Engineering (ASE) (Montpellier: IEEE), 464–474.
Bagnall, A. J., Rayward-Smith, V. J., and Whittley, I. M. (2001). The next release problem. Inform. Softw. Technol. 43, 883–890. doi: 10.1016/S0950-5849(01)00194-X
Bourque, P., and Fairley, R. E. (2014). SWEBOK: Guide to the Software Engineering Body of Knowledge. Piscataway, NJ: IEEE Computer Society.
Casanova, C., Prado, L. M., and Schab, E. A. (2023). Giicis/clustering based pareto front exploration: Release for publication, Version v.2023.1. Zenodo. doi: 10.5281/zenodo.7692504
Casanova, C., Rottoli, G. D., Schab, E., Bracco, L., Pereyra, F., and De Battista, A. (2019). “Fuzzy bi-objective particle swarm optimization for next release problem,” in International Conference on Software Engineering and Knowledge Engineering (SEKE'19) (Lisbon), 509–512.
Chen, T., and Li, M. (2022). The weights can be harmful: Pareto search versus weighted search in multi-objective search-based software engineering. ACM Trans. Softw. Eng. Methodol. 32, 1–40. doi: 10.1145/3514233
Cheng, R., Olhofer, M., and Jin, Y. (2015). “Reference vector based a posteriori preference articulation for evolutionary multiobjective optimization,” in 2015 IEEE Congress on Evolutionary Computation (CEC) (Sendai: IEEE), 939–946.
Cinalli, D., Marti, L., Sanchez-Pi, N., and Cristina Bicharra Garcia, A. (2020). Collective intelligence approaches in interactive evolutionary multi-objective optimization. Logic J. IGPL 28, 95–108. doi: 10.1093/jigpal/jzz074
Deb, K., Agrawal, S., Pratap, A., and Meyarivan, T. (2000). “A fast elitist non-dominated sorting genetic algorithm for multi-objective optimization: NSGA-II,” in International Conference on Parallel Problem Solving from Nature (Paris: Springer), 849–858.
Del Águila, I. M., and Del Sagrado, J. (2016). Three steps multiobjective decision process for software release planning. Complexity 21, 250–262. doi: 10.1002/cplx.21739
Domínguez-Ríos, M. Á., Chicano, F., Alba, E., del Águila, I., and del Sagrado, J. (2019). Efficient anytime algorithms to solve the bi-objective next release problem. J. Syst. Softw. 156, 217–231. doi: 10.1016/j.jss.2019.06.097
Dong, S., Xue, Y., Brinkkemper, S., and Li, Y.-F. (2022). Multi-objective integer programming approaches to next release problem-enhancing exact methods for finding whole pareto front. Inform. Softw. Technol. 147, 106825. doi: 10.1016/j.infsof.2022.106825
Ferreira, T. N., Vergilio, S. R., and de Souza, J. T. (2017). Incorporating user preferences in search-based software engineering: A systematic mapping study. Inform. Softw. Technol. 90, 55–69. doi: 10.1016/j.infsof.2017.05.003
Freire, W. M., Bindewald, C. V., Amaral, A. M. M., and Colanzi, T. E. (2019). “Supporting decision makers in search-based product line architecture design using clustering,” in 2019 IEEE 43rd Annual Computer Software and Applications Conference (COMPSAC) (Milwaukee, WI: IEEE), 139–148.
García-Martínez, R., Britos, P., and Rodríguez, D. (2013). “Information mining processes based on intelligent systems,” in International Conference on Industrial, Engineering and Other Applications of Applied Intelligent Systems (Amsterdam: Springer), 402–410.
Harman, M., and Jones, B. F. (2001). Search-based software engineering. Inform. Softw. Technol. 43, 833–839. doi: 10.1016/S0950-5849(01)00189-6
Harman, M., McMinn, P., de Souza, J. T., and Yoo, S. (2012). “Search based software engineering: Techniques, taxonomy, tutorial,” in Empirical Software Engineering and Verification: International Summer Schools, LASER 2008-2010, Elba Island, Italy, Revised Tutorial Lectures, eds B. Meyer and M. Nordio (Berlin; Heidelberg: Springer), 1–59. doi: 10.1007/978-3-642-25231-0_1
Hou, Z., He, C., and Cheng, R. (2020). Reformulating preferences into constraints for evolutionary multi- and many-objective optimization. Inform. Sci. 541, 1–15. doi: 10.1016/j.ins.2020.05.103
Hu, C., and Wang, N. (2011). “Three-step optimization method based on posteriori satisfying degree for fuzzy multiple objective optimization,” in 2011 International Conference on Control, Automation and Systems Engineering (CASE) (Singapore), 1–4.
Hua, Y., Jin, Y., and Hao, K. (2019). A clustering-based adaptive evolutionary algorithm for multiobjective optimization with irregular pareto fronts. IEEE Trans. Cybernet. 49, 2758–2770. doi: 10.1109/TCYB.2018.2834466
James, G., Witten, D., Hastie, T., and Tibshirani, R. (2013). An Introduction to Statistical Learning, Vol. 112. Springer.
Kaddani, S., Vanderpooten, D., Vanpeperstraete, J.-M., and Aissi, H. (2017). Weighted sum model with partial preference information: application to multi-objective optimization. Eur. J. Oper. Res. 260, 665–679. doi: 10.1016/j.ejor.2017.01.003
Klir, G. J., and Yuan, B. (1994). Fuzzy Sets and Fuzzy Logic: Theory and Applications. Prentice-Hall, Inc.
Luo, W., Shi, L., Lin, X., Zhang, J., Li, M., and Yao, X. (2022). Finding top-k solutions for the decision-maker in multiobjective optimization. Inform. Sci. 613, 204–227. doi: 10.1016/j.ins.2022.09.001
Neumann, F., and Witt, C. (2013). “Bioinspired computation in combinatorial optimization: Algorithms and their computational complexity,” in Proceedings of the 15th Annual Conference Companion on Genetic and Evolutionary Computation, GECCO '13 Companion (New York, NY: Association for Computing Machinery), 567–590.
Papadimitriou, C. H., and Steiglitz, K. (1998). Combinatorial Optimization: Algorithms and Complexity. Dover Publications, Inc.
Rebai, S., Alizadeh, V., Kessentini, M., Fehri, H., and Kazman, R. (2020). Enabling decision and objective space exploration for interactive multi-objective refactoring. IEEE Trans. Softw. Eng. 48, 1560–1578. doi: 10.1109/TSE.2020.3024814
Shavazipour, B., Kwakkel, J. H., and Miettinen, K. (2021a). Multi-scenario multi-objective robust optimization under deep uncertainty: a posteriori approach. Environ. Modell. Softw. 144, 105134. doi: 10.1016/j.envsoft.2021.105134
Shavazipour, B., Lopez-Ibnez, M., and Miettinen, K. (2021b). Visualizations for decision support in scenario-based multiobjective optimization. Inform. Sci. 578, 1–21. doi: 10.1016/j.ins.2021.07.025
Sudevan, S., Bhasi, M., and Pramod, K. (2014). “A typology of stakeholder identification methods for projects in software industry,” in MESM'2014 (Muscat), 1–5.
Takagi, H. (2001). Interactive evolutionary computation: fusion of the capabilities of ec optimization and human evaluation. Proc. IEEE 89, 1275–1296. doi: 10.1109/5.949485
Tomczyk, M. K., and Kadzinski, M. (2022). Interactive co-evolutionary multiple objective optimization algorithms for finding consensus solutions for a group of decision makers. Inform. Sci. 616, 157–181. doi: 10.1016/j.ins.2022.10.064
Wieringa, R., Maiden, N., Mead, N., and Rolland, C. (2006). Requirements engineering paper classification and evaluation criteria: a proposal and a discussion. Req. Eng. 11, 102–107. doi: 10.1007/s00766-005-0021-6
Xuan, J., Jiang, H., Ren, Z., and Luo, Z. (2012). Solving the large scale next release problem with a backbone-based multilevel algorithm. IEEE Trans. Softw. Eng. 38, 1195–1212. doi: 10.1109/TSE.2011.92
Yao, X., Zhao, Q., Gong, D., and Zhu, S. (2021). Solution of large-scale many-objective optimization problems based on dimension reduction and solving knowledge guided evolutionary algorithm. IEEE Trans. Evol. Comput. 1–15. doi: 10.1109/TEVC.2021.3110780
Yu, G., Jin, Y., and Olhofer, M. (2018). “A method for a posteriori identification of knee points based on solution density,” in 2018 IEEE Congress on Evolutionary Computation (CEC) (Rio de Janeiro: IEEE), 1–8.
Yu, G., Zheng, J., Shen, R., and Li, M. (2016). Decomposing the user-preference in multiobjective optimization. Soft Comput. 20, 4005–4021. doi: 10.1007/s00500-015-1736-z
Yu, H., Fu, Z., Wang, G., Xie, Y., and Li, J. (2022). A multi-objective optimization algorithm based on dynamic user-preference information. Computing 104, 627–656. doi: 10.1007/s00607-021-00995-x
Zhang, Y., Harman, M., and Mansouri, S. A. (2007). “The multi-objective next release problem,” in Proceedings of the 9th Annual Conference on Genetic and Evolutionary Computation, GECCO '07 (New York, NY: Association for Computing Machinery), 1129–1137.
Zitzler, E., and Künzli, S. (2004). “Indicator-based selection in multiobjective search,” in Parallel Problem Solving from Nature - PPSN VIII, eds X. Yao, E. K. Burke, J. A. Lozano, J. Smith, J. J. Merelo-Guervós, J. A. Bullinaria, J. E. Rowe, P. Tiňo, A. Kabán, and H. P. Schwefel (Berlin; Heidelberg: Springer), 832–842.
Keywords: search-based software engineering, preference-based algorithms, a posteriori approach, hierarchical clustering, multiobjective optimization, Pareto front
Citation: Casanova C, Schab E, Prado L and Rottoli GD (2023) Hierarchical clustering-based framework for a posteriori exploration of Pareto fronts: application on the bi-objective next release problem. Front. Comput. Sci. 5:1179059. doi: 10.3389/fcomp.2023.1179059
Received: 03 March 2023; Accepted: 03 May 2023;
Published: 24 May 2023.
Edited by:
Hector Florez, Universidad Distrital Francisco Jose de Caldas, ColombiaReviewed by:
Xiangjuan Yao, China University of Mining and Technology, ChinaJoseph Bamidele Awotunde, University of Ilorin, Nigeria
Cesar Diaz, National University of Colombia, Colombia
Copyright © 2023 Casanova, Schab, Prado and Rottoli. This is an open-access article distributed under the terms of the Creative Commons Attribution License (CC BY). The use, distribution or reproduction in other forums is permitted, provided the original author(s) and the copyright owner(s) are credited and that the original publication in this journal is cited, in accordance with accepted academic practice. No use, distribution or reproduction is permitted which does not comply with these terms.
*Correspondence: Carlos Casanova, Y2FzYW5vdmFjQGZyY3UudXRuLmVkdS5hcg==