 Paria Mehrani
 John K. Tsotsos
- Department of Electrical Engineering and Computer Science, York University, Toronto, ON, Canada
Recently, a considerable number of studies in computer vision involve deep neural architectures called vision transformers. Visual processing in these models incorporates computational models that are claimed to implement attention mechanisms. Despite an increasing body of work that attempts to understand the role of attention mechanisms in vision transformers, their effect is largely unknown. Here, we asked if the attention mechanisms in vision transformers exhibit similar effects as those known in human visual attention. To answer this question, we revisited the attention formulation in these models and found that despite the name, computationally, these models perform a special class of relaxation labeling with similarity grouping effects. Additionally, whereas modern experimental findings reveal that human visual attention involves both feed-forward and feedback mechanisms, the purely feed-forward architecture of vision transformers suggests that attention in these models cannot have the same effects as those known in humans. To quantify these observations, we evaluated grouping performance in a family of vision transformers. Our results suggest that self-attention modules group figures in the stimuli based on similarity of visual features such as color. Also, in a singleton detection experiment as an instance of salient object detection, we studied if these models exhibit similar effects as those of feed-forward visual salience mechanisms thought to be utilized in human visual attention. We found that generally, the transformer-based attention modules assign more salience either to distractors or the ground, the opposite of both human and computational salience. Together, our study suggests that the mechanisms in vision transformers perform perceptual organization based on feature similarity and not attention.
1. Introduction
The Gestalt principles of grouping suggest rules that explain the tendency of perceiving a unified whole rather than a mosaic pattern of parts. Gestaltists consider organizational preferences, or priors, such as symmetry, similarity, proximity, continuity and closure as grouping principles that contribute to the perception of a whole. These principles which rely on input factors and the configuration of parts can be viewed as biases that result in the automatic emergence of figure and ground. To Gestalt psychologists, the perceptual organization of visual input to figure and ground was an early stage of interpretation prior to processes such as object recognition and attention. In fact, they posited that higher-level processes operate upon the automatically emerged figure. Some proponents of emergent intelligence go as far as to undermine the effect of attention on perceptual organization. For example, Rubin, known for his face-vase illusion, presented a paper in 1926 titled “On the Non-Existence of Attention" (Berlyne, 1974).
Despite the traditional Gestalt view, modern experimental evidence suggests that in addition to low-level factors, higher-level contributions can affect figure-ground organization. Specifically, experimental findings suggest that attention is indeed real and among the higher-level factors that influence figure-ground assignment (Qiu et al., 2007; Poort et al., 2012) (see Peterson, 2015 for review). Considering these discoveries and the enormous literature on attention (see Itti et al., 2005, for example), an interesting development in recent years has been the introduction of deep neural architectures dubbed transformers that claim to incorporate attention mechanisms in their hierarchy (Vaswani et al., 2017). Transformers, originally introduced in the language domain, were “based solely on attention mechanisms, dispensing with recurrence and convolutions entirely" (Vaswani et al., 2017).
Following the success of transformers in the language domain, Dosovitskiy et al. (2021) introduced the vision transformer (ViT), a transformer model based on self-attention mechanisms that received a sequence of image patches as input tokens. Dosovitskiy et al. (2021) reported comparable performance of ViT to convolutional neural networks (CNNs) in image classification and concluded, similar to (Vaswani et al., 2017), that convolution is not necessary for vision tasks. The reported success of vision transformers prompted a myriad of studies (Bhojanapalli et al., 2021; Caron et al., 2021; Dai et al., 2021; D'Ascoli et al., 2021; Liu et al., 2021, 2022; Mahmood et al., 2021; Srinivas et al., 2021; Touvron et al., 2021; Wu B. et al., 2021; Wu H. et al., 2021; Xiao et al., 2021; Yang et al., 2021; Yuan et al., 2021; Zhou et al., 2021; Bao et al., 2022; Guo et al., 2022; Han et al., 2022; Pan et al., 2022; Park and Kim, 2022; Zhou D. et al., 2022). In most of these studies, the superior performance of vision transformers, their robustness (Bhojanapalli et al., 2021; Mahmood et al., 2021; Naseer et al., 2021) and more human-like image classification behavior compared to CNNs (Tuli et al., 2021) were attributed to the attention mechanisms in these architectures. Several hybrid models assigned distinct roles of feature extraction and global context integration to convolution and attention mechanisms, respectively, and reported improved performance over models with only convolution or attention (Dai et al., 2021; D'Ascoli et al., 2021; Srinivas et al., 2021; Wu B. et al., 2021; Wu H. et al., 2021; Xiao et al., 2021; Guo et al., 2022). Hence, these studies suggested the need for both convolution and attention in computer vision applications.
A more recent study by Zhou Q. et al. (2022), however, reported that hybrid convolution and attention models do not “have an absolute advantage" compared to pure convolution or attention-based neural networks when their performance in explaining neural activities of the human visual cortex from two neural datasets was studied. Similarly, Liu et al. (2022) questioned the claims on the role of attention modules in the superiority of vision transformers by proposing steps to “modernize” the standard ResNet (He et al., 2016) into a new convolution-based model called ConvNeXt. They demonstrated that ConvNeXt with no attention mechanisms achieved competitive performance to state-of-the-art vision transformers on a variety of vision tasks. This controversy on the necessity of the proposed mechanisms compared to convolution adds to the mystery of the self-attention modules in vision transformers. Surprisingly, and to the best of our knowledge, no previous work directly investigated whether the self-attention modules, as claimed, implement attention mechanisms with effects similar to those reported in humans. Instead, the conclusions in previous studies were grounded on the performance of vision transformers vs. CNNs on certain visual tasks. As a result, a question remains outstanding: Have we finally attained a deep computational vision model that explicitly integrates visual attention into its hierarchy?
Answering this question is particularly important for advances in both human and computer vision fields. Specifically, in human vision sciences, the term attention has a long history (e.g., Berlyne, 1974; Tsotsos et al., 2005) and entails much confusion (e.g., Di Lollo, 2018; Hommel et al., 2019; Anderson, 2023). In a review of a book on attention (Sutherland, 1998) says,“After many thousands of experiments, we know only marginally more about attention than about the interior of a black hole”. More recently, Anderson (2023) calls attention a conceptually fragmented term, a term that is assumed to have one meaning is found to have many, and suggests aid from mathematical language for theoretical clarity. The call for a more formal approach to vision research has appeared several times (e.g., Zucker, 1981; Tsotsos, 2011; Anderson, 2023) but no broadly accepted specification of attention is available. The majority of words in any dictionary have multiple meanings, and a particular class of words, homonyms, are spelled and pronounced the same yet differ in meaning which is only distinguished by the context in which they are used. “Attention” is one such word, here we seek to understand the scope of its use in order to provide the correct context.
To complicate matters further, many kinds of visual attention have been identified, the primary distinctions perhaps being that of overt and covert attention (with and without eye movements and viewpoint changes, respectively). Tsotsos (2011) shows over 20 kinds in his taxonomy, and other comprehensive reviews on the topic such as Desimone and Duncan (1995), Pashler (1998), Kastner and Ungerleider (2000), Itti et al. (2005), Styles (2006), Knudsen (2007), Nobre et al. (2014), Moore and Zirnsak (2017), and Martinez-Trujillo (2022) similarly cover many kinds, not all the same. As Styles (2006) asserts, attention is not a unitary concept. In addition, discussions of attention are always accompanied by consideration of how attention can change focus; this dynamic aspect does not appear in transformers at all.
The many descriptions of attention often conflate mechanism with effect while assuming that an exposition within some narrow domain easily generalizes to all of cognitive behavior. One might think that as long as the discussion remains within a particular community, all can be controlled with respect to use of terminology. This is not the case. Machine learning approaches have been already employed frequently in recent years in brain research by utilizing deep neural architectures as mathematical models of the brain (Cadieu et al., 2014; Khaligh-Razavi and Kriegeskorte, 2014; Kubilius et al., 2016; Eickenberg et al., 2017; Zhuang et al., 2021). Therefore, it is only a matter of time before vision transformers with attention modules are used in human vision studies, if not already by the time of this publication. As a result, it is imperative to understand how attention modules in vision transformers relate to attention mechanisms in the human visual system to avoid adding further confusion to attention research in human vision sciences.
Similarly, on the computer vision side, a more engineering kind of discipline, we need to specify the requirements of a solution against which we test the results of any algorithm realization. But the requirements of attention modules in vision transformers are not specified. They are only implied, through the use of the term ‘attention' and can be traced back to the studies that explicitly motivated these modules, specifically, by the effect of attention mechanisms in the human visual system (i.e.,Vaswani et al., 2017 → Kim et al., 2017 → Xu et al., 2015).
One might argue that from an engineering point of view, there is no need for these modules to remain faithful to their biological counterparts, hence, there is no need for direct comparison between the two systems. However, that train has already left the station. Computer vision has been using the term “attention” since the mid-1970's, connected to both inspiration from and comparisons to human visual attention, and continuously to this day (there are many reviews as evidence, e.g., Tsotsos and Rothenstein, 2011; Borji and Itti, 2012; Bylinskii et al., 2015). An expectation that a new mechanism can affect amnesia for a whole field is unwarranted. For example, Tan et al. (2021), Yue et al. (2021), Zhu et al. (2021), Paul and Chen (2022), and Panaetov et al. (2023) among others, have already mentioned effects of these modules as similar to those of attention in the human visual system.
Regardless of whether one considers attention from a human vision perspective or a machine vision point of view, it is unprincipled to leave the term ill-defined. Our goal in this paper is to contribute to an understanding of the function of the attention modules in vision transformers by revisiting two of their aspects. First, we hope to show that transformers formulate attention according to similarity of representations between tokens, and that this results in perceptual similarity grouping, not any of the many kinds of attention in the literature. Second, because of their feed-forward architecture, vision transformers cannot be not affected by factors such as goals, motivations, or biases (also see Herzog and Clarke, 2014). Such factors have played a role in attention models in computer vision for decades. Vision Transformers fall into the realm of the traditional Gestalt view of automatic emergence of complex features.
In a set of experiments, we examined attention modules in various vision transformer models. Specifically, to quantify Gestalt-like similarity grouping, we introduced a grouping dataset of images with multiple shapes that shared/differed in various visual feature dimensions and measured grouping of figures in these architectures. Our results on a family of vision transformers indicate that the attention modules, as expected from the formulation, group image regions based on similarity. Our second observations indicates that if vision transformers implement attention, it can only be in the form of bottom-up attention mechanisms. To test this observation, we measured the performance of vision transformers in the task of singleton detection. Specifically, a model that implements attention is expected to almost immediately detect the pop-out, an item in the input that is visually distinct from the rest of the items. Our findings suggest that vision transformers perform poorly in that regard and even in comparison to CNN-based saliency algorithms.
To summarize, our observations and experimental results suggest that “attention mechanisms” is a misnomer for computations implemented in so-called self-attention modules of vision transformers. Specifically, these modules perform similarity grouping and not attention. In fact, the self-attention modules implement a special class of in-layer lateral interactions that were missing in CNNs (and perhaps this is the reason for their generally improved performance). Lateral interactions are known as mechanisms that counteract noise and ambiguity in the input signal (Zucker, 1978). In light of this observation, the reported properties of vision transformers such as smoothing of feature maps (Park and Kim, 2022) and robustness (Mahmood et al., 2021; Naseer et al., 2021) can be explained. These observations lead to the conclusion that the quest for a deep computational vision model that implements attention mechanisms has not come to an end yet.
In what follows, we will employ the terms attention and self-attention interchangeably as our focus is limited to vision transformers with transformer encoder blocks. Also, each computational component in a transformer block will be referred to as a module, for example, the attention module or the multi-layer perceptron (MLP) module. Both block and layer, then, will refer to a transformer encoder block that consists of a number of modules.
2. Materials and methods
In this section, we first provide a brief overview of vision transformers followed by revisiting attention formulation and the role of architecture in visual processing in these models. Then, we explain the details of the two experiments we performed in this study.
2.1. Vision transformers
Figure 1 provides an overview of Vision Transformer (ViT) and the various modules in its transformer encoder blocks. Most vision transformer models extend and modify or simply augment a ViT architecture into a larger system. Regardless, the overall architecture and computations in the later variants resemble those of ViT and each model consists of a number of stacked transformer encoder blocks. Each block performs visual processing of its input through self-attention, MLP and layer normalization modules. Input to these networks includes a sequence of processed image tokens (localized image patches) concatenated with a learnable class token.
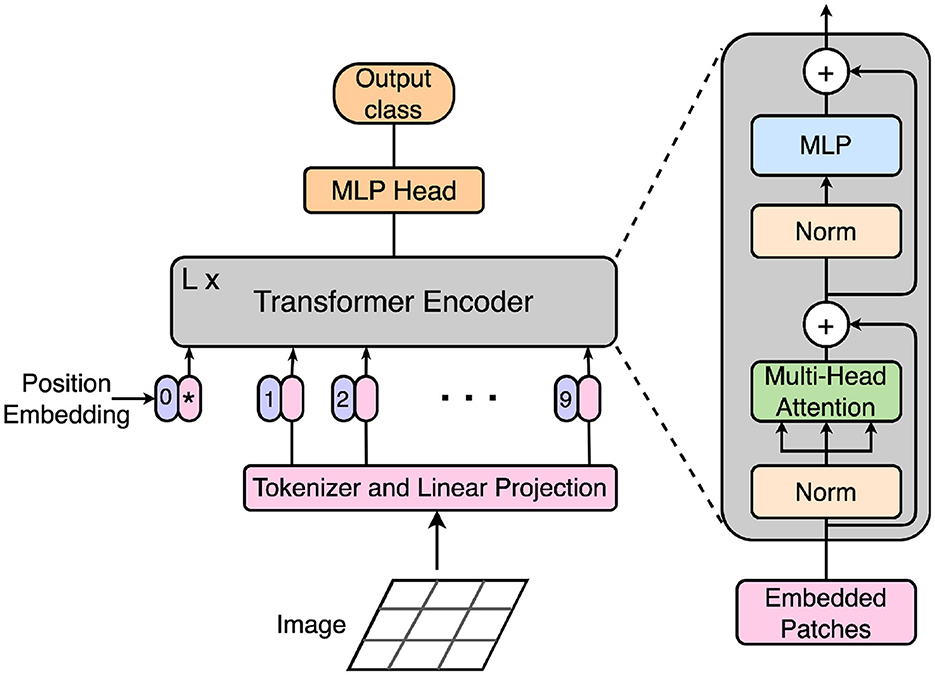
Figure 1. The ViT model architecture (Dosovitskiy et al., 2021). First, each input image is split into local patches called tokens. After linear embedding of the tokens, a numerical position embedding is added to each token. After concatenating a learnable class embedding shown with an asterisk to the input sequence, the combined embeddings are fed to L blocks of transformer encoders. The output of the final encoder block is fed to a classification head in ViT. The zoomed-in diagram on the right demonstrates the various modules within a transformer encoder block. These modules consist of norm, multi-head self-attention and MLP.
Vision transformer variants can be grouped into three main categories:
1. Models that utilized stacks of transformer encoder blocks as introduced in ViT but modified the training regime and reported a boost in performance, such as DeiT (Touvron et al., 2021) and BEiT (Bao et al., 2022).
2. Models that modified ViT for better adaptation to the visual domain. For example, Liu et al. (2021) introduced an architecture called Swin and suggested incorporating various scales and shifted local windows between blocks. A few other work suggested changes to the scope of attention, for example, local vs. global (Chen et al., 2021; Yang et al., 2021).
3. Hybrid models that introduced convolution either as a preprocessing stage (Xiao et al., 2021) or as a computational step within transformer blocks (Wu H. et al., 2021).
The family of vision transformers that we studied in our experiments includes ViT, DEiT, BEiT, Swin, and CvT. These models span all three categories of vision transformers as classified above. For each model, we studied a number of pre-trained architectures available on HuggingFace (Wolf et al., 2020). Details of these architectures are outlined in Table 1.
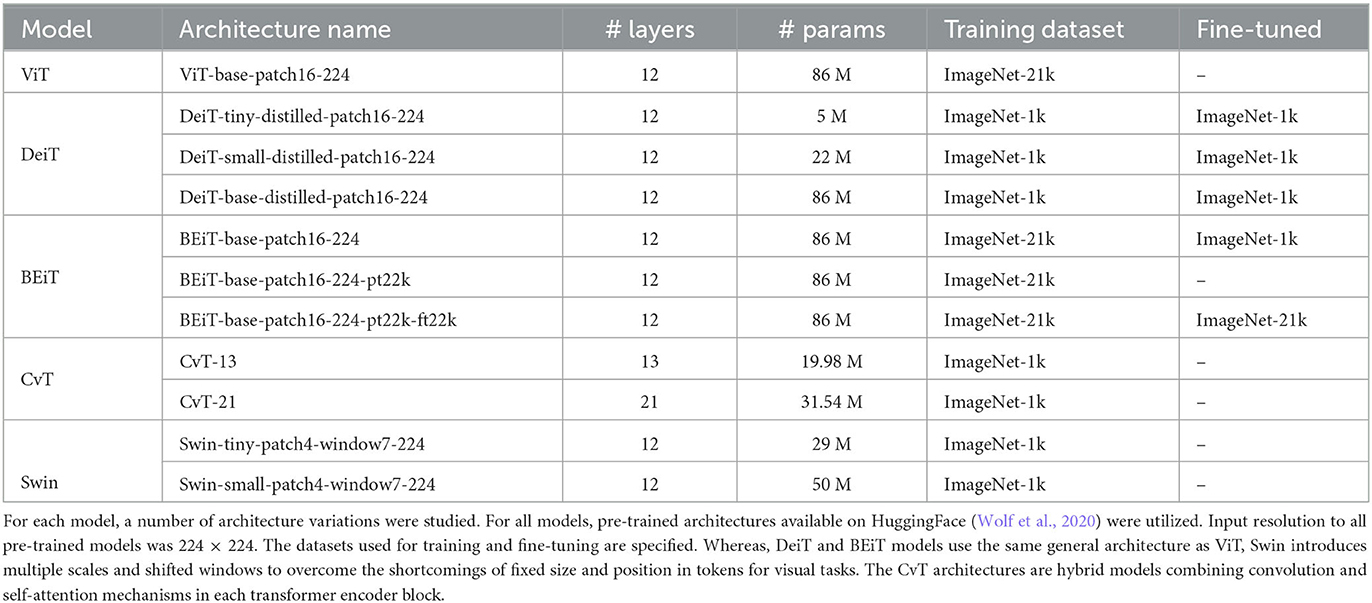
Table 1. The family of vision transformers studied in this work.
2.1.1. Attention formulation
In transformers, the attention mechanism for a query and key-value pair is defined as:
where Q, K, and V represent matrices of queries, keys and values with tokens as rows of these matrices, and dk is the dimension of individual key/query vectors. Multiplying each query token, a row of Q, in the matrix multiplication QKT is in fact a dot-product of each query with all keys in K. The output of this dot-product can be interpreted as how similar the query token is to each of the key tokens in the input; a compatibility measure. This dot product is then scaled by and the softmax yields the weights for value tokens. Vaswani et al. (2017) explained the output of attention modules as “a weighted sum of the values, where the weight assigned to each value is computed by a compatibility function of the query with the corresponding key”. The same formulation was employed in ViT while the compatibility function formulation is slightly modified in some vision transformer variants. Nonetheless, the core of the compatibility function in all of these models is a dot-product measuring representation similarity. Vaswani et al. (2017) reported improved performance when instead of a single attention function, they mapped the query, key and value tokens to h disjoint representational learned spaces and computed attention in each space called a head. Concatenation of the attention computed in individual heads yields the output of the attention module that they called Multi-Head Attention module.
In transformer encoders, the building block of vision transformers, the query, key and value have the same source and come from the output of the previous block. Hence, the attention modules in these blocks are called self-attention. In this case, the attention formulation can be explained as a process that results in consistent token representations across all spatial positions in the stimulus. Specifically, token representation and attention can be described as follows: each token representation signifies presence/absence of certain visual features, providing a visual interpretation or label at that spatial position. The attention mechanism incorporates the context from the input into its process and describes the inter-token relations determined by the compatibility function. As a result, Equation (1) shifts the interpretation of a given token toward that of more compatible tokens in the input. The final outcome of this process will be groups of tokens with similar representations. Zucker (1978) referred to this process as “Gestalt-like similarity grouping process”.
In Zucker (1978), the Gestalt-like similarity grouping process is introduced as a type of relaxation labeling (RL) process. Relaxation labeling is a computational framework for updating the possibility of a set of labels (or interpretations) for an object based on the current interpretations among neighboring objects. Updates in RL are performed according to a compatibility function between labels. In the context of vision transformers, at a given layer, each token is an object for which a feature representation (label) is provided from the output of the previous layer. A token representation is then updated (the residual operation after the attention module) according to a dot-product compatibility function defined between representations of neighboring tokens. In ViT, the entire stimulus forms the neighborhood for each token.
Zucker (1978) defined two types of RL processes in low-level vision: vertical and horizontal. In horizontal processes, the compatibility function defines interaction at a single level of abstraction but over multiple spatial positions. In contrast, vertical processes involve interaction in a single spatial position but across various levels of abstraction. Although Zucker counts both types of vertical and horizontal processes contributing to Gestalt-like similarity grouping, self-attention formulation only fits the definition of horizontal relaxation labeling process and thus, implements a special class of RL. As a final note, while traditional RL relies on several iterations to achieve consistent labeling across all positions, horizontal processes in vision transformers are limited to a single iteration and therefore, a single iteration of Gestalt-like similarity grouping is performed in each transformer encoder block.
2.1.2. Transformer encoders are feed-forward models
Even though the formulation of self-attention in vision transformers suggests Gestalt-like similarity grouping, this alone does not rule out the possibility of performing attention in these modules. We consider this possibility in this section.
It is now established that humans employ a set of mechanisms, called visual attention, that limit visual processing to sub-regions of the input to manage the computational intractability of the vision problem (Tsotsos, 1990, 2017). Despite the traditional Gestalt view, modern attention research findings suggest a set of bottom-up and top-down mechanisms determine the target of attention. For example, visual salience [“the distinct subjective perceptual quality which makes some items in the world stand out from their neighbors and immediately grab our attention” (Itti, 2007)] is believed to be a bottom-up and stimulus-driven mechanism employed by the visual system to select a sub-region of the input for further complex processing. Purely feed-forward (also called bottom-up) processes, however, were shown to be facing an intractable problem with exponential computational complexity (Tsotsos, 2011). Additionally, experimental evidence suggests that visual salience (Desimone and Duncan, 1995) as well as other low-level visual factors could be affected by feedback (also known as top-down) and task-specific signals (Folk et al., 1992; Bacon and Egeth, 1994; Kim and Cave, 1999; Yantis and Egeth, 1999; Lamy et al., 2003; Connor et al., 2004; Baluch and Itti, 2011; Peterson, 2015). In other words, theoretical and experimental findings portray an important role for top-down and guided visual processing. Finally, Herzog and Clarke (2014) showed how a visual processing strategy for human vision cannot be both hierarchical and strictly feed-forward through an argument that highlights the role of visual context. A literature going back to the 1800's extensively documents human attentional abilities (Itti et al., 2005; Carrasco, 2011; Nobre et al., 2014; Tsotsos, 2022; Krauzlis et al., 2023).
Modern understanding of visual attention in humans provides a guideline to evaluate current computational models for visual attention. Vision transformers are among more recent developments that are claimed to implement attention mechanisms. However, it is evident that these models with their purely feed-forward architectures implement bottom-up mechanisms. Therefore, if it can be established that these models implement attention mechanisms, they can only capture the bottom-up signals that contribute to visual attention and not all aspects of visual attention known in humans. These observations call for a careful investigation of the effect of attention on visual processing in these models.
2.2. Experiments
In our experiments, we will consider the output of the attention module in each model block (the green rectangle in Figure 1) before the residual connection. In both experiments, we removed the class token from our analysis. Suppose that an attention module receives an input of size H×W×C, where H, W, and C represent height, width and feature channels. Then, the output, regardless of whether the attention module is multi-head or not, will also be of size H×W×C. In what follows, the term attention map is used for each H×W component of the attention module output along each single feature dimension c∈{1, 2, …, C}. In other words, the values comprising each attention map are obtained from the attention scores (Equation 1), along a single feature dimension. Also, feature channel and hidden channel will be employed interchangeably.
It is important to emphasize that the attention maps we consider for our experiments and evaluations differ from those often visualized in the vision transformer literature. Specifically, in our evaluations, we consider what the model deems as salient, the regions that affect further processing in later model blocks. In contrast, what is commonly called an attention map in previous work (Dosovitskiy et al., 2021) is computed for a token, usually the output token in vision transformers and by recursively backtracking the compatibility of the token with other tokens to the input layer (Abnar and Zuidema, 2020). Therefore, a different map can be plotted for the various class tokens in the model and these maps are conditioned on the given token. One can interpret these maps as regions of input that are most relevant to yielding the given class token. Also, note that the compatibility (result of the softmax function in Equation 1) employed for this visualization, is only part of what (Vaswani et al., 2017) called the attention score defined Equation 1. Maps obtained with this approach do not serve our goal: we seek to determine regions of the input that were considered as salient, as Xu et al. (2015) put it, and were the focus of attention during the bottom-up flow of the signal in inference mode. These regions with high attention scores from Equation (1) are those that affect the visual signal through the residual connection (the + sign after the green rectangle in Figure 1). Hence, we evaluated the output of the attention module in both experiments.
2.2.1. Experiment 1: similarity grouping
To quantify Gestalt-like similarity grouping in vision transformers, we created a dataset for similarity grouping with examples shown in Figure 2 and measured similarity grouping performance in vision transformers mentioned in Section 2.1. As explained earlier, the attention from Equation (1) signals grouping among tokens. Therefore, we measured similarity grouping by recording and analyzing the output of attention modules in these models.
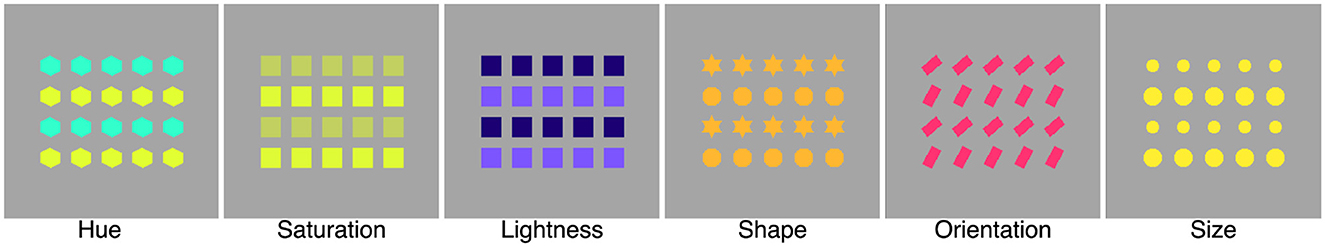
Figure 2. Similarity grouping stimuli examples. The stimuli in this dataset consists of two groups defined according to difference in one of hue, saturation, lightness, shape, orientation, size features. Each stimuli has four rows with alternating figures from the two groups. The values for the visual features that define the groups are chosen randomly. The shape set in this dataset consists of rectangle, triangle, ellipse, star, rhombus, right triangles, trapezoid, hexagon and square. Examples in this figure were picked from the version in which each figure fits within a 37 × 37 square.
2.2.1.1. Dataset
Each stimulus in the dataset consists of four rows of figures with features that differ along a single visual feature dimension including hue, orientation, lightness, shape, orientation and size. Each stimulus is 224 × 224 pixels and contains two perceptual groups of figures that alternate between the four rows. The values of the visual feature that formed the two groups in each stimulus were randomly picked.
In some vision transformers, such as ViT, the token size and position are fixed from input and across the hierarchy. This property has been considered a shortcoming in these models when employed in visual tasks and various work attempted to address this issue (Liu et al., 2021). Since we included vision transformers that employ ViT as their base architecture in our study, and in order to control for the token size and position in our analysis, we created the dataset such that each figure in the stimulus would fit within a single token of ViT. In this case, each figure fits a 16 × 16 pixels square positioned within ViT tokens. To measure the effect of fixed tokens on grouping, we created two other sets of stimuli. In the first set, we considered the center of every other token from ViT as a fixed position for figures and generated stimuli with figures that would fit 32 × 32 pixels squares. In this case, each figure will be relatively centered at a ViT token, but will span more than a single token. In the second set, we generated stimuli with figures that were token-agnostic. We designed these stimuli such that the set of figures was positioned at the center of the image instead of matching token positions, with each figure size fitting a 37 × 37 pixels square.
Each version of our grouping dataset consists of 600 images with 100 stimuli per visual feature dimension, summing to a total of 1,800 stimuli for all three versions.
2.2.1.2. Evaluation and metrics
For a self-attention module that yields a H×W×C map, where H and W represent height and width and C the number of feature channels, we first normalized the attention maps across individual feature channels so that attention scores are in the [0, 1] range. Then, we measured grouping along each feature channel based on two metrics:
• Grouping index: Suppose Ag1 and Ag2 represent the average attention score of pixels belonging to figures in group 1 and group 2, respectively. We defined the grouping index as:
The grouping index GI varies in [0, 1], with larger values indicating better grouping of one group of figures in the stimulus along the feature channel.
• Figure-background ratio: The overall performance of vision transformers will be impacted if background tokens are grouped with figure tokens (mixing of figure and ground). Therefore, we measured the figure-background attention ratio as:
where Ag1, Ag2 represent the average attention for group 1 and group 2 figures, respectively, and Abkg is the average score of background. The attention ratio AR is positive and values larger than 1 indicate the attention score of at least one group of figures is larger than that of the background (the larger the ratio, the less the mixing of figure and ground). Note that the attention ratio AR signifies the relative attention score assigned to figure and ground. Therefore, values close to 1 suggest similar attention scores assigned to figure and ground, quite contrary to the expected effect from attention mechanisms.
For each stimulus, we excluded all feature dimensions along which both Ag1 = 0 and Ag2 = 0 from our analysis. This happens when, for example, the feature channels represent green hues, and the figures in the stimulus are figures of red and blue. Moreover, when analyzing AR, we excluded all channels with Abkg = 0 as our goal was to investigate grouping of figure and ground when some attention was assigned to the background.
2.2.2. Experiment 2: singleton detection
Evidence for similarity grouping does not disprove implementation of attention in vision transformers. Since these models are feed-forward architectures, investigating the effect of attention modules in their visual processing must be restricted to bottom-up mechanisms of attention. Therefore, we limited our study to evaluating the performance of these models in the task of singleton detection as an instance of saliency detection (see Bruce et al., 2015; Kotseruba et al., 2019 for a summary of saliency research). Specifically, strong performance on saliency detection would suggest that these models implement the bottom-up mechanisms deployed in visual attention.
In this experiment, we recorded the attention map of all blocks in vision transformers mentioned in Section 2.1. Following Zhang and Sclaroff (2013), we computed an average attention map for each transformer block by averaging over all the attention channels and considered the resulting map as a saliency map. Then, we tested if the saliency map highlights the visually salient singleton. Additionally, we combined the feature maps obtained after the residual operation of attention modules and evaluated saliency detection performance for the average feature map. It is worth noting that self-attention modules, and not the features maps, are expected to highlight salient regions as the next targets for further visual processing. Nonetheless, for a better understanding of the various representations and mechanisms in vision transformers, we included feature-based saliency maps in our study.
2.2.2.1. Dataset
For the singleton detection experiment, we utilized the psychophysical patterns (P3) and odd-one-out (O3) dataset introduced by Kotseruba et al. (2019). Examples of each set are shown in Figure 3. The P3 dataset consists of 2,514 images of size 1,024 × 1,024. Each image consists of figures on a regular 7 × 7 grid with one item as the target that is visually different in one of color, orientation or size from other items in the stimulus. The location of the target is chosen randomly. The O3 dataset includes 2,001 images with the largest dimension set to 1,024. In contrast to the grouping and P3 datasets whose stimuli were synthetic images, the O3 dataset consists of natural images. Each image captures a group of objects that belong to the same category with one that stands out (target) from the rest (distractors) in one or more visual feature dimensions (color, texture, shape, size, orientation, focus and location). The O3 with natural images provides the opportunity to investigate the performance of the vision transformer models in this study on the same type of stimuli those were trained. Both P3 and O3 datasets are publicly available and further details of both datasets can be found in Kotseruba et al. (2019).
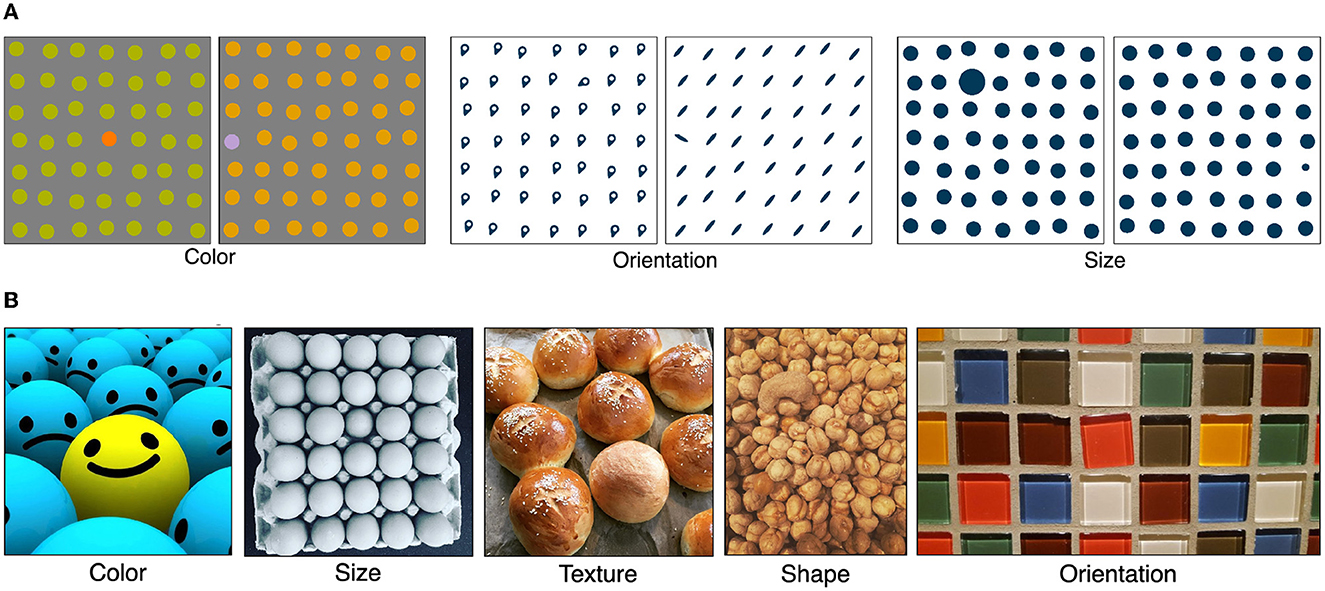
Figure 3. Samples of stimuli from P3 and O3 datasets introduced by Kotseruba et al. (2019) are illustrated. These datasets consist of stimuli with singletons in various feature dimensions. (A) Examples from the psychophysical patterns (P3) dataset. The singletons in this dataset are defined according to color, orientation and size. (B) Examples from the odd-one-out (O3) dataset with singletons in color, size, texture, shape and orientation feature dimensions.
2.2.2.2. Metrics
We followed Kotseruba et al. (2019) to measure singleton detection performance in vision transformers. We employed their publicly available code for the computation of metrics they used to study traditional and deep saliency models. The number of fixation and saliency ratio were measured for P3 and O3 images, respectively, as explained below.
• Number of fixations: Kotseruba et al. (2019) used the number of fixations required to detect pop-out as a proxy for salience. Specifically, they iterated through the maxima of the saliency map until the target was detected or a maximum number of iterations was reached. At each iteration that resembles a fixation of the visual model on a region of input, they suppressed the fixated region with a circular mask before moving the fixation to the next maxima. Lower number of fixations indicates higher relative salience of the target to that of distractors.
• Saliency ratio: Kotseruba et al. (2019) employed the ratio of the maximum saliency of the target vs. the maximum saliency of the distractors. They also measured the ratio of the maximum saliency of the background to the maximum saliency of the target. These two ratios that are referred to as MSRtarg and MSRbg determine if the target is more salient than the distractors or the background, respectively. Ideally, MSRtarg is >1 and MSRbg is < 1.
3. Results
3.1. Experiment 1: similarity grouping
Each vision transformer in our study consists of a stack of transformer encoder blocks. In this experiment, our goal was to investigate similarity grouping in attention modules in transformer encoder blocks. We were also interested in changes in similarity grouping over the hierarchy of transformer encoders. Therefore, for each vision transformer, we took the following steps: We first isolated transformer encoders in the model and computed the grouping index (GI) and attention ratio (AR) per channel as explained in Section 2.2.1.2. Then, we considered the mean GI and AR per block as the representative index and ratio of the layer.
Figure 4A shows the mean GI for the architecture called “ViT-base-patch16-224” in Table 1 over all layers of the hierarchy. The GI is plotted separately according to the visual feature that differed between the groups of figures. This plot demonstrates that GI for all blocks of this model across all tested feature dimensions is distinctly larger than 0, suggesting similarity grouping of figures in all attention modules of this architecture. Interestingly, despite some variations in the first block, all layers have relatively similar GI. Moreover, the grouping indices for all feature dimensions are close, except for hue with GI larger than 0.6 in the first block, indicating stronger grouping among tokens based on this visual feature.

Figure 4. Mean grouping index and attention ratio for the ViT-base-patch16-224 architecture over all stimuli but separated according to the visual features that defined the groups of figures in the input. (A) The mean grouping index is larger than 0.2 for all layers of the model across all visual features, suggesting perceptual grouping based on similarity in this architecture. (B) The attention ratio of larger than 1 for all transformer encoder blocks of ViT-base-patch16-224 indicates larger scores are assigned to figure tokens. However, the steep decline in the AR ratio in the hierarchy demonstrates mixing of figure and background tokens due to similar attention scores. (A) Mean grouping index (GI). (B) Mean attention ratio (AR).
Figure 4B depicts the mean AR for the same architecture, ViT-base-patch16-224, for all the encoder blocks. Note that all curves in this plot are above the AR = 1 line denoted as a dashed gray line, indicating that all attention modules assign larger attention scores to at least one group of figures in the input vs. the background tokens. However, notable is the steep decline in the mean AR across the hierarchy. This observation confirms the previous reports of smoother attention maps in higher stages of the hierarchy (Park and Kim, 2022) with similar attention assigned to figure and background tokens.
Figure 5 shows the mean GI for all the architectures from Table 1 separately based on the visual feature that defined the groups in the input. All models, across all their layers, with some exceptions, demonstrate mean GI that are distinctly larger than 0. The exceptions include the first layer of all BEiT architectures and Swin-small-patch4-window7-224, and the last block of CvT-13 and CvT-21. Interestingly, BEiT and Swin architectures jump in their mean GI in their second block. Even though DeiT and BEiT architectures utilized the same architecture as ViT but trained the model with more modern training regimes, both models demonstrate modest improvement over ViT-base-patch16-224.
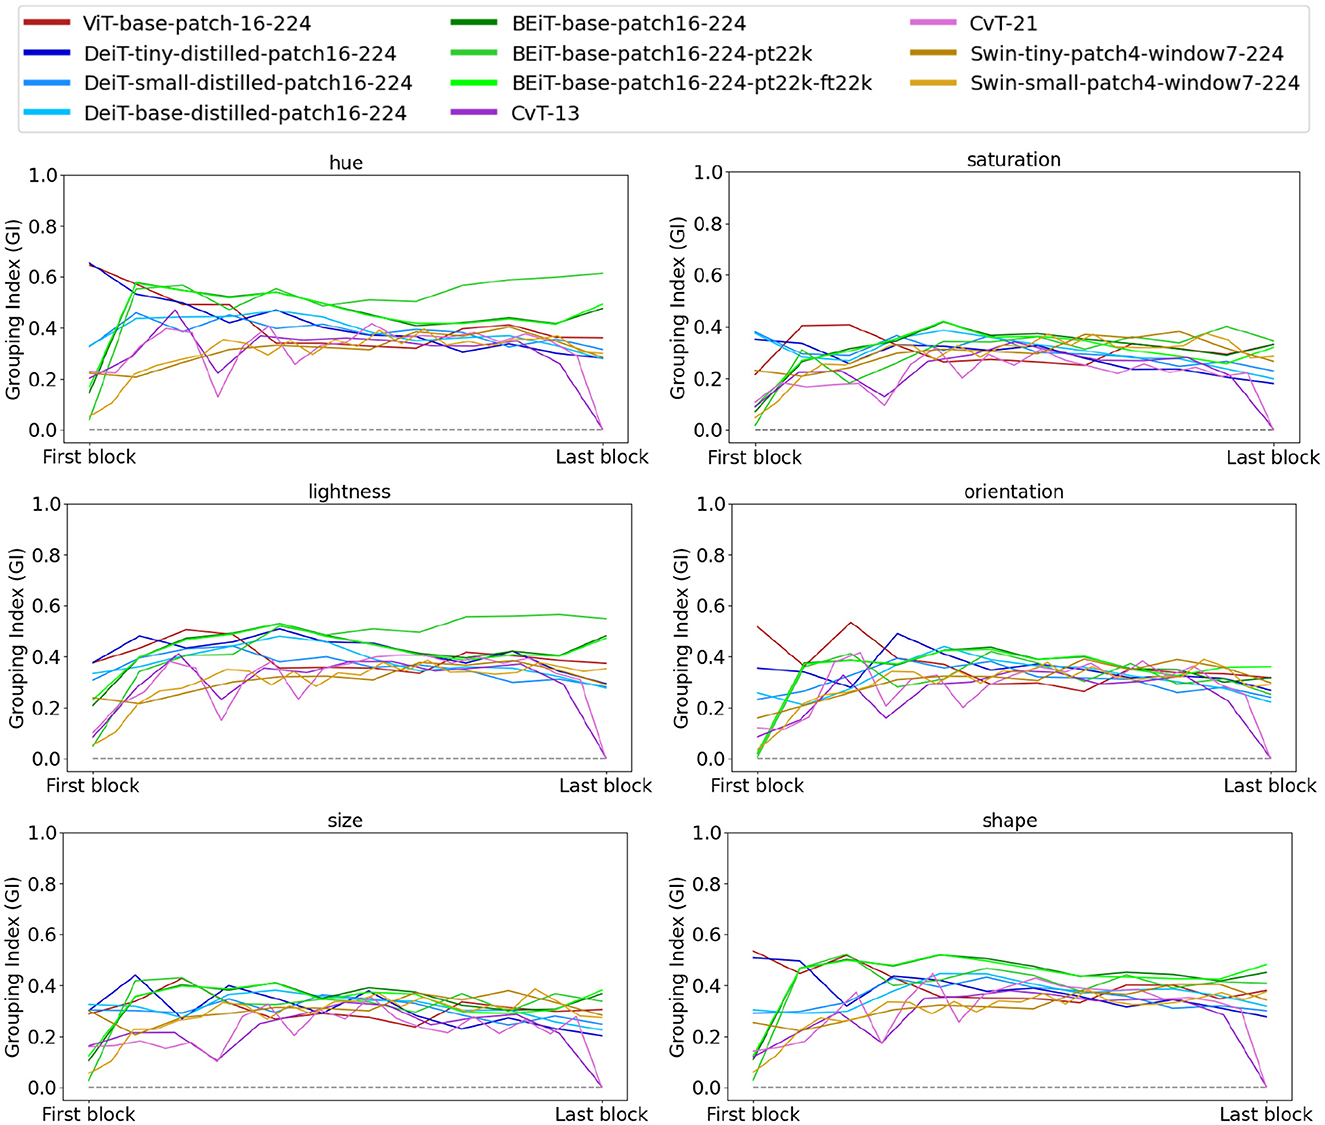
Figure 5. Mean grouping index for all the architectures from Table 1 plotted separately for each visual feature that defined the perceptual grouping of figures in the input. For comparison purposes, we plotted the grouping index of all models within the same range on the x-axis. Accordingly, we labeled the first and last block on the horizontal axis. These plots demonstrate that all models perform similarity grouping of figures based on low-level visual features such as hue and orientation. Except for the final block of CvT models, all layers of all architectures have mean GI higher than 0. The legend at the top applies to all plots.
Plots in Figure 6 depict the mean AR over all the architectures. Interestingly, ViT-base-patch16-224 is the only architecture whose mean AR for the first block is the largest in its hierarchy and unanimously for all visual features. Among the three DeiT architectures (tiny, small, and base), DeiT-tiny-distilled-patch16-224, demonstrates larger mean AR ratios. Comp ared to ViT, DeiT-tiny-distilled-patch16-224 has far fewer parameters and the comparable mean AR for this architecture with Vit confirms the suggestion of Touvron et al. (2021) that an efficient training regime in a smaller model could result in performance gain against a larger model. Results from Figure 6 are also interesting in that all of Swin and CvT architectures that are claimed to adapt transformer models to the vision domain, have relatively small mean AR over their hierarchy. These results show that these models mix figure and background tokens in their attention score assignments, an observation that deserves further investigation in a future work.
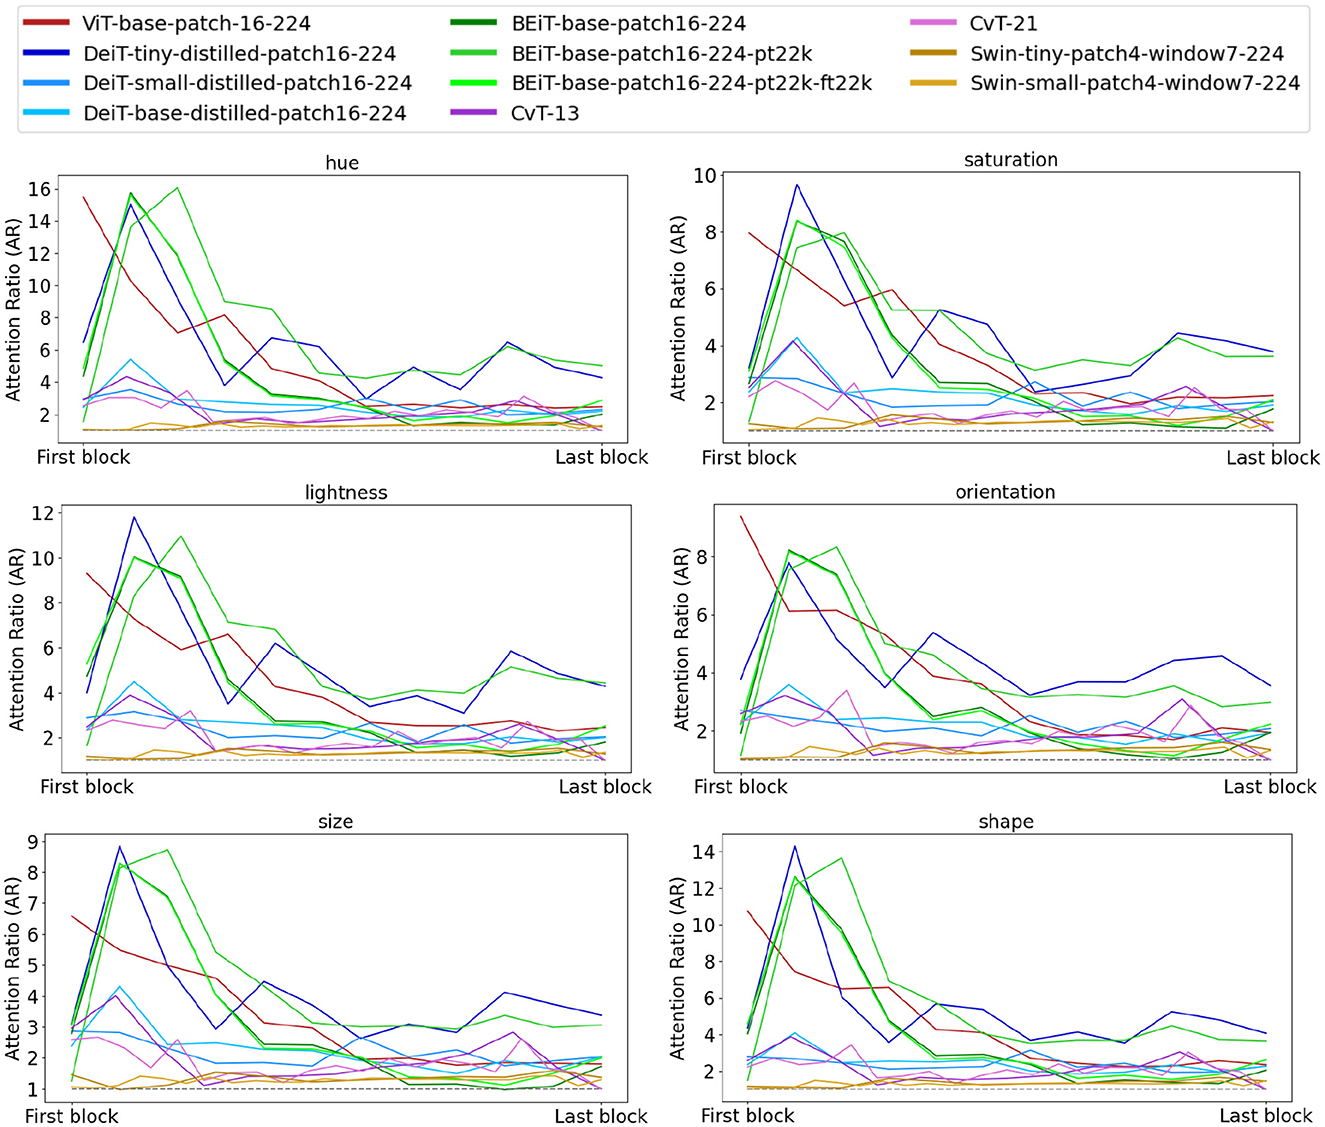
Figure 6. Mean attention ratio for all the architectures from Table 1 plotted separately for each visual feature that defined the perceptual grouping of figures in the input. Similar to Figure 5, and for ease of comparison, we plotted the AR for all models within the same range on the x-axis. Interestingly, Swin and CvT, two models that adapted ViT to the visual domain, have relatively smaller attention ratios compared to the rest of the architectures, suggesting that incorporating scale and shifting the token position in Swin and convolution in CvT architectures results in mixing of figure and background representations and consequently attention scores. Among the other architectures that use ViT as the underlying model, the attention ratio plots are somewhat similar to those of Figure 4B, that is, larger attention ratios in earlier blocks with a decline in the hierarchy.
Finally, Figure 7 summarizes the mean grouping index GI for the DeiT-base-distilled-patch16-224 architecture over the three versions of the grouping dataset as explained in Section 2.2.1.1. These results demonstrate similar grouping index over all three versions, suggesting little impact of token position and size relative to figures in the input.
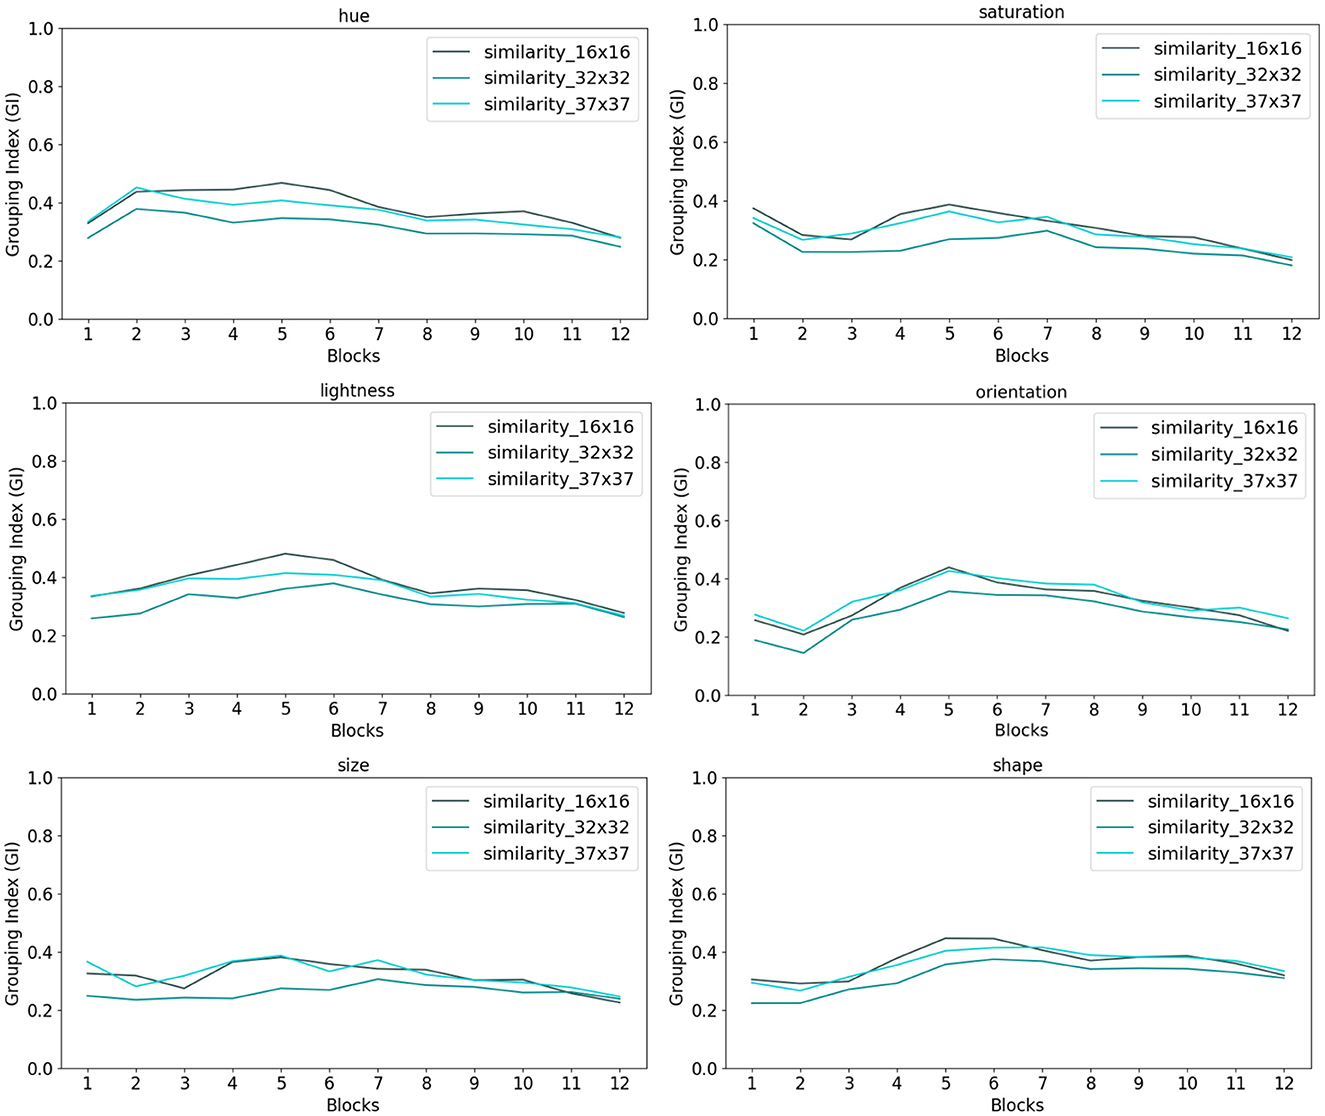
Figure 7. Each token in ViT-based architectures has a fixed position and size across the hierarchy of transformer encoders. This property is noted as a shortcoming of some vision transformers. To control for position and size of tokens in these models, we designed our grouping dataset according to the ViT model tokens such that each figure in the stimulus would fit within and positioned inside the model 16 × 16 tokens. To test for the effect of figure size, we introduced a version of grouping dataset with figures centered at every other ViT token but larger in size such that each figure would fit a 32 × 32 square. We also introduced a third version where figures in the stimuli were token-agnostic. In the third version, the set of figures occupy the center of image and each figure fits within a 37 × 37 square. We tested the grouping performance of the DeiT-base-distilled-patch16-224 architecture over all three versions of the dataset. Note that DeiT-base-distilled-patch16-224 utilizes an identical architecture as ViT-base-patch16-224 with a different training regime. Our results over the various visual features in the dataset demonstrate comparable results over the three versions of the dataset, suggesting no significant effect of token position or size in grouping in vision transformers.
3.2. Experiment 2: singleton detection
Generally, in saliency experiments, the output of the model is considered for performance evaluation. In this study, however, not only we were interested in the overall performance of vision transformers (the output of the last block), but also in the transformation of the saliency signal in the hierarchy of these models. Examining the saliency signal over the hierarchy of transformer blocks would provide valuable insights into the role of attention modules in saliency detection. Therefore, we measured saliency detection in all transformer blocks.
3.2.1. The P3 dataset results
Following Kotseruba et al. (2019), to evaluate the performance of vision transformer models on the P3 dataset, we measured the target detection rate at 15, 25, 50, and 100 fixations. Chance level performance for ViT-base-patch16-224, as an example, would be 6, 10, 20, and 40% for 15, 25, 50, and 100 fixations, respectively (masking after each fixation explained in Section 2.2.2 masks an entire token). Although these levels for the various models would differ due to differences in token sizes and incorporating multiple scales, these chance level performances from ViT-base-patch16-224 give a baseline for comparison.
Figure 8 demonstrates the performance of saliency maps obtained from attention and feature maps of all ViT-base-patch16-224 blocks. These plots clearly demonstrate that the feature-based saliency maps in each block outperform those computed from the attention maps. This is somewhat surprising since as explained in Section 2.2.2, if vision transformers implement attention mechanisms, attention modules in these models are expected to highlight salient regions in the input for further visual processing. Nonetheless, plots in Figure 8 tell a different story, namely that feature maps are preferred options for applications that require singleton detection. Comparing target detection rates across color, orientation and size for both attention and feature maps demonstrate higher rates in detecting color targets compared to size and orientation. For all three of color, orientation and size, the target detection rates peak at earlier blocks for attention-based saliency maps and decline in later blocks, with lower than chance performance for most blocks. This pattern is somewhat repeated in feature-based saliency maps with more flat curves in the hierarchy, especially for a larger number of fixations.
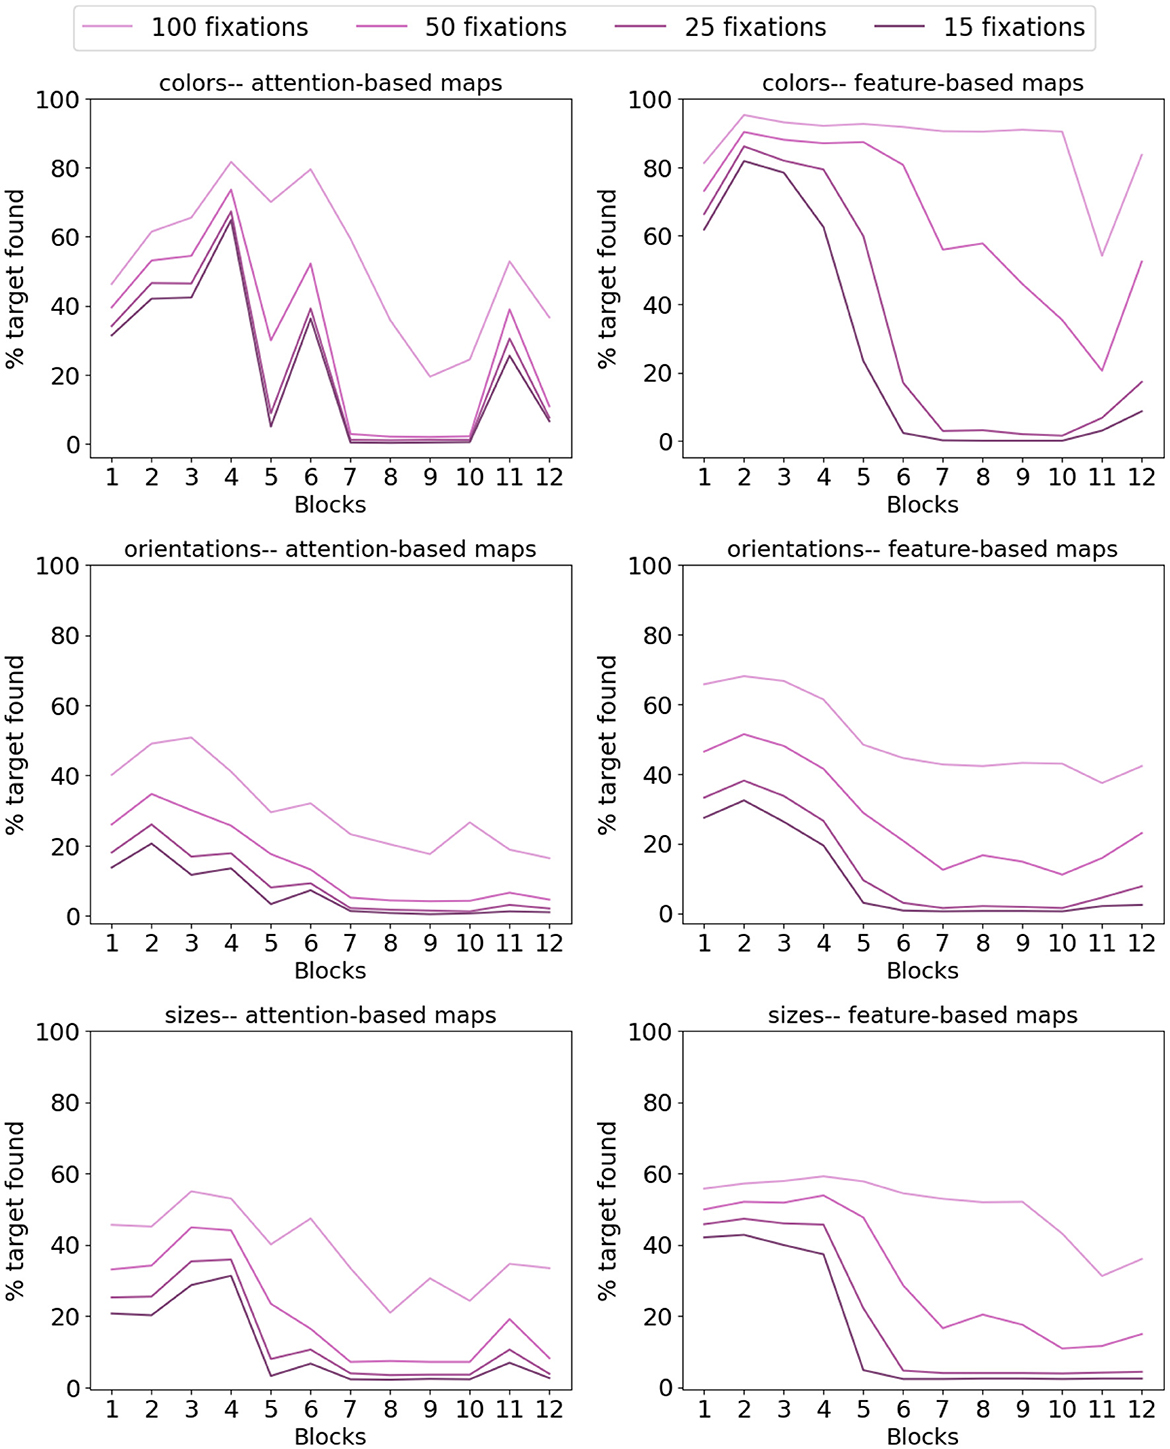
Figure 8. Target detection rate of the ViT-base-patch16-224 model for 15, 25, 50, and 100 fixations on images of the P3 dataset. Legend on top applies to all plots. For this model with 16 × 16 pixels tokens, each masking after a fixation masks almost an entire token. Therefore, chance performance will be at 6, 10, 20, and 40% for 15, 25, 50, and 100 fixations. Comparing the plots of the left column for attention-based saliency maps vs. those on the right obtained from feature-based saliency maps indicates superior performance of feature-based maps for salient target detection. This is interesting in that modules claimed to implement attention mechanisms are expected to succeed in detecting visually salient figures in the input. Overall, for both attention and feature-based maps, color targets have higher detection rates vs. orientation and size, the conditions in which performance is mainly at chance level for all fixation thresholds and across all blocks in the ViT hierarchy. Additionally, in both attention and feature-based maps, performance peaks in earlier blocks and declines in later layers, suggesting multiple transformer encoder blocks mix representations across spatial locations such that the model cannot detect the visually salient target almost immediately or even by chance.
Similar detection rate patterns were observed in other vision transformer models. However, due to limited space, we refrain from reporting the same plots as in Figure 8 for all the vision transformer models that we studied. These plots can be found in the Supplementary material. Here, for each model, we report the mean target detection rate over all blocks and the detection rate for the last block of each model for both attention and feature-based saliency maps. These results are summarized in Figures 9, 10 for the last and mean layer target detection rates, respectively. Consistent with the observations from ViT-base-patch16-224 in Figure 8, the feature-based saliency maps outperform attention-based ones in Figure 9 and in general have higher detection rates than the chance levels stated earlier. The attention-based saliency maps, across most of the models, fail to perform better than chance. Generally, all models have higher detection rates for color targets, repeating similar results reported by Kotseruba et al. (2019). Interestingly, Swin architectures that incorporate multiple token scales, perform poorly in detecting size targets with both feature and attention-based saliency maps.
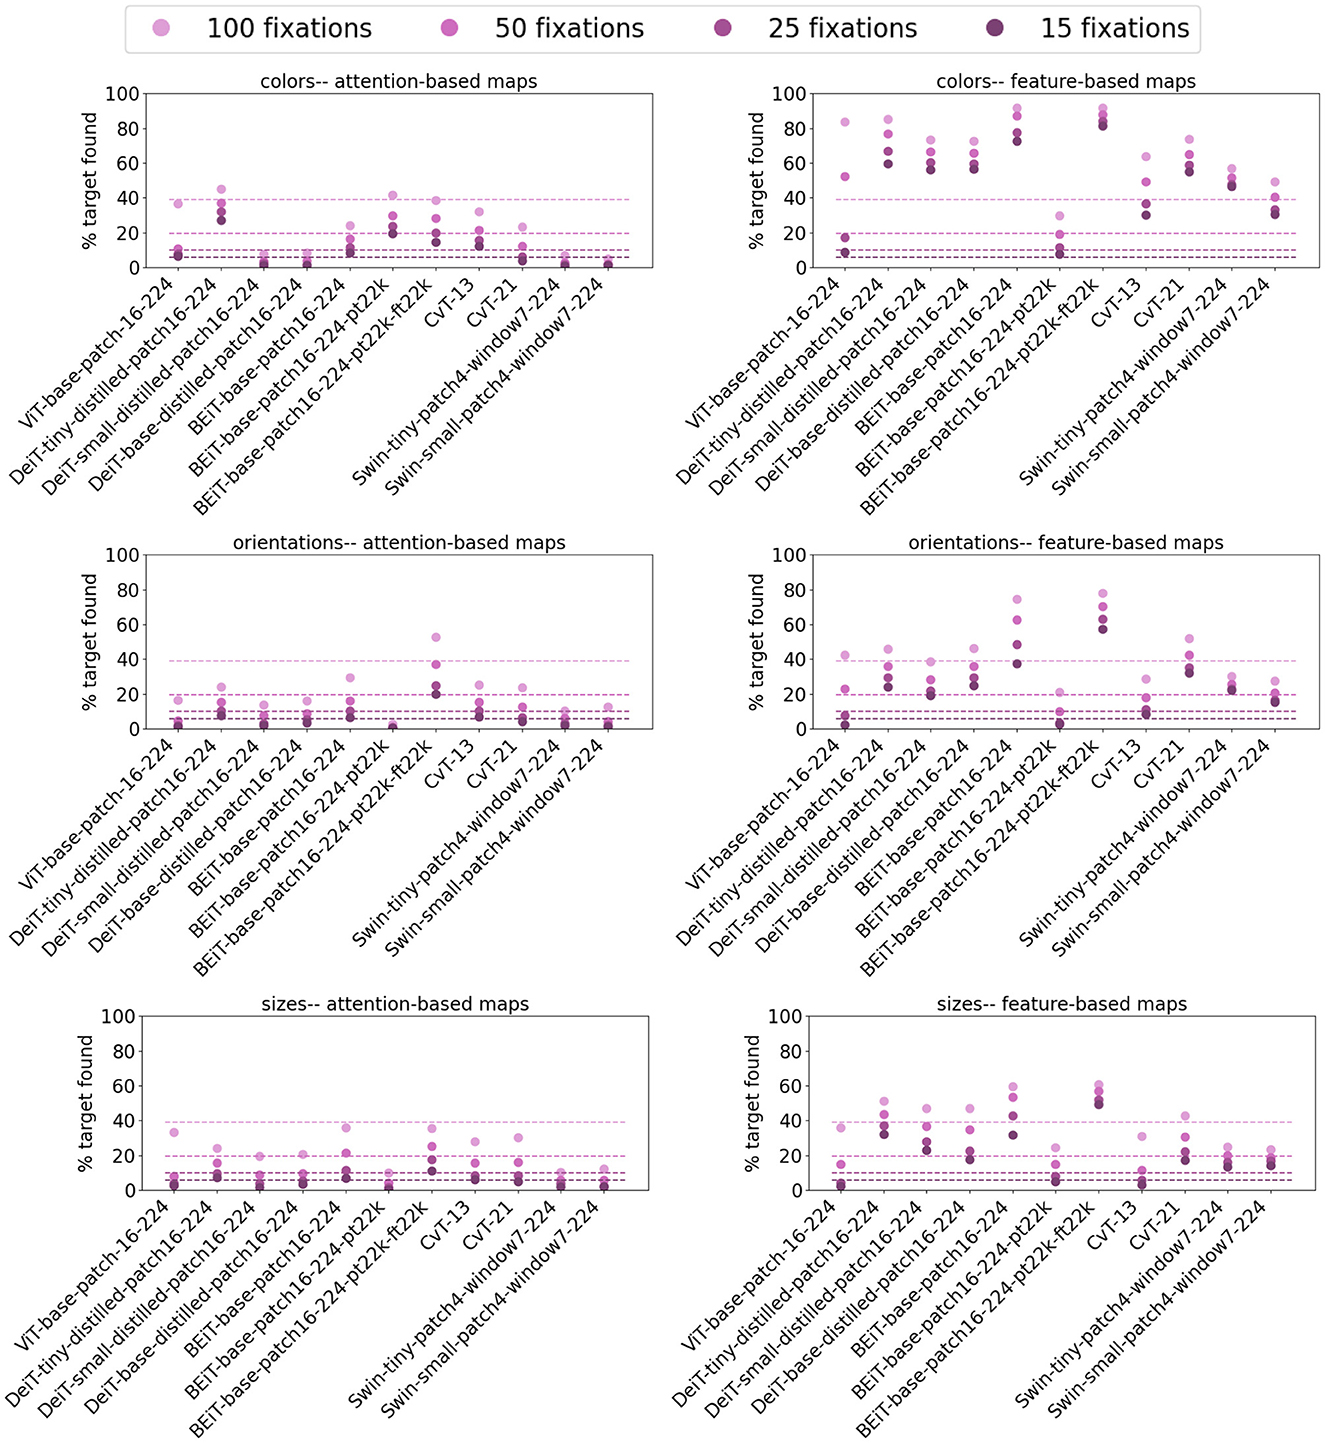
Figure 9. Target detection rate of the last block of vision transformers investigated in this work for 15, 25, 50, and 100 fixations on stimuli from the P3 dataset. The chance level performance of the ViT model is plotted as dashed lines with matching colors for each fixation threshold. Similar to the observation of ViT, feature-based maps outperform attention-based maps and generally at rates higher than chance. Color targets are easier to detect for both map types. Interestingly, both Swin architectures struggle to detect size targets in both attention and feature-based maps, despite incorporating multiple scales in their model.
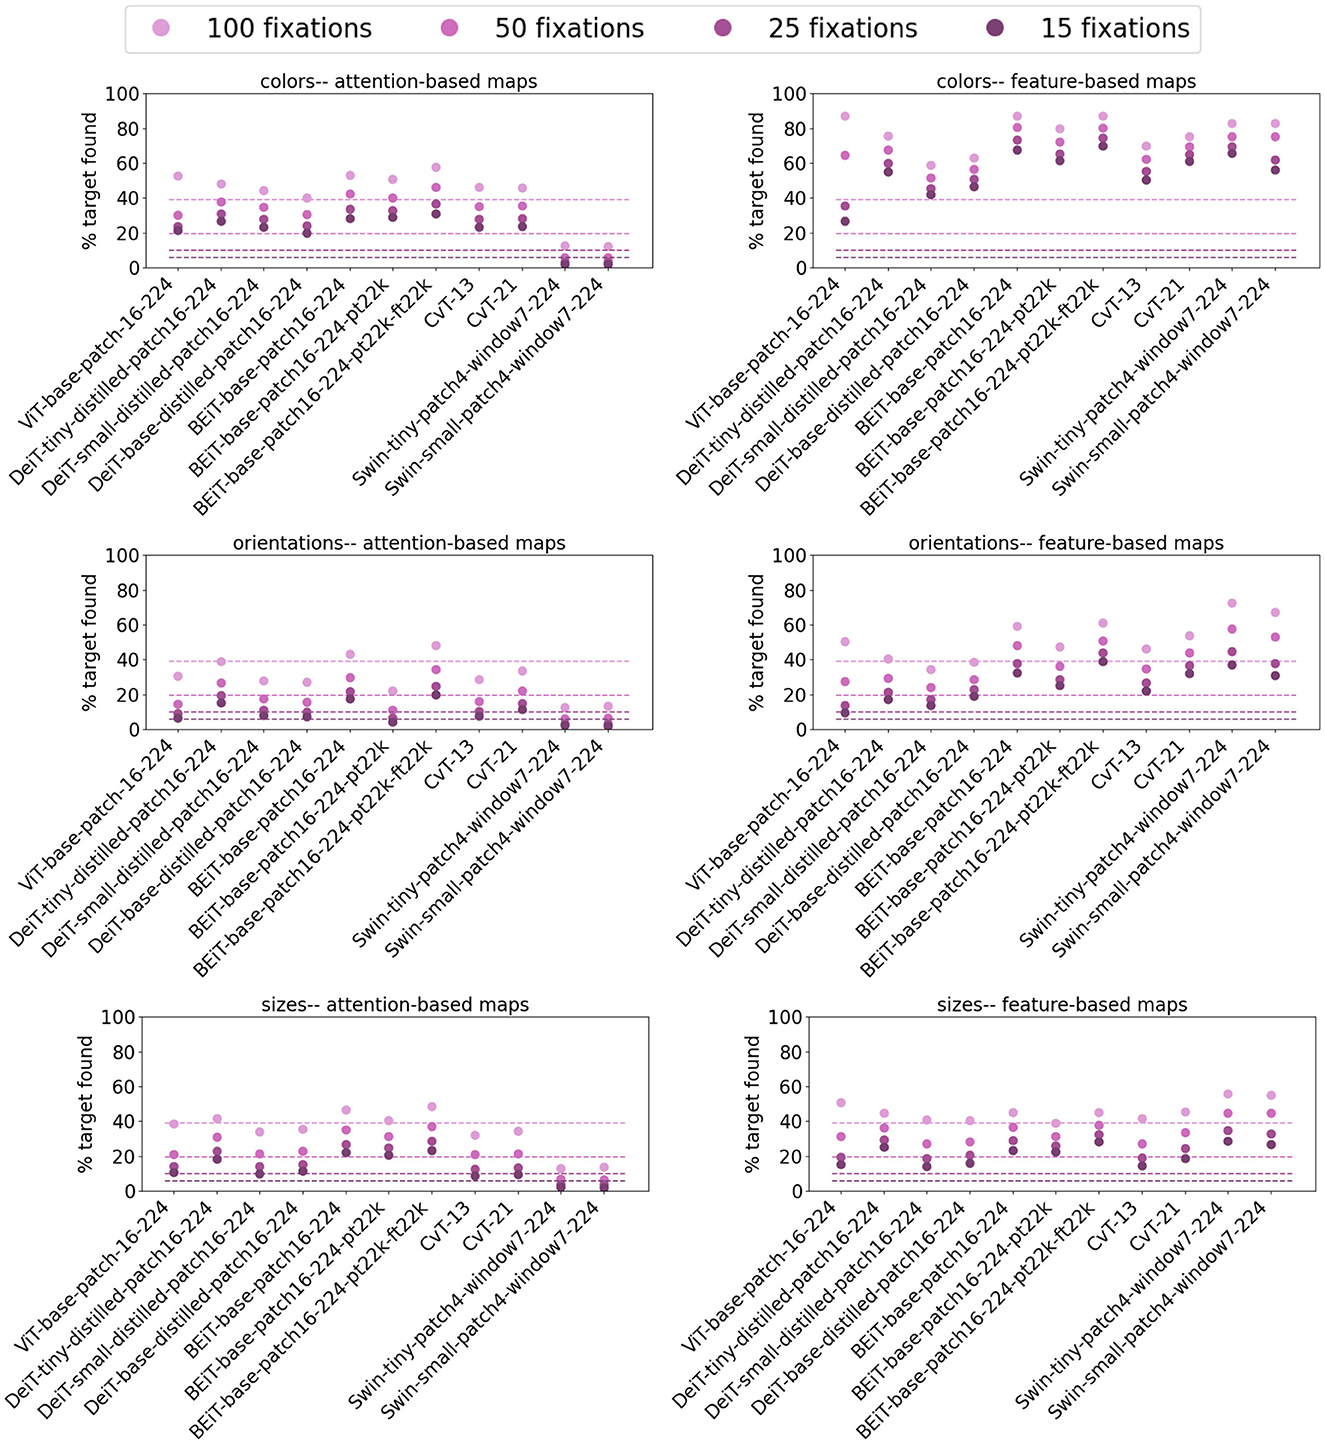
Figure 10. Average target detection rate over all blocks of vision transformers for 15, 25, 50, and 100 fixations on stimuli from the P3 dataset. Compared to detection rates in Figure 9, mean detection rates are higher for all models in all conditions (color, size, and orientation), indicating superior performance of earlier transformer blocks compare to the final block in these models. In line with results in Figures 8, 9, color targets are easier to detect and that generally, feature-based maps outperform attention-based maps in salient target detection.
Results for mean target detection rates over all blocks in Figure 10 are comparable to those of last layer detection rates, except for a shift to higher rates. Specifically, all models are more competent at detecting color targets and that the feature-based saliency maps look more appropriate for singleton detection. In Swin architectures, the mean detection rate of feature-based saliency maps are relatively higher for size targets than that of other models. This observation, together with the last layer detection rate of Swin models for size targets suggest that incorporating multiple scales in vision transformers improves representing figures of various sizes but the effect fades higher in the hierarchy.
In summary, the attention maps in vision transformers were expected to reveal high salience for the target vs. distractors. Nonetheless, comparing the detection rate of attention-based saliency maps in vision transformers at 100 fixations with those of traditional and deep saliency models reported by Kotseruba et al. (2019) suggest that not only do the attention modules in vision transformers fail to highlight the target, but also come short of convolution-based deep saliency models with no attention modules. Although the feature-based saliency maps in vision transformers showed promising results in target detection rates relative to attention-based maps, in comparison with convolutional saliency models (see Kotseruba et al., 2019, their Figure 3), those performed relatively similar to convolution-based models. Together, these results suggest that contrary to the expectation, the proposed attention mechanisms in vision transformers are not advantageous vs. convolutional computations in representing visual salience.
3.2.2. The O3 dataset results
We measured the maximum saliency ratios MSRtarg and MSRbg for feature and attention-based saliency maps of all blocks of vision transformers in Table 1. These ratios are plotted in Figure 11, demonstrating poor performance of all models in detecting the target in natural images of the O3 dataset. We acknowledge that we expected improved performance of vision transformers on the O3 dataset with natural images compared to the results on synthetic stimuli of the P3 dataset. However, whereas MSRtarg ratios larger than 1 are expected (higher salience of target vs. distractors), in both feature and attention-based saliency maps, the ratios were distinctly below 1 across all blocks of all models, with the exception of later blocks of two BEiT architectures. Notable are the feature-based ratios of ViT-base-patch16-224 with peaks in earlier blocks and a steep decrease in higher layers. In contrast, all three BEiT architectures show the opposite behavior and perform poorly in earlier blocks but correct the ratio in mid-higher stages of processing.
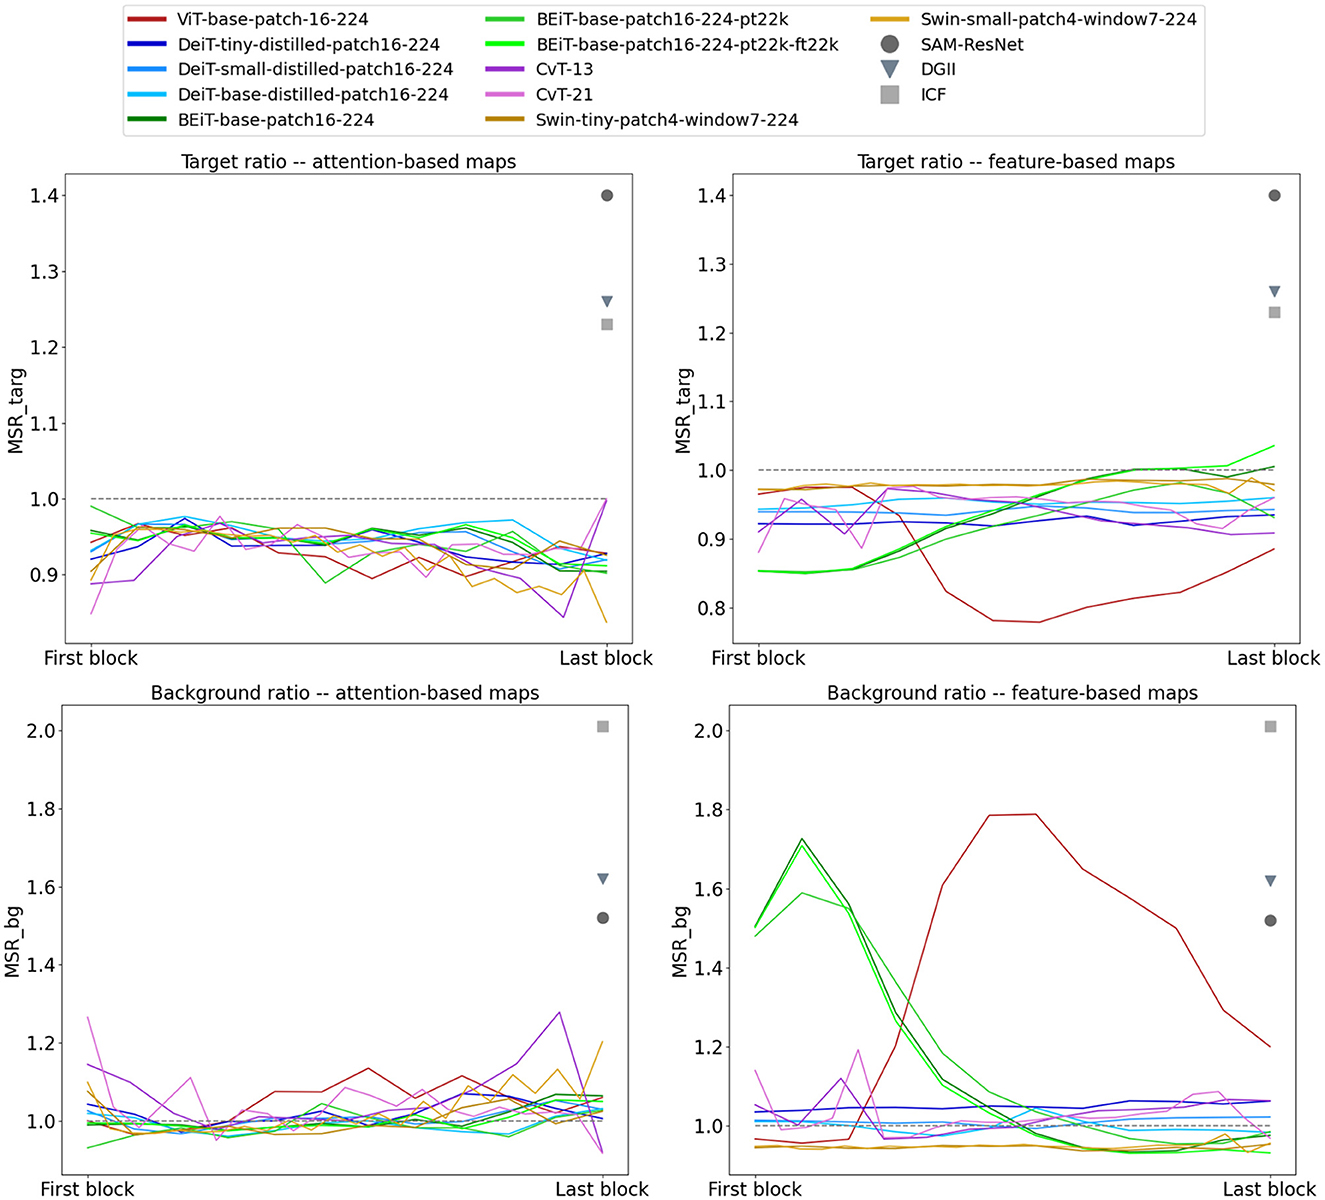
Figure 11. Target and background saliency ratios (MSRtarg and MSRbg) for all vision transformer architectures on natural images of the O3 dataset. Even though these models were trained on natural images, they fail in assigning higher saliency to the target object vs. the distractors or background (smaller than 1 MSRtarg and larger than 1 MSRbg ratios) in both feature and attention-based maps. For easier comparison, we also plotted MSRtarg and MSRbg for the top-3 best performing deep saliency models from Kotseruba et al. (2019). These results compared to the reported ratios in Kotseruba et al. (2019) for traditional and deep convolution-based saliency models suggest that the proposed attention mechanisms do not enhance the performance of vision transformers when the goal is to detect the visually salient object in the stimulus.
The MSRbg ratios illustrated in Figure 11 follow a similar theme as MSRtarg ratios. Even though MSRbg ratios < 1 suggest that the target is deemed more salient than the background, most of these models have MSRbg ratios larger than 1 in their hierarchy. Among all models, feature-based saliency of BEiT and Swin architectures have the best overall performance.
For a few randomly selected images from the O3 dataset, Figures 12–14 demonstrate the attention-based saliency map of the block with best MSRtarg ratio for each model. Each saliency map in these figures is scaled to the original image size for demonstration purposes. Interestingly, saliency maps in Figure 13 show how the same BEiT model with varying training result in vastly different attention-based maps.
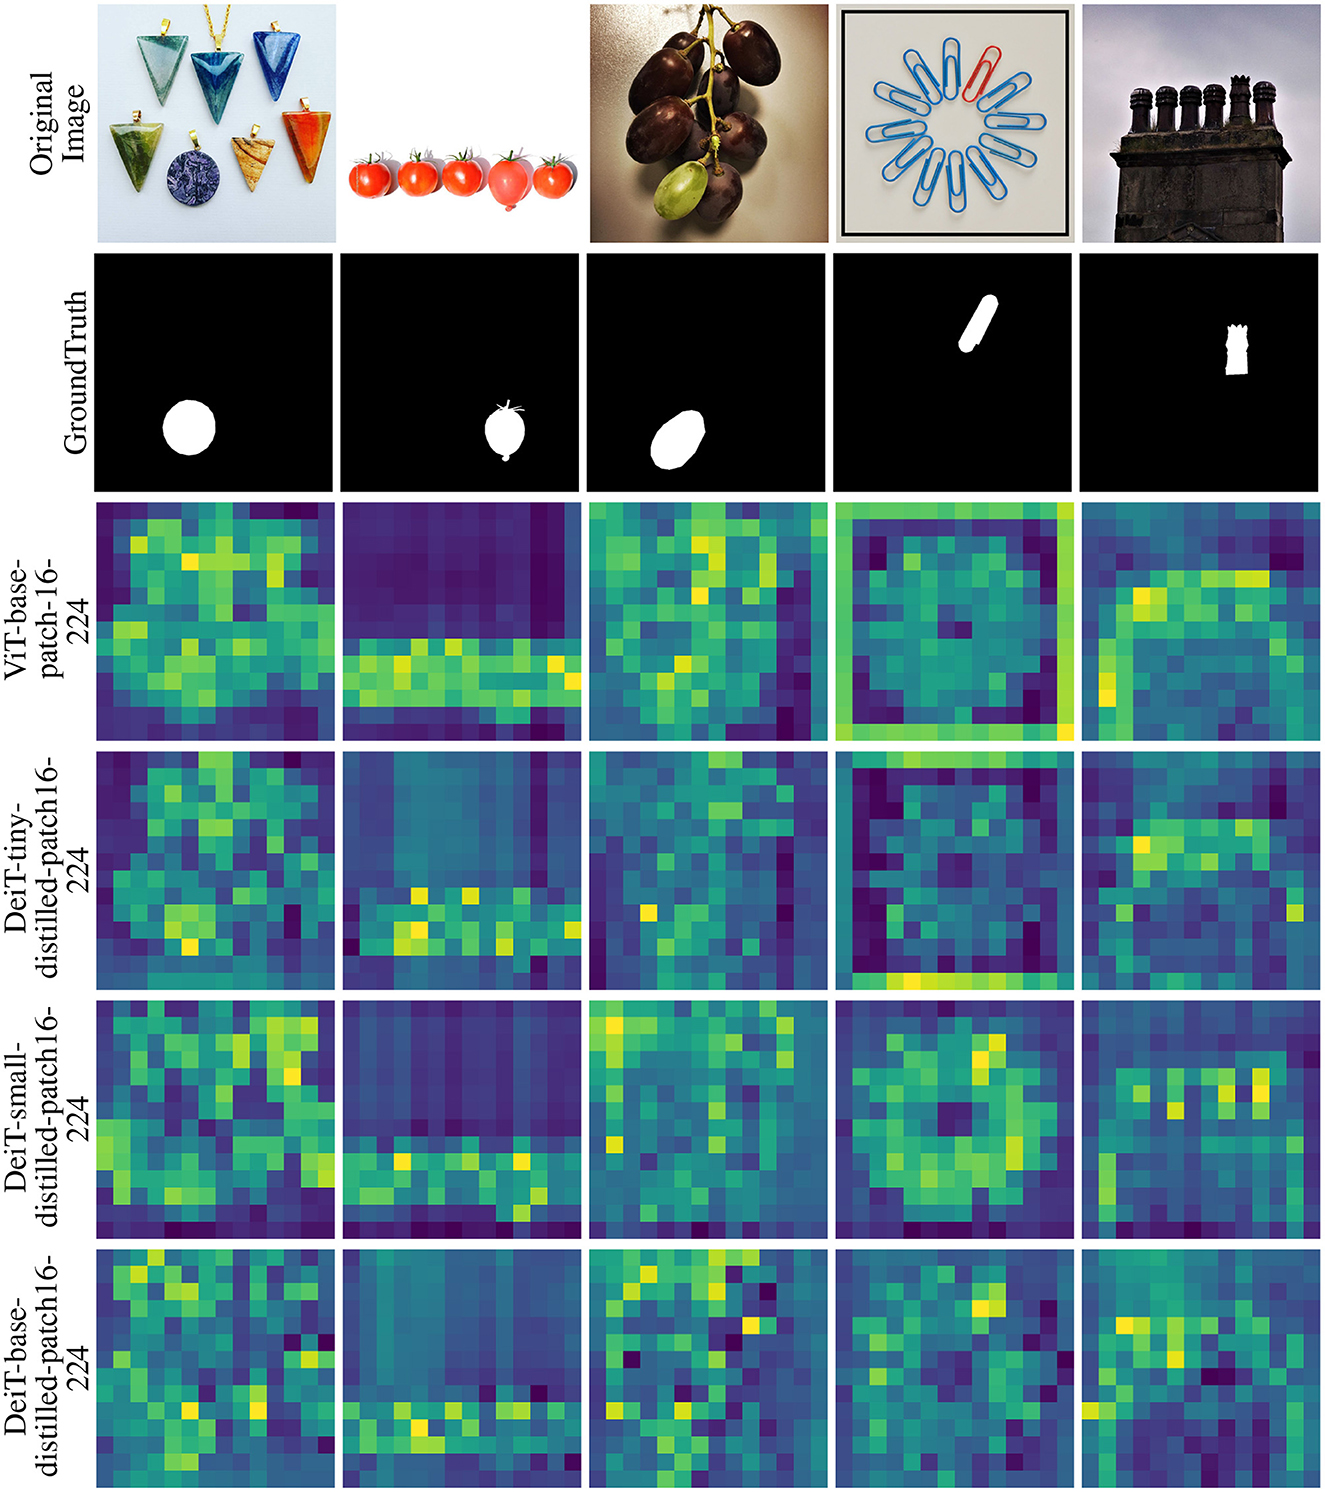
Figure 12. The attention-based saliency map of the block with the best MSRtarg ratio for ViT and DeiT models on a select few images from the O3 dataset. In each map, saliency varies from blue (least salient) to yellow (most salient). Each saliency map in these figures is scaled to the original image size for demonstration purposes.
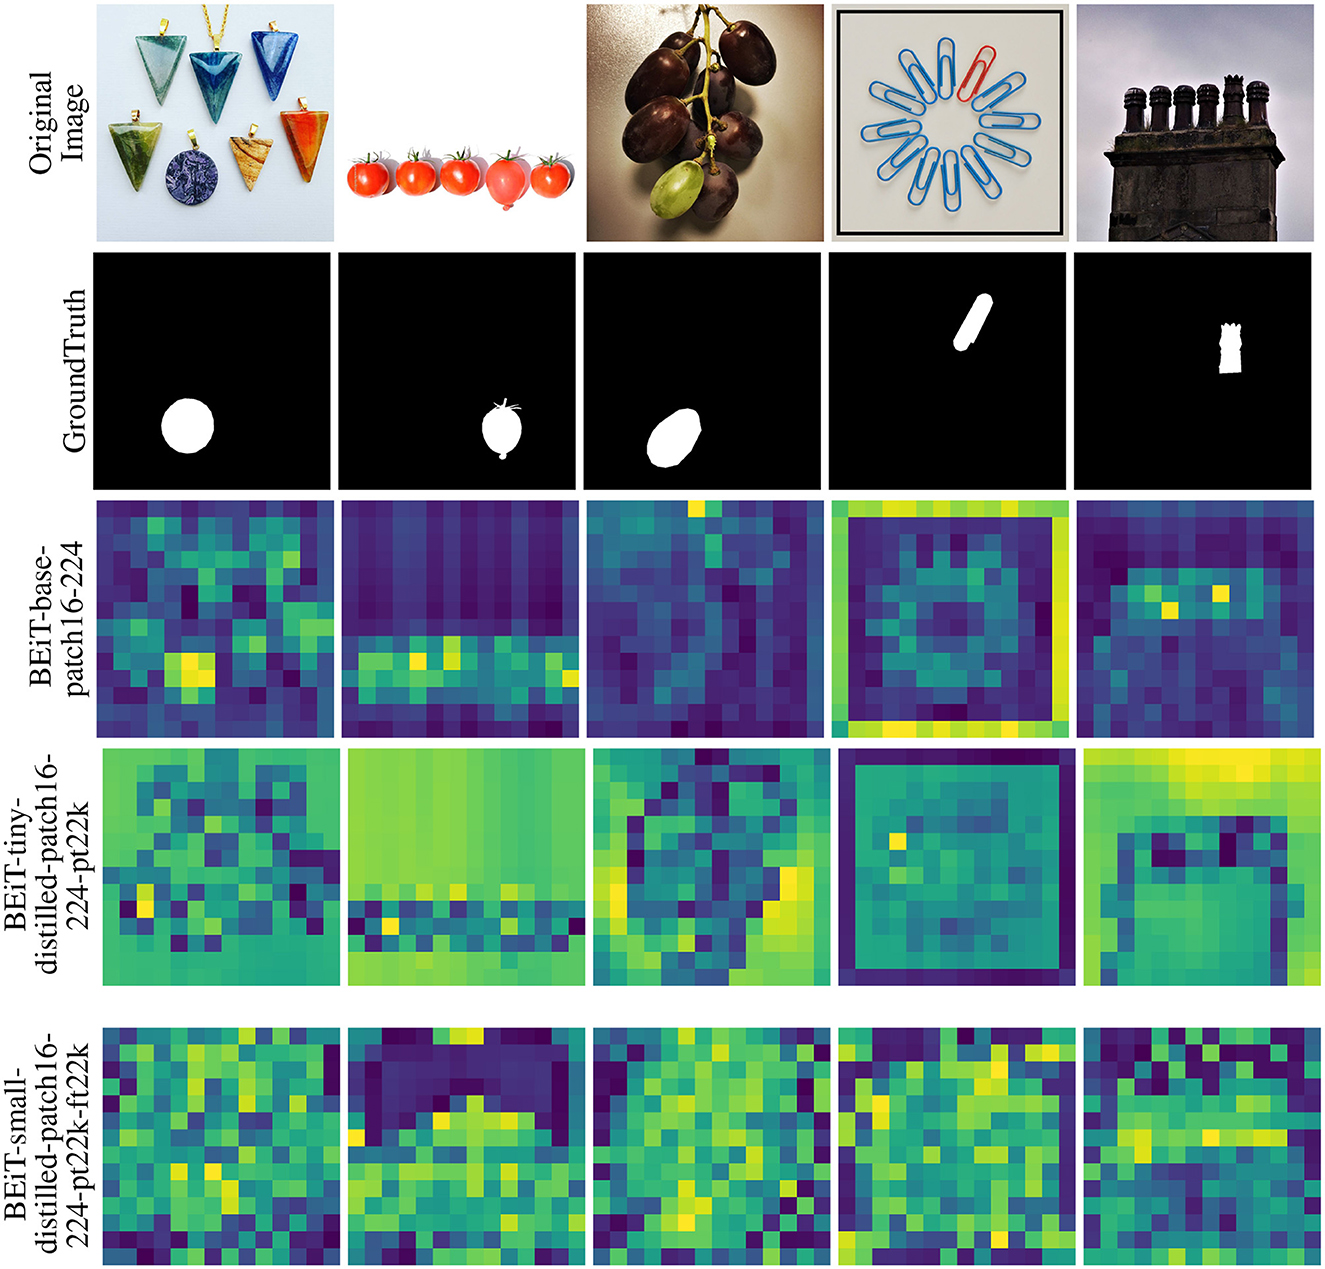
Figure 13. The attention-based saliency map of the block with the best MSRtarg ratio for BEiT models on a select few images from the O3 dataset. In each map, saliency varies from blue (least salient) to yellow (most salient). Each saliency map in these figures is scaled to the original image size for demonstration purposes. An interesting observation is how the variants of the same model with differing training regimes result in vastly different attention-based saliency maps.
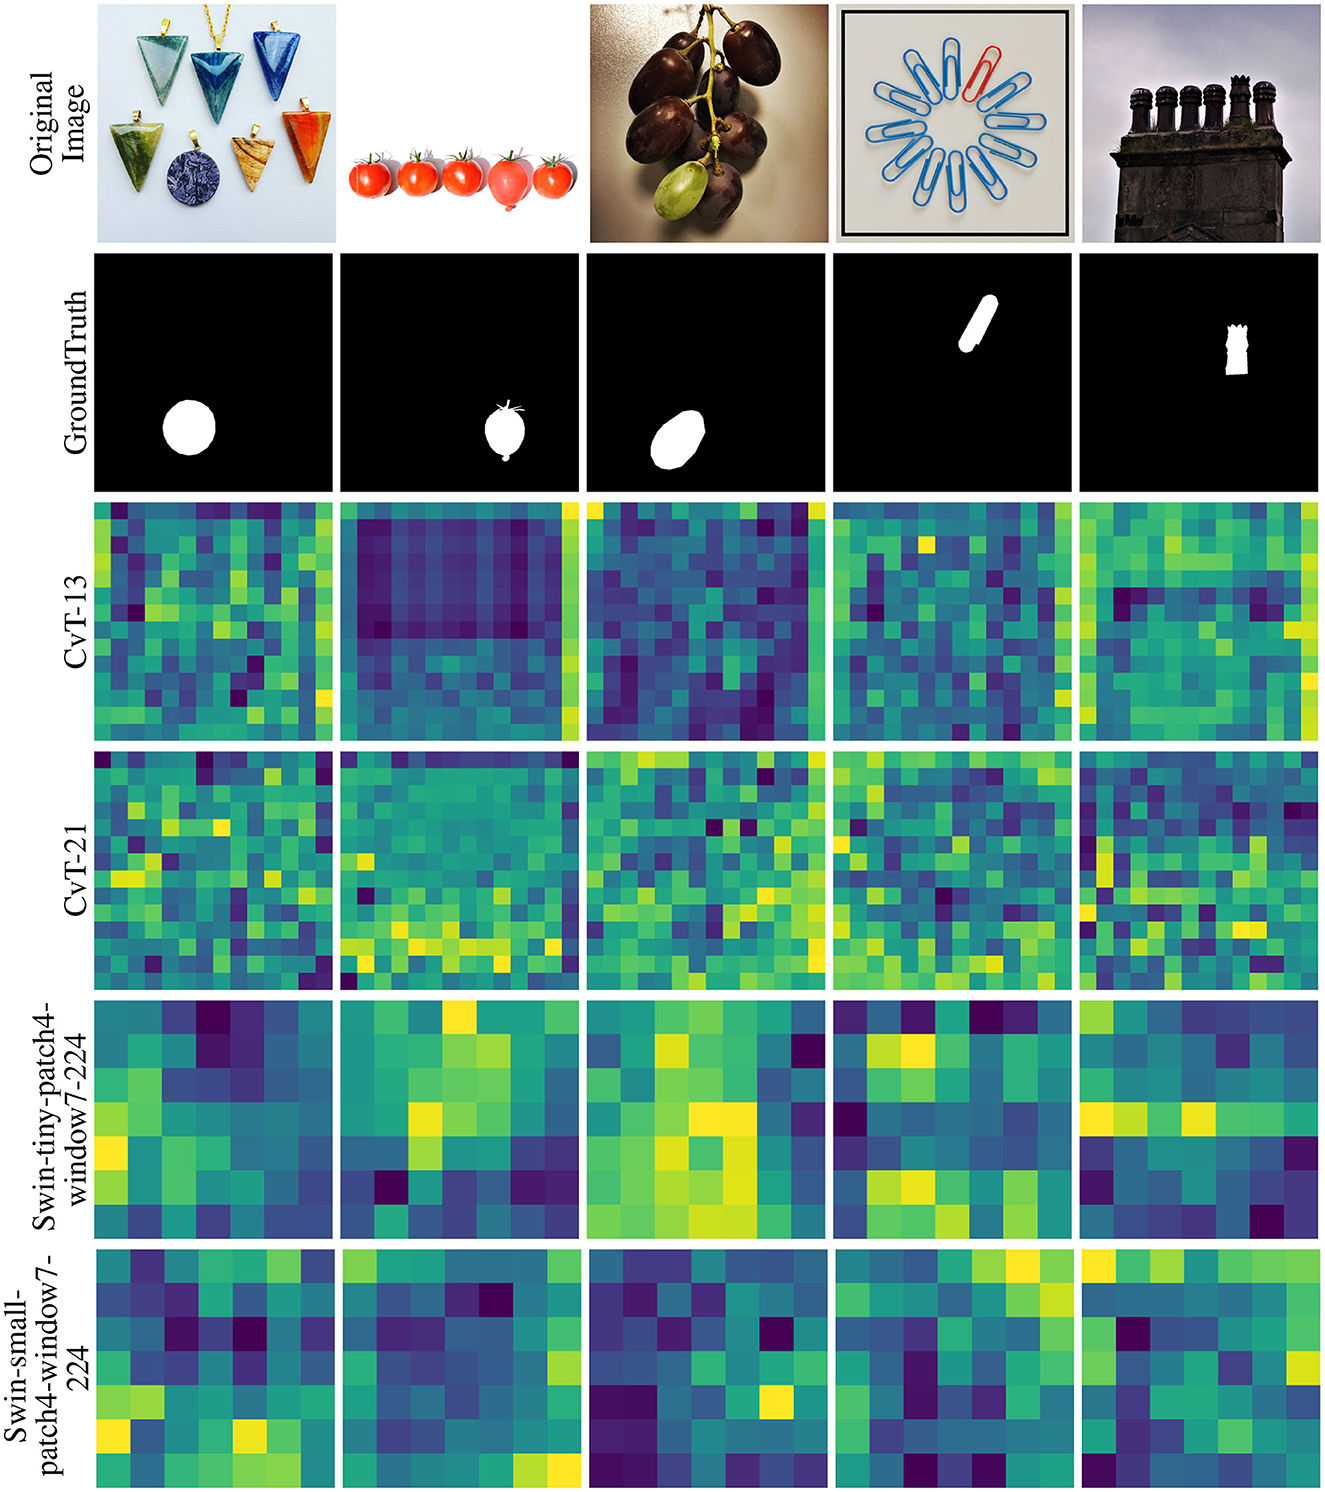
Figure 14. The attention-based saliency map of the block with the best MSRtarg ratio for CvT and Swin models on a select few images from the O3 dataset. In each map, saliency varies from blue (least salient) to yellow (most salient). Each saliency map in these figures is scaled to the original image size for demonstration purposes.
To summarize, for a bottom-up architecture that is claimed to implement attention mechanisms, we expected a boost in saliency detection compared to convolution-based models with no explicit attention modules. Our results on the O3 dataset, however, point to the contrary, specifically in comparison with the best ratios reported in Kotseruba et al. (2019) for MSRtarg and MSRbg at 1.4 and 1.52, respectively. These results, together with the proposal of Liu et al. (2022) for a modernized convolution-based model with comparable performance to vision transformers, overshadow the claim of attention mechanisms in these models.
4. Discussion
Our goal in this work was to investigate if the self-attention modules in vision transformers have similar effects to human attentive visual processing. Vision transformers have attracted much interest in the past few years partly due to out-performing CNNs in various visual tasks, and in part due to incorporating modules that were claimed to implement attention mechanisms. Specifically, the origins of attention mechanisms in transformers could be traced back to the work by Xu et al. (2015), where they introduced an attention-based model for image captioning. Xu et al. (2015) motivated modeling attention in their network by reference to attention in the human visual system and its effect that “allows for salient features to dynamically come to the forefront as needed”, especially in the presence of clutter in the input. In light of these observations, a curious question to ask is if these computational attention mechanisms have similar effects as their source of inspiration. Despite some previous attempts (Naseer et al., 2021; Tuli et al., 2021; Park and Kim, 2022), the role and effect of the attention modules in vision transformers have been largely unknown. To give a few examples, in a recent work, Li et al. (2023) studied the interactions of the attention heads and the learned representations in multi-head attention modules and reported segregation of representations across heads. (Abnar and Zuidema, 2020) investigated the effect of various approaches for visualizing attention map as an interpretability step and with their attention rollout approach often employed for this purpose. Ghiasi et al. (2022) visualized the learned representations in vision transformers and found similarity to those of CNNs. In contrast, Caron et al. (2021) and Raghu et al. (2021) reported dissimilarities in learned representations across the hierarchy of vision transformers and CNNs. Cordonnier et al. (2020) as well as some others (D'Ascoli et al., 2021) suggested attention mechanisms as a generalized form of convolution. The quest to understand the role and effect of attention modules in transformers is still ongoing as these models are relatively new and the notable variations in findings (for example, dis/similarity to CNNs) adds to its importance. Yet, and to the best of our knowledge, none of these studies investigated if the computations in self-attention modules would have similar effects on visual processing as those discovered with visual attention in humans.
In this work, we studied two aspects of processing in vision transformers: the formulation of attention in self-attention modules, and the overall bottom-up architecture of these deep neural architectures. Our investigation of attention formulation in vision transformers suggested that these modules perform Gestalt-like similarity grouping in the form of horizontal relaxation labeling whereby interactions from multiple spatial positions determine the update in the representation of a token. Additionally, given previous evidence on the role of feedback in human visual attention (Folk et al., 1992; Bacon and Egeth, 1994; Desimone and Duncan, 1995; Kim and Cave, 1999; Yantis and Egeth, 1999; Lamy et al., 2003; Connor et al., 2004; Baluch and Itti, 2011; Peterson, 2015), we argued that if vision transformers implement attention mechanisms, those can only be in the form of bottom-up and stimulus-driven visual salience signals.
Testing a family of vision transformers on a similarity grouping dataset suggested that the attention modules in these architectures perform similarity grouping and that the effect decays as hierarchical level increases in the hierarchy especially because more non-figure tokens are grouped with figures in the stimulus over multiple transformer encoder blocks. Most surprising, however, were our findings in the task of singleton detection as a canonical example of saliency detection. With both synthetic and natural stimuli, vision transformers demonstrated sub-optimal performance in comparison with traditional and deep convolution-based saliency models.
The P3O3 dataset was designed according to psychological and neuroscience findings on human visual attention. Kotseruba et al. (2019) demonstrated a gap between human performance and traditional/CNN-based saliency models in singleton detection tasks. The fact that Kotseruba et al. (2019) reported that training CNN-based saliency models on these stimuli did not improve their performance, hints on a more fundamental difference between the two systems. Several other works have provided evidence on the lack of human equivalence in deep neural networks (Ghodrati et al., 2014; Dodge and Karam, 2017; Kim et al., 2018; Geirhos et al., 2019; Horikawa et al., 2019; Hu et al., 2019; RichardWebster et al., 2019; Wloka and Tsotsos, 2019; Baker et al., 2020; Lonnqvist et al., 2021; Ricci et al., 2021; Xu and Vaziri-Pashkam, 2021a,b, 2022; Ayzenberg and Lourenco, 2022; Feather et al., 2022; Fel et al., 2022; Vaishnav et al., 2022; Zerroug et al., 2022; Zhou Q. et al., 2022) on various aspects of visual processing. The claim of implementing attention mechanisms in vision transformers offered the possibility that these models might be more human-like. This impression was confirmed in the work of Tuli et al. (2021) who reported that vision transformers are more human-like than CNNs based on performance on the Stylized ImageNet dataset (Geirhos et al., 2019). Our work, however, adds to the former collection of studies and reveals a gap between human visual attention and the mechanisms implemented in vision transformers.
This work can be further extended in several directions. For example, even though Kotseruba et al. (2019) found training CNN-based saliency models on the O3 dataset did not improve their saliency detection performance, an interesting experiment is to fine-tune vision transformers on the O3 dataset and evaluate the change or lack of change in their saliency detection performance. Additionally, incorporating vertical visual processes into the formulation in Equation (1) is another avenue to explore in the future.
To conclude, not only does our deliberate study of attention formulation and the underlying architecture of vision transformers suggest that these models perform perceptual grouping and do not implement attention mechanisms, but also our experimental evidence, especially from the P3O3 datasets confirms those observations. The mechanisms implemented in self-attention modules of vision transformers can be interpreted as lateral interactions within a single layer. In some architectures, such as ViT, the entire input defines the neighborhood for these lateral interactions, in some others (Yang et al., 2021) this neighborhood is limited to local regions of input. Although Liu et al. (2022) found similar performance in a modernized CNNs, the ubiquity of lateral interactions in the human and non-human primate visual cortex (Stettler et al., 2002; Shushruth et al., 2013) suggest the importance of these mechanisms in visual processing. Our observation calls for future studies to investigate whether vision transformers show the effects that are commonly attributed to lateral interactions in the visual cortex such as crowding, tilt illusion, perceptual filling-in, etc. (Lin et al., 2022). Self-attention in vision transformers performs perceptual organization using feature similarity grouping, not attention. Additionally, considering Gestalt principles of grouping, vision transformers implement a narrow aspect of perceptual grouping, namely similarity, and other aspects such as symmetry and proximity seem problematic for these models. The term attention has a long history going back to the 1800's and earlier (see Berlyne, 1974) and in computer vision to 1970's (for examples, see Hanson and Riseman, 1978). With decades of research on biological and computational aspects of attention, the confusion caused by inappropriate use of terminology and technical term conflation has already been problematic. Therefore, we remain with the suggestion that even though vision transformers do not perform attention as claimed, they incorporate visual mechanisms in deep architectures that were previously absent in CNNs and provide new opportunities for further improvement of our computational vision models.
Data availability statement
The original contributions presented in the study are included in the article/Supplementary material, further inquiries can be directed to the corresponding author.
Author contributions
PM and JT developed the theoretical formalisms, analyzed the data, and wrote the manuscript. PM contributed to the implementation, designed, and carried out the experiments. All authors contributed to the article and approved the submitted version.
Funding
This research was supported by several sources for which the authors are grateful: Air Force Office of Scientific Research [grant numbers FA9550-18-1-0054 and FA9550-22-1-0538 (Computational Cognition and Machine Intelligence, and Cognitive and Computational Neuroscience Portfolios)], the Canada Research Chairs Program (grant number 950-231659), and the Natural Sciences and Engineering Research Council of Canada (grant numbers RGPIN-2016-05352 and RGPIN-2022-04606).
Conflict of interest
The authors declare that the research was conducted in the absence of any commercial or financial relationships that could be construed as a potential conflict of interest.
Publisher's note
All claims expressed in this article are solely those of the authors and do not necessarily represent those of their affiliated organizations, or those of the publisher, the editors and the reviewers. Any product that may be evaluated in this article, or claim that may be made by its manufacturer, is not guaranteed or endorsed by the publisher.
Supplementary material
The Supplementary Material for this article can be found online at: https://www.frontiersin.org/articles/10.3389/fcomp.2023.1178450/full#supplementary-material
References
Abnar, S., and Zuidema, W. (2020). “Quantifying attention flow in transformers,” in Proceedings of the 58th Annual Meeting of the Association for Computational Linguistics, 4190–4197.
Anderson, B. (2023). Stop paying attention to “attention”. Wiley Interdiscip. Rev. Cogn. Sci. 14, e1574. doi: 10.1002/wcs.1574
Ayzenberg, V., and Lourenco, S. (2022). Perception of an object's global shape is best described by a model of skeletal structure in human infants. Elife. 11, e74943. doi: 10.7554/eLife.74943
Bacon, W. F., and Egeth, H. E. (1994). Overriding stimulus-driven attentional capture. Percept. Psychophys. 55, 485–496. doi: 10.3758/BF03205306
Baker, N., Lu, H., Erlikhman, G., and Kellman, P. J. (2020). Local features and global shape information in object classification by deep convolutional neural networks. Vision Res. 172, 46–61. doi: 10.1016/j.visres.2020.04.003
Baluch, F., and Itti, L. (2011). Mechanisms of top-down attention. Trends Neurosci. 34, 210–224. doi: 10.1016/j.tins.2011.02.003
Bao, H., Dong, L., Piao, S., and Wei, F. (2022). “BEit: BERT pre-training of image transformers,” in International Conference on Learning Representations.
Berlyne, D. E. (1974). “Attention,” in Handbook of Perception., Chapter 8, eds E. C. Carterette, and M. P. Friedman (New York, NY: Academic Press).
Bhojanapalli, S., Chakrabarti, A., Glasner, D., Li, D., Unterthiner, T., and Veit, A. (2021). “Understanding robustness of transformers for image classification,” in Proceedings of the IEEE/CVF International Conference on Computer Vision (ICCV), 10231–10241.
Borji, A., and Itti, L. (2012). State-of-the-art in visual attention modeling. IEEE Trans. Pattern Anal. Mach. Intell. 35, 185–207. doi: 10.1109/TPAMI.2012.89
Bruce, N. D., Wloka, C., Frosst, N., Rahman, S., and Tsotsos, J. K. (2015). On computational modeling of visual saliency: examining what's right, and what's left. Vision Res. 116, 95–112. doi: 10.1016/j.visres.2015.01.010
Bylinskii, Z., DeGennaro, E. M., Rajalingham, R., Ruda, H., Zhang, J., and Tsotsos, J. K. (2015). Towards the quantitative evaluation of visual attention models. Vision Res. 116:258–268. doi: 10.1016/j.visres.2015.04.007
Cadieu, C. F., Hong, H., Yamins, D. L., Pinto, N., Ardila, D., Solomon, E. A., et al. (2014). Deep neural networks rival the representation of primate it cortex for core visual object recognition. PLoS Comput. Biol. 10, e1003963. doi: 10.1371/journal.pcbi.1003963
Caron, M., Touvron, H., Misra, I., Jégou, H., Mairal, J., Bojanowski, P., et al. (2021). “Emerging properties in self-supervised vision transformers,” in Proceedings of the IEEE/CVF International Conference on Computer Vision (ICCV) 9650–9660.
Carrasco, M. (2011). Visual attention: the past 25 years. Vision Res. 51, 1484–1525. doi: 10.1016/j.visres.2011.04.012
Chen, C.-F. R., Fan, Q., and Panda, R. (2021). “Crossvit: cross-attention multi-scale vision transformer for image classification,” in Proceedings of the IEEE/CVF International Conference on Computer Vision, 357–366.
Connor, C. E., Egeth, H. E., and Yantis, S. (2004). Visual attention: bottom-up versus top-down. Curr. Biol. 14, R850–R852. doi: 10.1016/j.cub.2004.09.041
Cordonnier, J.-B., Loukas, A., and Jaggi, M. (2020). “On the relationship between self-attention and convolutional layers,” in Eighth International Conference on Learning Representations-ICLR 2020, number CONF.
Dai, Z., Liu, H., Le, Q. V., and Tan, M. (2021). “CoAtNet: marrying convolution and attention for all data sizes,” in Advances in Neural Information Processing Systems, Vol. 34, eds M. Ranzato, A. Beygelzimer, Y. Dauphin, P. S. Liang, and J. W. Vaughan (Curran Associates, Inc.), 3965–3977.
D'Ascoli, S., Touvron, H., Leavitt, M. L., Morcos, A. S., Biroli, G., and Sagun, L. (2021). “ConViT: improving vision transformers with soft convolutional inductive biases,” in Proceedings of the 38th International Conference on Machine Learning, Vol. 139, eds M. Meila, and T. Zhang (PMLR), 2286–2296.
Desimone, R., and Duncan, J. (1995). Neural mechanisms of selective visual attention. Ann. Rev. Neurosci. 18, 193–222. doi: 10.1146/annurev.ne.18.030195.001205
Di Lollo, V. (2018). Attention is a sterile concept; iterative reentry is a fertile substitute. Conscious. Cogn. 64:45–49. doi: 10.1016/j.concog.2018.02.005
Dodge, S., and Karam, L. (2017). “A study and comparison of human and deep learning recognition performance under visual distortions,” in 2017 26th International Conference on Computer Communication and Networks (ICCCN), 1–7.
Dosovitskiy, A., Beyer, L., Kolesnikov, A., Weissenborn, D., Zhai, X., Unterthiner, T., et al. (2021). “An image is worth 16x16 words: transformers for image recognition at scale,” in International Conference on Learning Representations.
Eickenberg, M., Gramfort, A., Varoquaux, G., and Thirion, B. (2017). Seeing it all: convolutional network layers map the function of the human visual system. Neuroimage. 152, 184–194. doi: 10.1016/j.neuroimage.2016.10.001
Feather, J., Leclerc, G., Ma̧dry, A., and McDermott, J. H. (2022). Model metamers illuminate divergences between biological and artificial neural networks. bioRxiv, pages 2022–05. doi: 10.32470/CCN.2022.1147-0
Fel, T., Rodriguez, I. F. R., Linsley, D., and Serre, T. (2022). “Harmonizing the object recognition strategies of deep neural networks with humans,” in Advances in Neural Information Processing Systems, eds A. H. Oh, A. Agarwal, D. Belgrave, and K. Cho, K.
Folk, C. L., Remington, R. W., and Johnston, J. C. (1992). Involuntary covert orienting is contingent on attentional control settings. J. Exp. Psychol. Hum. Percept. Perform. 18, 1030. doi: 10.1037/0096-1523.18.4.1030
Geirhos, R., Rubisch, P., Michaelis, C., Bethge, M., Wichmann, F. A., and Brendel, W. (2019).“Imagenet-trained CNNs are biased towards texture; increasing shape bias improves accuracy and robustness,” in International Conference on Learning Representations.
Ghiasi, A., Kazemi, H., Borgnia, E., Reich, S., Shu, M., Goldbulm, A., et al. (2022). What do vision transformers learn? A visual exploration. arXiv [Preprint]. arXiv: 2212.06727. Available online at: https://arxiv.org/pdf/2212.06727.pdf
Ghodrati, M., Farzmahdi, A., Rajaei, K., Ebrahimpour, R., and Khaligh-Razavi, S.-M. (2014). Feedforward object-vision models only tolerate small image variations compared to human. Front. Comput. Neurosci. 8, 74. doi: 10.3389/fncom.2014.00074
Guo, J., Han, K., Wu, H., Tang, Y., Chen, X., Wang, Y., et al. (2022).“Cmt: convolutional neural networks meet vision transformers,” in 2022 IEEE/CVF Conference on Computer Vision and Pattern Recognition (CVPR), 12165–12175.
Han, K., Wang, Y., Chen, H., Chen, X., Guo, J., Liu, Z., et al. (2022). “A survey on vision transformer,” in IEEE Transactions on Pattern Analysis and Machine Intelligence, Vol. 45 (IEEE), 87–110.
Hanson, A., and Riseman, E. (1978). Computer Vision Systems: Papers from the Workshop on Computer Vision Systems. Amherst, MA: Held at the University of Massachusetts, Academic Press.
He, K., Zhang, X., Ren, S., and Sun, J. (2016). “Deep residual learning for image recognition,” in 2016 IEEE Conference on Computer Vision and Pattern Recognition, CVPR 2016 (Las Vegas, NV: IEEE Computer Society), 770–778.
Herzog, M. H., and Clarke, A. M. (2014). Why vision is not both hierarchical and feedforward. Front. Comput. Neurosci. 8, 135. doi: 10.3389/fncom.2014.00135
Hommel, B., Chapman, C. S., Cisek, P., Neyedli, H. F., Song, J.-H., and Welsh, T. N. (2019). No one knows what attention is. Attent. Percept. Psychophys. 81, 288–2303. doi: 10.3758/s13414-019-01846-w
Horikawa, T., Aoki, S. C., Tsukamoto, M., and Kamitani, Y. (2019). Characterization of deep neural network features by decodability from human brain activity. Sci. Data 6, 1–12. doi: 10.1038/sdata.2019.12
Hu, B., Khan, S., Niebur, E., and Tripp, B. (2019). “Figure-ground representation in deep neural networks,” in 2019 53rd Annual Conference on Information Sciences and Systems (CISS) (IEEE), 1–6.
Kastner, S., and Ungerleider, L. G. (2000). Mechanisms of visual attention in the human cortex. Annu. Rev. Neurosci. 23, 315–341. doi: 10.1146/annurev.neuro.23.1.315
Khaligh-Razavi, S.-M., and Kriegeskorte, N. (2014). Deep supervised, but not unsupervised, models may explain it cortical representation. PLoS Comput. Biol. 10, e1003915. doi: 10.1371/journal.pcbi.1003915
Kim, J., Ricci, M., and Serre, T. (2018). Not-so-clevr: learning same-different relations strains feedforward neural networks. Interface Focus 8, 20180011. doi: 10.1098/rsfs.2018.0011
Kim, M.-S., and Cave, K. R. (1999). Top-down and bottom-up attentional control: on the nature of interference from a salient distractor. Percept. Psychophys. 61, 1009–1023. doi: 10.3758/BF03207609
Kim, Y., Denton, C., Hoang, L., and Rush, A. M. (2017). “Structured attention networks,” in International Conference on Learning Representations.
Knudsen, E. I. (2007). Fundamental components of attention. Annu. Rev. Neurosci. 30, 57–78. doi: 10.1146/annurev.neuro.30.051606.094256
Kotseruba, I., Wloka, C., Rasouli, A., and Tsotsos, J. K. (2019). “Do saliency models detect odd-one-out targets? New datasets and evaluations,” in British Machine Vision Conference (BMVC).
Krauzlis, R. J., Wang, L., Yu, G., and Katz, L. N. (2023). What is attention? Wiley Interdiscip. Rev. Cogn. Sci. 14, e1570. doi: 10.1002/wcs.1570
Kubilius, J., Bracci, S., and Op de Beeck, H. P. (2016). Deep neural networks as a computational model for human shape sensitivity. PLoS Comput. Biol. 12, e1004896. doi: 10.1371/journal.pcbi.1004896
Lamy, D., Tsal, Y., and Egeth, H. E. (2003). Does a salient distractor capture attention early in processing? Psychonom. Bull. Rev. 10, 621–629. doi: 10.3758/BF03196524
Li, Y., Wang, J., Dai, X., Wang, L., Yeh, C.-C. M., Zheng, Y., et al. (2023). How does attention work in vision transformers? A visual analytics attempt. IEEE Transact. Vis. Comp. Graph. doi: 10.1109/TVCG.2023.3261935
Lin, Y.-S., Chen, C.-C., and Greenlee, M. W. (2022). The role of lateral modulation in orientation-specific adaptation effect. J. Vis. 22, 13–13. doi: 10.1167/jov.22.2.13
Liu, Z., Lin, Y., Cao, Y., Hu, H., Wei, Y., Zhang, Z., et al. (2021). “Swin transformer: hierarchical vision transformer using shifted windows,” in Proceedings of the IEEE/CVF International Conference on Computer Vision (ICCV), 10012–10022.
Liu, Z., Mao, H., Wu, C.-Y., Feichtenhofer, C., Darrell, T., and Xie, S. (2022). “A convnet for the 2020s,” in Proceedings of the IEEE/CVF Conference on Computer Vision and Pattern Recognition, 11976–11986.
Lonnqvist, B., Bornet, A., Doerig, A., and Herzog, M. H. (2021). A comparative biology approach to dnn modeling of vision: a focus on differences, not similarities. J. Vis. 21, 17–17. doi: 10.1167/jov.21.10.17
Mahmood, K., Mahmood, R., and van Dijk, M. (2021). “On the robustness of vision transformers to adversarial examples,” in Proceedings of the IEEE/CVF International Conference on Computer Vision (ICCV), 7838–7847.
Martinez-Trujillo, J. (2022). Visual attention in the prefrontal cortex. Ann. Rev. Vision Sci. 8, 407–425. doi: 10.1146/annurev-vision-100720-031711
Moore, T., and Zirnsak, M. (2017). Neural mechanisms of selective visual attention. Annu. Rev. Psychol. 68, 47–72. doi: 10.1146/annurev-psych-122414-033400
Naseer, M., Ranasinghe, K., Khan, S., Hayat, M., Khan, F., and Yang, M.-H. (2021). Intriguing properties of vision transformers. Adv. Neural Inf. Process. Syst. 34, 23296–23308.
Nobre, A. C., Nobre, K., and Kastner, S. (2014). The Oxford Handbook of Attention. Oxford University Press.
Pan, Z., Zhuang, B., He, H., Liu, J., and Cai, J. (2022). “Less is more: Pay less attention in vision transformers,” in Proceedings of the AAAI Conference on Artificial Intelligence, Vol. 36 (AAAI Press), 2035–2043.
Panaetov, A., Daou, K. E., Samenko, I., Tetin, E., and Ivanov, I. (2023). “Rdrn: recursively defined residual network for image super-resolution,” in Computer Vision-ACCV 2022, eds L. Wang, J. Gall, T.-J. Chin, I. Sato, and R. Chellappa (Cham: Springer Nature Switzerland), 629–645.
Park, N., and Kim, S. (2022). “How do vision transformers work?,” In International Conference on Learning Representations.
Paul, S., and Chen, P.-Y. (2022). Vision transformers are robust learners. Proc. AAAI Conf. Artif. Intell. 36, 2071–2081. doi: 10.1609/aaai.v36i2.20103
Peterson, M. A. (2015). “Low-level and high-level contributions to figure-ground organization,” in The Oxford Handbook of Perceptual Organization, ed J. Wagemans (Oxford University Press), 259–280.
Poort, J., Raudies, F., Wannig, A., Lamme, V. A., Neumann, H., and Roelfsema, P. R. (2012). The role of attention in figure-ground segregation in areas v1 and v4 of the visual cortex. Neuron 75, 143–156. doi: 10.1016/j.neuron.2012.04.032
Qiu, F. T., Sugihara, T., and Von Der Heydt, R. (2007). Figure-ground mechanisms provide structure for selective attention. Nat. Neurosci. 10, 1492–1499. doi: 10.1038/nn1989
Raghu, M., Unterthiner, T., Kornblith, S., Zhang, C., and Dosovitskiy, A. (2021). Do vision transformers see like convolutional neural networks? Adv. Neural Inf. Process. Syst. 34, 12116–12128.
Ricci, M., Cadène, R., and Serre, T. (2021). Same-different conceptualization: a machine vision perspective. Curr. Opin. Behav. Sci. 37, 47–55. doi: 10.1016/j.cobeha.2020.08.008
RichardWebster, B., Anthony, S. E., and Scheirer, W. J. (2019). Psyphy: a psychophysics driven evaluation framework for visual recognition. IEEE Trans. Pattern Anal. Mach. Intell. 41, 2280–2286. doi: 10.1109/TPAMI.2018.2849989
Shushruth, S., Nurminen, L., Bijanzadeh, M., Ichida, J. M., Vanni, S., and Angelucci, A. (2013). Different orientation tuning of near-and far-surround suppression in macaque primary visual cortex mirrors their tuning in human perception. J. Neurosci. 33, 106–119. doi: 10.1523/JNEUROSCI.2518-12.2013
Srinivas, A., Lin, T.-Y., Parmar, N., Shlens, J., Abbeel, P., and Vaswani, A. (2021). “Bottleneck transformers for visual recognition,” in Proceedings of the IEEE/CVF Conference on Computer Vision and Pattern Recognition (CVPR), 16519–16529.
Stettler, D. D., Das, A., Bennett, J., and Gilbert, C. D. (2002). Lateral connectivity and contextual interactions in macaque primary visual cortex. Neuron 36, 739–750. doi: 10.1016/S0896-6273(02)01029-2
Tan, A., Nguyen, D. T., Dax, M., Nießner, M., and Brox, T. (2021). Explicitly modeled attention maps for image classification. Proc. AAAI Conf. Artif. Intell. 35, 9799–9807. doi: 10.1609/aaai.v35i11.17178
Touvron, H., Cord, M., Douze, M., Massa, F., Sablayrolles, A., and Jegou, H. (2021). “Training data-efficient image transformers and distillation through attention,” in Proceedings of the 38th International Conference on Machine Learning, Vol. 139, eds M. Meila, and T. Zhang (PMLR), 10347–10357.
Tsotsos, J. K. (1990). Analyzing vision at the complexity level. Behav. Brain Sci. 13, 423–445. doi: 10.1017/S0140525X00079577
Tsotsos, J. K. (2017). Complexity level analysis revisited: What can 30 years of hindsight tell us about how the brain might represent visual information? Front. Psychol. 8, 1216. doi: 10.3389/fpsyg.2017.01216
Tsotsos, J. K. (2022). When we study the ability to attend, what exactly are we trying to understand? J. Imaging 8, 212. doi: 10.3390/jimaging8080212
Tsotsos, J. K., Itti, L., and Rees, G. (2005). “A brief and selective history of attention,” in Neurobiology of Attention, eds L. Itti, G. Rees, and J. K. Tsotsos (Academic Press).
Tsotsos, J. K., and Rothenstein, A. (2011). Computational models of visual attention. Scholarpedia 6, 6201. doi: 10.4249/scholarpedia.6201
Tuli, S., Dasgupta, I., Grant, E., and Griffiths, T. (2021). “Are convolutional neural networks or transformers more like human vision?,” in Proceedings of the Annual Meeting of the Cognitive Science Society, Vol. 43.
Vaishnav, M., Cadene, R., Alamia, A., Linsley, D., VanRullen, R., and Serre, T. (2022). Understanding the computational demands underlying visual reasoning. Neural Comput. 34, 1075–1099. doi: 10.1162/neco_a_01485
Vaswani, A., Shazeer, N., Parmar, N., Uszkoreit, J., Jones, L., Gomez, A. N., et al. (2017). “Attention is All you need,” in Advances in Neural Information Processing Systems, Vol. 30, eds I. Guyon, U. V. Luxburg, S. Bengio, H. Wallach, R. Fergus, S. Vishwanathan,et al. (Curran Associates, Inc.)
Wloka, C., and Tsotsos, J. K. (2019). Flipped on its head: deep learning-based saliency finds asymmetry in the opposite direction expected for singleton search of flipped and canonical targets. J. Vis. 19, 318–318. doi: 10.1167/19.10.318
Wolf, T., Debut, L., Sanh, V., Chaumond, J., Delangue, C., Moi, A., et al. (2020). “Transformers: state-of-the-art natural language processing,” in Proceedings of the 2020 Conference on Empirical Methods in Natural Language Processing: System Demonstrations (Association for Computational Linguistics), 38–45.
Wu, B., Xu, C., Dai, X., Wan, A., Zhang, P., Yan, Z., et al. (2021). “Visual transformers: where do transformers really belong in vision models?,” in Proceedings of the IEEE/CVF International Conference on Computer Vision (ICCV), 599–609.
Wu, H., Xiao, B., Codella, N., Liu, M., Dai, X., Yuan, L., et al. (2021). “CvT: introducing convolutions to vision transformers,” in Proceedings of the IEEE/CVF International Conference on Computer Vision (ICCV), 22–31.
Xiao, T., Singh, M., Mintun, E., Darrell, T., Dollar, P., and Girshick, R. (2021). “Early convolutions help transformers see better,”. in Advances in Neural Information Processing Systems, Vol. 34, eds M. Ranzato, A. Beygelzimer, Y. Dauphin, P. S. Liang, and J. W. Vaughan (Curran Associates, Inc.), 30392–30400.
Xu, K., Ba, J., Kiros, R., Cho, K., Courville, A., Salakhudinov, R., et al. (2015). “Show, attend and tell: neural image caption generation with visual attention,” in Proceedings of the 32nd International Conference on Machine Learning, Vol. 37, F. Bach, and D. Blei (Lille: PMLR), 2048–2057.
Xu, Y., and Vaziri-Pashkam, M. (2021a). Examining the coding strength of object identity and nonidentity features in human occipito-temporal cortex and convolutional neural networks. J. Neurosci. 41, 4234–4252. doi: 10.1523/JNEUROSCI.1993-20.2021
Xu, Y., and Vaziri-Pashkam, M. (2021b). Limits to visual representational correspondence between convolutional neural networks and the human brain. Nat. Commun. 12, 2065. doi: 10.1038/s41467-021-22244-7
Xu, Y., and Vaziri-Pashkam, M. (2022). Understanding transformation tolerant visual object representations in the human brain and convolutional neural networks. Neuroimage 263, 119635. doi: 10.1016/j.neuroimage.2022.119635
Yang, J., Li, C., Zhang, P., Dai, X., Xiao, B., Yuan, L., et al. (2021). “Focal attention for long-range interactions in vision transformers,” in Advances in Neural Information Processing Systems, Vol. 34, eds M. Ranzato, A. Beygelzimer, Y. Dauphin, P. S. Liang, and J. W. Vaughan (Curran Associates, Inc.), 30008–30022.
Yantis, S., and Egeth, H. E. (1999). On the distinction between visual salience and stimulus-driven attentional capture. J. Exp. Psychol. 25, 661. doi: 10.1037/0096-1523.25.3.661
Yuan, L., Chen, Y., Wang, T., Yu, W., Shi, Y., Jiang, Z.-H., et al. (2021). “Tokens-to-token ViT: training vision transformers from scratch on ImageNet,” in Proceedings of the IEEE/CVF International Conference on Computer Vision (ICCV), 558–567.
Yue, X., Sun, S., Kuang, Z., Wei, M., Torr, P. H., Zhang, W., et al. (2021). “Vision transformer with progressive sampling,” in Proceedings of the IEEE/CVF International Conference on Computer Vision, 387–396.
Zerroug, A., Vaishnav, M., Colin, J., Musslick, S., and Serre, T. (2022). “A benchmark for compositional visual reasoning,” in Thirty-sixth Conference on Neural Information Processing Systems Datasets and Benchmarks Track.
Zhang, J., and Sclaroff, S. (2013). “Saliency detection: a boolean map approach,” in Proceedings of the IEEE International Conference on Computer Vision, 153–160.
Zhou, D., Yu, Z., Xie, E., Xiao, C., Anandkumar, A., Feng, J., et al. (2022). “Understanding the robustness in vision transformers,” in Proceedings of the 39th International Conference on Machine Learning, Vol. 162, eds K. Chaudhuri, S. Jegelka, L. Song, C. Szepesvari, G. Niu, and S. Sabato (PMLR), 27378–27394.
Zhou, H.-Y., Lu, C., Yang, S., and Yu, Y. (2021). “ConvNets vs. transformers: whose visual representations are more transferable?,” in Proceedings of the IEEE/CVF International Conference on Computer Vision (ICCV) Workshops, 2230–2238.
Zhou, Q., Du, C., and He, H. (2022). Exploring the brain-like properties of deep neural networks: a neural encoding perspective. Mach. Intell. Res. 19, 439–455. doi: 10.1007/s11633-022-1348-x
Zhu, M., Hou, G., Chen, X., Xie, J., Lu, H., and Che, J. (2021). “Saliency-guided transformer network combined with local embedding for no-reference image quality assessment,” in Proceedings of the IEEE/CVF International Conference on Computer Vision, 1953–1962.
Zhuang, C., Yan, S., Nayebi, A., Schrimpf, M., Frank, M. C., DiCarlo, J. J., et al. (2021). Unsupervised neural network models of the ventral visual stream. Proc. Nat. Acad. Sci. U. S. A. 118, e2014196118. doi: 10.1073/pnas.2014196118
Zucker, S. (1981). “Computer vision and human perception,” in Proceedings of the 7th International Joint Conference on Artificial Intelligence, 1102–1116.
Zucker, S. W. (1978). Vertical and horizontal processes in low level vision. Comp. Vision Syst. 187–195. Available online at: https://shop.elsevier.com/books/computer-vision-systems/hanson/978-0-12-323550-3
Keywords: vision transformers, attention, similarity grouping, singleton detection, odd-one-out
Citation: Mehrani P and Tsotsos JK (2023) Self-attention in vision transformers performs perceptual grouping, not attention. Front. Comput. Sci. 5:1178450. doi: 10.3389/fcomp.2023.1178450
Received: 02 March 2023; Accepted: 12 June 2023;
Published: 29 June 2023.
Edited by:
Dirk Bernhardt-Walther, University of Toronto, CanadaReviewed by:
Stavros Tsogkas, Samsung AI Center Toronto, CanadaKatherine Rebecca Storrs, Justus Liebig University Giessen, Germany
Copyright © 2023 Mehrani and Tsotsos. This is an open-access article distributed under the terms of the Creative Commons Attribution License (CC BY). The use, distribution or reproduction in other forums is permitted, provided the original author(s) and the copyright owner(s) are credited and that the original publication in this journal is cited, in accordance with accepted academic practice. No use, distribution or reproduction is permitted which does not comply with these terms.
*Correspondence: Paria Mehrani, cGFyaWE2MUB5b3JrdS5jYQ==