 Fengxiang Li
 Siska Fitrianie2
 Merijn Bruijnes
 Amal Abdulrahman
 Willem-Paul Brinkman
95% of researchers rate our articles as excellent or good
Learn more about the work of our research integrity team to safeguard the quality of each article we publish.
Find out more
ORIGINAL RESEARCH article
Front. Comput. Sci. , 30 October 2023
Sec. Human-Media Interaction
Volume 5 - 2023 | https://doi.org/10.3389/fcomp.2023.1149305
The Artificial-Social-Agent (ASA) questionnaire is an instrument for evaluating human-ASA interaction. It consists of 19 constructs and related dimensions measured by either 24 questionnaire items (short version) or 90 questionnaire items (long version). The questionnaire was built and validated by a research community effort to make evaluation results more comparable between agents and findings more generalizable. The current questionnaire is in English, which limits its use to only a population with an adequate command of the English language. Translating the questionnaire into more languages allows for the inclusion of other populations and the possibility of comparing them. Therefore, this paper presents a Mandarin Chinese translation of the questionnaire. After three construction cycles that included forward and backward translation, we gave both the final version of the translated and original English questionnaire to 242 bilingual crowd-workers to evaluate 14 ASAs. Results show on average a good level of correlation on the construct/dimension level (ICC M = 0.79, SD = 0.09, range [0.61, 0.95]) and on the item level (ICC M = 0.62, SD = 0.14, range [0.19, 0.92]) between the two languages for the long version, and for the short version (ICC M = 0.66, SD = 0.12, range [0.41, 0.92]). The analysis also established correction values for converting questionnaire item scores between Chinese and English questionnaires. Moreover, we also found systematic differences in English questionnaire scores between the bilingual sample and a previously collected mixed-international English-speaking sample. We hope this and the Chinese questionnaire translation will motivate researchers to study human-ASA interaction among a Chinese literate population and to study cultural similarities and differences in this area.
When developing and studying Artificial Social Agents (ASAs), such as virtual agents, chatbots, and social robots, it is apparent to gain research insights beyond a single individual agent. To this end, the research community has developed the ASA questionnaire (Fitrianie et al., 2022) for evaluating human-ASA interaction, which makes it possible to compare results obtained with different agents on different topics deemed relevant by the research community (Fitrianie et al., 2020). To extend the usability, the community also needs translations of the questionnaire into different languages. And they need to know the quality of the translations. In other words, the similarities and differences in the results obtained from questionnaires in different languages. Therefore, we present here a Mandarin Chinese translation of the ASA questionnaire and compare the results with those obtained from the original English version. In addition, we establish correction values to convert questionnaire scores between these two languages. Besides providing a questionnaire in a person's own language, translated questionnaires make studying cultural differences and similarities possible. To justify this type of research, we have also looked at whether we can already observe such differences in the results obtained from a bilingual population sample collected in this study and from a mixed-international English-speaking sample population obtained previously.
The ASA questionnaire results from an open working group effort1 in which more than one hundred researchers came together to create a measurement instrument and related datasets. Combined, this instrument and dataset, enable researchers to make standardized statements about the quality of ASAs, based on examples of current and popular ASAs, and to make statements about various aspects of ASAs that the community considers relevant. In this context, ASAs were defined as “computer-controlled entities that can autonomously interact with humans following the social rules of human-human interaction” (Fitrianie et al., 2019). The first step in achieving their goal the group created a world model of human-ASA interaction (Fitrianie et al., 2020). The model defines the scope of the ASA questionnaire. It focuses on human-ASA interaction and places outside the scope of the measurement tool: (1) pre-existing entities, such as demographics and previous experiences, (2) context-dependent processes, such as therapy or training adherence, and (3) outcomes of these processes, such as sleep or reading improvement. To determine which community-relevant aspects of human-ASA interaction the instrument should consider, the group turned to questionnaires used in empirical user studies reported at the International Conference Intelligent Virtual Agents from 2013 to 2018 (Fitrianie et al., 2019). In 81 studies, they identified 89 questionnaires from which they extracted 189 constructs, i.e., a specific phenomenon or aspect, e.g., user trust, agent believability, or sociability, that a questionnaire attempts to capture. The work group grouped these constructs and identified 19 unifying constructs covering more than 80% of the 189 originally identified constructs (Fitrianie et al., 2020). They continued and generated a set of expert-content validated questionnaire items for these constructs with, on average, a respectable reliability level (Cronbach's α = 0.76, range [0.60, 0.87]). They established the latter by analysing the results of an online survey of 192 crowd-workers whom they asked to rate the Honda robot ASIMO using their questionnaire items (Fitrianie et al., 2021). The group followed this up with a construct validity analysis, asking 532 crowd-workers to rate 14 different ASAs. After analysing factor analysis models, they found that the remaining 90 questionnaire items had a good level of convergent and discriminant validity (Fitrianie et al., 2022).
As a result, there are two versions of the ASA questionnaire, a short version with 24 questionnaire items and a long version with 90 questionnaire items. Researchers can measure 19 constructs and related constructed dimensions with the latter version. With the introduction of dimensions for some constructs, they can measure distinct aspects within these constructs that can be independent. For example, Agent's Believability has five dimensions: Human Appearance, Human Behavior, Natural Appearance, Natural Behavior, and Appearance Appropriateness of the Agent. So it deals with the anthropomorphic and non-anthropomorphic parts of believability, as well as appearance and behavior, which may not always correlate. Each construct or dimension has a minimum of three and a maximum of six questionnaire items. Each item is a statement that people can rate on a seven-point scale from “disagree” (−3) to “agree” (+3), with the midpoint being “neither agree nor disagree.” Individuals can rate the items based on their own interaction experience with the ASA, i.e., the first-person perspective, or based on observing someone else's interaction, i.e., the third-person perspective. For example, in “[I/the user] will use [the agent] again in the future,” the researcher uses “I” or “the user” and replaces “[the agent]” with the agent's name. For practical reasons, researchers may decide only to select items that relate to certain constructs or dimensions they are interested in, thereby considering the long version ASA questionnaire as a collection of shorter questionnaires.
The short version of our questionnaire provides researchers with a simple and concise way to collect information about their ASA that the ASA community finds essential, as it gives a general impression of human-ASA interaction. The 24 items are representative of 17 single-dimensional constructs and two multi-dimensional constructs: Agent Believability (five dimensions) and Emotional Experience (two dimensions).
Researchers interested in intercultural issues often translate questionnaires into their targeted second languages. Still, as Acquadro et al. (2008) pointed out, a rigorous, multi-step approach to cultural adaptation is most likely to provide high-quality translations. Previous studies on questionnaire translation, equivalence examination (Santos et al., 2010; Maasoumi et al., 2013; Colina et al., 2017) and cross-cultural adaption of questionnaire (Guillemin et al., 1993; Guillemin, 1995; Beaton et al., 2000) have established a relatively standard translation approach. Rabin et al. (2014) list them as (1) forward translation, whereby the questionnaire is translated into the second language; (2) reconciliation of forward translation, whereby first- and second-language material is compared, and improvements are made; (3) backward translation, whereby second-language material is translated back to the first-language and compared with original first-language material; and (4) pre-testing of a provisional version of the instrument. In this study, we adjusted the procedure into (1) forward translation and reconciliation, (2) backward translation and reconciliation, and (3) pre-testing of a provisional version of the instrument. Moreover, we conducted the first step in three cycles with bilingual participants, each time evaluating the correlation between the original and translated versions and improving on items with low correlation. Subsequently, we evaluated the correlation between the original and final translated versions on the construct/dimension level and item level for the long version of the ASA questionnaire, as well as for the short version. Besides, we also established correction values for converting questionnaire item scores between Chinese and English questionnaires.
The equivalence of the questionnaire results between the original language and the target languages is a prerequisite for inter- and cross-cultural comparisons (Chang et al., 1999). However, it is difficult, if not practically impossible, to translate an item in such a way that the score is exactly equivalent to the original item's. Therefore, we have chosen to estimate correction values for items with credible bias indication so that future researchers can make conversion corrections between scores obtained from different languages.
Figure 1 illustrates the steps we followed in establishing the translated questionnaire, alternating between (re)formulating translated items and assessing their similarity with the original English version. For the latter, we calculated the Intraclass Correlation Coefficient (ICC), a widely used reliability index in test-retest, intra-rater, and inter-rater reliability analysis (Koo and Li, 2016). Several authors (Cicchetti, 1994; Koo and Li, 2016) have suggested comparable interpretations of ICC values. For the assessment of the forward translation, we followed Cicchetti (1994) classification (Table 1), specifically seeking items with ICC estimates equal to or greater than 0.6 and for constructs with estimates equal to or greater than 0.75, which Koo and Li (2016) classified as excellent.
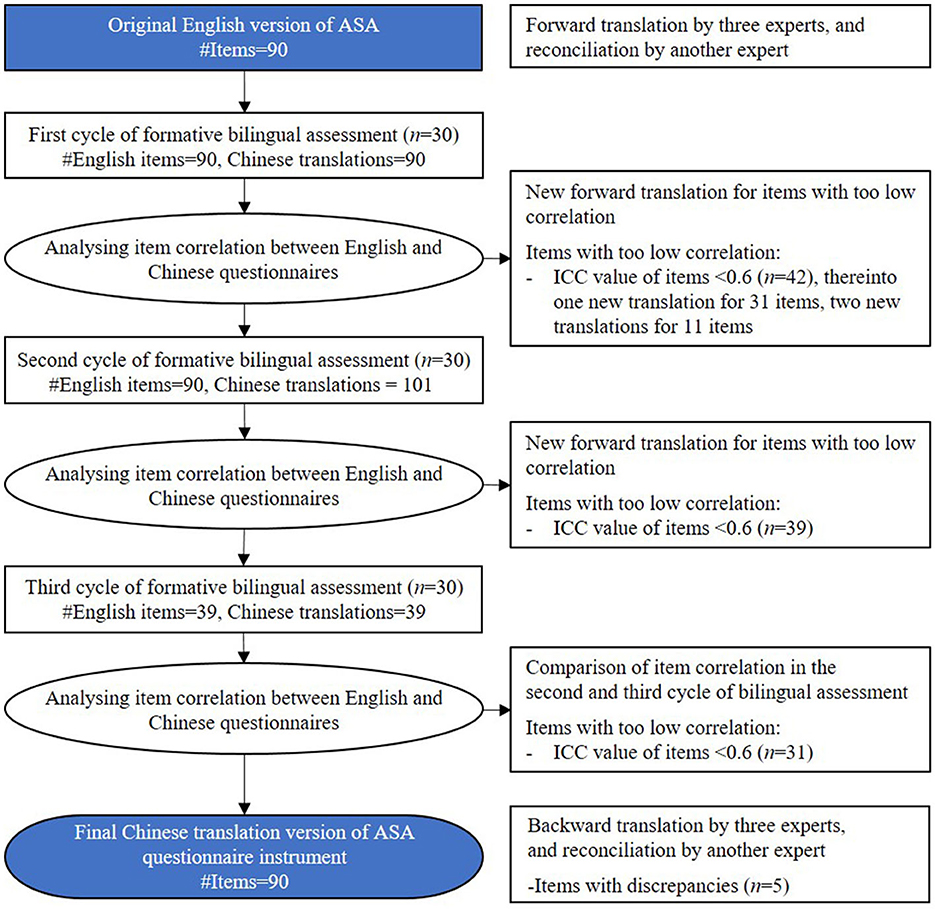
Figure 1. Flowchart showing procedure of the questionnaire translation.
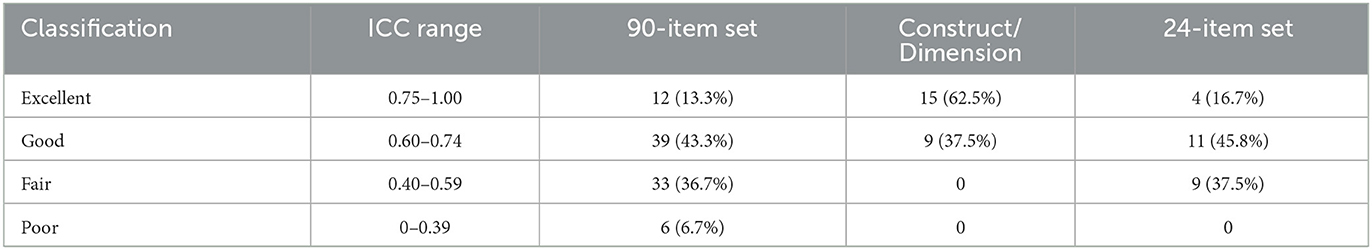
Table 1. Categories of ICC classifications by Cicchetti (1994) and number of ICC values in classification category.
Three bilingual (English and Mandarin) researchers, with expertise in ASA evaluation, translated the original English ASA questionnaire independently. As these researchers sent in translations that sometimes differed, a fourth bilingual researcher reconciled the three translations into one Chinese version.
In this step, we recruited bilingual participants (n = 30) from an online crowd-sourcing platform Prolific Academic to rate the Honda robot ASIMO after watching a 30-s video clip in which it interacted with a human. Each participant rated an ASAQ item both with the original English version and with the corresponding Chinese translation, allowing us to calculate the correlation between the two ratings. Because of fatigue concerns, if we were to ask participants to rate 2 times 90 items, we split the item pool into two: a pool with ASAQ items of the first 12 ASAQ constructs/dimensions, and a second pool with the ASAQ items of the remaining 12 ASAQ constructs/dimensions. Participants were randomly assigned to a questionnaire made up of items of one of these two item pools.
The ICC values of 42 items were lower than 0.6. The three researchers formulated new translations for these 42 items and for 11 of them even a second alternative, which resulted in a total set of 101 (90 + 11) Chinese translations for the next cycle.
In a similar set-up as the previous step, a new group of bilingual participants (n = 30) evaluated the human-ASA interaction using the 90 English items and 101 corresponding Chinese translations. In each cycle of formative bilingual assessment, new participants assessed the questionnaire so they were not biased by having seen the video before. For 39 items, ICC values were below 0.6, including items with one or two new translation(s). Again, the researchers formulated new translations for these items.
In the third and final cycle, a new group of bilingual participants (n = 30) used the same previous procedure. However, for efficient reasons, we only used the remaining 39 items we identified as problematic previously. The three researchers formulated new translations for these items. We compared the correlation between the 39 English items and their corresponding Chinese translations in both the second and third cycle of bilingual assessment, to select the better translation with a higher ICC value. Up to this step, the cycle resulted in 59 out of 90 items having a good correlation between the English and Chinese translations.
Three new researchers independently back-translated the Chinese questionnaire into English without having access to the original English ASA questionnaire. A fourth researcher reconciled the three translations into a single one. After comparing the original English version, an author of the original English version identified five items with extensive semantic differences that raised concerns. For these items, the fourth researcher together with the author formulated new Chinese translations, resulting in the final Chinese translation, included in Appendix.
Following the series of formative assessments to construct the Chinese ASA questionnaire, we conducted a summative assessment of this translation and estimated correction values for the conversion procedure. In addition, we investigated potential differences between bilingual Chinese mother-tongue speakers and mixed-international English-speaking samples. For the summative assessment, we asked bilingual participants with Chinese mother-tongue who were also fluent in English to rate videos of 14 ASAs. This is the same set of videos as previously used in the construct validity analysis of the original English ASA questionnaire (Fitrianie et al., 2022). We randomly assigned each participant to a 30-s video clip of one specific ASA. After watching the clips, participants rated the observed human-ASA interaction on both the original English items and the corresponding Chinese translations. As before, we divided the 90 items into two item pools, resulting in two questionnaires. One included the 44 English questionnaire items related to the first 12 constructs/dimensions and the corresponding Chinese translations plus 15 attention control questions. The other included the remaining 46 items plus 15 attention control questions. Within a questionnaire, participants saw the English items and corresponding Chinese translations in two different language blocks, and they always worked with one language first and then afterwards continued with the other language. The order of the language blocks presented was randomized. Moreover, within each language block, the items presented to the participants were also randomized. The participants were instructed to rate their (dis)agreement with the statements based on what they had seen in the video.
Beforehand, participants checked the compatibility of their Internet browser by watching a test video and answering a control question about the content of the video. If they succeeded, they proceeded to complete the online informed consent. Then, the ASA video clip was played, and participants could begin the rating once the video ended, which they could rewatch at all times. Participants had to answer all questions before they could submit their answers.
We pre-registered the study2 and obtained permission for the study from the university's ethics committee for human research (ID: 1811).
A Monte Carlo simulation run in R3 indicated the need for a sample size of 110 participants if we wanted an 80% chance of detecting a small effect (d = 0.2), as specified by Cohen (1992), with a Bayesian pairwise t-test with 95% credibility. Splitting the group and items, as explained earlier, required a doubling of this size, and adding some safety margin, we ended up with a total sample size of 242 participants. We included all participants in this sample, as no one failed more than 2 out of the 15 attention checks. As before in Step 2, we recruited participants on the Prolific Academic platform, which provides crowd-sourcing workers from most OECD countries, except for Turkey, Lithuania, Colombia, and Costa Rica. We paid participants for their time according to the platform's regulations. Although we have not recorded the participants' gender or age, we used the platform's gender-balanced selection feature. Here, we invited people who self-registered on the platform as native Mandarin Chinese speakers and fluent in English. In addition, they had to successfully pass a check question in Mandarin Chinese before they were allowed to participate.
The 14 videos aimed to expose the participant group to human-ASA interactions that covered the full scale of what the constructs and dimensions measured by the ASA questionnaire. The videos portrayed the following ASAs: iCat, DeepBlue, Amy, Furby, Siri, HAL 9000, Poppy, Sim Sensei, CHAPPiE, Aibo, Sarah, Nao, Marcus, and a dog. The video links can be found in the result report of our previous study4 and Fitrianie et al. (2022) provide more descriptive information. To keep the participants' task simple, we used the third-person perspective in the questionnaire items, as Fitrianie et al. (2022) found few differences when they asked their participants to assume they were interacting with the ASA and rated the items from a first-person perspective. We administered the questionnaire using the Qualtrics platform.
All analyses used the statistical platform R (v4.2.0). First, for calculating ICC, we followed the approach described by Finch et al. (2014). For each construct/dimension (24) and for each item (90) separately, we fitted a multilevel model on its questionnaire item or construct/dimension scores, using fixed intercept and participants as the random intercept. We looked at the proportion of total variability in score rating that was attributable to an individual participant, i.e., the similarity in the participants' English and Chinese ratings. For this, we used the R package nlme (v3.1-152). We calculated the 24 constructs/dimensions' scores by taking the mean of the corresponding items' scores per participant. In the analysis, we also gave special attention to the results of the 24 representative items, i.e., the short version of the ASA questionnaire.
Next, the R package BayesianFirstAid (v0.1) with its Bayesian paired t-test provided us with an estimation of the mean, standard deviation, and 95% Credible Intervals (CI) of the posterior t-distribution of the mean differences in the score of both languages. We regarded 95% CIs that did not include zero as a credible indication of a systematic positive or negative bias and requiring conversion correction in the future. The analysis used broad priors as described by Kruschke (2013). For Credible intervals, we used a 95% highest posterior density interval, which is the narrowest interval containing 95% of the probability mass.
Finally, we investigated systematic differences in English questionnaire scores between the bilingual sample and a previously collected mixed-international English-speaking sample (Fitrianie et al., 2022). The latter was collected using the same video set and on the same Prolific Academic platform. Although not reported, this sample might also include participants who spoke Chinese. Still, the only recruitment requirement was fluency in English. Therefore, we regarded this as a mixed English-speaking sample and the potential difference between the two samples as a cultural one. Following a Bayesian approach using the R package Rethinking (v2.21), we fitted a multilevel model with a Gaussian distribution on each construct/dimension score with a linear model that included culture as a fixed effect and agent as a varying effect with partial pooling. The analyses used uninformed priors. Furthermore, for the interpretation, we regarded 95% CI of the culture coefficient estimate that excluded zero as a credible indication of a difference between the two sample groups. In addition, we calculated the posterior probability of either positive or negative bias between two sample groups by taking the posterior distribution area that was either small or greater than zero, whichever was the largest area.
All data sets, analysis scripts, and outcomes files are online available.5
The mean ICC value of the 24 constructs and related dimensions (ICC M = 0.79, SD = 0.09, range [0.61, 0.95]), as well as the 90 questionnaire items (ICC M = 0.62, SD = 0.14, range [0.19, 0.92]), showed a good correlation level. As shown in Table 1, about 57% of the items had a correlation with an excellent or good classification, while this was the case for 100% of the constructs and related dimensions (Table 2). Furthermore, with an average ICC value of 0.66 (SD = 0.12, range [0.41, 0.92]), we found a good correlation level for the 24 representative items used in the short version of the ASA questionnaire (Table 3). For 15 out of these 24 (62.5%) representative items, the correlation level was good to excellent, while for 9 (37.5%), the correlation could be classified as fair.
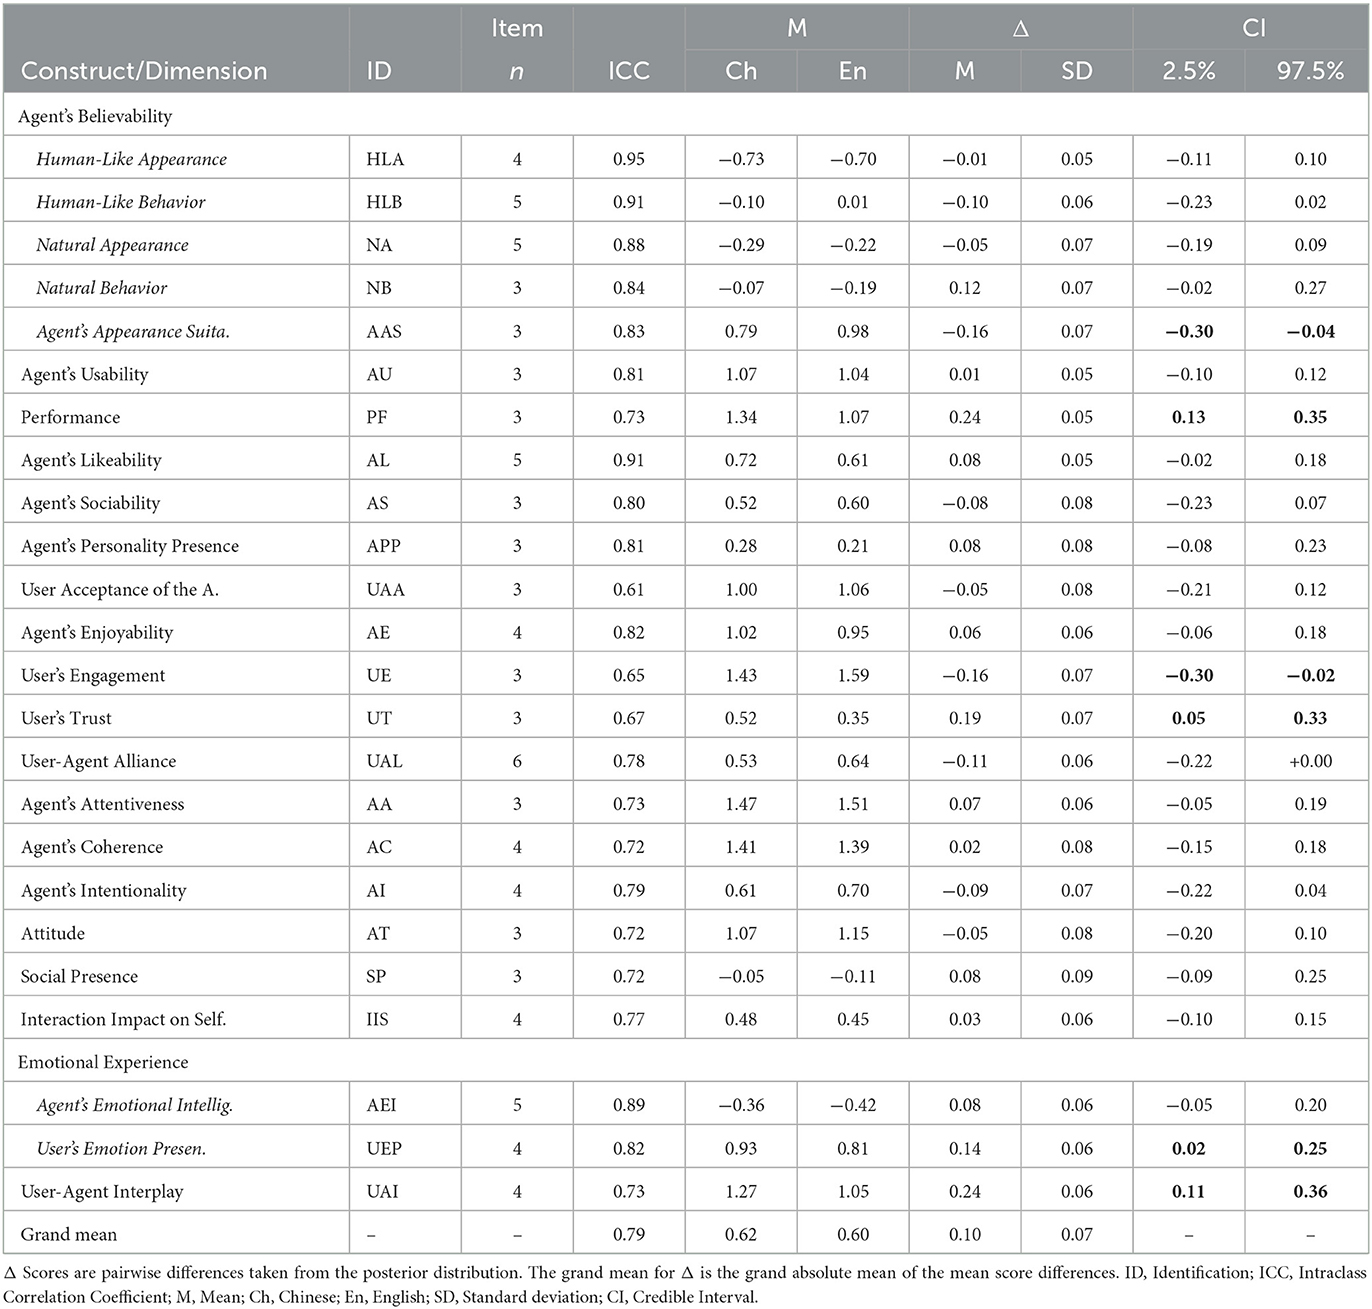
Table 2. ICC values and mean score differences of 24 constructs and dimensions.
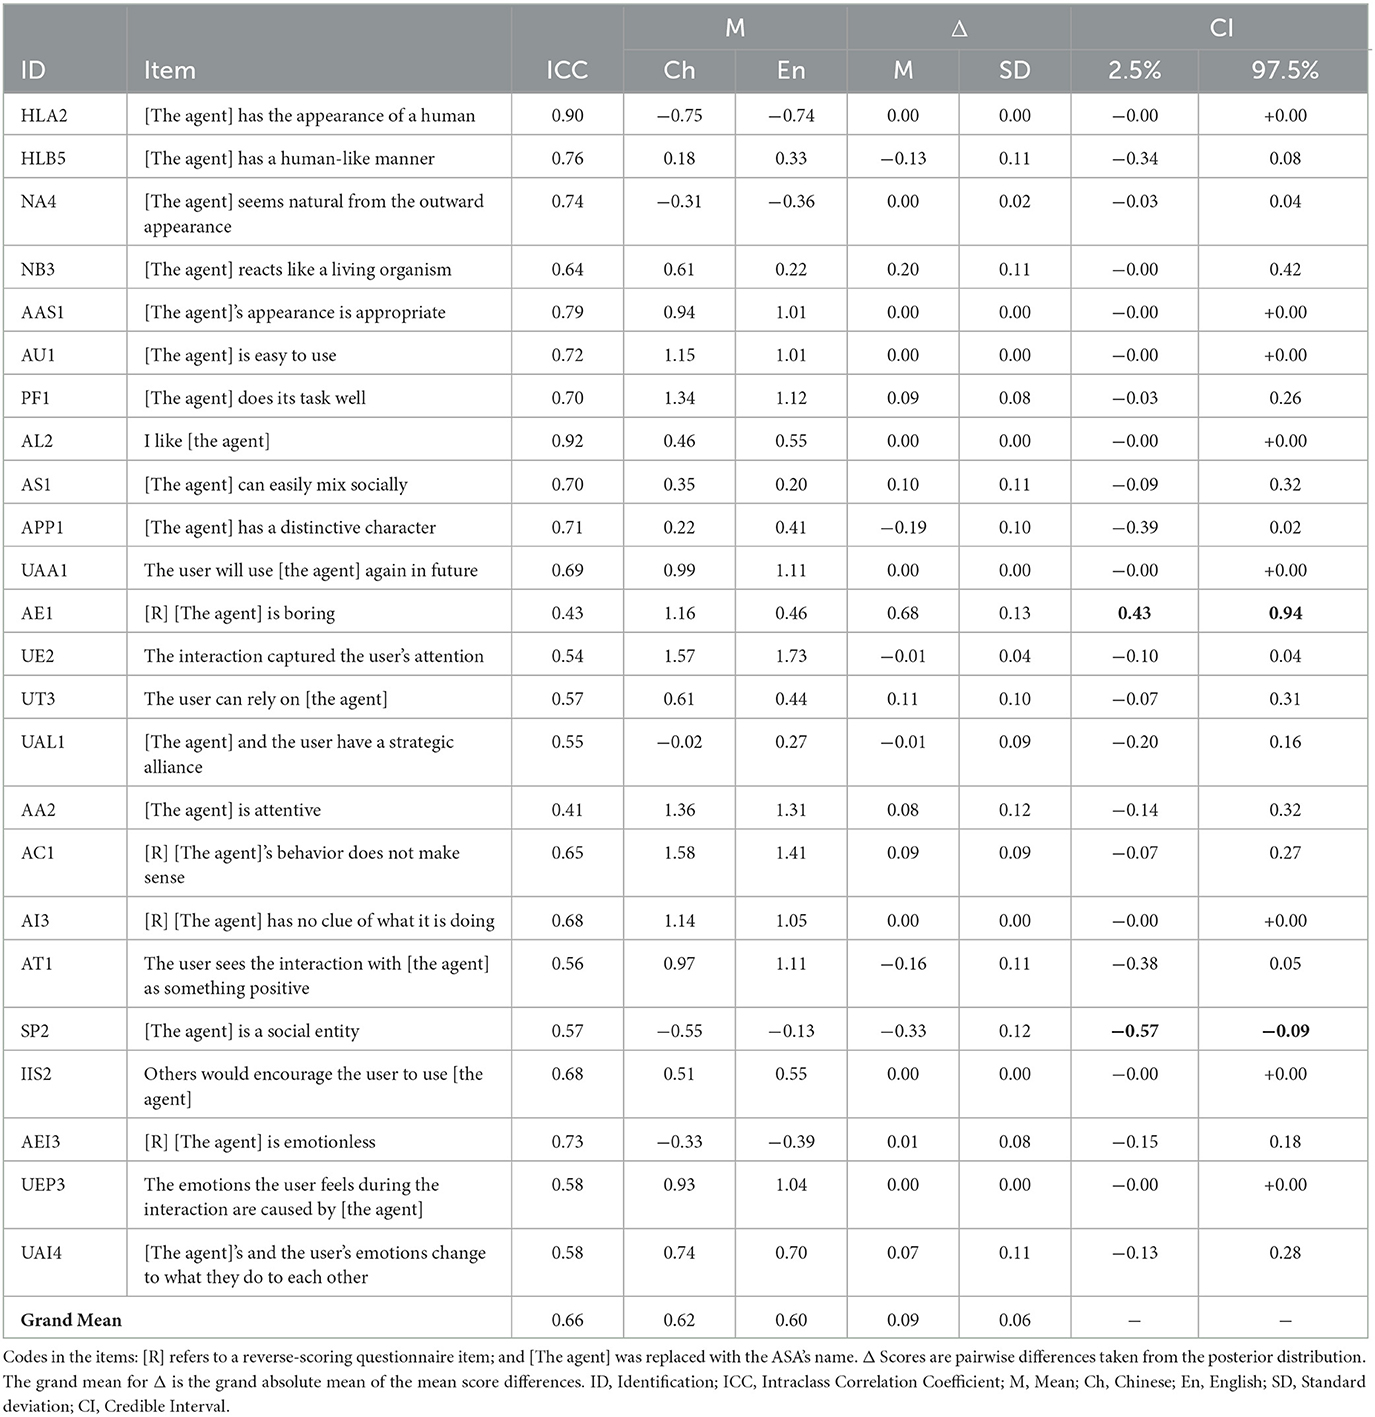
Table 3. The short version of the ASA questionnaire.
The mean score differences between the English and Chinese questionnaires are estimates for score equivalence between the two languages, and for positive biases, i.e., the Chinese score being higher than the English score or for negative biases, i.e., the Chinese score being lower than the English score. For the constructs and related dimension, Table 2 shows a grand mean difference in absolute terms of 0.10 and a grand mean of standard deviation (SD) of 0.07, with score differences, i.e., bias, ranging from −0.16 to 0.24. For four constructs/dimensions, the credible interval was above zero and therefore a credible indication of a positive bias. Oppositely, a credible indication of a negative bias we found for two constructs/dimensions. These six constructs/dimensions with a credible indication of bias are bold in CI values in Table 2. A similar examination was possible on the item level. Table 3 shows it for 24 representative items. It reveals a Grand Absolute Mean of 0.10 (SD = 0.06) with a range from −0.33 up to 0.68, while one of them shows a credible indication of a positive bias and one item shows a credible indication of a negative bias. As for the complete set of 90 items (Grand Absolute Mean 0.11, SD = 0.08, range [−0.42, 0.77]), Table 4 shows a credible indication of eight positive and three negative biases.
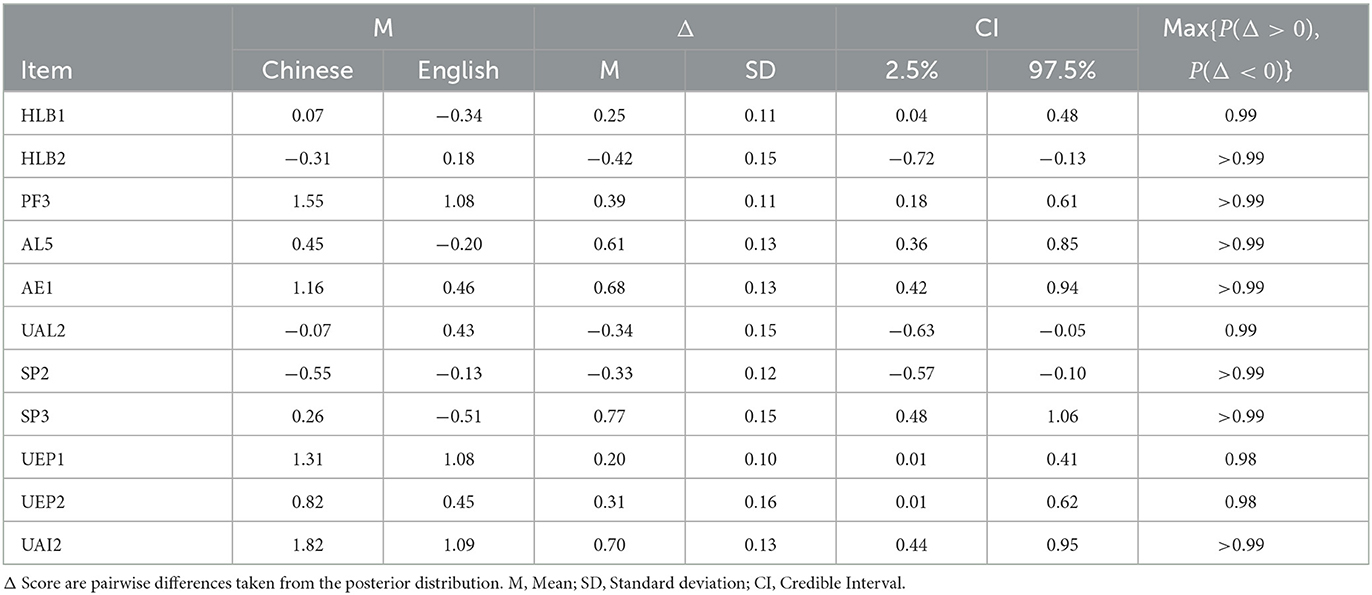
Table 4. Items with credible bias indication.
Table 5 shows the results of the construct and related dimension score analysis between the Chinese mother-tongue sample and the mixed-international English-speaking sample. We found seven credible indications of a difference (bold CI values). In all these cases, the posterior probability was above 97.5%. Across the 14 ASAs, the Chinese mother-tongue sample gave a higher score for the Agent's Sociability (AS). Yet, it gave a lower score for the Agent's Appearance Suitability (AAS), Performance (PF), User Acceptance of the Agent (UAA), Agent's Enjoyability (AE), User's Engagement (UE), and Attitude (AT).
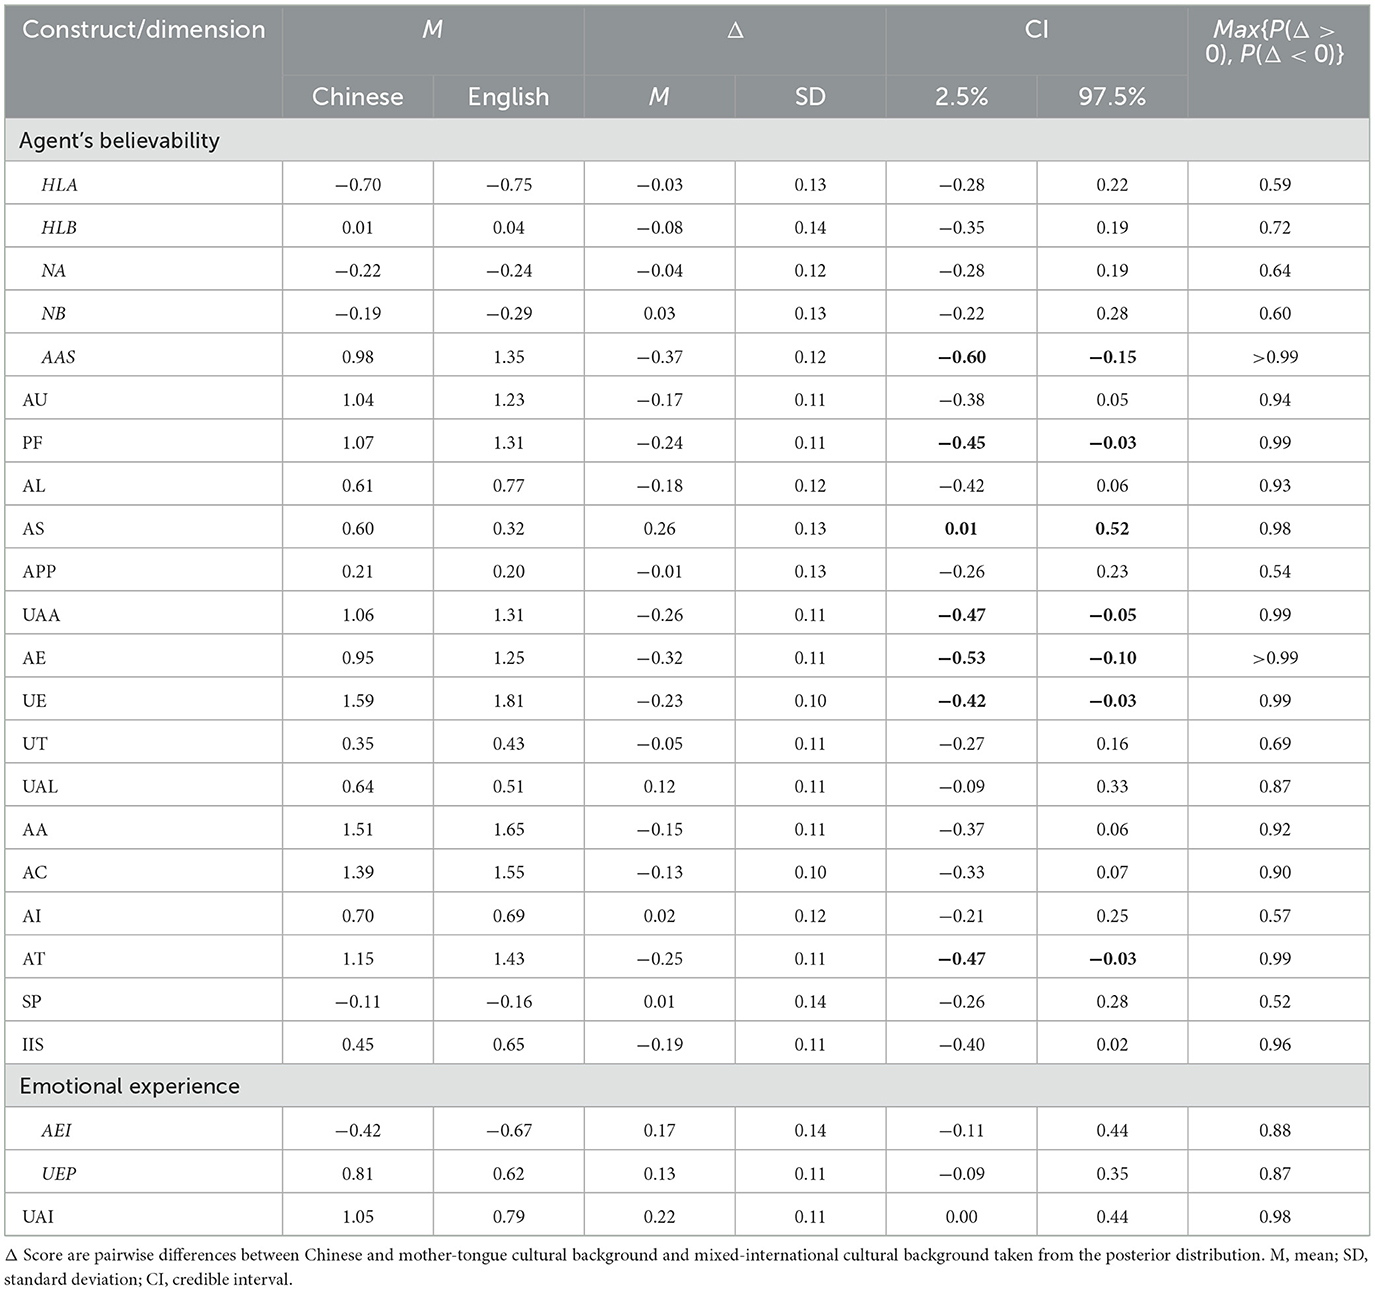
Table 5. Construct/dimension rating difference between mixed-international English-speaking and Chinese mother-tongue groups.
The findings suggest that researchers should preferably use the long version of the Chinese ASA questionnaire and compare it with their English counterparts at the construct or dimension level. At this level, correlations were 100% good or even excellent in the bilingual data. On average we found approximately a 0.10 difference in score equivalence between the two languages. It gives a limit to a minimum size for interpretable differences between the two languages. Or in other words, what is lost in translation. Still, for six constructs/dimensions, we suggest conversion corrections. For example, 0.16 should be added to a User's Engagement score of 1.43 from the Chinese ASA questionnaire to get the more or less equivalent 1.59 English version score. The paired difference in Table 2 of these six constructs/dimensions we suggest as correction values. To avoid future confusion, the report of the Chinese ASA questionnaire should clearly indicate whether they report the original Chinese score or the score converted to an equivalent English score.
For the alternative short version, the findings show correlations that were averagely good between the Chinese translation and the original English version of 24 representative items. Nevertheless, the correlations of nine representative items had only a fair classification. Score equivalence shows a 0.10 average difference between Chinese and English scores. Still, findings also show credible indications of biases for two representative items (8.3%). Table 3 offers conversion corrections for these items to English equivalent scores if needed.
The findings indicate caution in direct item-level comparison beyond the 24 representative items, as correlations for six items were poor. Eleven items had a credible indication of bias in their scores. Therefore, future researchers who want to convert one of these eleven scores from Chinese to English should add these differences reported in Table 4 to their Chinese score. For example, they would need to add −0.70 to their Chinese UAI2 item score of 1.82 to get a more or less equivalent 1.09 English score.
The findings support inter- and cross-cultural studies regarding human-ASA interaction. Although we cannot exclude other factors that may cause the observed differences (e.g., data were collected at different times), it gives an idea of how a researcher might study culture by comparing data sets collected from various populations using questionnaires in their own language in the future.
The study also has some limitations, which we would like to share. First, bilingual participants may use both languages when answering a question (Tsang et al., 2017). In our case, this seems unlikely, as we randomized the order in which the entire pool of 44 or 46 items, both English and Chinese, were presented, with participants taking an average of 14 min to complete. Secondly, we involved researchers rather than conducting a quantitative laypeople assessment in the back translation step. Yet we did not provide the original version to the bilingual researchers who translated the Chinese version back into English, a strategy consistent with others (Beaudart et al., 2017; Tsang et al., 2017). Also, using a bilingual sample for the equivalent assessment has the advantage of removing errors caused by the back translation. Third, as in the construct validation study of the questionnaire (Fitrianie et al., 2022), we only used a third-person perspective in the questions. Despite the possible difference in experience gained by interacting with the ASA rather than watching a video of someone else interacting, we assume that this could have had only a limited influence on the correlations and variations studied between English and Chinese ASA questionnaires. Fourth, because of privacy concerns, we did not collect age and gender information, which limits insight into generalizing findings to other populations. Finally, the comparison between mixed-international English-speaking and Chinese mother-tongue samples may have been biased toward a more internationally oriented population because the crowd-workers platform did not recruit in China.
The work presented also provides some opportunities for future research, for example, conducting cognitive interviews to see how people comprehend the translated and original English ASAQ questions. Likewise, work could also study how ratings change when other people interact with the ASA in a third-person perspective evaluation. Another direction would be to develop a Chinese norm set with ASAs that is exemplary for the Chinese population. Such a set would allow for comparison within this population, which may have its own set of popular ASAs with limited overlap with ASAs prevalent in other parts of the world. It would also promote inter- and cross-cultural research, as well as inter- and cross-ASA research. Both are relevant research goals for the ASA community, which is fundamentally interested in variation between two populations: humans and ASAs; for example, how different cultural groups perceived specific ASAs (Qu et al., 2013; Salem et al., 2014; Obaid et al., 2016). We also hope that the work and procedure presented to provide a blueprint for future translations of ASA questionnaires into other languages. More translations will enable more people to express their ASA experience in their own language, broadening the scope of the research and consequently increasing its application.
The presented Mandarin-Chinese translation of the ASA questionnaire shows the ability to provide results comparable to the original English version. In particular, the construct and dimension scores show good to excellent correlation, and on average small differences between languages. The presented translation of the short ASA version shows good correlations on average, with nine (37.5%) representative items correlating only fairly. In summary, these two validated translations allow researchers to evaluate human-ASA interaction in a Mandarin-Chinese-speaking population, with 1.1 billion, second in size after English (Eberhard et al., 2022).
Dataset and analysis scripts presented in this article are available at https://doi.org/10.4121/12bb2e67-85f0-41c0-bd34-4cca100e4aaf.
The studies involving humans were approved by TU Delft Ethics Committee for Human Research. The studies were conducted in accordance with the local legislation and institutional requirements. The participants provided their written informed consent to participate in this study.
W-PB and FL contributed to the design and analysis of the study. FL, SF, and MB organized the questionnaire survey design and distribution of the questionnaire. FL wrote the first draft of the manuscript. W-PB wrote the second version of the manuscript. SF, MB, AA, and FG modified the sections of the manuscript. All authors contributed to manuscript revision, read and approved the submitted version.
This work was funded by the Dutch 4TU—Humans and Technology, Pride and Prejudice project, and the China Scholarship Council (CSC) [grant number: 202006080121].
The authors declare that the research was conducted in the absence of any commercial or financial relationships that could be construed as a potential conflict of interest.
All claims expressed in this article are solely those of the authors and do not necessarily represent those of their affiliated organizations, or those of the publisher, the editors and the reviewers. Any product that may be evaluated in this article, or claim that may be made by its manufacturer, is not guaranteed or endorsed by the publisher.
The Supplementary Material for this article can be found online at: https://www.frontiersin.org/articles/10.3389/fcomp.2023.1149305/full#supplementary-material
1. ^https://osf.io/6duf7/ and https://ii.tudelft.nl/evalquest/
4. ^https://osf.io/7wmjh?view_only=208c920f8d5f4b908b247bd4133c3157
5. ^https://doi.org/10.4121/12bb2e67-85f0-41c0-bd34-4cca100e4aaf
Acquadro, C., Conway, K., Hareendran, A., Aaronson, N., and Issues, E. R., and of Life Assessment (ERIQA) Group, Q. (2008). Literature review of methods to translate health-related quality of life questionnaires for use in multinational clinical trials. Value Health 11, 509–521. doi: 10.1111/j.1524-4733.2007.00292.x
Beaton, D. E., Bombardier, C., Guillemin, F., and Ferraz, M. B. (2000). Guidelines for the process of cross-cultural adaptation of self-report measures. Spine 25, 3186–3191. doi: 10.1097/00007632-200012150-00014
Beaudart, C., Edwards, M., Moss, C., Reginster, J.-Y., Moon, R., Parsons, C., et al. (2017). English translation and validation of the sarqol, a quality of life questionnaire specific for sarcopenia. Age Ageing 46, 271–276. doi: 10.1093/ageing/afw192
Chang, A. M., Chau, J. P., and Holroyd, E. (1999). Translation of questionnaires and issues of equivalence. J. Adv. Nurs. 29, 316–322. doi: 10.1046/j.1365-2648.1999.00891.x
Cicchetti, D. V. (1994). Guidelines, criteria, and rules of thumb for evaluating normed and standardized assessment instruments in psychology. Psychol. Assess. 6:284. doi: 10.1037/1040-3590.6.4.284
Colina, S., Marrone, N., Ingram, M., and Sánchez, D. (2017). Translation quality assessment in health research: a functionalist alternative to back-translation. Eval. Health Prof. 40, 267–293. doi: 10.1177/0163278716648191
Eberhard, D. M., Simons, G. F., and Fennig, C. D. (eds.). (2022). Ethnologue: Languages of the World, 25th Edn. Dallas, TX: SIL International.
Finch, W. H., Bolin, J. E., and Kelley, K. (2014). Multilevel Modeling Using R. New York. NY: CRC Press.
Fitrianie, S., Bruijnes, M., Li, F., Abdulrahman, A., and Brinkman, W.-P. (2022). “The artificial-social-agent questionnaire: establishing the long and short questionnaire versions,” in Proceedings of the 22nd ACM International Conference on Intelligent Virtual Agents (Faro), 1–8. doi: 10.1145/3514197.3549612
Fitrianie, S., Bruijnes, M., Li, F., and Brinkman, W.-P. (2021). “Questionnaire items for evaluating artificial social agents-expert generated, content validated and reliability analysed,” in Proceedings of the 21st ACM International Conference on Intelligent Virtual Agents, 84–86. doi: 10.1145/3472306.3478341
Fitrianie, S., Bruijnes, M., Richards, D., Abdulrahman, A., and Brinkman, W.-P. (2019). “What are we measuring anyway? A literature survey of questionnaires used in studies reported in the intelligent virtual agent conferences,” in Proceedings of the 19th ACM International Conference on Intelligent Virtual Agents (Paris), 159–161. doi: 10.1145/3308532.3329421
Fitrianie, S., Bruijnes, M., Richards, D., Bönsch, A., and Brinkman, W.-P. (2020). “The 19 unifying questionnaire constructs of artificial social agents: an IVA community analysis,” in Proceedings of the 20th ACM International Conference on Intelligent Virtual Agents, 1–8. doi: 10.1145/3383652.3423873
Guillemin, F. (1995). Cross-cultural adaptation and validation of health status measures. Scand. J. Rheumatol. 24, 61–63. doi: 10.3109/03009749509099285
Guillemin, F., Bombardier, C., and Beaton, D. (1993). Cross-cultural adaptation of health-related quality of life measures: literature review and proposed guidelines. J. Clin. Epidemiol. 46, 1417–1432. doi: 10.1016/0895-4356(93)90142-N
Koo, T. K., and Li, M. Y. (2016). A guideline of selecting and reporting intraclass correlation coefficients for reliability research. J. Chiropr. Med. 15, 155–163. doi: 10.1016/j.jcm.2016.02.012
Kruschke, J. K. (2013). Bayesian estimation supersedes the t test. J. Exp. Psychol. 142:573. doi: 10.1037/a0029146
Maasoumi, R., Lamyian, M., Montazeri, A., Azin, S. A., Aguilar-Vafaie, M. E., and Hajizadeh, E. (2013). The sexual quality of life-female (SQOL-F) questionnaire: translation and psychometric properties of the Iranian version. Reprod. Health 10, 1–6. doi: 10.1186/1742-4755-10-25
Obaid, M., Salem, M., Ziadee, M., Boukaram, H., Moltchanova, E., and Sakr, M. (2016). “Investigating effects of professional status and ethnicity in human-agent interaction,” in Proceedings of the Fourth International Conference on Human Agent Interaction (Singapore), 179–186. doi: 10.1145/2974804.2974813
Qu, C., Brinkman, W.-P., Ling, Y., Wiggers, P., and Heynderickx, I. (2013). Human perception of a conversational virtual human: an empirical study on the effect of emotion and culture. Virt. Real. 17, 307–321. doi: 10.1007/s10055-013-0231-z
Rabin, R., Gudex, C., Selai, C., and Herdman, M. (2014). From translation to version management: a history and review of methods for the cultural adaptation of the Euroqol five-dimensional questionnaire. Value Health 17, 70–76. doi: 10.1016/j.jval.2013.10.006
Salem, M., Ziadee, M., and Sakr, M. (2014). “Marhaba, how may I help you? Effects of politeness and culture on robot acceptance and anthropomorphization,” in 2014 9th ACM/IEEE International Conference on Human-Robot Interaction (HRI) (Germany), 74–81. doi: 10.1145/2559636.2559683
Santos, J. G., Brito, J. O., de Andrade, D. C., Kaziyama, V. M., Ferreira, K. A., Souza, I., et al. (2010). Translation to Portuguese and validation of the Douleur Neuropathique 4 questionnaire. J. Pain 11, 484–490. doi: 10.1016/j.jpain.2009.09.014
Keywords: Artificial Social Agent, questionnaire, translation, validation, evaluation instrument, culture
Citation: Li F, Fitrianie S, Bruijnes M, Abdulrahman A, Guo F and Brinkman W-P (2023) Mandarin Chinese translation of the Artificial-Social-Agent questionnaire instrument for evaluating human-agent interaction. Front. Comput. Sci. 5:1149305. doi: 10.3389/fcomp.2023.1149305
Received: 21 January 2023; Accepted: 18 September 2023;
Published: 30 October 2023.
Edited by:
Minela Kerla, Consultant, Sarajevo, Bosnia and HerzegovinaReviewed by:
Izidor Mlakar, University of Maribor, SloveniaCopyright © 2023 Li, Fitrianie, Bruijnes, Abdulrahman, Guo and Brinkman. This is an open-access article distributed under the terms of the Creative Commons Attribution License (CC BY). The use, distribution or reproduction in other forums is permitted, provided the original author(s) and the copyright owner(s) are credited and that the original publication in this journal is cited, in accordance with accepted academic practice. No use, distribution or reproduction is permitted which does not comply with these terms.
*Correspondence: Willem-Paul Brinkman, dy5wLmJyaW5rbWFuQHR1ZGVsZnQubmw=
Disclaimer: All claims expressed in this article are solely those of the authors and do not necessarily represent those of their affiliated organizations, or those of the publisher, the editors and the reviewers. Any product that may be evaluated in this article or claim that may be made by its manufacturer is not guaranteed or endorsed by the publisher.
Research integrity at Frontiers
Learn more about the work of our research integrity team to safeguard the quality of each article we publish.