 Jorrit Ypenga
 Maarten Sukel
 Hamed S. Alavi
- Faculty of Science, University of Amsterdam, Amsterdam, Netherlands
Introduction: Accessibility and safe movement in urban areas entail infrastructure that minimizes the risks for pedestrians and bikers with diverse levels of abilities. Recognizing and mapping unsafe areas can increase awareness among citizens and inform city projects to improve their infrastructure. This contribution presents an example in which the specific objective is to recognize the unprotected areas around the canals in the city of Amsterdam.
Method: This is accomplished through running image processing algorithms on 11K waterside panoramas taken from the city of Amsterdam's open data portal. We created an annotated subset of 2K processed images for training and evaluation. This dataset debuts a novel pixel-level annotation style using multiple lines. To determine the best inference practice, we compared the IoU and robustness of several existing segmentation frameworks.
Results: The best method achieves an IoU of 0.79. The outcome is superimposed on the map of Amsterdam, showing the geospatial distribution of the low, middle, and high fences around the canals.
Discussion: In addition to this specific application, we discuss the broader use of the presented method for the problem of “transparent object detection” in an urban context.
1. Introduction
The ability for people to move safely is critical to a city's economic and social success (Abbar et al., 2018). An enormous amount of economic and engineering effort has been devoted to enhancing the efficiency of the road- and public-transport networks (Gakenheimer, 1999). However, less efficient means of transportation that compete for the same public space, such as walking and cycling, have been suffering the consequences, especially in Amsterdam, where bicycles outnumber the residents (Amsterdam Marketing Press Office, 2015). In the city of Amsterdam, despite actively promoting soft mobility, infrastructure is not up to par. The abundance of open water in and around the city center, combined with unsatisfactory regulation, results in an inconsistent presence of barriers separating the open water from accessible public space (Figure 1). This introduces a real risk for multiple groups, such as visitors unfamiliar with the water-rich environment, or citizens with reduced mobility or visual impairment. Different sources report anywhere from 10 to 20 deaths yearly (NOS Nieuws, 2017). Therefore, indexing the presence of barriers and preserving public space accessibility would be of great benefit to the city and its citizens.
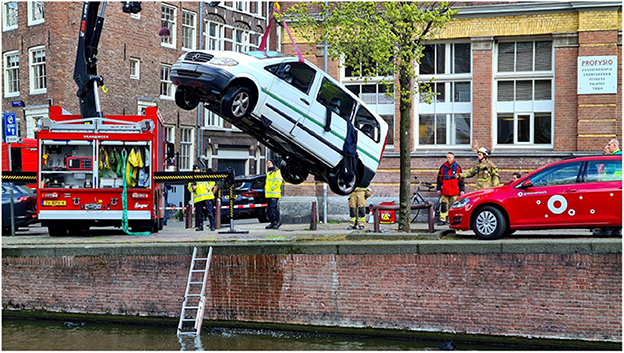
Figure 1. An accident in Amsterdam picturing a clear lack of fencing next to open water (Nieuws, 2022). This absence of fencing has proven very accident prone, with ~10 deaths yearly (NOS Nieuws, 2017). However, these numbers do not represent at-risk groups that actively avoid the city center for safety reasons.
Public space scenery naturally exhibits different structural features relevant to the safety of pedestrians and cyclists. An analysis of several engineering measures to reduce vehicle-to-pedestrian accidents done in the U.S. and England showed that the presence of barriers resulted in the most significant decrease (Retting et al., 2003) of all examined measures. Placing and maintaining physical barriers is the responsibility of the city's planning department, and traditionally, indexing, and inspecting such structural features is done manually, which is a costly and time-consuming process. Mapping these structural features around public space can play a crucial role in increasing awareness and preserving safe and accessible infrastructure for citizens.
The increasing availability of street-level imagery (Xu et al., 2021) and city open data portals combined with recent advancements in computer vision (Guo et al., 2018) has enabled promising new data- and model-driven methods in urban science. Numerous different deep learning approaches that aim to index the complex notion of safety in an urban context have been proposed (Sainju and Jiang, 2020; Bustos et al., 2021). However, most research that combines annotated street-level imagery and deep learning to quantify safety is conducted from a motor-vehicle perspective, with a primary focus on advancing autonomous driving technologies (Cordts et al., 2016; Neuhold et al., 2017). This research leverages deep learning methods to obtain a general understanding of road scenes. Annotated features whose successful detection would improve motor-vehicle safety through collision avoidance, e.g., other vehicles, traffic lights, etc., are often over-represented. As a result, research focused on geospatial mapping of the built environment generally includes feature annotations specific to that research. These datasets are rarely open-source (Biljecki and Ito, 2021).
Mapping a more concrete notion of safety for an urban environment, such as mapping the presence of barriers separating walking- and cycling areas from potential danger, introduces a major technical challenge. Barriers in an urban environment are largely transparent; to preserve the visibility of those separated, and to prevent visual pollution of the often authentic urban environment. Detecting or even segmenting such (partly) transparent objects is a largely understudied challenge in computer vision (Xie et al., 2020). It is a highly complex task, due to transparent objects assuming diverse appearances inherited from their background. This major difficulty is further amplified in a noisy and diverse urban environment. However, transparent object segmentation is best applied here, since transparent objects generally occur in urban contexts.
To this end, we propose a data- and model-driven method that can index the presence of fence-like barriers in an urban context. The method uses street view imagery as the primary data source and debuts a unique multi-line-based annotation style catering to partly transparent objects. By combining street view imagery with geographical features, our method identifies regions of interest visually and geographically. To determine the presence of objects, we use a relatively small subset of problem-specific annotated training data to train existing segmentation pipelines to segment fence-like barriers from their background. The predicted masks allow for additional post-processing for an even more detailed analysis. To assess the viability of the proposed method, we use street-view imagery of the city of Amsterdam. Specifically, by applying this method to water-side panoramic images of canals we could detect the fences along the canals, determine which canals are protected, and produce a safety map for the city of Amsterdam. This particular focus on safety and inclusivity in mobility was a direct response to the concerns raised by the city of Amsterdam, with whom our research team collaborated closely throughout the study. As a result, the key contribution of this paper lies in addressing the specific problem of safe and inclusive mobility, with the ultimate goal of creating a safer environment for all residents and visitors. The main outcome of our research, the color-coded safety rate map superimposed on the city map, has been shared with the municipality of Amsterdam and is intended for public availability. By providing this valuable information, we aim to contribute to the city's efforts in enhancing safety and promoting inclusivity in its canal network.
In Section 2, we briefly review related work in the domains of urban analytics and object detection. In Section 3, we describe the main objective of our work. Section 4 describes the properties of the data used in this research. In Section 5, we describe the proposed method and its evaluation. In Section 6, we summarize the results of conducted experiments. In Section 7, we discuss our findings and identify limitations with our approach. Finally, Section 8 concludes the paper.
2. Related work
Our work draws from related works in urban science and object detection. In this section, we briefly review these domains with a focus on street view imagery and transparent objects.
Street view images have become a very popular resource for urban analytics (Xu et al., 2021), due to their wide coverage, availability, homogeneous quality, human perspective, and rich metadata (Kang et al., 2020). As such, it has often been used to replace field visits with virtual audits (Badland et al., 2010). Recently, advances in computer vision have removed the need for audits entirely and enabled the automatic transformation of street view imagery into new geospatial data. Maintaining spatial infrastructure this way is the most common application domain in research using street view images (Xu et al., 2021). A substantial amount of work is focused on extracting smaller urban features, often omitted from spatial datasets, such as traffic lights, light poles, and bike racks (Xu et al., 2021). Most of these studies are solely focused on mapping features and do not discuss further implications. Feature mapping research also generally focuses on a specific location, as appearances may be significantly different across different geographies. Another challenge is accurate geo-localization of objects in images. However, previous research has shown that using additional data, such as aerial imagery, can improve results (Srivastava et al., 2019). Our work follows this recommendation by combining additional location data with model predictions. Furthermore, we try to generalize our findings to an assessment of accessibility.
Not all feature mapping research using street view images is solely focused on detection. Another popular application is to derive a variety of indicators of environmental characteristics that can be analyzed to assess their association with the impact on wellbeing, safety, and mobility. Results can then be used to inform policymakers to address issues and improve structural factors. Popular wellbeing indicators include greenness exposure and walkability, their proportion was found to be associated with citizen wellbeing on a neighborhood level (Nguyen et al., 2018). Research regarding mobility and walkability is very diverse in examining physical features. Curiously, features such as fences and barriers and their impact on safety are rarely mapped in literature, especially in urban contexts. One related work uses deep learning to map roadside crash barriers (Sainju and Jiang, 2020), where they achieved promising results. However, their proposed method only classifies on an image level. Furthermore, roadside barriers share limited characteristics with urban fencing since they cover long strips of roads and have a uniform appearance.
The more general task of object detection is now most commonly performed by leveraging deep learning techniques, their ability to learn robust features from video input varying in quality and presentation have made them the most researched method in the field. Initial deep learning solutions, such as RCNN, were comprised of two stages: a non-convolutional stage that identifies regions of interest and a subsequent convolutional stage that classifies them (Girshick et al., 2014). More recently, the field has moved to fully convolutional methods, in which the extraction of regions of interest is also convolutional (Dai et al., 2016). This shift paved the way for encoder-decoder segmentation models such as U-Net, where input is first reduced to key features by the encoder and then upsampled to obtain an even more precise pixel-level score map (Ronneberger et al., 2015). While object detection is a challenging task already, doing so in an urban environment introduces even more noise and thus difficulty.
A common occurrence in the urban environment are transparent or semi-transparent objects, objects of which the appearance is largely comprised of background noise. The detection of these transparent objects remains understudied but is generally tackled by enhancing existing data or methods. For example, Lai and Fuh (2015) enhance a traditional RCNN by leveraging visual effects specific to fully transparent objects, such as reflection and color, to limit proposed regions. While Xu et al. (2019) try to overcome transparency-induced noise by using light-field images. Leveraging the unique properties of transparent objects directly, using deep learning, was first proposed by Chen et al. (2018), their encoder-decoder structure showed promising results on synthetic and real data. Several other segmentation methods for transparent object detection were further explored by Xie et al. (2020). They created their own extensively annotated transparent object dataset for evaluation; Trans10K. Their proposed method demonstrates the importance of exploiting boundaries inherent to transparent objects by outperforming numerous established segmentation methods. However, their annotation specifically excludes nontransparent segments from partly transparent objects; information that could help better reveal boundaries. Contrary to their work, our annotations specifically exclude the transparent regions of semi-transparent objects by annotating only their nontransparent segments and boundaries.
As a sub-challenge of transparent object detection, research with regards to fence recognition or segmentation specifically is also scarce. Current research does not treat fences as individual objects but as undesired foreground, and existing segmentation efforts are mainly focused on extracting the fence-like occlusion and restoring the desired background. De-fencing can be achieved automatically using naive methods as shown by Yi et al. (2016), while Jonna et al. (2016) demonstrate that a deep learning approach using CNN-SVM is also feasible. However, data used for de-fencing training and evaluation is very problem-specific; fences occlude the entire image, exhibit a consistent pattern and present high foreground-background contrast. These conditions are very forgiving compared to those present in our problem: fences in an urban environment have diverse appearances and blend into their background, making them harder to segment using naive methods.
3. Objectives
Traditionally, transparent objects are not handled well by regular detection and segmentation models due to the unique properties that transparency introduces (Xu et al., 2019). In literature, transparent objects are most often described as objects that borrow a large portion of their texture from their background (Xu et al., 2019; Xie et al., 2020). As a result, transparent objects have a similar appearance to their surroundings, making them hard to detect or segment. This property required a more specific research direction: transparent object detection, which is a sub-field of object detection that focuses on solving this background texture challenge through data- and model-driven methods.
The main objective of this work is to establish a generalizable data-driven pipeline for transparent structural feature mapping in urban context using regular segmentation models. The proposed pipeline is multi-modal and consists of a detection and geospatial stage. It is important that the resulting feature map is readable by the general public and policy makers. A critical part of creating such a feature map and method generalizability is the need for accurate data-driven object detection. We use the city of Amsterdam case as an example of transparent object detection and mapping, and to verify our pipeline. To deal with the transparency problem, we introduce a novel annotation style that labels only the solid parts of the transparent object.
4. Data
The initial image data is a subset of ~11 K waterside panorama pictures sampled from a radius around the city center of Amsterdam. Each image provides a 360° view and is shot from the water surface by boat. The images measure 8,000 × 4,000 pixels (width, height) and are provided in full color. Each panorama has its geographic location attached, expressed in longitude and latitude. The maximum distance between subsequent panorama images amounts to ~5 m, providing an unprecedented spatial resolution. Some areas exhibit an even higher spatial density due to a second pass by boat but in reverse. Other image-specific metadata, such as camera orientation and timestamps, are also included. All images were extracted using the city's open data portal API (Gemeente Amsterdam Onderzoek, 2022a). We refer to Figure 2 for an example of the panoramas and their geographic distribution.
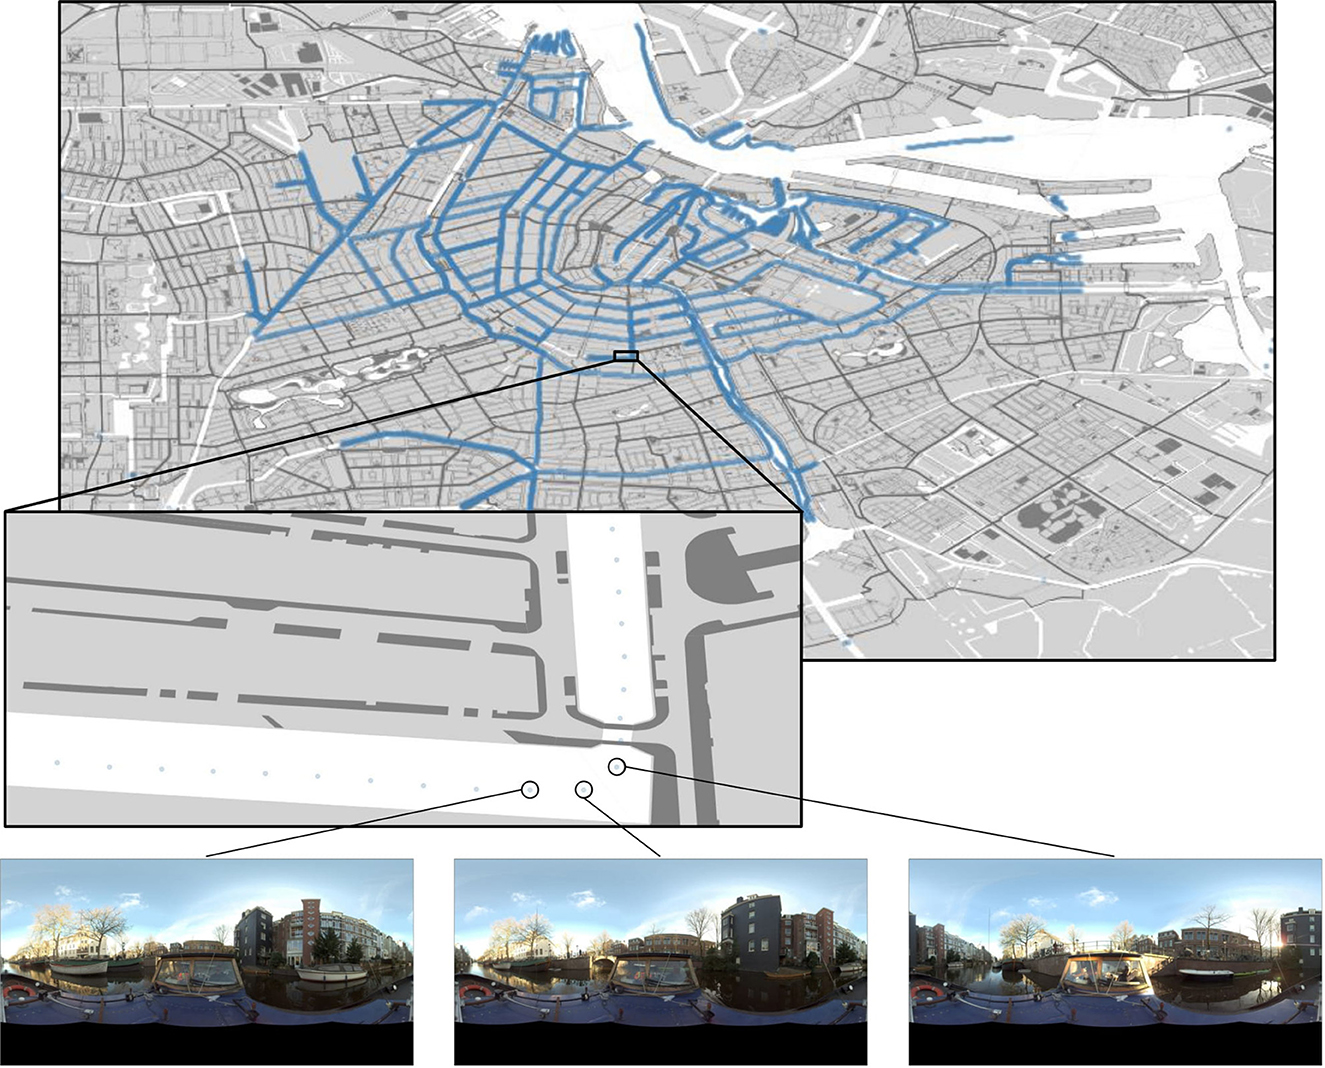
Figure 2. A visualization of the data and its geographic distribution. The data spans a radius centered on the city center. Every blue dot represents a single 8,000 × 4,000 panorama.
For the background of the geographic plots shown in this work and geospatial post-processing, several Geographical Information Systems (GIS) were queried. The Netherlands provides an open GIS API named Publieke Dienstverlening op de Kaart (PDOK) (Kadaster, 2022) which allows users to query different topography spanning the entire country. Furthermore, PDOK allows users to download selected areas in standard GIS formats. For this work, we extracted all Basisregistratie Grootschalige Topografie (BGT) (van Binnenlandse Zaken en Koninkrijksrelaties, 2021) layers focused on the city of Amsterdam in Geography Markup Language (GML) format. The layers used for the plots are bgt_voetpad and bgt_waterdelen, which provide polygons of walkways and open water. Additionally, for some visualizations and the subset splits in the training data, topography of Amsterdam neighborhoods is used. This data is provided by the city's open geodata portal (Gemeente Amsterdam Onderzoek, 2022b) in GeoJSON format. All topography is converted to the WGS84 coordinate system (epsg.io, 2007).
5. Method
In this section, we discuss the proposed multi-modal approach. It consists of four main components: region of interest extraction, data annotation, a segmentation model, and a mapping stage. The first region extraction component processes the raw data so that it can be used as model input. Then, extracted regions are used to create annotated pixels masks for training. The segmentation model then classifies input pixels as either fence or background. Finally, in the post-processing stage, we interpret the segmentation results and transform them into properties that are usable by policy makers. All code is published on GitHub.1
5.1. Regions of interest extraction
The raw panoramas measure too large for model input and contain a lot of redundant visual information, which warrants an additional processing step. The 360° view provides the opportunity to focus on the left- and right-side viewpoints of the boat. This is achieved by converting the provided camera heading to a viewpoint and then composing two additional viewpoints perpendicular to the heading viewpoint. The resulting viewpoints are converted to 1,024 × 512 windows, centered on the intersection of the respective viewpoint and a fixed horizon at a height of 2,000 pixels. We choose a larger width to preserve as much quality visual information from the viewpoint as possible. An overview of the pre-processing is shown in Figure 3. We ignore other camera orientation parameters, such as roll and pitch, because they do not vary significantly (, ) and any minimal effects are mitigated by data augmentation during training.
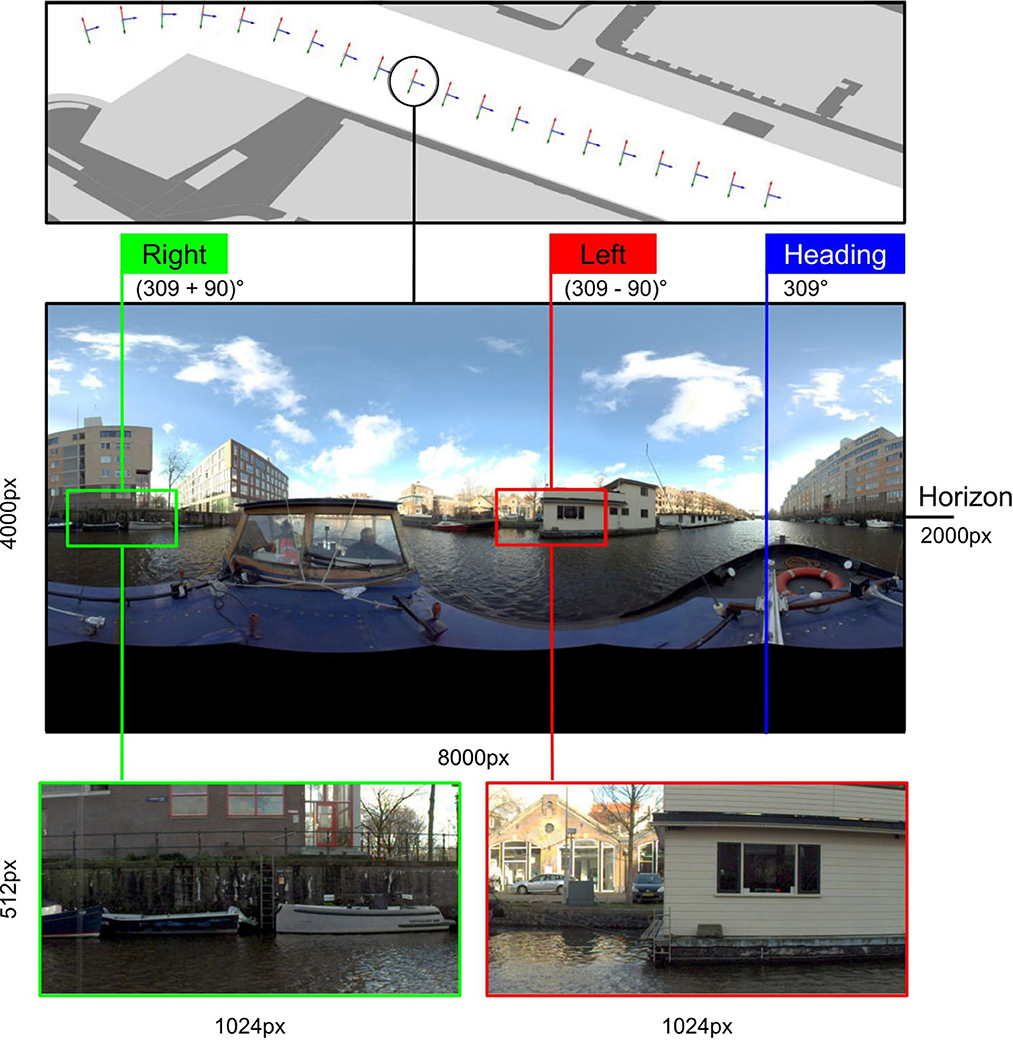
Figure 3. An overview of the region of interest extraction process. Through a combination of location data and camera metadata, it is possible to extract and locate two focused 1,024 × 512 windows from a single panorama.
By extracting the regions of interest for every panorama, the 360° view is lost, rendering the initially provided location as an inadequate geographical representation of the resulting regions. To obtain a better geographical notion for the left and right regions, we use the property that the reported camera heading corresponds to the front of the boat. The panorama metadata does not include any information regarding the direction of the boat, but because the data has such high spatial density, it can be estimated using the location of the succeeding panorama. After calculating the direction vector, we can estimate the two vectors corresponding to the left and right viewpoint by finding the two perpendicular vectors.
It is worth noting that the regions are extracted from 360° panoramic images, resulting in heavy distortion in any viewpoints other than the two perpendicular ones. As a result, these two regions consistently exhibit the highest quality, rendering an assessment of regional quality unnecessary. Nevertheless, introducing minimal random shifts in viewpoints and generating additional regions could enhance data augmentation, which we identify as a potential avenue for future work.
5.2. Creating the training data
To train our segmentation models we require a dataset tailored to the segmentation problem. We obtained images for annotation by running the ROI-extraction algorithm on all provided panoramas, resulting in ~22 K 1,024 × 512 frames. We sampled images for our dataset in two separate batches of 1 K images. The first batch was randomly selected, but only included ~400 fences to annotate. Since pixel-level annotations already result in plenty of negative samples, the second batch was manually selected from the remaining 21 K to only include fences, resulting in a dataset of 2 K 1,024 × 512 images containing 1,414 fences.
For annotation, we opted for a novel multi-line style annotation, whereas such objects would traditionally be annotated using polygons. As opposed to Xie et al. (2020), we specifically try to exclude the transparent regions of a fence in our annotations and focus only on the solid parts. A multi-line annotation should accommodate this and is more precise than a box-like polygon and faster than fitted multi-polygon. An example of a multi-line annotation is shown in Figure 6. However, a consequence of this annotation, is that the line width of the annotations can be varied. Optimally, line width would be fixed specific to an individual object, but this would have to be done manually. Instead, we leave this as a hyperparameter to be optimized. All annotation is performed in CVAT (Sekachev, 2020) and compliant with COCO (Lin et al., 2014) annotation standards.
To perform running- and general evaluation, the 2 K annotated images are split into train, test, and validation sets using neighborhood data. A concern with street view images is the high visual correlation introduced by high spatial density, a neighborhood-based split avoids this correlation between training and evaluation. To perform the split, a neighborhood is assigned to every image based on its location. Then, neighborhoods are randomly selected until an approximate 1,700/150/150 split is achieved, resulting in 1,682 training images, 155 validation images, and 163 test images. We refer to Figure 4 for further details.
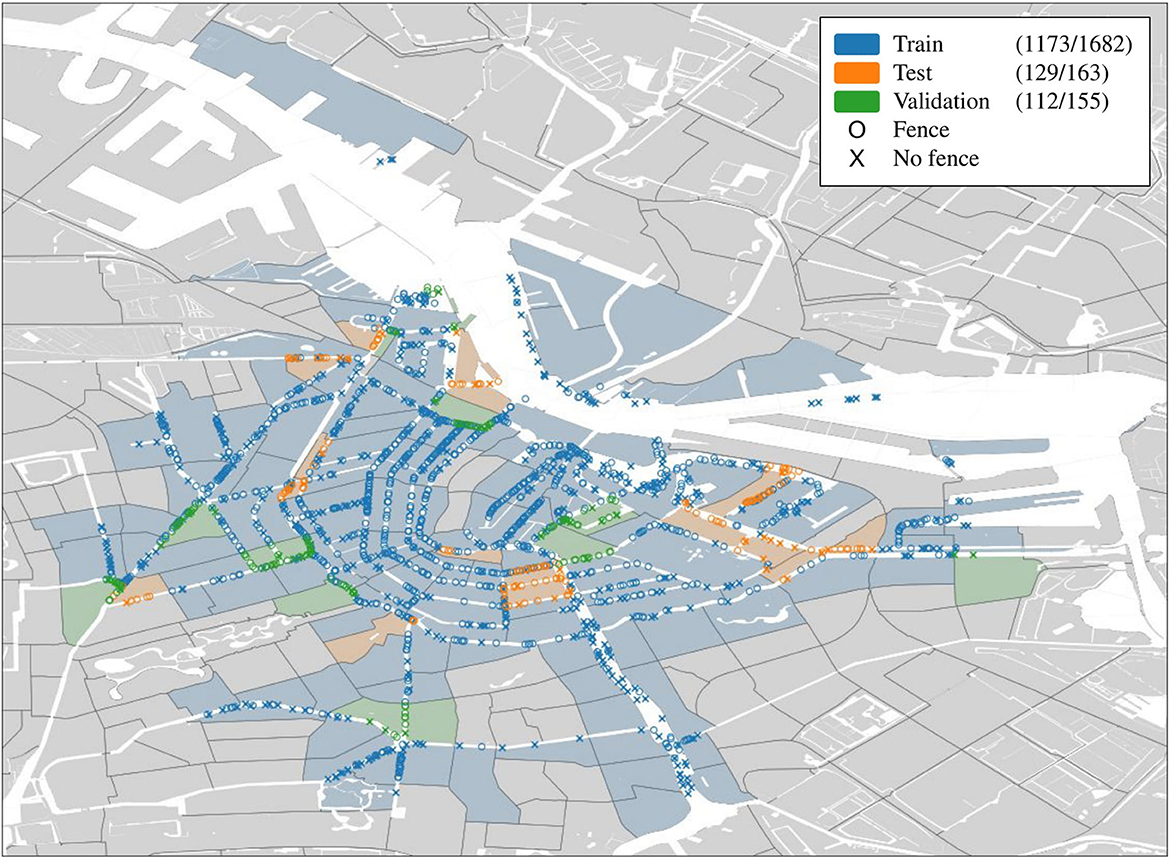
Figure 4. The geospatial distribution of the training data per neighborhood. The legend shows number of images containing fences out of the total number of images in the subset.
5.3. Model evaluation
We evaluate the tested models in multiple respects, such as accuracy, precision, recall, and complexity. The standard accuracy evaluation for segmentation that is widely adopted by benchmarks, is the Jaccard Index or Intersection over Union (IoU):
where A and B denote the ground truth and predicted masks. However, IoU is purely based on overlap and is traditionally used with filled polygons. This, combined with our annotations being relatively imprecise and imbalanced on a pixel level, does not give a satisfactory indication of localization. Therefore, we propose blob-IoU, which introduces clustering and filling steps to transform the ground truth and predicted local masks to polygons or “blobs,” before calculating the IoU.
Since we expect to interpret the segmentation results on an image level for the feature map, we also report evaluation results when using image-level labels instead of pixel-level labels. Since evaluating image-level performance on a segmentation dataset with imbalanced image-level labels (see Figure 4) might give a warped perspective of performance, we also report the pixel-level results for the same metrics in brackets. Combined, the image- and pixel-level evaluation, should capture trends better. We evaluate our models on accuracy, recall, precision, and F1-score. Additionally, we also list the number of trainable parameters for each model. Best results per column are denoted in bold.
5.4. Model selection
For our experiments, we consider several segmentation methods in the literature. All models follow the encoder-decoder structure and allow for different convolutional neural networks (CNN) as encoder or decoder. When referring to segmentation models, we specifically refer to the decoder model that functions as classification head. We first establish a baseline using U-Net (Ronneberger et al., 2015), an encoder-decoder structure that features connections between encoder and decoder layers, which minimize loss of information between the contracting and classification stages. U-Net was shown to be effective in tasks featuring imbalanced annotations similar to ours (Ronneberger et al., 2015; Zhang et al., 2018). We train the baseline models on annotations with a line width of three pixels.
While establishing a baseline, we experiment with two different approaches to combat overfitting; we introduce additional data augmentation and make use of transfer learning by using encoders pre-trained on ImageNet (Deng et al., 2009). The effects on baseline performance of both approaches are shown in Table 1. Since the combination of transfer learning and augmentation yields the best improvement, we use both methods for all further experiments.
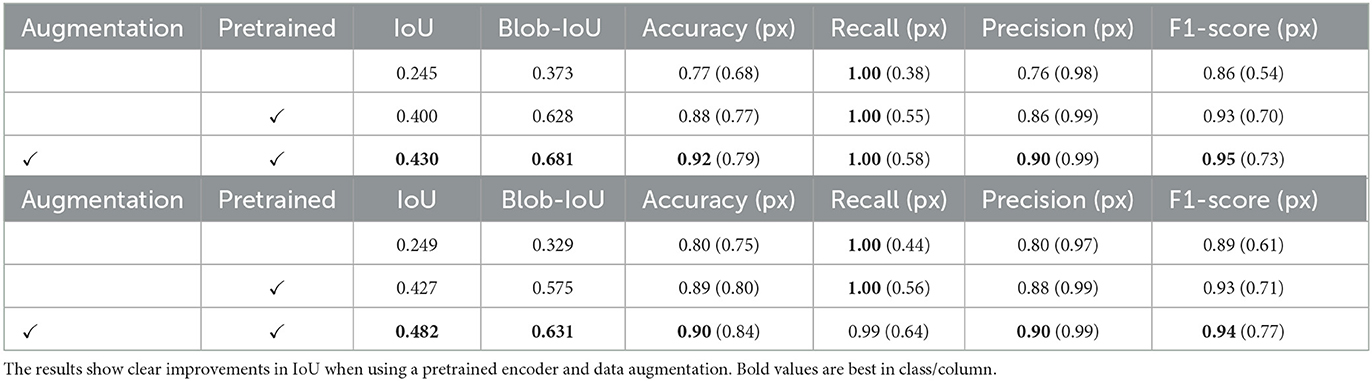
Table 1. ResNet-18 + U-Net baseline performance on validation (top) and test (bottom) sets using 3px wide annotations.
Before any further training, we need to establish the optimal line width of the multi-line annotation that strikes a balance between the number of additional positive pixels introduced and the number of false-positive pixels labeled. To find this optimum, we train baselines using annotations with the line width varying between 3 and 20 pixels. The IoU and blob-IoU scores per annotation width are displayed in Figure 5.
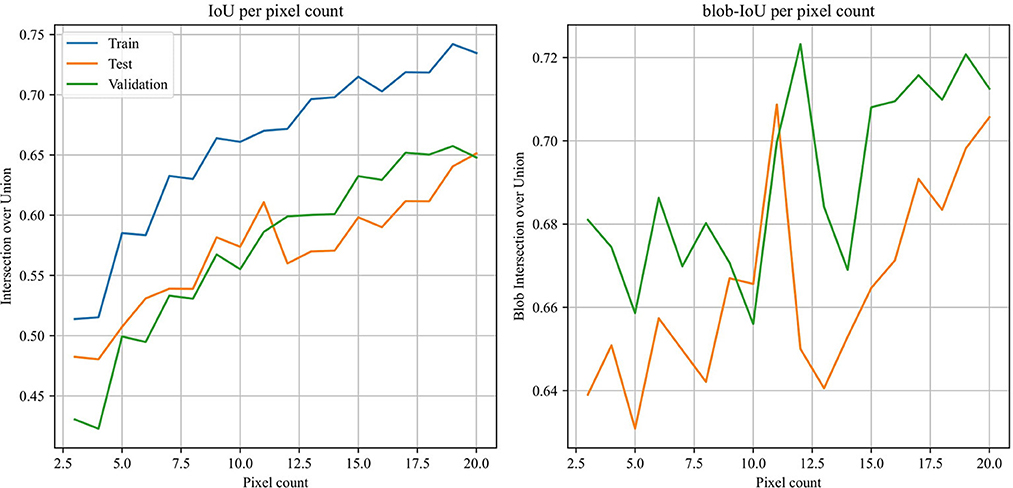
Figure 5. Reported mean IoU vs. mean blob-IoU over varying line widths for annotations. The blob-IoU score peaks at an annotation line width of 11 pixels for both the test and validation subsets.
After establishing the optimal line width, we perform an ablation study comparing our multi-line annotations to traditional polygon-like bounding box annotations. To obtain polygon annotations, the multi-line annotations are clustered before their outline is used to draw and fill the polygon annotations. Annotation performance on the evaluation and test sets is shown in Table 2. For this experiment, we only report blob-IoU, since it is the same as standard IoU for polygon-like annotations.

Table 2. Ablation study results on validation (top) and test (bottom) sets using 11 px wide annotations.
Using the optimal width, we consider several other methods: methods featuring parallel layer connections similar to U-Net, such as LinkNet (Chaurasia and Culurciello, 2017), MA-Net (Fan et al., 2020), and U-Net++ (Zhou et al., 2018), methods based on pyramid structures; FPN (Lin et al., 2017) and PAN (Li et al., 2018), and dilation-based methods, such as DeepLabV3 (Chen et al., 2017). For encoders, we experiment with two established general-purpose CNNs: ResNet (He et al., 2016) and EfficientNet (Tan and Le, 2019). The experiments are structured as follows: we first find the best decoder when using a fixed encoder. The criteria used to determine the best decoder are the results on the validation set. Then, we examine the effects of encoder depth when using the best decoder. All model implementations were used in PyTorch using the Segmentation Models library (Yakubovskiy, 2020).
5.5. Training details
For all experiments, we use Dice loss, a loss function shown to be effective in dealing with strong class imbalances (Milletari et al., 2016). For optimization, we use Adam optimizer (Kingma and Ba, 2014) with a learning rate fixed at 8 × 10⁻⁵. All training was conducted in the cloud on an NVIDIA Tesla T4 16 GB GPU over 30 epochs in mixed precision. Batch size was varied between 32 and 4 for different encoder-decoder combinations, where a bigger batch size was used for less complex models and vice versa. Figure 6 illustrates the training pipeline.
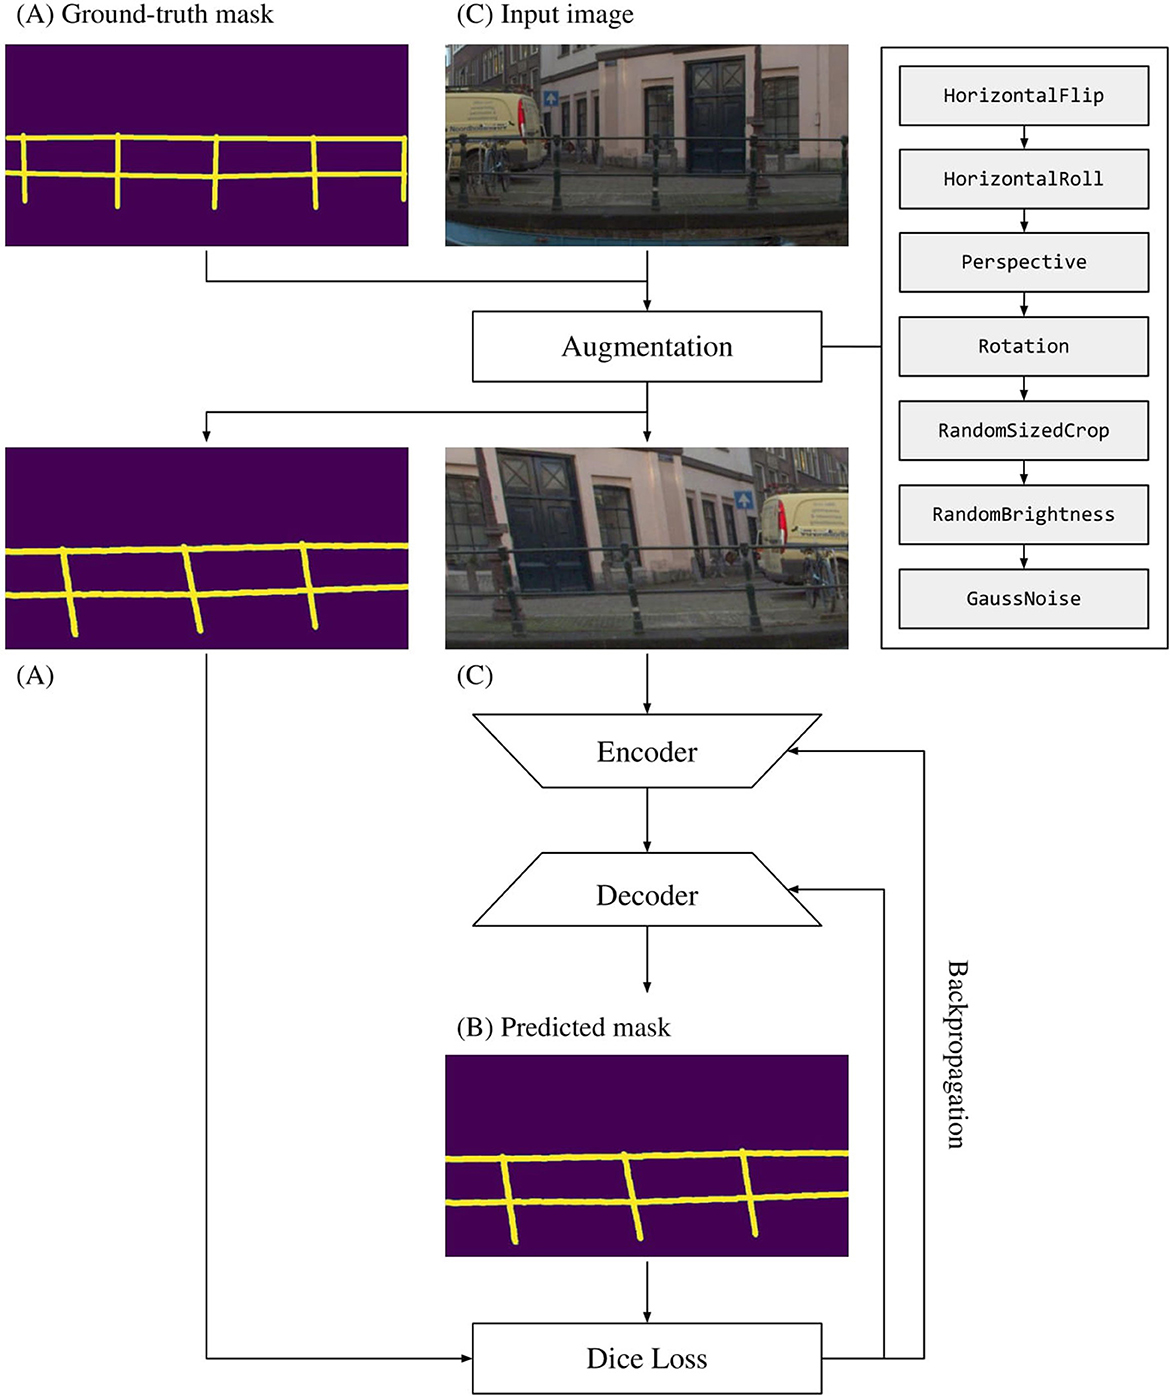
Figure 6. The training pipeline formulated for a single iteration of a single sample. The training pipeline takes (A, C) as inputs, and augments them both, before feeding them through the segmentation model consisting of an encoder and decoder network. Then, Dice loss is computed for (A, B), and network weights are adjusted accordingly.
5.6. Creating the feature map
To obtain the feature map of Amsterdam, we run the best model (EfficientNet-b6 + U-Net++) on the full preprocessed dataset of 22 K extracted 1,024 × 512 regions. To estimate fence height in pixels, we sample the x coordinates with corresponding maximum y coordinates and interpolate between them. Then, after sampling from the interpolated x coordinates, we find their corresponding minimum y coordinates, calculate the differences, and average over them. Note that the y-axis is inverted when sampling from image data as a matrix. Before plotting, all height predictions are binned in three equal-sized bins representing low, middle, and high fence heights. To obtain the prediction location, the panoramas are sorted on timestamp before calculating the boat's direction vector using the next position in time. The left and right vectors are obtained by finding the two vectors perpendicular to the direction. Predicted locations are displayed at a fixed distance from the boat. The full inference pipeline is documented in Figure 7. The resulting feature map is shown in Figure 8.
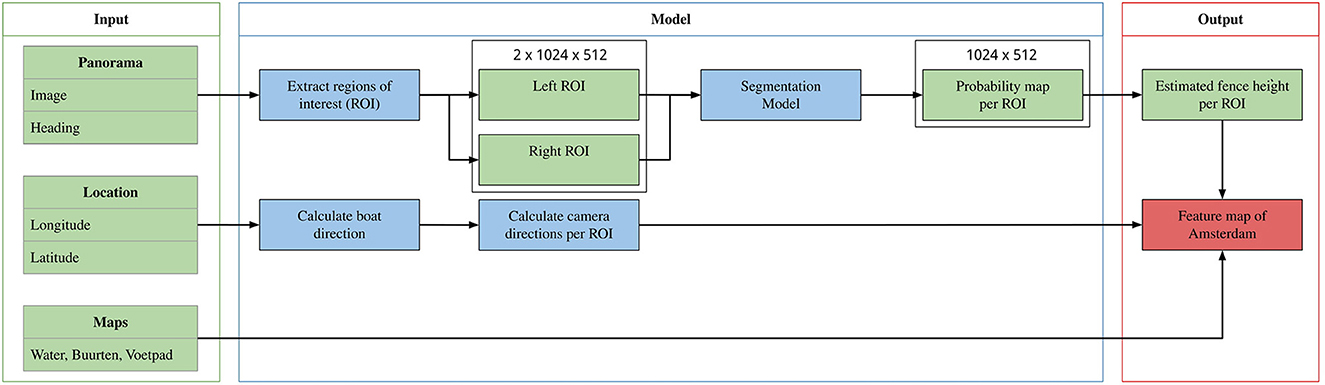
Figure 7. A schematic overview of the full inference process. The method takes three different data sources as input: panorama images, their geolocation, and Amsterdam topography. The panoramas are converted to fence heights in pixels through region extraction and fence segmentation. The geolocation is used to obtain a viewpoint corresponding to the resulting fence predictions. Finally, the results are plotted on the Amsterdam topography.
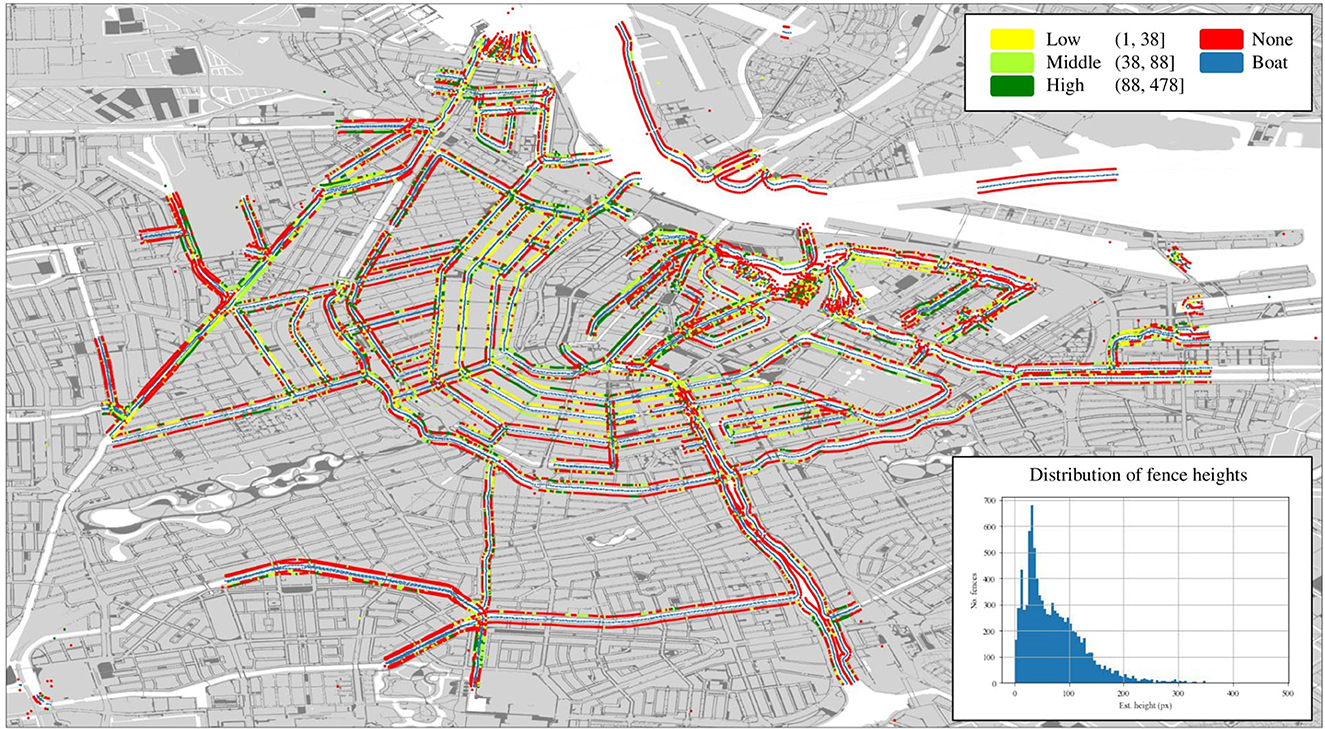
Figure 8. Map of Amsterdam showing the geospatial distribution of the three fence classes: low, middle, and high. The fence heights in pixels corresponding to these classes are reported in the legend. The general distribution of fence heights (excluding zeros) is shown in the bottom-right corner.
6. Results
The results of enhancing the ResNet-18 + U-Net baseline with transfer learning and data augmentation, listed in Table 1, show that the combination of pre-training and data augmentation is superior on both validation and test sets, listing a 20 and 30% improvement in IoU and blob-IoU, respectively. An interesting result is the extremely high label recall of 1.0, which is likely a result of the baselines being undertrained. Note that the pixel recall is much lower, and does increase.
The IoU and blob-IoU scores for different annotation widths (Figure 5) suggest that the optimal annotation width is 11 pixels. While the IoU scores show a gradually flattening upward trend, the blob-IoU scores show a clear peak at 11 pixels for both the evaluation and test sets. The upward trend continues after the steep drop in blob-IoU, but narrower annotations are always preferred since the chance of falsely annotating background pixels is lower. Additionally, while pixel-level performance may keep increasing when using wider annotations, image-level performance would surely suffer.
After establishing the optimal line width at 11 pixels, we perform an ablation study comparing our multi-line annotations to traditional polygon-like bounding box annotations. While the polygon annotations are slightly superior in IoU on the validation set, they are inferior when considering image-level performance. Note that pixel-level performance is still superior since polygon-like annotations are much denser (~2.3×). When accounting for this difference, these results are to be expected. When looking at the test set, multi-line annotations show an improvement of 6% in IoU, while also being the best in all image-level metrics. It is worth noting that, while the image-level metrics may suggest that a multi-line annotation generalizes better to unseen data, the opposite IoU result in the validation set could be an indication of a small-sized dataset, and thus further investigation is needed to make a final conclusion in terms of viability of multi-line annotation compared with the polygon-like box annotation method for real-world applications.
We report the results of different decoder models using a fixed ResNet-18 encoder in Table 3. All decoders show comparable performance on the evaluation set, with different models excelling in different metrics. We do identify U-Net++ as the best performer since it achieves the best scores in IoU, blob-IoU, and F1-score. However, performance on the test set is more uniform: 5 out of 7 models report similar F1-scores. This suggests that any of the tested decoders will generalize well, with subtle trade-offs in specific performance. Furthermore, the results suggest that decoder complexity does not strongly affect model performance, decoders with complexity in the range of 2–11.5 M trainable parameters perform similarly in all metrics.
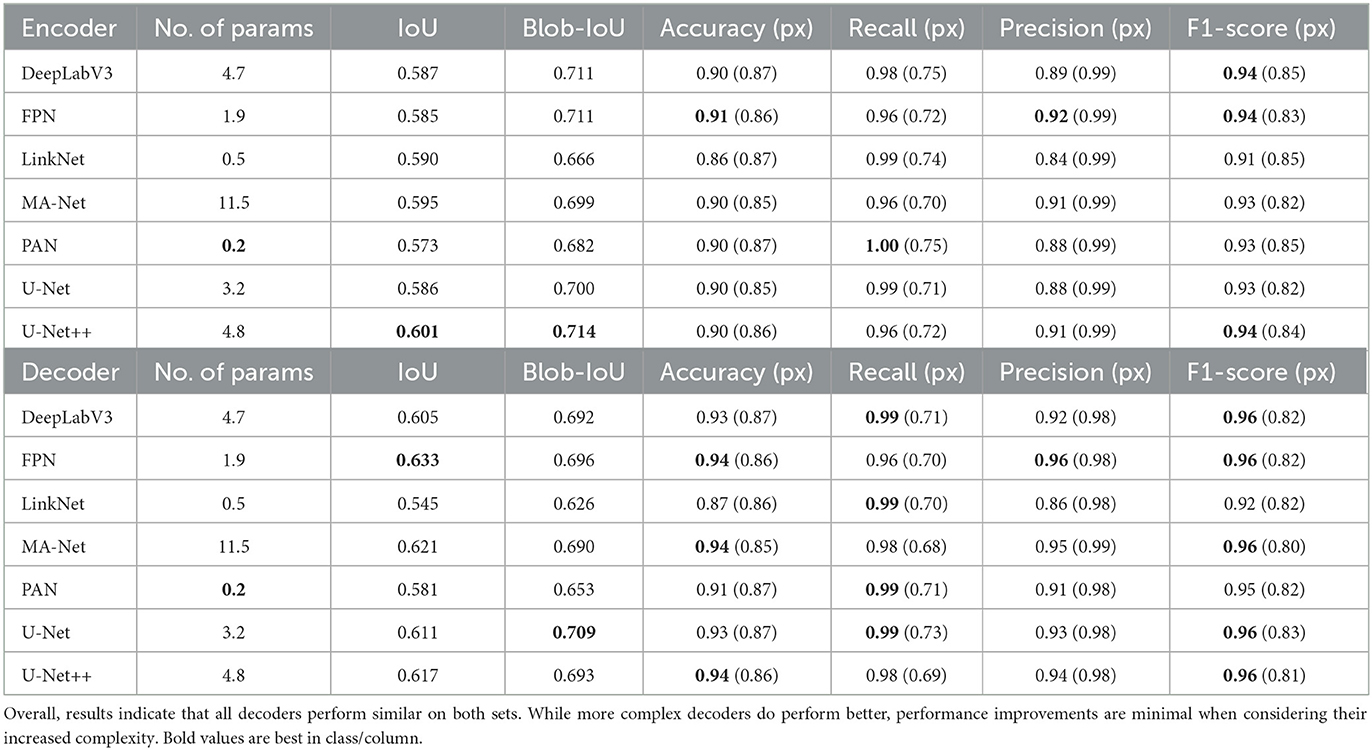
Table 3. ResNet-18 (11.2 M params) + decoder performance on validation (top) and test (bottom) sets using 11 px wide annotations.
Concerning the effects of encoder depth, we test increasingly larger encoders in combination with a fixed decoder and list the results in Table 4. We chose U-Net++ since it was a clear best performer in the decisive scores on the validation set. Contrary to the decoder experiments, the results show a clear pattern: a larger encoder increases segmentation and classification performance. However, there seems to be no clear difference in the pixel level classification metrics, suggesting no clear benefit to a larger encoder in that respect. We also observe that label recall decreases as encoder depth increases. However, here we see that label precision increases as recall decreases, as opposed to our baseline experiments.
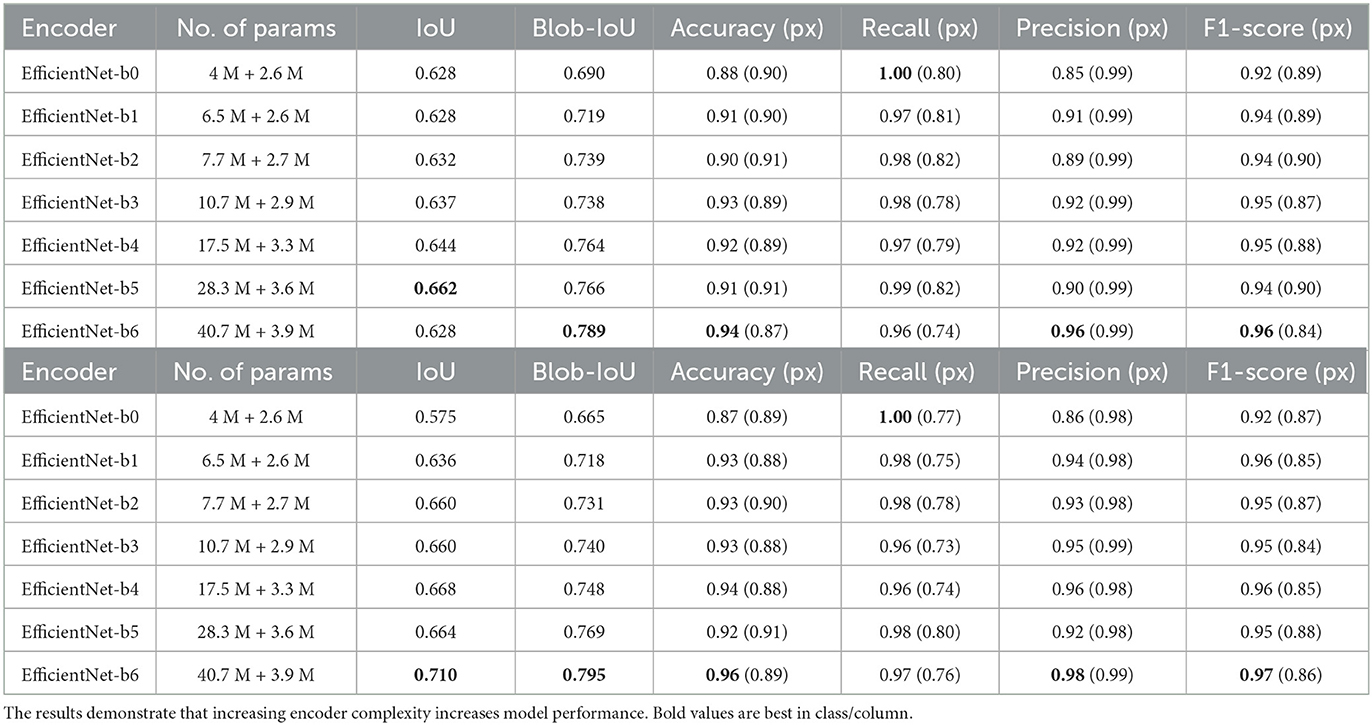
Table 4. Encoder + U-Net++ performance on validation (top) and test (bottom) sets using 11 px wide annotations.
We cannot subject our inference results shown in Figure 8 to a quantitative analysis other than the image-level results reported in Tables 3, 4 since there is no already existing data available on the geospatial distribution of fences in Amsterdam. However, the results match our understanding of the environment and local knowledge. The bulk of the fencing being concentrated in the city center is in line with our expectations, as these are the most populated and visited areas, which would require sufficient fencing. The areas containing no fences being spread over the outskirts is also within our expectations, as these are often larger bodies of water in a less built and thus less visited environment. Furthermore, the distribution of fence heights, reported in the bottom-right corner, does not raise any technical concerns with the pipeline or height estimation since most fences are under a reasonable—compared to the height of the image—200 pixels in height, with very few outliers.
7. Discussion
In this section, we first discuss the interpretation of the resulting feature map. Then we discuss the viability of the proposed method, focusing on the individual stages and experiments. Finally, we discuss how our method scales and generalizes to other transparent objects.
7.1. Feature map interpretation
A big concern with our findings is interpreting them in an urban context concerning safety and accessibility. While the results show that fence segmentation performs well in isolation, it is impossible to mark positive predictions as protected and safe areas in the current approach. This is because an urban environment contains many fences that do not necessarily function as barriers separating public space from open water. Examples include boat railings and balconies, but also fencing present only in the background of an image. The proposed method can not distinguish between fences that function as safety barriers and fences that serve other purposes without introducing additional data or post-processing. However, due to the high precision of all methods, negative predictions (“None”) are very likely to be true. Locating these areas without fencing—especially in the city center—is still useful to policymakers, even without any further indications of safety.
7.2. Limitations
We acknowledge several limitations with the proposed method and the evaluation and selection process of the different segmentation models. First, the proposed region extraction algorithm is overly reliant on correct metadata. During the manual inspection, we found several consecutive instances of erroneous metadata. Especially the most crucial metadata for region extraction, the camera orientation, is sometimes reported incorrectly. An error at this stage is propagated through the entire method since the rest of the method is based on the viewpoints corresponding to the extracted regions being perpendicular to the direction of the boat. As a result, the predictions will not necessarily match their estimated locations on the feature map, but will instead be shifted by the degree of error in the reported camera orientation.
Second, we only test different pixel widths using the initial baseline. While we can conclude that wider annotations (>3 px) will increase model performance in general, it is not unlikely that different models will show peaks at different widths. The encoder and decoder selection processes suffer from the same limitation. Again, from the significant performance increases, we can conclude that in general, a larger encoder will increase model performance. However, different decoders will reap different benefits from deeper encoders and vice-versa. Therefore, it cannot be said that the combination of Efficient Net-b6 and U-Net++ is necessarily the best segmentation model. Such a conclusion would require testing more combinations. Finally, in the current implementation, the ranges of fence classes (low, middle, and high) are determined based on the distribution of total fence heights. A future improvement of the method could be achieved by taking into consideration other parameters, e.g., by considering the distance from the camera to the canal-side to be able to estimate the actual fence height. In addition, the impact of less influential hyperparameters such as batch size, image size, and image augmentation pipeline could be assessed to enrich the performance evaluation of the applied method.
7.3. Broader application
The application of the proposed method is not necessarily limited to fence detection, multiple objects that could be detected using street view images fit the definition of a transparent object, such as windows. And, despite the discussed limitations, our method does achieve seemingly accurate transparent feature mapping. Since the pipeline relies mostly on deep learning, the method is highly scalable and generalizable. Even more so, because we use an abundant data source in street view images as input. Furthermore, the only dependency that determines what transparent object is detected, is the annotated data, for which we showed that annotation restricted to the tangible parts of a transparent object generalizes better while remaining efficient due to the usage of multi-lines. A strategy that would easily fit transparent objects similar to fences. In the end, we only used 1,700 training samples to achieve a 0.79 test IoU. An interesting future research direction would be to study method performance when using even less training data. Based on these considerations, we highly recommend segmentation for transparent feature mapping, due to its ability to learn precise annotations effectively with minimal training requirements.
8. Conclusion
This paper presents an example of urban feature mapping in which the specific objective is to recognize fences next to open water in the city of Amsterdam. We examine a new take on the transparent object detection paradigm, by annotating only tangible parts of transparent objects using multi-lines. This more precise style of annotation generalizes better to unseen data when compared to traditional methods. By running and evaluating several state-of-the-art segmentation models on 22K preprocessed panoramas, we show that fence detection in isolation is feasible on an image- and pixel-level, achieving state-of-the-art results. Mapping the fence heights on the city of Amsterdam produces a feature map that aligns with our local knowledge. However, directly interpreting these results in urban context concerning safety without additional post-processing is not feasible, and would require further work.
Data availability statement
The datasets presented in this article are not readily available because, the original data is owned by the city of Amsterdam and can be only published after anonymization in the future. Requests to access the datasets should be directed to am9ycml0LnlwZW5nYUBnbWFpbC5jb20=.
Author contributions
This contribution is the outcome of a research project done by JY and supervised by HA and MS. All authors contributed to the article and approved the submitted version.
Conflict of interest
The authors declare that the research was conducted in the absence of any commercial or financial relationships that could be construed as a potential conflict of interest.
Publisher's note
All claims expressed in this article are solely those of the authors and do not necessarily represent those of their affiliated organizations, or those of the publisher, the editors and the reviewers. Any product that may be evaluated in this article, or claim that may be made by its manufacturer, is not guaranteed or endorsed by the publisher.
Footnotes
References
Abbar, S., Zanouda, T., and Borge-Holthoefer, J. (2018). Structural robustness and service reachability in urban settings. Data Mining Knowl. Discov. 32, 830–847. doi: 10.1007/s10618-018-0551-4
Amsterdam Marketing Press Office. (2015). Amsterdam, fietsstad nummer 1. Available online at: https://www.iamsterdam.com/media/features/nl/press-feature-fietsen-in-amsterdam-ne.pdfla=nl (accessed July 30, 2022).
Badland, H. M., Opit, S., Witten, K., Kearns, R. A., and Mavoa, S. (2010). Can virtual streetscape audits reliably replace physical streetscape audits? J. Urban Health 87, 1007–1016. doi: 10.1007/s11524-010-9505-x
Biljecki, F., and Ito, K. (2021). Street view imagery in urban analytics and GIS: a review. Landsc. Urban Plann. 215:104217. doi: 10.1016/j.landurbplan.2021.104217
Bustos, C., Rhoads, D., Sole-Ribalta, A., Masip, D., Arenas, A., Lapedriza, A., and Borge-Holthoefer, J. (2021). Explainable, automated urban interventions to improve pedestrian and vehicle safety. Transp. Res. Part C 125:103018. doi: 10.1016/j.trc.2021.103018
Chaurasia, A., and Culurciello, E. (2017). “Linknet: exploiting encoder representations for efficient semantic segmentation,” in 2017 IEEE Visual Communications and Image Processing (VCIP) (St. Petersburg, FL), 1–4. doi: 10.1109/VCIP.2017.8305148
Chen, G., Han, K., and Wong, K.-Y. K. (2018). “TOM-Net: learning transparent object matting from a single image,” in Proceedings of the IEEE Conference on Computer Vision and Pattern Recognition (Salt Lake, UT), 9233–9241. doi: 10.1109/CVPR.2018.00962
Chen, L.-C., Papandreou, G., Schroff, F., and Adam, H. (2017). Rethinking atrous convolution for semantic image segmentation. arXiv preprint arXiv:1706.05587. doi: 10.48550/arXiv.1706.05587
Cordts, M., Omran, M., Ramos, S., Rehfeld, T., Enzweiler, M., Benenson, R., et al. (2016). “The cityscapes dataset for semantic urban scene understanding,” in Proceedings of the IEEE Conference on Computer Vision and Pattern Recognition (Las Vegas, NV), 3213–3223. doi: 10.1109/CVPR.2016.350
Dai, J., Li, Y., He, K., and Sun, J. (2016). “R-FCN: object detection via region-based fully convolutional networks,” in Advances in Neural Information Processing Systems, Vol. 29 Barcelona.
Deng, J., Dong, W., Socher, R., Li, L.-J., Li, K., and Fei-Fei, L. (2009). “ImageNet: a large-scale hierarchical image database,” in 2009 IEEE Conference on Computer Vision and Pattern Recognition (Miami, FL), 248–255. doi: 10.1109/CVPR.2009.5206848
Fan, T., Wang, G., Li, Y., and Wang, H. (2020). MA-Net: a multi-scale attention network for liver and tumor segmentation. IEEE Access 8, 179656–179665. doi: 10.1109/ACCESS.2020.3025372
Gakenheimer, R. (1999). Urban mobility in the developing world. Transp. Res. Part A 33, 671–689. doi: 10.1016/S0965-8564(99)00005-1
Gemeente Amsterdam Onderzoek, I. E. S. (2022a). Gemeente Amsterdam - Data en Informatie - Restful API - Geowebservices - Panoramabeelden. Gemeente Amsterdam Onderzoek.
Girshick, R., Donahue, J., Darrell, T., and Malik, J. (2014). “Rich feature hierarchies for accurate object detection and semantic segmentation,” in Proceedings of the IEEE Conference on Computer Vision and Pattern Recognition (Columbus, OH), 580–587. doi: 10.1109/CVPR.2014.81
Guo, Y., Liu, Y., Georgiou, T., and Lew, M. S. (2018). A review of semantic segmentation using deep neural networks. Int. J. Multim. Inform. Retriev. 7, 87–93. doi: 10.1007/s13735-017-0141-z
He, K., Zhang, X., Ren, S., and Sun, J. (2016). “Deep residual learning for image recognition,” in Proceedings of the IEEE Conference on Computer Vision and Pattern Recognition (Las Vegas, NV), 770–778. doi: 10.1109/CVPR.2016.90
Jonna, S., Nakka, K. K., and Sahay, R. R. (2016). “Deep learning based fence segmentation and removal from an image using a video sequence,” in European Conference on Computer Vision (Amsterdam: Springer), 836–851. doi: 10.1007/978-3-319-49409-8_68
Kang, Y., Zhang, F., Gao, S., Lin, H., and Liu, Y. (2020). A review of urban physical environment sensing using street view imagery in public health studies. Ann. GIS 26, 261–275. doi: 10.1080/19475683.2020.1791954
Kingma, D. P., and Ba, J. (2014). Adam: a method for stochastic optimization. arXiv preprint arXiv:1412.6980. doi: 10.48550/arXiv.1412.6980
Lai, P.-J., and Fuh, C.-S. (2015). “Transparent object detection using regions with convolutional neural network,” in IPPR Conference on Computer Vision, Graphics, and Image Processing, Vol. 2 Le Creusot.
Li, H., Xiong, P., An, J., and Wang, L. (2018). Pyramid attention network for semantic segmentation. arXiv preprint arXiv:1805.10180. doi: 10.48550/arXiv.1805.10180
Lin, T.-Y., Dollár, P., Girshick, R., He, K., Hariharan, B., and Belongie, S. (2017). “Feature pyramid networks for object detection,” in Proceedings of the IEEE Conference on Computer Vision and Pattern Recognition (Honolulu, HI), 2117–2125. doi: 10.1109/CVPR.2017.106
Lin, T.-Y., Maire, M., Belongie, S., Hays, J., Perona, P., Ramanan, D., et al. (2014). “Microsoft coco: common objects in context,” in European Conference on Computer Vision (Zurich: Springer), 740–755. doi: 10.1007/978-3-319-10602-1_48
Milletari, F., Navab, N., and Ahmadi, S.-A. (2016). “V-net: fully convolutional neural networks for volumetric medical image segmentation,” in 2016 Fourth International Conference on 3D Vision (3DV) (Stanford, CA), 565–571. doi: 10.1109/3DV.2016.79
Neuhold, G., Ollmann, T., Rota Bulo, S., and Kontschieder, P. (2017). “The mapillary vistas dataset for semantic understanding of street scenes,” in Proceedings of the IEEE International Conference on Computer Vision (Venice), 4990–4999. doi: 10.1109/ICCV.2017.534
Nguyen, Q. C., Sajjadi, M., McCullough, M., Pham, M., Nguyen, T. T., Yu, W., et al. (2018). Neighbourhood looking glass: 360 automated characterisation of the built environment for neighbourhood effects research. J. Epidemiol. Commun. Health 72, 260–266. doi: 10.1136/jech-2017-209456
NOS Nieuws. (2017). Waarom in de gracht plassen levensgevaarlijk kan zijn. Available online at: https://nos.nl/op3/artikel/2209985-waarom-in-de-gracht-plassen-levensgevaarlijk-kan-zijn (accessed July 10, 2022).
NOS Nieuws. (2022). Busje met toeristen rijdt Amsterdamse gracht in, negen mensen gered. Available online at: https://nos.nl/artikel/2423592-busje-met-toeristen-rijdt-amsterdamse-gracht-in-negen-mensen-gered (accessed July 10, 2022).
Retting, R. A., Ferguson, S. A., and McCartt, A. T. (2003). A review of evidence-based traffic engineering measures designed to reduce pedestrian-motor vehicle crashes. Am. J. Publ. Health 93, 1456–1463. doi: 10.2105/AJPH.93.9.1456
Ronneberger, O., Fischer, P., and Brox, T. (2015). “U-Net: convolutional networks for biomedical image segmentation,” in International Conference on Medical Image Computing and Computer-Assisted Intervention (Munich: Springer), 234–241. doi: 10.1007/978-3-319-24574-4_28
Sainju, A. M., and Jiang, Z. (2020). Mapping road safety features from streetview imagery: a deep learning approach. ACM Trans. Data Sci. 1, 1–20. doi: 10.1145/3362069
Srivastava, S., Vargas-Munoz, J. E., and Tuia, D. (2019). Understanding urban landuse from the above and ground perspectives: a deep learning, multimodal solution. Remote Sens. Environ. 228, 129–143. doi: 10.1016/j.rse.2019.04.014
Tan, M., and Le, Q. (2019). “EfficientNet: rethinking model scaling for convolutional neural networks,” in International Conference on Machine Learning (Long Beach, CA), 6105–6114.
van Binnenlandse Zaken en Koninkrijksrelaties, M. (2021). Geobasisregistraties - de Geobasisregistraties - Basisregistratie Grootschalige Topografie (bgt).
Xie, E., Wang, W., Wang, W., Ding, M., Shen, C., and Luo, P. (2020). “Segmenting transparent objects in the wild,” in European Conference on Comput. Vision (Glasgow: Springer), 696–711. doi: 10.1007/978-3-030-58601-0_41
Xu, F., Jin, A., Chen, X., and Li, G. (2021). “New data, integrated methods and multiple applications: a review of urban studies based on street view images,” in 2021 IEEE International Geoscience and Remote Sensing Symposium IGARSS (Brussels), 6532–6535. doi: 10.1109/IGARSS47720.2021.9554660
Xu, Y., Nagahara, H., Shimada, A., and Taniguchi, R.-I. (2019). Transcut2: transparent object segmentation from a light-field image. IEEE Trans. Comput. Imaging 5, 465–477. doi: 10.1109/TCI.2019.2893820
Yakubovskiy, P. (2020). Segmentation Models Pytorch. Available online at: https://github.com/qubvel/segmentation_models.pytorch (accessed July 30, 2022).
Yi, R., Wang, J., and Tan, P. (2016). “Automatic fence segmentation in videos of dynamic scenes,” in Proceedings of the IEEE Conference on Computer Vision and Pattern Recognition (Las Vegas, NV), 705–713. doi: 10.1109/CVPR.2016.83
Zhang, Z., Liu, Q., and Wang, Y. (2018). Road extraction by deep residual u-net. IEEE Geosci. Remote Sensing Lett. 15, 749–753. doi: 10.1109/LGRS.2018.2802944
Keywords: smart city, accessible urban design, street view image analysis, transparent object detection, urban safety
Citation: Ypenga J, Sukel M and Alavi HS (2023) Fence detection in Amsterdam: transparent object segmentation in urban context. Front. Comput. Sci. 5:1143945. doi: 10.3389/fcomp.2023.1143945
Received: 13 January 2023; Accepted: 13 June 2023;
Published: 06 July 2023.
Edited by:
Christos Diou, Harokopio University, GreeceReviewed by:
Muhammad Aamir, Huanggang Normal University, ChinaAlexandros Papadopoulos, Aristotle University of Thessaloniki, Greece
Leonidas Alagialoglou, Aristotle University of Thessaloniki, Greece, in collaboration with reviewer AP
Copyright © 2023 Ypenga, Sukel and Alavi. This is an open-access article distributed under the terms of the Creative Commons Attribution License (CC BY). The use, distribution or reproduction in other forums is permitted, provided the original author(s) and the copyright owner(s) are credited and that the original publication in this journal is cited, in accordance with accepted academic practice. No use, distribution or reproduction is permitted which does not comply with these terms.
*Correspondence: Hamed S. Alavi, aC5hbGF2aUB1dmEubmw=