
95% of researchers rate our articles as excellent or good
Learn more about the work of our research integrity team to safeguard the quality of each article we publish.
Find out more
ORIGINAL RESEARCH article
Front. Comput. Sci. , 13 February 2023
Sec. Human-Media Interaction
Volume 5 - 2023 | https://doi.org/10.3389/fcomp.2023.1066881
This article is part of the Research Topic Use of Immersive Technologies in Design View all 5 articles
 Crescent Jicol1
 Gerald Taulo2Cora Goldie2Tayfun Lloyd-Esenkaya1Ruth Hynes3Caroline Paradise3
 Michael J. Proulx4
 Alexandra A. de Sousa2*
Here we sought to understand how perceived personal space is influenced by a number of variables that could influence Indoor Environmental Quality (IEQ); specifically, we tested how different levels of social density, spatial density, noise presence, and type of view impact the appreciation of personal space in a shared office environment. We employed virtual reality (VR) to simulate shared and single occupancy offices and devised a novel measure of personal space estimation. We also used a traditional personal space satisfaction score. Participants experienced greater perceived personal space when (1) in a sparsely populated rather than a dense office, (2) in a private office rather than an open plan office, and (3) having any view outside of the office. We did not find an effect of the presence of noise or increased social density (with spatial density held constant) on the perception of personal space.
Workplace design has seen a substantial transition in the recent years across both private and state sectors, from the provision of individual offices, to shared or open-plan work environments (Chapman et al., 2015; Richardson et al., 2017). Several advantages of open-plan offices have been used as justification for their implementation. The most notable are the flexibility of the space and the facilitation of collaboration in a work market which increasingly demands teamwork (Zahn, 1991; Vischer, 1999; Pinder et al., 2009; van Duinkerken and MacDonald, 2013). Still, a considerable body of research has shown disadvantages to shared offices such as increased noise and distraction (Hedge, 1982) and employees are seldom consulted about their implementation (Nikolaeva and Russo, 2017).
A recent systematic review of 19 studies investigating the effects of shared office space revealed that such a layout in the workplace could have detrimental effects on employees' health (Richardson et al., 2017). Interestingly, team-member relations and friendship were lower within shared compared to individual offices in most cases (Richardson et al., 2017). Earlier reviews agree with these findings (Croon et al., 2005; Oommen et al., 2008; Al Horr et al., 2016), thus suggesting that perhaps some characteristics inherent to shared offices are detrimental to workers' wellbeing and productivity. Here we employ a factorial design whereby we examine combinations of factors that characterize shared offices in separate experiments, and provide suggestions for future research on personal space in the workplace (cf. Hong et al., 2017).
Traditional negative issues that can arise due to insufficient personal space include loss of privacy, loss of identity, lack of security, and crowdedness (Croon et al., 2005; Oommen et al., 2008; Kok et al., 2015; Al Horr et al., 2016). In fact, a recent study found that occupants report that, regardless of office layout, perceived amount of personal space is the strongest determinant of workplace satisfaction (Kim and de Dear, 2013). Understanding the nature of spatial knowledge is a classical issue in psychology, and the core practical problem to address with effective architecture in built environments (Proulx et al., 2016).
Despite these issues, and in situations where working from home is not possible or allowed, a return to individual offices is improbable in a property market with prices on the rise and where most companies cluster in large urban centers where space is scarce. However, not all individuals prefer individual offices or dislike shared offices. Research so far has not examined different characteristics of shared offices and how they modulate occupants' perception of personal space (Duval et al., 2002), and the implications for the mental and physical health of workers (Graham et al., 2011).
Extensive research on office space has focused primarily on the topic of Indoor Environmental Quality (IEQ) and its impact on the mental and physical health of employees and their productivity (Fisk, 2000; Wargocki et al., 2000; Humphreys et al., 2007). However, spatial attributes of an office are problematic to control within an experimental design, which has led to subjective surveys of workers (Humphreys et al., 2007), which means that within-group comparisons are impossible. Another aspect which has been researched insufficiently is the interaction between personal space and noise levels or existence or type of view in the work environment (Kim and de Dear, 2013).
Spatial density refers to the amount of space that is provided per person within the workspace. A higher spatial density means that each person has less personal space, and this measure is independent of the total number or people working in that space. High levels of spatial density have been shown to lead to a sense of crowding, low satisfaction, low task performance, social withdrawal and increased turnover intentions (Dean et al., 1975; Oldham and Rotchford, 1983; Oldham and Fried, 1987; Stokols and Altman, 1987; Oldham, 1988; Evans, 1994; Charles and Veitch, 2002; Hua et al., 2011). Social density refers to the number of people working in the same office, mostly studied with post-occupancy questionnaires (Duval et al., 2002). Social density thus increases as more people are working in the same office. Social and spatial density can increase together in cases where more people are added to the same amount of space (e.g., more workers start using the same office). Sundstrom et al. (1982) investigated a large variety of jobs and shared office types within a university. An indirect link between social density and satisfaction was found, such that as social density decreases, privacy increases and that in turn increases satisfaction with the workplace.
The presence of noise in the workplace is considered one of the three main stressors for employees (see Jahncke et al., 2011), together with privacy (Kim and de Dear, 2013), and crowding (Croon et al., 2005). A study by Pejtersen et al. (2011) found that exposure to environmental noise contributes to sickness absence due to elevated stress; this was replicated by other studies reporting poor emotional and physiological health amongst employees working in noisy offices (Evans, 2000; Danielsson et al., 2014). Less studied is how the presence or type of noise is mediated by the amount of personal space workers have, and thus the presence of noise would not have as much of an effect on satisfaction. Higher levels of noise in the workplace may reduce perceived spatial density, as it could give the impression of increased proximity to others. At the same time, louder offices may give the impression of increased numbers of co-workers, which is equivalent to an increase in social density.
There has been extensive research into aspects related to lighting within the workspace, which generally concluded that natural lighting has a beneficial effect on workers' health and satisfaction (Fisk et al., 1993; Küller and Wetterberg, 1996; Boubekri et al., 2016). However, window glare is tolerated better if there is a pleasant view from the window (Chauvel et al., 1982). Transparent barriers themselves are not easily perceived, therefore a window view could afford an expansion of the spatial parameters that one includes in personal space (Marquardt et al., 2015). This means that the existence of a view outside the office, for example toward a corridor should increase perceived personal space as the boundaries of the workspace are extended. It has been argued that a “good” view should be of the foreground and the skyline (Littlefair, 2002), with a preference for natural views over urban ones (e.g., Tennessen and Cimprich, 1995; Hartig et al., 2003; Chang and Chen, 2005) providing stress relief (Ulrich et al., 1991; Stigsdotter and Grahn, 2004), recovery from mental fatigue (Kaplan, 1995; Berman et al., 2008), or physical injury (Ulrich, 1984). “Good” views are generally of natural scenes, containing plants and trees (Aries et al., 2015). Arguably, if windows provide a more seamless boundary of the workspace, an outdoor view offering distant landmarks will yield more perceived personal space compared to an indoor view over a building corridor, for example. Still, the “quality” of the view may impact personal space in that a nature scene could yield a higher personal space score compared to an urban view. These hypotheses need to be tested, however as to our knowledge no study to date has compared all three types of view mentioned, while maintaining the workspace constant in type and size.
A robust experimental approach is needed to avoid the limitations of field studies and provide variability in the spaces tested, ideally using a factorial, repeated-measures design. Such requirements are extremely hard to accomplish using physically built environments and thus we turn to Virtual Reality (VR) as a means to perceive natural and human-made environments (Portman et al., 2015). VR has been used increasingly in the field of design (Orland et al., 2001; Lange, 2011; Gill and Lange, 2015), and has reached a point in development whereby it can now be used confidently in visualization of architectural designs to facilitate an understanding of characteristics of the design (Heydarian and Becerik-Gerber, 2017; Heydarian et al., 2017), which would not arise easily from conventional 2D designs (Portman et al., 2015).
In the present paper, we utilize VR to simulate shared office environments to have full control over spatial attributes of the working spaces and collect both physical estimations and satisfaction measures of personal space for the first time. To our knowledge, no study to date has measured physical estimations of personal space in VR, which in our case will represent actual estimations of personal space size rather than just satisfaction alone (e.g., Sundstrom et al., 1980, 1982; Block and Stokes, 1989; Hedge et al., 1989; Duval et al., 2002).
In three experiments, we tested how different levels of spatial density, social density, environmental noise presence, and type of office view impact personal space estimation and satisfaction in a shared office environment. Most importantly, we investigated how these factors interact in determining the perception of personal space. Satisfaction was also obtained through traditional questionnaires, to enable direct comparison of our results with past literature.
In Experiment 1 we investigated the effect of spatial density and noise presence/absence of personal space perception. The two hypotheses tested in Experiment 1 were:
H1: Participants would experience greater perceived personal space: when in a sparsely populated, rather than dense office.
H2: Participants would experience greater perceived personal space when there is an absence of noise, compared to when environmental noise is present.
In Experiment 2 we tested the effects of social density on perceived personal space, as well as the effect of an indoor view, an outdoor view or no view available in the office. Hypotheses for Experiment 2 were:
H3: Participants would have the impression of more space in a single occupancy office compared to a shared office of any size, and perceived personal space will decrease with the increase in social density.
H4: Participants would feel they have more personal space in offices with an outdoor view, followed by an indoor view, and then no view.
In Experiment 3 we investigated the effect of a nature view, compared to an urban view, and no view. For Experiment 3 we formulated one hypothesis.
H5: Participants would perceive they have more personal space in offices with a nature view compared to an urban view or no view.
Twenty participants (seven males, 13 females) over the age of 18 (mean age = 27.3, range = 22–41) took part. Given the novelty of the virtual measures of personal space estimations, the sample size was chosen in accordance with experimental guidelines for virtual reality studies (Grantcharov et al., 2004). We then used the effect sizes from this first experiment for a power analysis to determine the sufficient sample sizes for the following experiments. Participants with normal hearing and normal or corrected vision were recruited at the University of Bath. Participants provided signed, informed consent before taking part in the study, approved by the University of Bath Psychology Research Ethics Committee. All three experiments were conducted within 3 months in 2018.
Experiment 1 had a repeated-measures design with two independent variables: spatial density (small, medium, and large) and noise level (noise or no noise), generating six conditions. The dependent variables were personal space estimation and satisfaction. The research took place in the Virtual Reality Lab (see Figure 1).
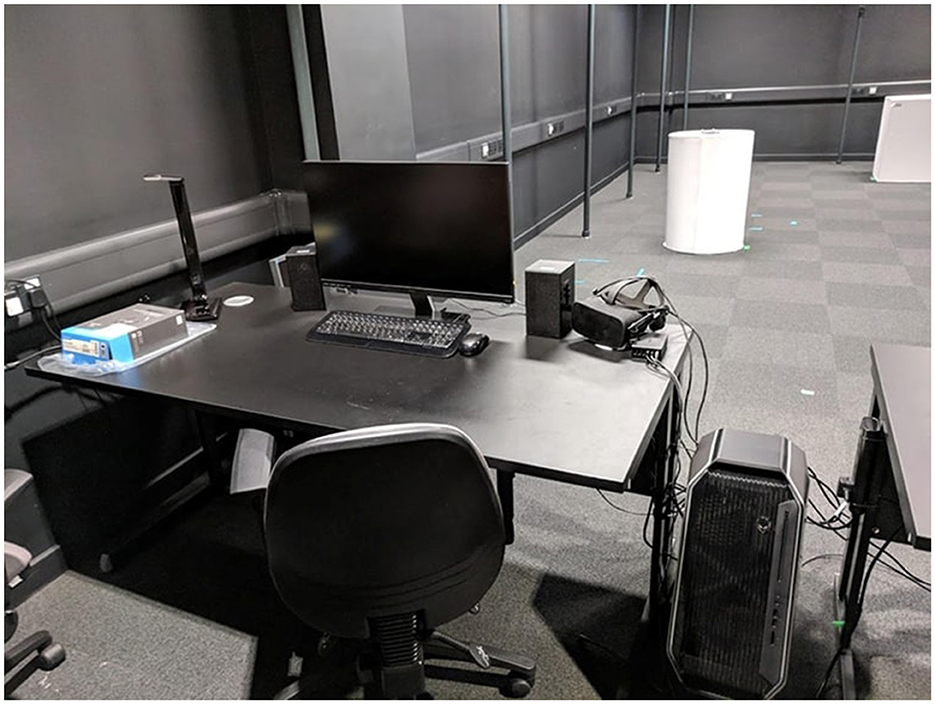
Figure 1. Image of the Virtual Reality Lab where the research took place.
A pre-experiment questionnaire gathered information about demographics. Every office environment was followed by a series of 19 items in six categories: “general satisfaction,” “subjective personal space satisfaction,” “work quality,” “social aspects,” “distractions,” and “immersiveness.” This paper aims to strictly address results from the second category, namely “subjective personal space satisfaction”, which refers to the subjective appreciation of the amount of personal space, as well as crowding. This section was covered by three items in the questionnaire: “I am satisfied with the amount of space I have for myself,” “I would not require more personal space than I currently have,” “I feel like my co-workers are not invading my personal space.” The questionnaire was administered within the VR head mounted device, to not break the sense of presence that participants could have formed in the offices, and to maintain the same distance and size estimations that are specific to VR space (Witmer and Kline, 1998; Kuliga et al., 2015). Participants used the Oculus Remote to answer questions on a continuous sliding scale from strongly agree to strongly disagree. For the measures of personal space satisfaction, the values for the three questions were averaged to generate one value for each increment in social density, which represents the satisfaction with personal space, varying from 0 to 100.
An Oculus Rift head-mounted display was used for displaying the VR environment. This headset has a maximum refresh rate of 90 Hz and uses OLED panels with a pixel density of 1,080 × 1,200 per eye. The headset ran on an Alienware Area 51 desktop computer, in Windows 10 and with an Intel Core i7, 3.4 GHz, 16 gigabytes of RAM, and a Nvidia 1,080 Ti with 11 gigabytes of GDDR5 memory graphics card. Unity 2017 Version 1.3 was used to create the virtual office environments, as well as the personal space measures, and coding was performed in the C# programming language.
We manipulated spatial density by changing office size while maintaining the same number of occupants in the office (see Table 1; Figures 2, 3). There were 16 occupants (15 avatars present plus the participant), and desks were positioned symmetrically so that all avatars would benefit from the same amount of space. The participant was not assigned a virtual body as this would have introduced new predictors in the design (see Jung and Hughes, 2016; Steed et al., 2016). In the Small office (see Figure 3A), each occupant was allotted six square meters of space for themselves, while in the Medium office they had eight (see Figure 3B) and in the Large office, 12 (see Figure 3C). Eight square meters per person is the British Council of Offices (BCO) recommendation (BCO, 2013), and thus it was chosen as the default. Thus, office sizes were 96 m2 for the Small office, 128 m2 for the Medium office, and 192 m2 for the Large office. This manipulation of size provided a controlled test of providing increasing square meters per person, yet maintaining a realistic distribution such that the center of the office still allowed for entry from the central doorway. The offices were kept simple in design to avoid having any incidental effects of other variables (e.g., additional furniture, plants, paintings, etc.) on the estimation of personal space and workplace satisfaction, and all other features, such as room height, were kept constant as well. In the noise condition, an environmental noise was added representative of a normal shared office (chatting, typing, printer, etc.), thus resulting in a total of six offices. The sound was played at 60 db which is the normal volume of a conversation.
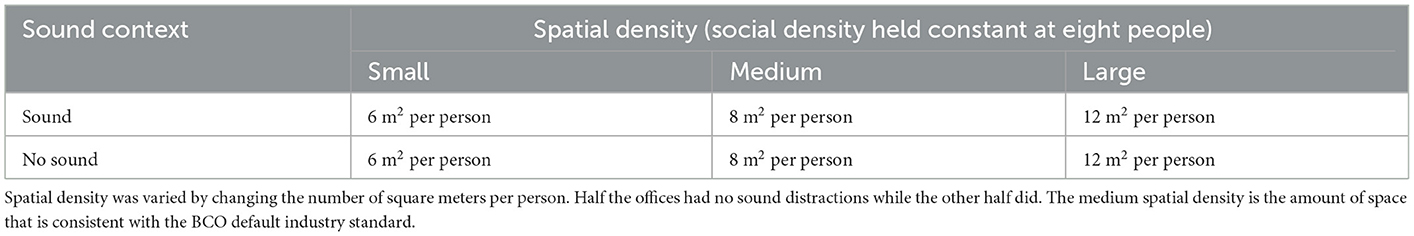
Table 1. The six offices used in Experiment 1.
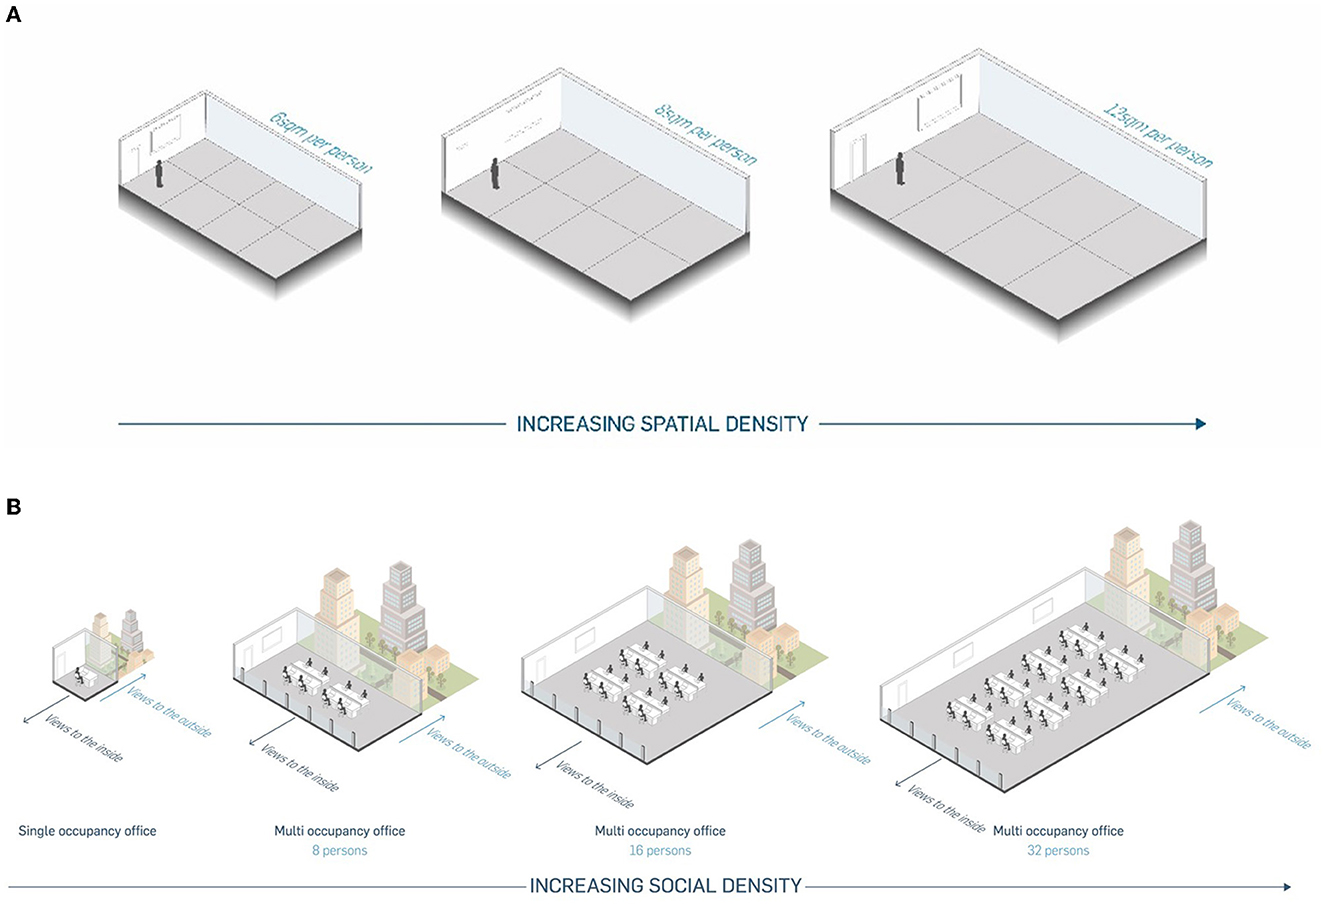
Figure 2. Illustration of the manipulations of (A) spatial density, and (B) social density as a function of the size of the office and the number of inhabitants within it.
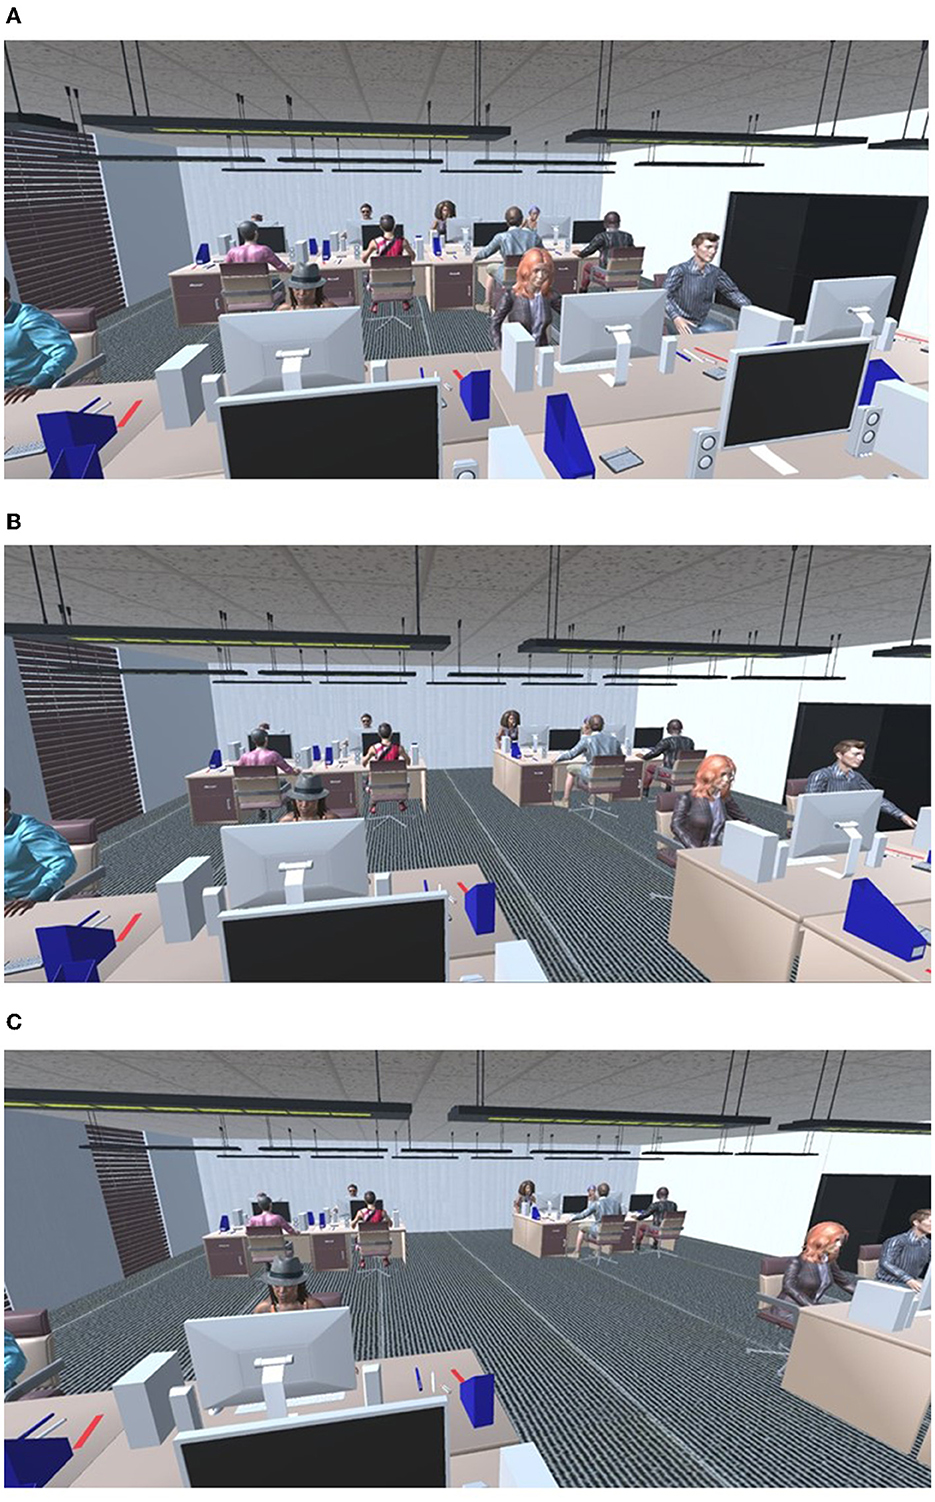
Figure 3. Example screen shots of the offices used in Experiment 1. (A) Participant perspective of the small office with 6 m2 per person. (B) Participant perspective of the Medium office with 8 m2 per person. (C) Participant perspective of the large office with 12 m2 per person.
The participants first filled out the information sheet and two consent forms. The pre-questionnaire was then completed by the participant. The experimenter then explained how the VR headset and remote control worked. The remote control was then placed on the participant's wrist and they were encouraged to become familiar with the buttons on the remote. Participants were asked to stand on a labeled point on the floor in line with the tracking camera before the headset was placed on their head and adjusted until the image was clear. Prior to experiencing the first office, participants were encouraged to become familiar with the head tracking in the Oculus menu. Participants then pressed the middle button on the Oculus Remote which triggered the offices.
All six offices were presented in a random order to each participant for 30 s each. This amount of time was chosen to provide participants with a chance to create an initial impression of each space. Such brief experiences provide an assessment that is not given too much time to become distracted by less relevant details and such impressions serve as an anchoring point for any subsequent evaluation (Harris and Garris, 2008), and could determine whether a potential candidate would consider working in such an environment at all (First Impressions Make or Break a Candidate's Decision, 2020).
Participants viewed the offices from a height of two meters, independent of their height. The height was chosen as two meters after a pilot study with 18 participants where they were placed in a Unity default infinite horizon, with a red disk, 50 cm in diameter below themselves. The primary functions of this pilot were to test the usability of this disk for indicating personal space and to establish what height participants should be placed at in the VE. They were prompted to indicate when they felt like they were standing on the red disk and the height of the camera was reduced or increased in increments of 5 cm accordingly. Most participants (16) indicated that they felt their height was represented correctly at two meters, while the other two at 210 and 215 cm, respectively, up from our chosen default of 175 cm, which is the overall UK mean height. This effect can be explained by the well-known phenomenon of distance compression in VR, whereby landmarks are viewed as closer in a VE compared to a real environment (Finnegan et al., 2016). Because the effects of distance compression vary from person to person, it was preferred to choose an informed standard height over the alternative of translating participants' real height in the VE. A default sitting position was not preferred as it would have impeded a correct size estimation of the office (due to occlusion by the other avatars) and appraisal of the indoor and outdoor views, which were central to the study. Still, prior to the VR experience, participants were prompted to also lean down to a sitting level in order to perceive the offices as if they were sitting. This was enabled by providing six degrees of freedom of movement in the VEs. Furthermore, in order to minimize any effects of a perceived different height to their own, participants were not represented by a virtual body in the offices. The Unity infinite horizon was chosen with only the red disk present so as to minimize the impact of other landmarks in the VE and this red disk was also used subsequently by participants to indicate their perceived personal space in the actual experiments.
After the 30 s spent in each office, the VE was replaced by the Unity default infinite horizon and participants were prompted to look down where they would see the red disk centered around them (initially presented at 50 cm in diameter). They then extended or retracted the disk via the Oculus Remote (pressing up or down) so as to report the amount of space they felt they had in the previously experienced office, with the radius as a measure to quantify estimated personal space. This was immediately followed by the personal space satisfaction questionnaire about their experience. No participants reported any motion sickness nor were there withdrawals from either of the three studies. Once the experiment was completed, the researcher removed the headset and remote from participant and asked the participant to complete the post-questionnaire and debriefed; the experiment lasted 30 min.
Personal space estimation was the radius of the disk in centimeters that the participants manipulated. Personal space satisfaction was the average of the values for the three questions (scaled from 0–100). Two separate 2 × 3 within-subjects ANOVAs were conducted to assess the effects of spatial density and noise presence on these measures of personal space. The results are presented primarily with modified box plots that represent the mean and provide the distribution of the data as well.
First, we assessed personal space estimation in terms of an interaction of spatial density as a function of noise presence. Mauchly's test for spatial density × noise presence indicated the assumption of sphericity had not been violated [ = 3.15, p = 0.21]. For personal space estimation, there was a significant interaction effect between spatial density and noise presence, F(2, 38) = 4.58, p = 0.016, ηp2 = 0.19 (see Figure 4).
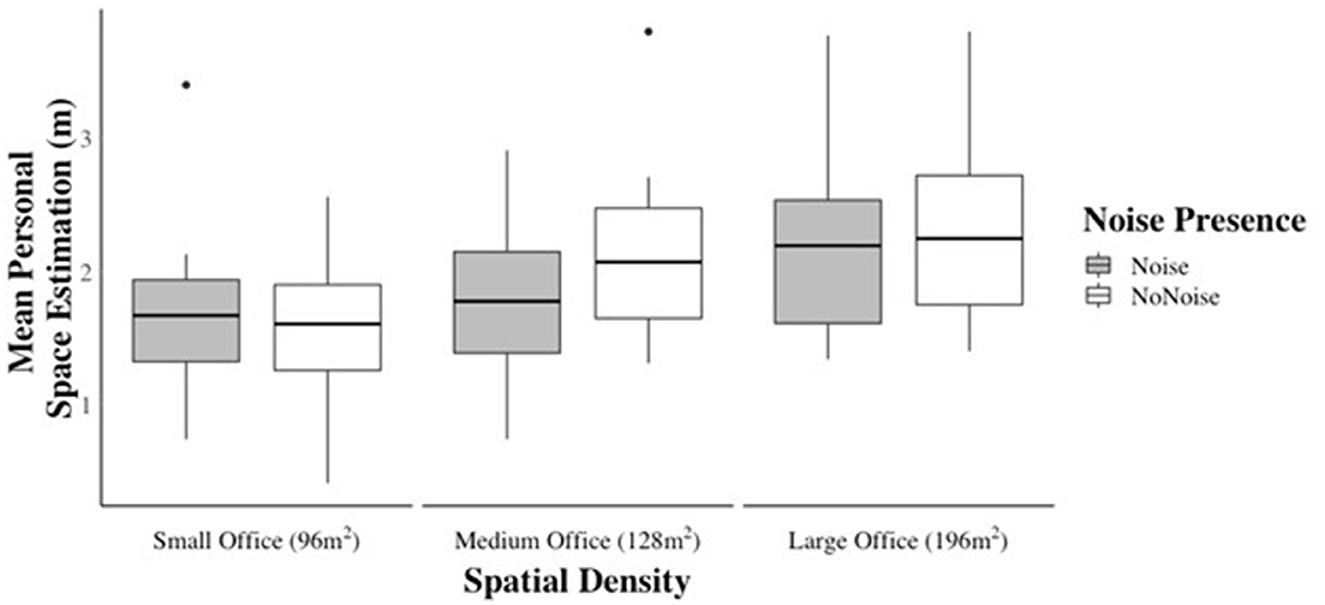
Figure 4. Boxplot showing mean values of personal space estimation for each office size in Experiment 1.
Next, we assessed personal space estimation in terms of spatial density as a main effect. Mauchly's test for spatial density indicated the assumption of sphericity had not been violated [ = 1.56, p = 0.459]. Spatial density was a significant main effect for personal space estimation, F(2, 38) = 24.18, p < 0.001, ηp2 = 0.56. Post-hoc Bonferroni-corrected comparisons demonstrated a significant mean difference for personal space estimation between the small and medium size offices of 0.29 m (meters; 95% CI = 0.07, 0.50, p = 0.007), between the small and large office sizes of 0.58 m (95% CI = 0.33, 0.83, p < 0.001), and between the medium office size and large office size 0.30 m (95% CI = 0.10, 0.49, p = 0.002).
Finally, we also assessed personal space estimation in terms of noise presence as a main effect. Mauchly's test for noise presence was not required as two levels were present (i.e., noise and no noise). Noise presence was not a significant main effect for personal space estimation, F(1, 19) = 3.05 p = 0.097, ηp2 = 0.14. Pairwise comparisons did not highlight any significant mean differences of personal space estimation between noise and no noise conditions.
In terms of personal space satisfaction, we first assessed the interaction of spatial density as a function of noise presence. Mauchly's test for spatial density × noise presence indicated that the assumption of sphericity had not been violated [ = 1.91, p = 0.385]. No significant interaction effect for personal space satisfaction was found between spatial density and noise presence, F(2, 38) = 1.76, p = 0.185, ηp2 = 0.085 (see Figure 5).
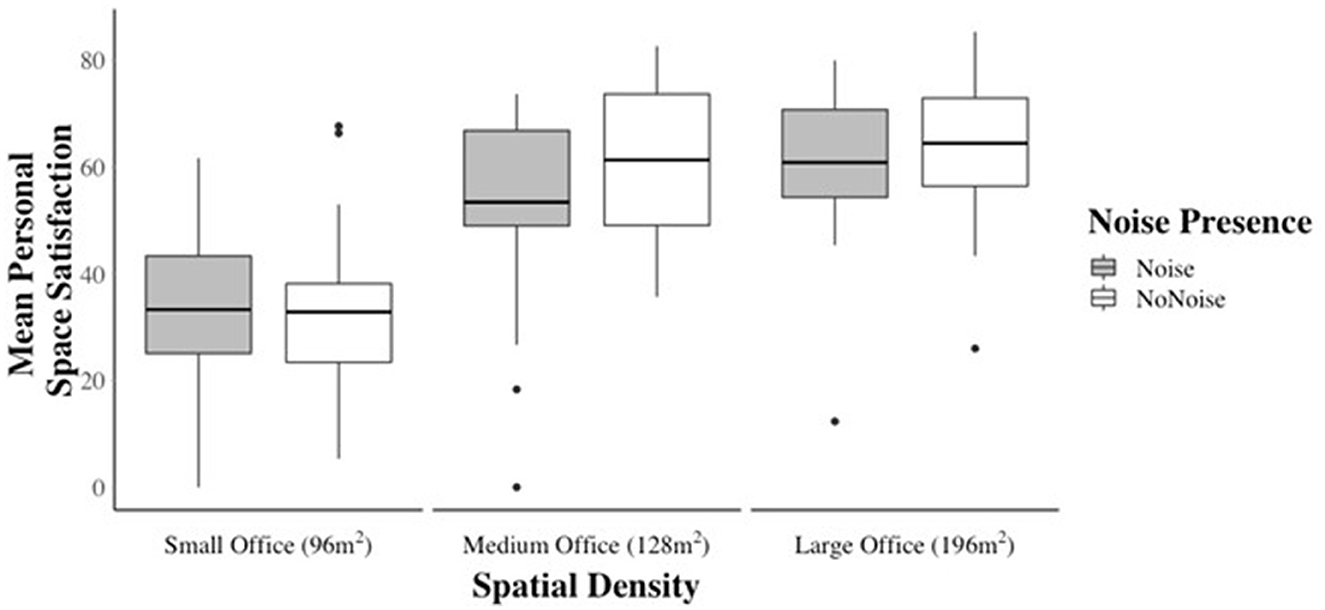
Figure 5. Boxplot showing mean values of personal space satisfaction for each office size in Experiment 1.
Next we assessed personal space satisfaction in terms of spatial density as a main effect. Mauchly's test for spatial density indicated the assumption of sphericity had not been violated [ = 3.72, p = 0.156]. Spatial density was a significant main effect for personal space satisfaction, F(2, 38) = 103.96, p < 0.001, ηp2 = 0.85. Post-hoc Bonferroni-corrected comparisons indicated significant mean difference for personal space satisfaction between the small and medium office sizes of 24.30 points (95% CI = 19.73, 28.87, p < 0.001) and between the small and large size offices of 29.58 points (95% CI = 22.84, 36.33, p < 0.001). No significant differences in personal space satisfaction were found between the medium and the large office sizes.
Finally, we assessed personal space satisfaction as a function of noise presence as a main effect. Mauchly's test for noise level was not required as only two levels were present (i.e., noise and no noise). Noise presence was not a significant main effect for personal space satisfaction, F(1, 19) = 3.15 p = 0.092, ηp2 = 0.142. Pairwise comparisons revealed no significant difference between the mean scores of personal space satisfaction in the noise and no noise conditions.
Results from Experiment 1 suggested that personal space estimations were sensitive to all alterations in spatial density. There were significant differences between all three office sizes, but there was no difference in personal space estimations between the offices with noise and those with no noise. For personal space satisfaction we found significant differences in personal space between the small office size compared to both the medium and large office sizes. We found no difference though between the medium office size and the large office size. As there was not an effect of noise in Experiment 1, we did not include this variable in the following experiments to focus the statistical power on other variables of interest. Noise levels were thus kept constant throughout the office variants presented in Experiment 2.
Experiment 2 investigated personal space as a function of social density, holding spatial density constant, and having an indoor, outdoor, or no view from the office; it also included a single occupancy office.
The first effect size reported for the personal space estimation was large, with the ηp2 = 0.19 and the subsequent analyses had some even larger effect sizes (e.g., ηp2 = 0.56). We converted the effect size to Cohen's f (0.48) and found that a repeated measures 3 × 4 ANOVA would require a sample of 12 participants to achieve a power of 0.95, but preferred to maintain the same number of participants for the other experiments. A total of 20 participants (11 males, nine females) over the age of 18 (mean age = 29.1, range = 18–45) took part. There was no overlap of participants between the three experiments. This was done so as to not expose some participants more frequently to the offices, compared to others.
We adopted a repeated measures design with two independent variables: social density, which was varied through the number of people present in the office (single occupancy, small office with six occupants, medium with 16 occupants, and large with 32 occupants) and view type (internal view, city views, and no view), generating 12 conditions. The dependent variables were the measures personal space estimation and satisfaction.
The questionnaires, apparatus, and computer software were as in Experiment 1.
Experiment 2 consisted of 12 different VR offices in four different sizes (single with no other occupants aside from the participant, small with six avatars, medium with 16 avatars and large with 32 avatars; see Table 2). Spatial density was held constant (eight square meters per person). Thus, office sizes varied as single (8 m2), small (48 m2), medium (128 m2), and large (256 m2). For each office-size, three conditions were created: no view, nature view, and city view (see Figures 6A–C). All offices in all conditions had the office audio stimuli to induce a sense of presence. The order of offices that were presented to each participant was randomized and were shown for 30 s each.
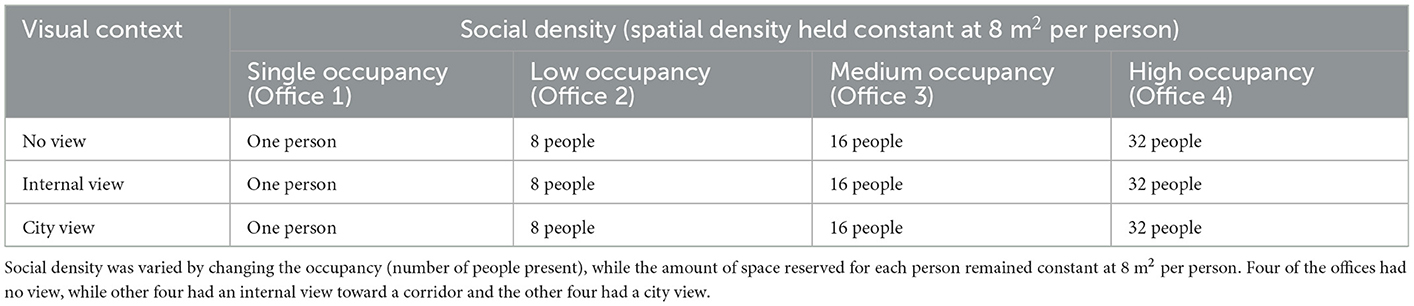
Table 2. The 12 offices used in Experiment 2.
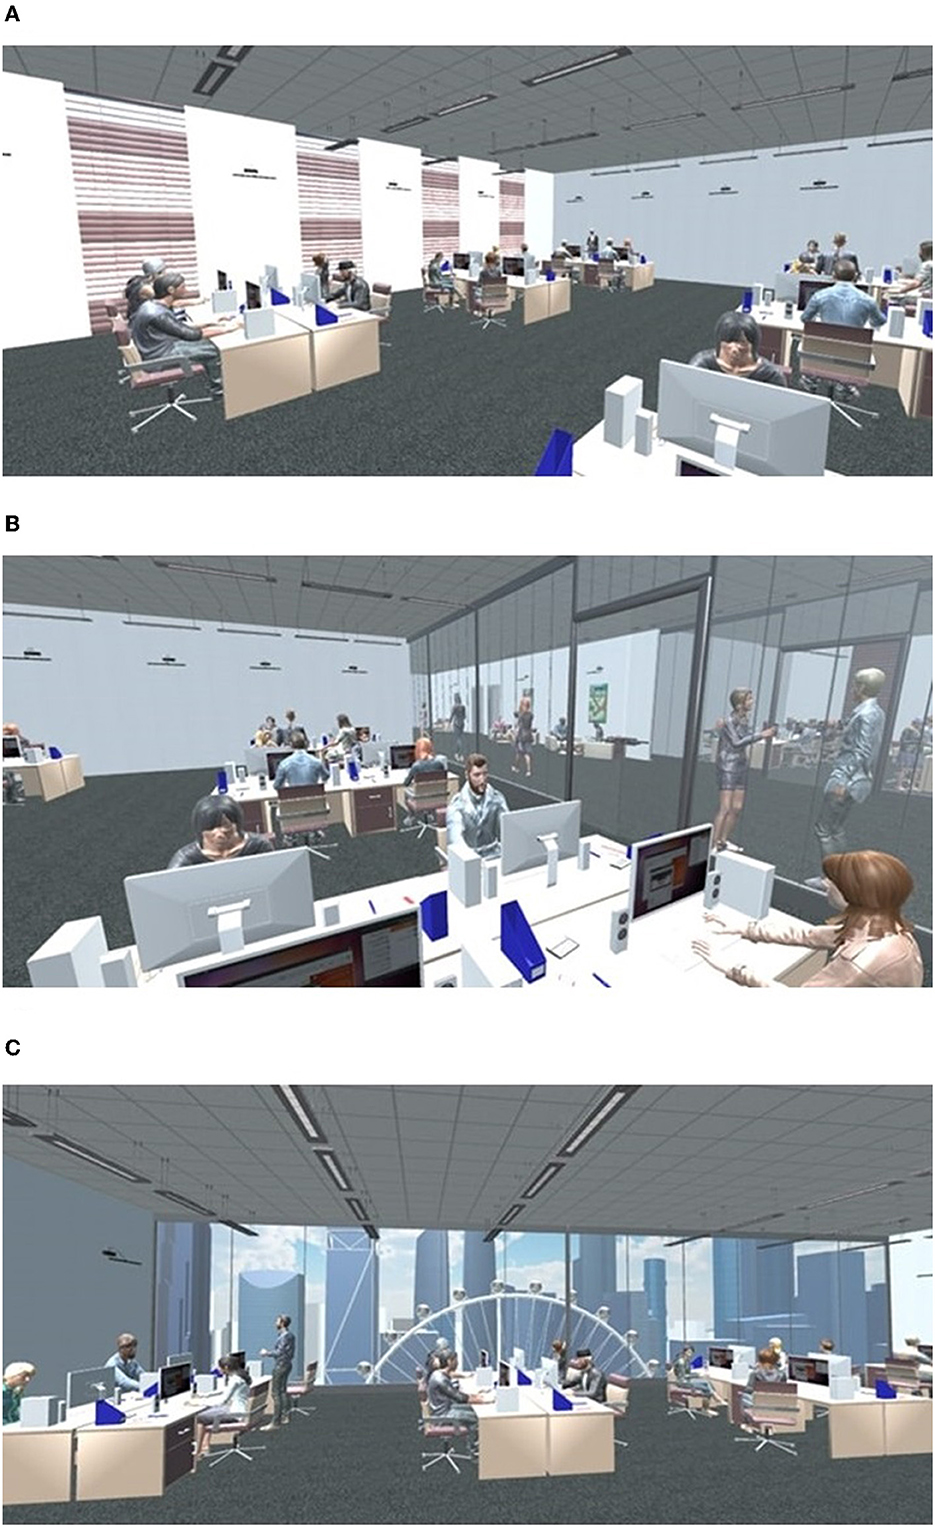
Figure 6. Example screen shots of the offices used in Experiment 2. (A) Participant perspective of Office 4 with no view. (B) Participant perspective of Office 4 with internal view. (C) Participant perspective of Office 4 with city view. Images (A–C) are all captured from the location of the participant in the VE. The different viewpoints were chosen so as to give an accurate impression of where the views were located relative to other walls.
The procedure was identical to Experiment 1, the only difference being that in Experiment 2, 12 offices were experienced as opposed to six. The entire experiment lasted ~45 min.
Two separate 3 × 4 within-subjects ANOVAs were conducted to assess the effects of social density and view type on personal space estimation and satisfaction.
Mauchly's test for office size x view type indicated the assumption of sphericity had been violated [ = 81.13, p < 0.001, ε = 0.460]. Therefore, the degrees of freedom were corrected using Greenhouse-Geisser estimates of sphericity. For personal space estimation, there was no significant interaction effect between social density and view type, F(2.76, 52.39) = 0.846, p = 0.467, ηp2 = 0.043 (see Figure 7).
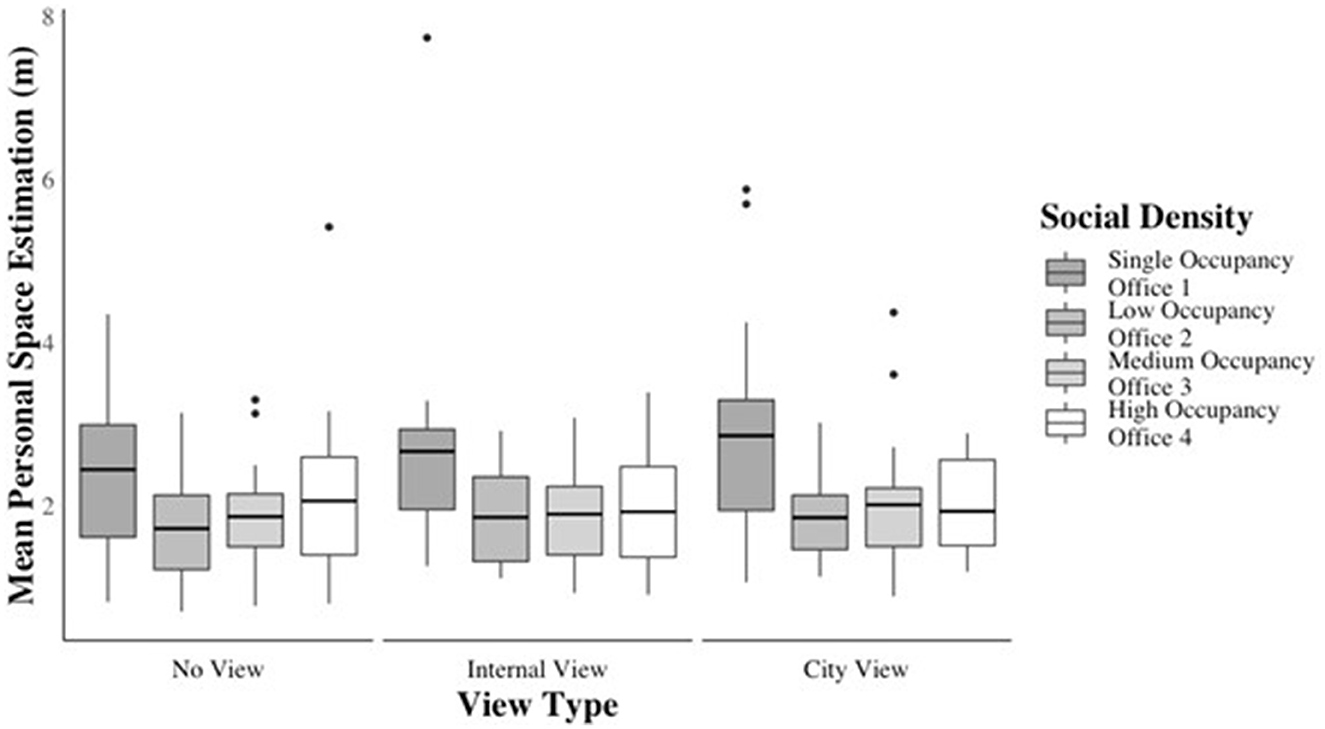
Figure 7. Boxplot showing mean values of personal space estimation for each office size in Experiment 2.
Mauchly's test for social density indicated that the assumption of sphericity had been violated [ = 34.26, p < 0.001, ε = 0.509]. As such, the degrees of freedom are corrected with the Greenhouse-Geisser estimates. Social density was a statistically significant main effect for personal space estimation, F(1.53, 30) = 13.03, p < 0.001, ηp2 = 0.41. Post-hoc Bonferroni-corrected comparisons revealed a significant mean difference for personal space estimation between Office 1 and Office 2 of 0.85 m (95% CI = 0.27, 1.42, p = 0.002), between Office 1 and Office 3 of 0.73 m (95% CI = 0.19, 1.28, p = 0.005), and between Office 1 and Office 4 of 0.69 m (95% CI = 0.09, 0.1.28, p = 0.019). No statistically significant difference was found between Office 2 and Office 3, or between Office 3 and Office 4.
Mauchly's test for office highlighted that the assumption of sphericity has been violated [ = 7.39, p = 0.025, ε = 0.80]. The degrees of freedom were corrected using Huynh-Feldt estimates of sphericity. Type of view was not a statistically significant main effect for personal space estimation, F(1.60, 30.31) = 1.28, p = 0.287, ηp2 = 0.063. Post-hoc Bonferroni-corrected comparisons did not show a significant mean difference for personal space estimation between No View and Internal View, No View and City View, and Internal View and City View.
Mauchly's test for social density × view type indicated that the assumption of sphericity had not been violated [ = 23.80, p = 0.256]. For personal space satisfaction, there was no significant interaction effect between social density and view type, F(6, 114) = 0.730, p = 0.626, ηp2 = 0.037 (see Figure 8).
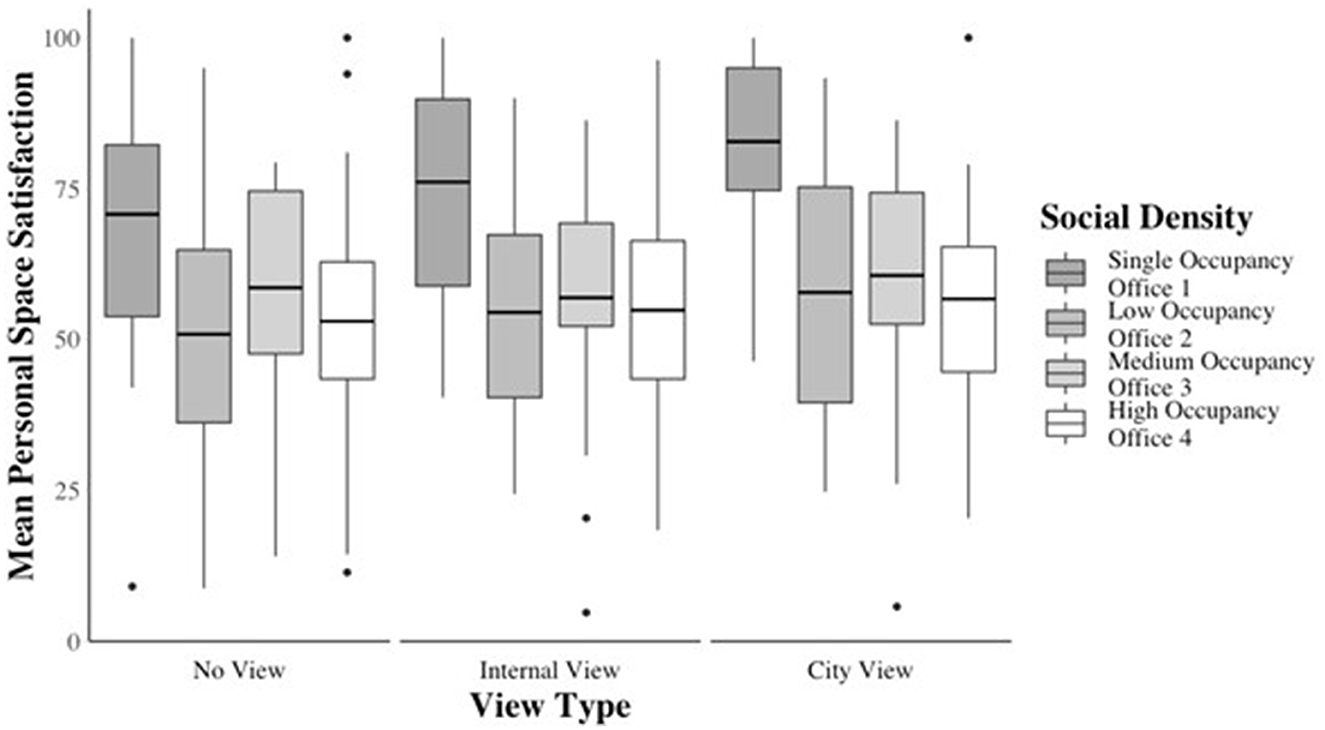
Figure 8. Boxplot showing mean values of personal space satisfaction for each office size in Experiment 2.
Mauchly's test for social density indicated that the assumption of sphericity had been violated [ = 25.41, p < 0.001, ε = 0.58]. Therefore, the degrees of freedom were corrected using Greenhouse-Geisser estimates of sphericity. Social density was not a significant main effect for personal space satisfaction, F(1.74, 33.01) = 3.46, p = 0.053, ηp2 = 0.15. However, post-hoc Bonferroni-corrected comparisons demonstrated a significant mean difference for personal space satisfaction between Office 1 and Office 2 of 22.18 (95% CI = 5.14, 39.21, p = 0.007), between Office 1 and Office 3 of 17.86 (95% CI = 0.95, 34.77, p = 0.035), and between Office 1 and Office 4 of 21.71 (95% CI = 4.88, 38.54, p = 0.007). No significant difference was found between Office 2 and Office 3, between Office 2 and Office 4, and between Office 3 and Office 4.
Mauchly's test for view type did not reveal that the assumption of sphericity had been violated [ = 4.68, p = 0.096]. View type was a significant main effect for personal space, satisfaction, F(2, 38) = 3.46, p = 0.042, ηp2 = 0.037. However, post-hoc Bonferroni-corrected comparisons did not show a significant mean difference for personal space satisfaction between No View and Internal View, No View and City View, and Internal View and City View.
The single occupancy office was perceived as providing more personal space than any of the other three offices even though the amount of space allotted to the participant was the same (spatial density was held constant). However, the other three offices were not different amongst themselves. No difference in personal space estimation were found between the three view types. For personal space satisfaction we found the results replicated and converged with the estimations, and again no effect of view type was found.
We were surprised that there was no impact of view type in the prior experiment so here, instead of having an indoor view as in Experiment 2, we assessed whether audiovisual nature specific cues have a positive impact on with personal space perception by comparing an outdoor nature view to an urban view and no view.
A total of 20 participants (five males, 15 females) over the age of 18 (mean age = 21.45, range = 18–32) were recruited among undergraduate students at Bath Spa University, with additional approval by the Bath Spa University Psychology Research Ethics Committee.
Experiment 3 adopted a repeated measures design with two independent variables: social density (one person, six, 16 and 32) and view type (no view, city, and nature view), generating 12 conditions. The dependent variables were personal space estimation and satisfaction.
The questionnaires, apparatus, and computer software were as in Experiments 1 and 2.
Twelve different VR offices in four different sizes were presented, according to the number of occupants and identical to those in Experiment 2 (see Table 3). The only differences between Experiment 2 and Experiment 3 were that in Experiment 3 the indoor view offices were replaced by outdoor view offices with a nature view and that in Experiment 3 the nature view benefited from a different environmental noise compared to the city view and no view. The nature view consisted of a green forest with motion effects simulating wind blowing through the trees (see Figure 9 for a static example). Offices with a nature view had audio stimuli of birds and wind combined with standard office noise, while the city view conditions had traffic noise combined with standard office noise, obtained from Archangeli (2010). The no view conditions only had office noise audio stimuli, which was the same used in Experiment 2 for all the offices. The order of offices was randomized as in Experiments 1 and 2, and offices were experienced for 30 s each. The position of the participant in the office was slightly shifted in Experiment 3 so as to position them closer to the window. We did this to decrease the distance between the participant and the window (in cases where this was present), as this has been shown to be a factor impacting satisfaction (Aries et al., 2015). The size of the offices and of the windows, as well as arrangement of the windows remained the same as in Experiment 2.
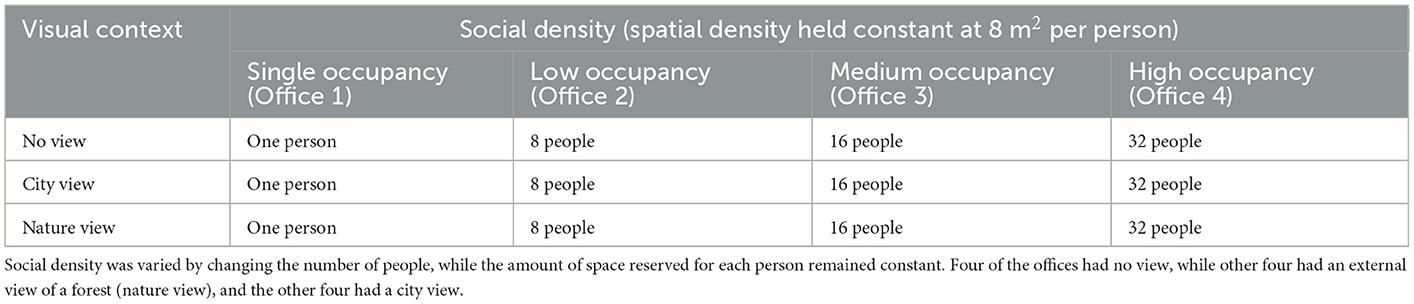
Table 3. The 12 offices used in Experiment 3.
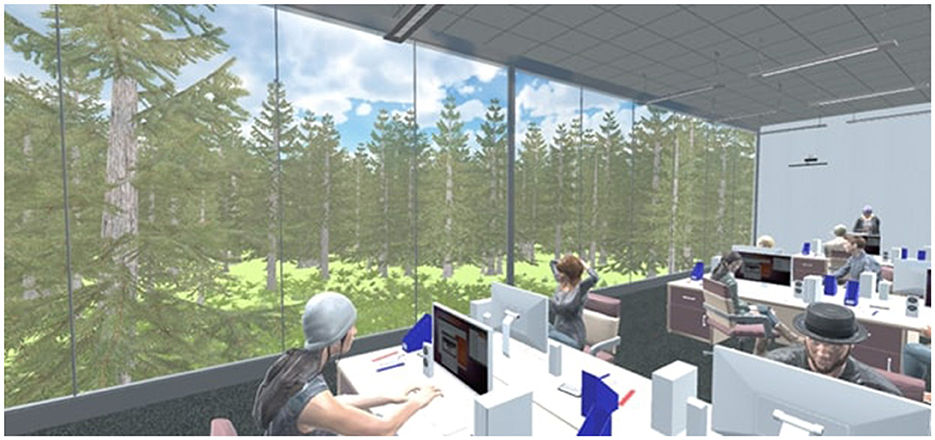
Figure 9. Example screen shot of the participant view from Office 4 with a nature view in Experiment 3.
The procedure was identical to Experiment 2.
Two separate 3 × 4 within-subjects ANOVAs were conducted to assess the effects of social density and type of view on personal space estimation and satisfaction.
A 3 × 4 within-subjects ANOVA was conducted to assess the effect of social density and view type on personal space estimation.
Mauchly's test for social density × view indicated that sphericity had been violated [ = 43.50, p = 0.002, ε = 0.57]. The degrees of freedom were corrected using Greenhouse-Geisser estimates of sphericity. For personal space estimation, there was no statistically significant interaction effect between social density and view F(3.42, 65.07) = 0.783, p = 0.523, ηp2 = 0.04 (see Figure 10).
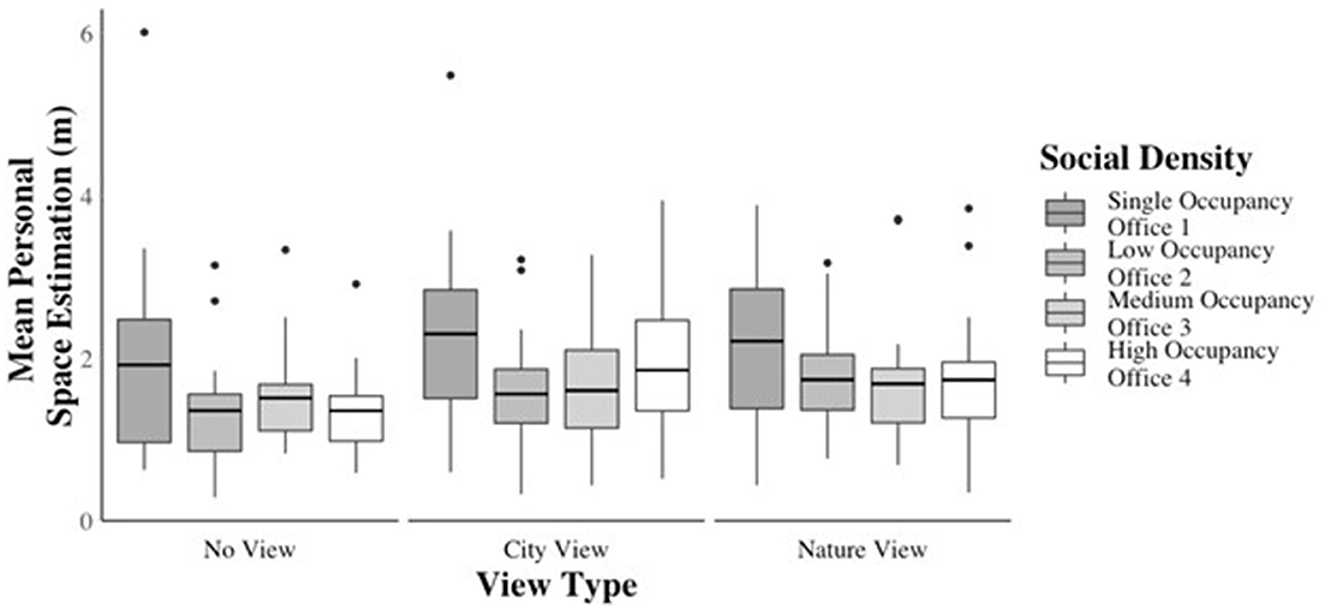
Figure 10. Boxplot showing mean values of personal space estimation for each office size in Experiment 3.
Mauchly's test for social density, [ = 16.16, p = 0.006, ε = 0.63] indicated a violation of sphericity. Therefore, the degrees of freedom were corrected using Greenhouse-Geisser estimates of sphericity. Social density was a significant main effect for personal space estimation, F(1.88, 35.66) = 10.16 p < 0.001, ηp2 = 0.35. Post-hoc Bonferroni-corrected comparisons show a significant mean difference for personal space estimation between Office 1 and Office 2 of 0.59 m (95% CI = 0.19,0.99, p = 0.002), and between Office 1 and Office 3 of 0.54 m (95% CI = 0.15,0.94, p = 0.004). No significant difference was found between Office 2 and Office 3. There were no significant differences between all other pairwise comparisons.
Mauchly's test for view indicated the assumption of sphericity had not been violated [ = 4.90, p = 0.086]. View type was a significant main effect for personal space estimation, F(2, 38) = 9.14, p = 0.001, ηp2 = 0.33. Post-hoc Bonferroni-corrected comparisons show a significant difference between the mean scores for personal space estimation between no view and nature view of 0.31 m (95% CI = −0.553, −0.016, p = 0.01) and a significant difference between no view and city view of 0.3 m (95% CI = −0.52, −0.07, p = 0.01). No significant difference was found between nature view and city view.
A 3 × 4 within-subjects ANOVA was conducted to assess the effects of social density and view type on personal space satisfaction (Table 3).
Mauchly's test for social density x view indicated that there was a violation of sphericity [ = 32.60, p = 0.039, ε = 0.93]. The degrees of freedom were corrected using Huynh-Feldt estimates of sphericity. For personal space satisfaction, there was no statistically significant interaction effect between social density and view type F(5.57, 105.80) = 0.780, p = 0.579, ηp2 = 0.04 (see Figure 11).
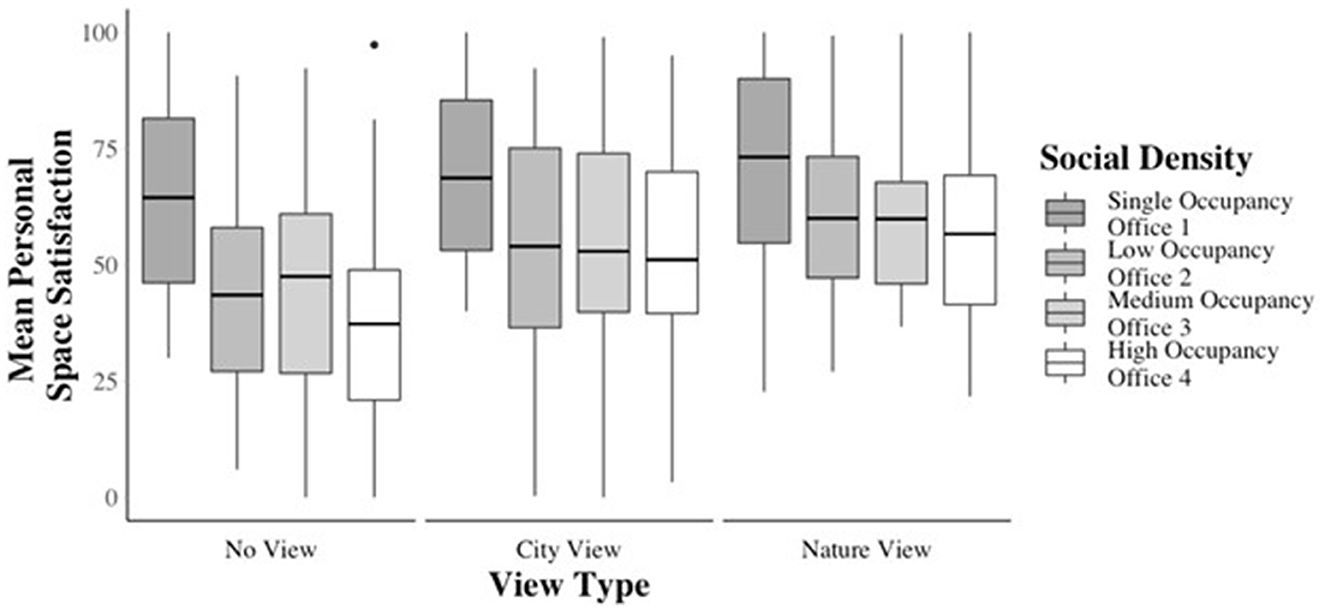
Figure 11. Boxplot showing mean values of personal space satisfaction for each office size in Experiment 3.
Mauchly's test for social density indicated that the assumption of sphericity had been violated [χ2(5) = 12.76, p = 0.026, ε = 0.66]. The degrees of freedom were corrected using Greenhouse-Geisser estimates of sphericity. Social density was a significant main effect for personal space satisfaction, F(1.99, 37.72) = 11.22, p < 0.001, ηp2 = 0.37. Post-hoc Bonferroni-corrected comparisons show significant differences between the mean scores for personal space satisfaction between Office 1 and Office 2 of 16.26 (95% CI = 3.73, 28.8, p = 0.007), Office 1 and Office 3 of 15.32 (95% CI = 1.63, 29, p = 0.02), and Office 1 and Office 4 of 20.41 (95% CI = 6.11, 34.72, p = 0.003). No significant differences were found between all other pairwise comparisons.
Mauchly's test for social density x view indicated the assumption of sphericity had not been violated [ = 2.83, p = 0.24]. View type was a significant effect for personal space satisfaction F(2, 38) = 9.70, p < 0.001, ηp2 = 0.34. Post-hoc Bonferroni-corrected comparisons show a significant difference between the mean scores for personal space satisfaction between No View and Nature View of 14.22 (95% CI = 4.37, 24.08, p = 0.004). No significant differences were found between No View and City View or between Nature View and City View.
For personal space estimation we found significant differences between the single occupancy office and Offices 2 and 3. Unlike Experiment 2, there was no difference between the single size office and the office with the highest social density. Also, unlike Experiment 2 where view type did not have an effect, here the Nature views yielded higher personal space estimation satisfaction than No View offices and also City View offices showed a similar difference to No View offices. However, no difference was found between offices with a nature view and those with a city view.
For personal space satisfaction we found that the single occupancy office and Offices 2, 3, and 4, which replicated the results from Experiment 2. Like for personal space estimation, we found that Nature View offices scored higher than No View offices and that there was no significant difference between Nature and City View offices. However, in contrast to the personal space estimation findings, no difference was found in personal space satisfaction between the City View offices and No View offices.
The results from Experiment 1 partially validated the first hypothesis which predicted that participants would feel they have more personal space in a more sparsely populated office, as demonstrated by personal space estimation. For personal space satisfaction, we did find a difference between the Small and Medium spatial density, as well as the Small and Large, but not between Medium and Large; hence the first hypothesis was only partially supported. The second hypothesis which stated that participants will feel they have less personal space in noisy offices was rejected since there was no difference between the Noise and No Noise conditions. Future work could assess directed noise, with an avatar that would specifically engage in a conversation with them, which seems to be the actual culprit for noise-related stress (Croon et al., 2005), along with a loss of privacy (Kim and de Dear, 2013) or crowding (Croon et al., 2005). General concerns about noise has prompted companies to mediate the amount of interaction at the workplace, even though it has some benefits (Danielsson et al., 2014).
The third hypothesis was tested in both Experiments 2 and 3 with a private office vs. open plan offices. Results from Experiment 2 were in accordance with this hypothesis given that the single occupancy office scored higher on both measures of personal space, compared to all shared offices. However, we also expected that personal space scores would decrease with a further increase in social density, which did not occur. Experiment 3 showed a significant difference in personal space estimation between the single occupancy office and Offices 2 and 3, but not 4, which is unexpected and different to Experiment 2. The only other study which controlled for spatial density when manipulating social density was that of Block and Stokes (1989), which found that a single occupancy office offered higher satisfaction than a shared office. Experiment 2 not only validated their results, but also extended observations to offices with higher social density, as they had only tested offices that were single occupancy or shared among four occupants, and did not specify the amount of space allotted per person.
The type of view did not yield any significant effect on either personal space estimation or satisfaction in Experiment 2. At first glance this appears to contrast with a large body of literature that found closeness to windows increases satisfaction (e.g., Fisk et al., 1993; Küller and Wetterberg, 1996; Chang and Chen, 2005; Aries et al., 2015). The distance of the participant to the window may have impacted the impact of the view; this hypothesis is supported by the fact that when the participant was sat closer to the window in Experiment 3 we did observe differences. Additionally, in Experiment 3 traffic noise was added in the urban view offices, which may have further amplified the effect of proximity to the window. Future work examining the distance to a window, and whether others are in that space, would be of great value (Boubekri et al., 2016).
The fourth hypothesis was rejected because the Outdoor View offices did not yield higher personal space scores compared to Internal View offices. However, the fifth hypothesis which stated that participants would prefer a Nature View over a City View and No View was partially accepted. For personal space estimation, we indeed found that offices with a Nature View gave the impression of more personal space compared to No View, but the same effect was observed for city view offices. As there was no difference between city and nature view offices, the nature view did not influence personal space estimation. For personal space satisfaction, we found a similar result in that Nature View scored higher than No View offices, but there was no difference between City View and No View, or Nature and City View offices (accompanied by matching sounds). Nature View was thus the only one which yielded higher personal space satisfaction scores than No View. These findings adds new insights to previous findings in the biophilia literature (Kaplan, 1993; Tennessen and Cimprich, 1995; Hartig et al., 2003; Stigsdotter and Grahn, 2004; Chang and Chen, 2005; Berman et al., 2008; Aries et al., 2015), in that preferences for natural scenes and associated effects vary greatly depending on proximity to such elements and inclusion in one's personal space. For both personal space estimation and satisfaction, there was no difference between the City and Nature View offices, which seems inconsistent with reports showing that Nature View offices yield more positive responses than Urban View ones (Kaplan, 1993; Chang and Chen, 2005). However, results of Kaplan (1993) come from a user study with extended periods of occupancy, and therefore the difference between views might arise from long-term effects such as quality of sleep and psychological discomfort (Aries et al., 2015). The experiment by Chang and Chen (2005) did present short exposure times but this was facilitated via 2D slides and not an immersive technology such as VR. This could mean that participants in our study were able to better perceive the real benefits or lack of a nature view, rather than potentially assessing offices purely based on visual cues like existence of plants. Nonetheless, it is important to acknowledge that short exposure times, while allowing comparison of multiple offices, which was the main aim of the study, does not inform on the longer-term effects of working in each office. Further studies could employ representative office tasks in several types of offices to investigate such aspects as productivity or creativity.
Additionally, future work could examine several limitations and other interesting variables that might impact personal space estimation in addition to those that were of particular psychological interest here (cf. Hong et al., 2017). These range from addressing other multisensory cues, such as olfaction arising from others in the space, whether body odor or that of the food or drinks that they take to their desks. These experiments did not assess participants as a function of their experience of shared office spaces, yet we do have ongoing work assessing this more generally outside of the VR domain. Not all our participants were office workers as Experiments 1 and 2 had some undergraduate participants and Experiment 3 used undergraduate students exclusively. This is a limitation of the study as responses may have been biased to some extent by the working environment of each participant. However, the three experiments did not aim to compare the virtual offices with the real working environment of the participants, but rather to compare different virtual offices. Lastly, the ability to generalize these results is limited by culture, but we also have started work in this domain and remain open to providing our materials to others who would be interested in testing other cultures (Richardson et al., 2020).
Overall our findings suggest that the VR offices were able to create a measurable and realistic of personal space, in that the estimations provided mapped on well to the amount of space provided to them, such as in the private offices (Heydarian and Becerik-Gerber, 2017). There can be differences in terms of size estimation, with one study reporting that some components of the model (walls, corridors etc.) were shrunk and felt too narrow in VR (Kuliga et al., 2015). This effect of underestimating distance in VR is not a new issue (e.g., Witmer and Kline, 1998; Finnegan et al., 2016). However, such issues can be moderated by employing more sophisticated lighting models benefiting from ambient occlusion, shadows, and variable light sources, as they have the potential to increase depth perception (Witmer and Kline, 1998; Kuliga et al., 2015). Here we found that the VR environments, while not fully realistic, did afford the intended differences in size of personal space that were reflected in the measure of personal space estimation.
In conclusion, the present study offers valuable novel insights into aspects of spatial and social density, noise levels, and type of view in the workspace. First, increasing the size of personal space available to an individual is perceived as beneficial, but this effect levels off after a point. We have shown that a change from an individual office to a shared one does decrease perceived personal space, independent of the type of view, and spatial or social density. Second, the type of view offered is less important once one benefits from a view, either inside or outside. A secondary contribution is that our study serves as a proof our conceptual approach of using immersive VR to simulate office spaces. The design was found to be robust enough to yield consistent findings across multiple experiments and yet sensitive to slight changes, such as the positioning of the participant within the office.
The raw data supporting the conclusions of this article will be made available by the authors, without undue reservation.
The studies involving human participants were reviewed and approved by University of Bath Psychology Ethics Committee. The patients/participants provided their written informed consent to participate in this study.
CJ contributed to the design, data collection, and write-up of the manuscript. GT and TL-E contributed to the design and data analysis. CG contributed to data collection. RH and CP contributed to the experimental design. MP and AS contributed to the design, data analysis, and write-up of the manuscript. All authors contributed to the article and approved the submitted version.
This research was supported by funding support from Atkins Global to the University of Bath (MP) and Bath Spa University (AS).
We would like to thank Julian Wan for his help with testing participants.
RH and CP were employed by Atkins Global.
The remaining authors declare that the research was conducted in the absence of any commercial or financial relationships that could be construed as a potential conflict of interest.
All claims expressed in this article are solely those of the authors and do not necessarily represent those of their affiliated organizations, or those of the publisher, the editors and the reviewers. Any product that may be evaluated in this article, or claim that may be made by its manufacturer, is not guaranteed or endorsed by the publisher.
Al Horr, Y., Arif, M., Kaushik, A., Mazroei, A., Katafygiotou, M., and Elsarrag, E. (2016). Occupant productivity and office indoor environment quality: a review of the literature. Build. Environ. 105, 369–389. doi: 10.1016/j.buildenv.2016.06.001
Archangeli, D. (2010). Office Ambience. Freesound.org. Available online at: https://freesound.org/people/DiArchangeli/sounds/108695/ (accessed November 8, 2018).
Aries, M., Aarts, M., and van Hoof, J. (2015). Daylight and health: a review of the evidence and consequences for the built environment. Light. Res. Technol. 47, 6–27. doi: 10.1177/1477153513509258
BCO. (2013). Occupier Density Study 2013. British Council For Offices. Available online at: https://www.bco.org.uk/Research/Publications/Occupier-Density-Study-2013.aspx (accessed October 3, 2018).
Berman, M. G., Jonides, J., and Kaplan, S. (2008). The cognitive benefits of interacting with nature. Psychol. Sci. 19, 1207–1212. doi: 10.1111/j.1467-9280.2008.02225.x
Block, L. K., and Stokes, G. S. (1989). Performance and satisfaction in private versus nonprivate work settings. Environ. Behav. 21, 277–297. doi: 10.1177/0013916589213003
Boubekri, M., Hull, R. B., and Boyer, L. L. (2016). Impact of window size and sunlight penetration on office workers' mood and satisfaction: a novel way of assessing sunlight. Environ. Behav. doi: 10.1177/0013916591234004
Chang, C.-Y., and Chen, P.-K. (2005). Human response to window views and indoor plants in the workplace. HortScience 40, 1354–1359. doi: 10.21273/HORTSCI.40.5.1354
Chapman, J., Jones, D., and Gray, F. (2015). “Perceptions of change in office space design: redesigning Barwon Water's office environment,” in Living and learning: research for a better built environment, 49th International Conference of the Architectural Science Association proceedings (Melbourne, VIC: The University of Melbourne).
Charles, K. E., and Veitch, J. A. (2002). Environmental Satisfaction in Open-Plan Environments: 2. Effects of Workstation Size, Partition Height and Windows. Institute for Reserch in Construction. National Reserch Council Canadá. Internal Report No. IRC-IR-845. Available online at: https://nparc.nrc-cnrc.gc.ca/eng/view/fulltext.
Chauvel, P., Collins, J. B., Dogniaux, R., and Longmore, J. (1982). Glare from windows: current views of the problem. Light. Res. Technol. 14, 31–46. doi: 10.1177/096032718201400103
Croon, E. D., Sluiter, J., Kuijer, P. P., and Frings-Dresen, M. (2005). The effect of office concepts on worker health and performance: a systematic review of the literature. Ergonomics 48, 119–134. doi: 10.1080/00140130512331319409
Danielsson, C. B., Chungkham, H. S., Wulff, C., and Westerlund, H. (2014). Office design's impact on sick leave rates. Ergonomics 57, 139–147. doi: 10.1080/00140139.2013.871064
Dean, L. M., Pugh, W. M., and Gunderson, E. K. E. (1975). Spatial and perceptual components of crowding: effects on health and satisfaction. Environ. Behav. 7, 225–236. doi: 10.1177/001391657500700206
Duval, C. L., Veitch, J. A., and Charles, K. E. (2002). Open-Plan Office Density and Environmental Satisfaction. Ottawa, ON: Institute for Research in Construction; National Research Council Canada.
Evans, G. (1994). Psychosocial Factors and the Physical Environment: Inter-Relations in the Workplace. International Review of Industrial and Organizational Psychology. Available online at: https://ci.nii.ac.jp/naid/10017987224/ (accessed November 24, 2018).
Evans, G. W. (2000). Stress and open-office noise. J. Appl. Psychol. doi: 10.1037/0021-9010.85.5.779
Finnegan, D. J., O'Neill, E., and Proulx, M. J. (2016). “Compensating for distance compression in audiovisual virtual environments using incongruence,” in Proceedings of the 2016 CHI Conference on Human Factors in Computing Systems (San Jose, CA), 200–212.
First Impressions Make or Break a Candidate's Decision (2020). First Impressions Make or Break a Candidate's Decision. Available online at: https://www.monster.co.uk/advertise-a-job/hr-resources/hr-strategies/attracting-talents/first-impressions-make-or-break-a-candidates-decision/ (accessed November 24, 2018).
Fisk, W. J. (2000). Health and productivity gains from better indoor environments and their relationship with building energy efficiency. Ann. Rev. Energy Environ. 25, 537–566. doi: 10.1146/annurev.energy.25.1.537
Fisk, W. J., Mendell, M. J., Daisey, J. M., Faulkner, D., Hodgson, A. T., Nematollahi, M., et al. (1993). Phase 1 of the California healthy building study: a summary. Indoor Air 3, 246–254. doi: 10.1111/j.1600-0668.1993.00005.x
Gill, L., and Lange, E. (2015). Getting virtual 3D landscapes out of the lab. Comput. Environ. Urban Syst. 54, 356–362. doi: 10.1016/j.compenvurbsys.2015.09.012
Graham, L. T., Sandy, C. J., and Gosling, S. D. (2011). “Differences in physical and virtual environments,” in The Wiley-Blackwell Handbook of Individual Differences (Hoboken, NJ: Wiley Blackwell), 773. doi: 10.1002/9781444343120
Grantcharov, T. P., Kristiansen, V. B., Bendix, J., Bardram, L., Rosenberg, J., and Funch-Jensen, P. (2004). Randomized clinical trial of virtual reality simulation for laparoscopic skills training. Br. J. Surg. 91, 146–150. doi: 10.1002/bjs.4407
Harris, M. J., and Garris, C. P. (2008). You Never Get A Second Chance To Make a First Impression: Behavioral Consequences of First Impressions. New York, NY, US: Guilford Publications. p. 147–168. doi: 10.1037/10559-014
Hartig, T., Evans, G. W., Jamner, L. D., Davis, D. S., and Gärling, T. (2003). Tracking restoration in natural and urban field settings. J. Environ. Psychol. 23, 109–123. doi: 10.1016/S0272-4944(02)00109-3
Hedge, A. (1982). The open-plan office: a systematic investigation of employee reactions to their work environment. Environ. Behav. 14, 519–542. doi: 10.1177/0013916582145002
Hedge, A., Burge, P. S., Robertson, A. S., Wilson, S., and Harris-Bass, J. (1989). Work-related illness in offices: A proposed model of the “sick building syndrome.” Environ. Int. 15, 143–158. doi: 10.1016/0160-4120(89)90020-2
Heydarian, A., and Becerik-Gerber, B. (2017). Use of immersive virtual environments for occupant behaviour monitoring and data collection. J. Build. Perform. Simul. 10, 484–498. doi: 10.1080/19401493.2016.1267801
Heydarian, A., Pantazis, E., Wang, A., Gerber, D., and Becerik-Gerber, B. (2017). Towards user centered building design: identifying end-user lighting preferences via immersive virtual environments. Automat. Construct. 81, 56–66. doi: 10.1016/j.autcon.2017.05.003
Hong, T., Yan, D., D'Oca, S., and Chen, C. (2017). Ten questions concerning occupant behavior in buildings: the big picture. Build. Environ. 114, 518–530. doi: 10.1016/j.buildenv.2016.12.006
Hua, Y., Loftness, V., Heerwagen, J. H., and Powell, K. M. (2011). Relationship between workplace spatial settings and occupant-perceived support for collaboration. Environ. Behav. 43, 807–826. doi: 10.1177/0013916510364465
Humphreys, M. A., Nicol, J. F., and Raja, I. A. (2007). Field studies of indoor thermal comfort and the progress of the adaptive approach. Adv. Build. Energy Res. 1, 55–88. doi: 10.1080/17512549.2007.9687269
Jahncke, H., Hygge, S., Halin, N., Green, A. M., and Dimberg, K. (2011). Open-plan office noise: cognitive performance and restoration. J. Environ. Psychol. 31, 373–382. doi: 10.1016/j.jenvp.2011.07.002
Jung, S., and Hughes, C. E. (2016). “The effects of indirectly implied real body cues to virtual body ownership and presence in a virtual reality environment,” in Proceedings of the 22nd ACM Conference on Virtual Reality Software and Technology (Munich: ACM), 363–364.
Kaplan, R. (1993). The role of nature in the context of the workplace. Landsc. Urban Plan. 26, 193–201. doi: 10.1016/0169-2046(93)90016-7
Kaplan, S. (1995). The restorative benefits of nature: toward an integrative framework. J. Environ. Psychol. 15, 169–182. doi: 10.1016/0272-4944(95)90001-2
Kim, J., and de Dear, R. (2013). Workspace satisfaction: the privacy-communication trade-off in open-plan offices. J. Environ. Psychol. 36, 18–26. doi: 10.1016/j.jenvp.2013.06.007
Kok, W., Meyer, M., Titus, S., Hollis-Turner, S., and Bruwer, J.-P. (2015). The Influence of Open Plan Work-Environments on the Productivity of Employees: The Case of Engineering Firms In Cape Town. Available online at: http://digitalknowledge.cput.ac.za/handle/11189/5093 (accessed November 24, 2018).
Kuliga, S. F., Thrash, T., Dalton, R. C., and Hölscher, C. (2015). Virtual reality as an empirical research tool—Exploring user experience in a real building and a corresponding virtual model. Comput. Environ. Urban Syst. 54, 363–375. doi: 10.1016/j.compenvurbsys.2015.09.006
Küller, R., and Wetterberg, L. (1996). The subterranean work environment: impact on well-being and health. Environ. Int. 22, 33–52. doi: 10.1016/0160-4120(95)00101-8
Lange, E. (2011). 99 volumes later: We can visualise. Now what? Landsc. Urban Plann. 100, 403–406. doi: 10.1016/j.landurbplan.2011.02.016
Littlefair, P. (2002). Daylight prediction in atrium buildings. Solar Energy 73, 105–109. doi: 10.1016/S0038-092X(02)00038-5
Marquardt, G., Cross, E. S., De Sousa, A. A., Edelstein, E., Farn,è, A., Leszczynski, M., et al. (2015). There or not there? A multidisciplinary review and research agenda on the impact of transparent barriers on human perception, action, and social behavior. Front. Psychol. 6, 1381. doi: 10.3389/fpsyg.2015.01381
Nikolaeva, R., and Russo, S.D. (2017). “Office design and dignity at work in the knowledge economy,” in Dignity and the Organization. Humanism in Business Series, eds M. Kostera and M. Pirson (London: Palgrave Macmillan). doi: 10.1057/978-1-137-55562-5_10
Oldham, G. R. (1988). Effects of changes in workspace partitions and spatial density on employee reactions: a quasi-experiment. J. Appl. Psychol. 73, 253–258. doi: 10.1037/0021-9010.73.2.253
Oldham, G. R., and Fried, Y. (1987). Employee reactions to workspace characteristics. J. Appl. Psychol. 72, 75–80. doi: 10.1037/0021-9010.72.1.75
Oldham, G. R., and Rotchford, N. L. (1983). Relationships between office characteristics and employee reactions: a study of the physical environment. Administr. Sci. Q. 28, 542–556. doi: 10.2307/2393008
Oommen, V., Knowles, M., and Zhao, I. (2008). Should health service managers embrace open plan work environments?: A review. Asia Pacific J. Health Manag. 3, 37–43. doi: 10.3316/informit.424236471220718
Orland, B., Budthimedhee, K., and Uusitalo, J. (2001). Considering virtual worlds as representations of landscape realities and as tools for landscape planning. Landsc. Urban Plan. 54, 139–148. doi: 10.1016/S0169-2046(01)00132-3
Pejtersen, J. H., Feveile, H., Christensen, K. B., and Burr, H. (2011). Sickness absence associated with shared and open-plan offices—A national cross sectional questionnaire survey. Scand. J. Work Environ. Health 37, 376–382. doi: 10.5271/sjweh.3167
Pinder, J., Parker, J., Austin, S. A., Duggan, F., Lansdale, M., Demian, P., et al (2009). The Case for New Academic Workspace. © Loughborough University. Available online at: https://dspace.lboro.ac.uk/dspace-jspui/handle/2134/6037 (accessed November 24, 2018).
Portman, M. E., Natapov, A., and Fisher-Gewirtzman, D. (2015). To go where no man has gone before: virtual reality in architecture, landscape architecture and environmental planning. Comput. Environ. Urban Syst. 54, 376–384. doi: 10.1016/j.compenvurbsys.2015.05.001
Proulx, M. J., Todorov, O. S., Taylor Aiken, A., and de Sousa, A. A. (2016). Where am I? Who am I? The relation between spatial cognition, social cognition and individual differences in the built environment. Front. Psychol. 7, 554. doi: 10.3389/fpsyg.2016.00554
Richardson, J. C., Maeda, Y., Lv, J., and Caskurlu, S. (2017). Social presence in relation to students' satisfaction and learning in the online environment: a meta-analysis. Comput. Human Behav. 71, 402–417. doi: 10.1016/j.chb.2017.02.001
Richardson, M., Jicol, C., Taulo, G., Park, J., Kim, H. K., Proulx, M., et al. (2020). Differences in office-based personal space perception between British and Korean populations. PsyArXiv. doi: 10.31234/osf.io/gkjpm
Steed, A., Frlston, S., Lopez, M. M., Drummond, J., Pan, Y., and Swapp, D. (2016). An ‘in the wild' experiment on presence and embodiment using consumer virtual reality equipment. IEEE Trans. Vis. Comput. Graph. 22, 1406–1414. doi: 10.1109/TVCG.2016.2518135
Stigsdotter, U. A., and Grahn, P. (2004). A garden at your workplace may reduce stress. Design Health 147–157.
Sundstrom, E., Burt, R. E., and Kamp, D. (1980). Privacy at work: architectural correlates of job satisfaction and job performance. Acad. Manag. J. 23, 101–117. doi: 10.2307/255498
Sundstrom, E., Herbert, R. K., and Brown, D. W. (1982). Privacy and communication in an open-plan office: a case study. Environ. Behav. 14, 379–392. doi: 10.1177/0013916582143007
Tennessen, C. M., and Cimprich, B. (1995). Views to nature: effects on attention. J. Environ. Psychol. 15, 77–85. doi: 10.1016/0272-4944(95)90016-0
Ulrich, R. S. (1984). View through a window may influence recovery from surgery. Science 224, 420–421. doi: 10.1126/science.6143402
Ulrich, R. S., Simons, R. F., Losito, B. D., Fiorito, E., Miles, M. A., and Zelson, M. (1991). Stress recovery during exposure to natural and urban environments. J. Environ. Psychol. 11, 201–230. doi: 10.1016/S0272-4944(05)80184-7
van Duinkerken, W., and MacDonald, K. I. (2013). “Challenges of redesigning staff work space,” in Workplace Culture in Academic Libraries, eds K. Blessinger, and P. Hrycaj (Oxford: Chandos Publishing), 147–162.
Wargocki, P., Wyon, D. P., Sundell, J., Clausen, G., and Fanger, P. O. (2000). The effects of outdoor air supply rate in an office on perceived air quality, sick building syndrome (SBS) symptoms and productivity. Indoor Air 10, 222–236. doi: 10.1034/j.1600-0668.2000.010004222.x
Witmer, B. G., and Kline, P. B. (1998). Judging perceived and traversed distance in virtual environments. Presence Teleoperat. Virt. Environ. 7, 144–167. doi: 10.1162/105474698565640
Keywords: personal space, spatial density, social density, virtual reality, built environment
Citation: Jicol C, Taulo G, Goldie C, Lloyd-Esenkaya T, Hynes R, Paradise C, Proulx MJ and de Sousa AA (2023) The effects of social density, spatial density, noise, and office views on perceived personal space in the virtual workplace. Front. Comput. Sci. 5:1066881. doi: 10.3389/fcomp.2023.1066881
Received: 11 October 2022; Accepted: 27 January 2023;
Published: 13 February 2023.
Edited by:
Nicola Bruno, University of Parma, ItalyReviewed by:
Anna Anzani, Politecnico di Milano, ItalyCopyright © 2023 Jicol, Taulo, Goldie, Lloyd-Esenkaya, Hynes, Paradise, Proulx and de Sousa. This is an open-access article distributed under the terms of the Creative Commons Attribution License (CC BY). The use, distribution or reproduction in other forums is permitted, provided the original author(s) and the copyright owner(s) are credited and that the original publication in this journal is cited, in accordance with accepted academic practice. No use, distribution or reproduction is permitted which does not comply with these terms.
*Correspondence: Alexandra A. de Sousa,  YS5kZXNvdXNhQGJhdGhzcGEuYWMudWs=
Disclaimer: All claims expressed in this article are solely those of the authors and do not necessarily represent those of their affiliated organizations, or those of the publisher, the editors and the reviewers. Any product that may be evaluated in this article or claim that may be made by its manufacturer is not guaranteed or endorsed by the publisher.
Research integrity at Frontiers
Learn more about the work of our research integrity team to safeguard the quality of each article we publish.