- 1School of Computer Science and Engineering, Xi'an University of Technology, Xi'an, China
- 2China National Heavy Machinery Research Institute Co., Ltd., Xi'an, China
Fault detection is an essential task for large-scale industrial maintenance. However, in practical applications, due to the possible harm caused by the collection of fault data, the fault samples that lead to the labeling are usually very few. Most existing methods consider training unsupervised models with a large amount of unlabeled data while ignoring the rich knowledge that existed in a small amount of labeled data. To make full use of this prior knowledge, this article proposes a reinforcement learning model, namely, adversarial reinforcement learning in weakly supervised (WS-ARL), which performs significantly better by jointly learning small labeled anomaly data and large unlabeled data. We use an agent of the reinforcement learning model as a fault detector and add a new environment agent as a sample selector, by providing an opposite reward for two agents, and they learn in an adversarial environment. The feasibility and effectiveness of the model are verified by experimental analysis and compared the performance of the model with five state-of-the-art weakly/un-supervised methods in the hydraulic press fault detection task.
1. Introduction
Since Germany took the lead in putting forward the concept of “Industry 4.0,” it marks the beginning of the transformation of the manufacturing industry to intelligence and information technology. In recent years, China, the United States, and other countries have also put forward the concepts of “Made in China 2025” and “Industrial Internet,” which aim to combine traditional production modes with modern information technology to improve production efficiency and security. Predictive maintenance (PDM) technology is considered to be one of the key data-driven analytical applications in large manufacturing industries. With the rapid growth in the complexity and automation of industrial systems in recent years, unexpected system failures may bring serious financial impacts, business losses, and fatal workplace injuries to factories (Xie et al., 2022). PDM applications can anticipate failures well in advance so that decision-makers can take appropriate actions, such as maintenance, replacement, or even planned shutdown (Sahal et al., 2020). However, there are some problems with data-driven applications. In industrial scenarios, there is a large amount of unlabeled data that is easy to obtain, while the collection of fault data is usually destructive and will cause huge losses. As the result, very few plants are allowed to run into a failure state and collect samples to train fault diagnosis systems (Kingma et al., 2014), which leads to target failures with no or fewer data available and, thus, the domination of unsupervised methods in this field for decades (Maale et al., 2016). For example, Xu et al. (2018), Su et al. (2019), Choi et al. (2022), and Wang et al. (2022) use variational autoencoder (VAE) to reconstruct input data and determine anomalies based on reconstruction probabilities. Geiger et al. (2020) and Kim et al. (2021) designed an anomaly detector based on a generative adversarial network (GAN).
Unsupervised learning models assume that all training data are normal and learn a tight boundary for fault detection (Markus et al., 2000). However, in practical industrial applications, apart from a large batch of unlabeled samples, there is often a set of known classes of fault instances, e.g., a subset verified as normal or abnormal by some domain experts; the anomaly provides valuable prior knowledge. Therefore, compared to unsupervised methods, semi-supervised (Gao et al., 2021; Wu et al., 2021) learning effectively exploits these labeled anomalies and can significantly improve detection accuracy. One semi-supervised approach is to assume that a large amount of unlabeled data are normal and learn to cluster the normal data together while pushing the small amount of labeled anomalous data away (Liu et al., 2012; Li et al., 2020). The other approach is to learn different patterns for different classes, such as deep probabilistic generative models (Vinod and Hinton, 2010; Volodymyr et al., 2015).
Most related studies use a small amount of labeled data to train detection models, but they only learn about labeled anomalies without considering anomalous instances that may exist in large batches of unlabeled data. In fact, in industrial fault detection tasks, there are often a large number of abnormal instances in unlabeled data. Effective use of this knowledge can significantly improve the model's understanding of abnormal types and conditions.
Therefore, for the problem of industrial fault detection, how to make full use of labeled data while exploring unlabeled data has become a current research hotspot. Pang et al. (2020) propose to use of a reinforcement learning model to learn labeled data and unlabeled data simultaneously. However, Euclidean distance in high dimensions will reduce the reliability of the algorithm, which further influences the selection of observation samples. Inspired by Pang et al. (2020), this article proposes a model, namely, adversarial reinforcement learning in weakly supervised (WS-ARL), and we design an additional agent, by constantly trying to reduce the reward of the detection agent while actively exploring anomalies in unlabeled data, forcing the detection agent to focus on learning the most difficult possible fault samples. Our main contributions are given as follows:
• We design two agents, namely, a detection agent and an environmental agent, which implement fault detection and data sampling under adversarial conditions, respectively. In addition to the regular main detection agent responsible for outputting detection results, the environment agent is used as the selector for the next observation sample. The model will reward the detection agent based on the recognition results and give the environment agent the exact opposite reward. To the best of our knowledge, this is the first time that adversarial reinforcement learning has been applied to weakly supervised industrial fault detection.
• By combining sample generation techniques and unsupervised algorithms, a unique reward function is designed. According to the behavior of the detection agent, the standard −1/1 reward is generated as a supervised reward in the oversampled labeled anomaly instance set. In the unlabeled instance set, an anomaly score is generated as an unsupervised reward. The simulated environment is randomly sampled in both, enabling joint learning of a small batch of labeled data and a large batch of unlabeled data.
• We construct a model, namely, adversarial reinforcement learning in weakly supervised (WS-ARL), and evaluate it in the hydraulic press fault detection task. By setting different known fault types and fault contamination rates, the result shows that compared with other models, the area under precision-recall curve (AUC-PR) improvement of about 1–5% is obtained.
2. Related studies
2.1. Anomaly detection
Anomaly detection (fault detection in this article) is an active topic in various fields. The problem we study is the fault detection of industrial equipment based on time series, such as engines (Malhotra et al., 2016) and hydraulic system (Helwig et al., 2015). By monitoring multiple time series (such as telemetry data and sensor data), the device can detect abnormal conditions. However, analyzing a single time series separately has many problems. First, it is labor-intensive to train and maintain an individual anomaly detection model for each metric; second, operation engineers are more concerned about the overall status of an entity than each constituent metric (Ya et al., 2019). Thus, in this article, we combine multiple univariate time series into multivariate time series to analyze the overall anomaly of equipment data. Figure 1 shows a multivariable time series with a valve fault in the hydraulic machine dataset.
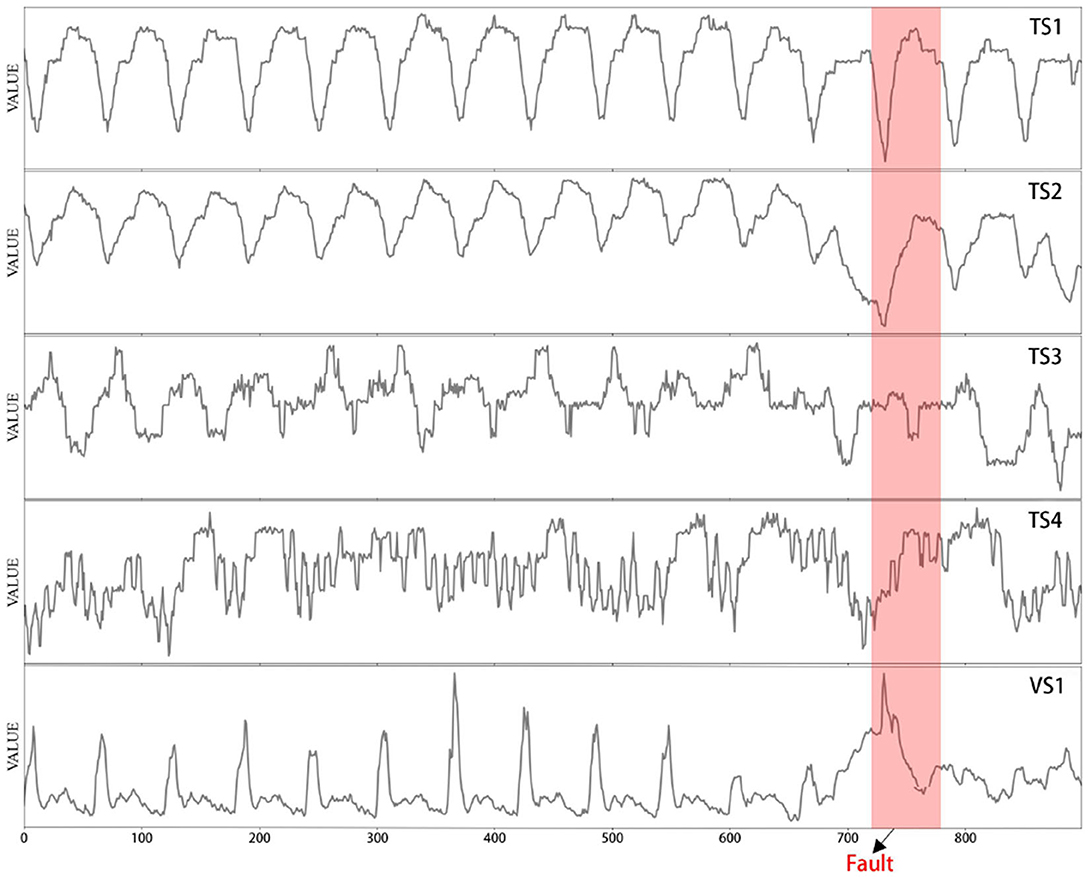
Figure 1. Time-series metrics of four temperature sensors (TSs) and one pressure sensor (VS) in 15 s, with one fault region highlighted in red (Helwig et al., 2015).
In recent years, the most related studies of anomaly detection methods include weakly supervised and supervised learning. Supervised learning methods (Heras and Donati, 2014; Park et al., 2017) require labeled data to train the model and cannot identify unknown anomaly categories. In fact, in anomaly detection tasks in many fields, abnormal samples are often difficult to observe and record, which leads to the need for unsupervised methods for most tasks. Su et al. (2019) proposed an encoder–decoder model that uses a gated recurrent unit (GRU) to capture sequence information and identify anomalies according to reconstruction probability. Zenati et al. (2018) used two networks for adversarial learning to learn the potential space of data and calculated reconstruction errors. The abovementioned studies separate representation learning from anomaly detection methods, leading to suboptimal or unstable detection performance (Pang et al., 2019). At the same time, the unsupervised method does not consider the existence of a small amount of labeled data, which prevents the further improvement of the accuracy of the model.
Considering the inadequacy of the unsupervised approach, the latest research focuses on anomaly detection based on weakly supervised and the detection accuracy can be further improved by a few labeled anomalies. Willetts et al. (2020) combined a clustering algorithm and generation model to detect anomalies; Kingma et al. (2014) applied variational inference to the problem of weakly supervised classification and recovered original data from low-dimensional space with partial label information. Ruff et al. (2019) aimed to find a compact hypersphere in the latent space that represents normal samples and places abnormal samples in distance. Compared with unsupervised methods, these semi-supervised methods take full advantage of prior knowledge of small amounts of labeled data and, thus, have the potential to achieve higher performance gain.
At present, deep reinforcement learning (DRL) has demonstrated human-level capability in several tasks. A related application to anomaly detection, recently investigated by Guillermo et al. (2019), incorporates the environment's behavior into the learning process for intrusion detection. Our study is completely different from that of Guillermo et al. (2019). (a) They used DRL to achieve unevenly distributed supervised learning vs. we implement semi-supervised learning of a small number of labels. (b) They used a simple 1/0 reward function for evaluation, whereas we use two custom reward functions applied to different agents. Another related study by Pang et al. (2018) leverages a few labeled anomalies to learn more application-relevant feature representations. Different from using only one agent (Pang et al., 2018) to achieve sample selection and anomaly detection, we use two agents to complete these tasks separately. (a) We design the new rewards function for the two agents, and let them conduct adversarial learning. (b) We use the environment agent for sample selection and prove that the Euclidean distance in low dimension can better measure the distance between samples.
2.2. Reinforcement learning
As a machine learning method, reinforcement learning has the ability to learn and develop autonomously through trial and error in a dynamic environment (Sutton and Barto, 1998). Through the interaction of the agent with the environment, reinforcement learning models do not require any supervised process during training (Guillermo et al., 2019). Research in the field of intrusion detection has proven that reinforcement learning is a better choice than supervised and unsupervised learning when the dataset is large enough.
2.2.1. Brief introduction to reinforcement learning
Reinforcement learning (Sutton and Barto, 1998) is one of the machine learning methods including agents, actions, environments, and rewards. Starting at time t, the agent performs an action atin the environment, and the environment generates a reward rt for it, which is represented as a state St, and the model learns, recursively, by feeding this state back to the agent.
The goal of reinforcement learning is to find a policy π that maximizes the reward as Equation (1).
Where Rt represents the sum of accumulated rewards obtained by the agent from time t to any time step afterward; γ ∈ (0, 1]represents the discount factor; τt + κ represents the reward obtained at each time step after time t. Reinforcement learning defines the value function to calculate the expected value of the cumulative return at each step state St, that is, it is used to measure the pros and cons of the state St under the influence of the agent. The value function is shown in Equation (2):
The value function depends on the agent's policy π. Among all possible functions, there exists an optimal value function with the highest value as Equations (3), (4):
Where π*is the optimal policy function that maximizes the achievable action value of the state s. For convenience, reinforcement learning builds a function called Qfunction, which takes a state and action pair as input, and outputs a reward value. Therefore,π* become as Equation (5).
Where Q* represents the Q optimal value that can be obtained.
2.2.2. Deep Q-learning algorithm
Q-learning is a value function-based algorithm proposed by Watkins in 1989 which could obtain the expectation of the benefit by the Q function when an action is performed in a state (Valenzuela et al., 2013). The Q-learning provides a learning rate for the agent to learn and update a new Q value iteratively, as shown in Equation (6):
In the process of continuous state Sttransition, the Qvalue is constantly updated. In Equation (6), α ∈ (0, 1) represents the learning rate, and a higher learning rate could speed up the learning process but may also loss of more information.
Deep Q-Learning (DQN) combines neural networks and Q-Learning, which fills the gap of Q-Learning in complex problems such as infinite state spaces. DQN approximates the optimal Qfunction through a deep neural network, as shown in Equation (7):
Through iterative training, the following losses are minimized to learn parameters θ:
Where ε is the set of the learning experience of the agent, each element is stored as et = (St, at, rt; St+1), and the model will use the small batch samples randomly selected from the experience set to calculate the loss; θjis the parameter of the Q network in the j iteration process; target network is the one with the parameter which is responsible for calculating the target value in each round and updates by θjin each Kstep.
DQN can learn strategies from large amounts of high-dimensional original data with better accuracy and stability by combining the powerful presentation ability of deep learning with the powerful decision-making ability of reinforcement learning. Thus, in this article, we use an adapted version of DQN to implement a detection agent and an environment agent, respectively. Through parallel training in the adversarial environment, we intelligently select training samples and focus on exploring abnormal samples.
3. Methodology
The difficulty in industrial fault detection is mostly all about data. First, manual labeling of data is an impossible task for a large amount of industrial sensor data that are constantly updated. Although unsupervised learning can classify data through easily accessible unlabeled datasets, its performance is usually not as good as supervised classifiers (Ma and Shi, 2020). Second, due to the requirement for high security and high stability in industrial production, the acquisition of anomalies is often expensive and rare. In the dataset of this article, anomaly instances only account for 2% of all instances. For such unbalanced unlabeled datasets, the model we obtained can easily obtain high overall detection accuracy, that is, the model over-focuses on normal instances and even misjudges a few abnormal instances; it will not affect the overall evaluation. However, in industrial fault detection, such false positives are unacceptable.
To address the above challenges, we propose an industrial fault detection model based on WS-ARL, as shown in Figure 2.
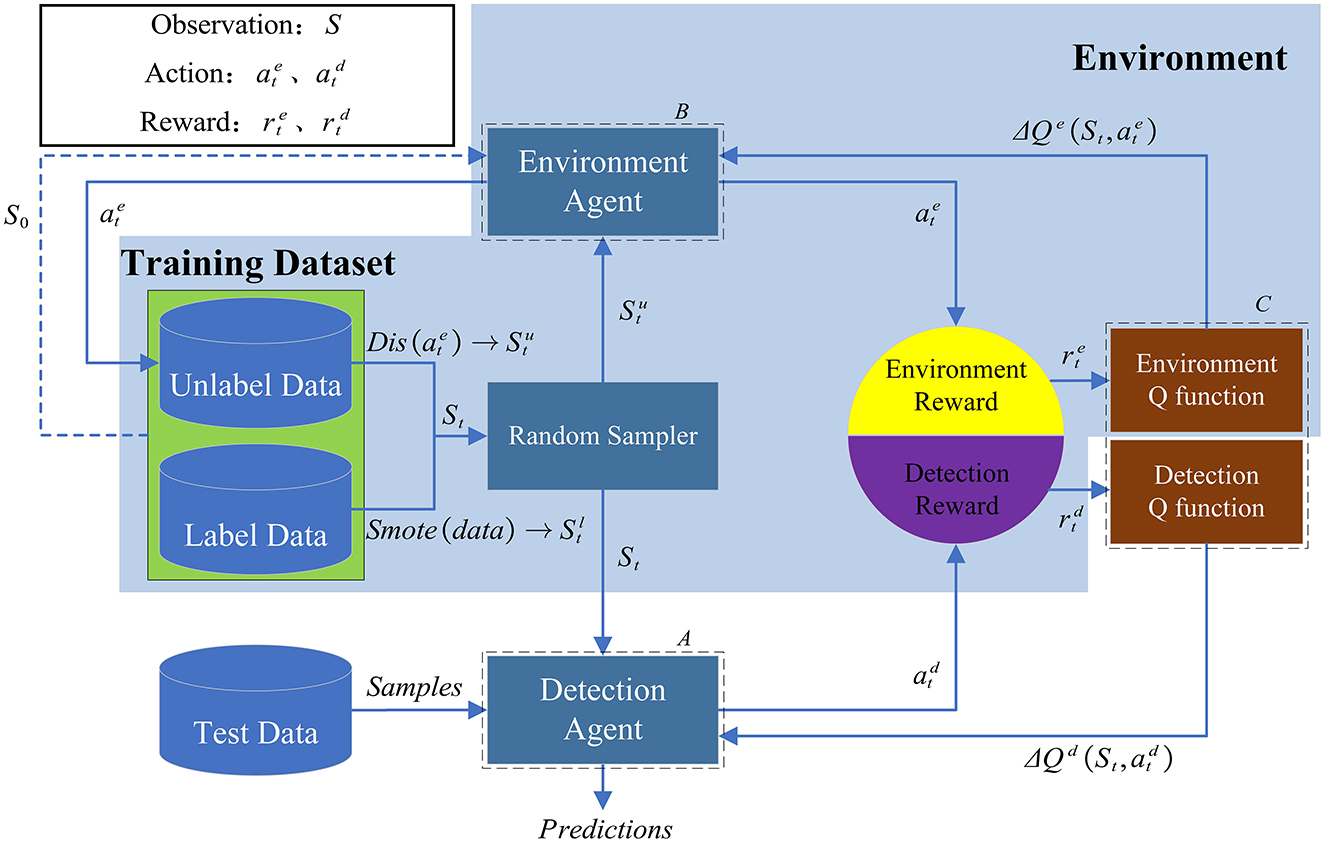
Figure 2. Architecture of the WS-ARL model. (A) The detection agent provides the detection results of the sample. (B) The environment agent selects the next observation sample. (C) The policy functions of the two agents will be updated based on the DQN (Deep Q-learning) update rules.
The input data include unlabeled data (Da) and labeled data (Da). The model contains the following two agents: a detection agent and an environment agent. The unlabeled data and labeled data are randomly sampled with 7:3. For labeled data, after oversampling through the Smote algorithm (Chawla et al., 2002), it is directly passed to the detection agent for identification; for unlabeled data, it should be ensured that when the detection agent learns, it focuses more on the possible fault samples, rather than on identifying normal samples. Therefore, we design a distance-based function (dis, refer to Formula 9), which autonomously provides the detection agent with samples approaching anomalies based on the current observations and recognition results. The proposed two agents work in an adversarial model that gives an opposite reward to the environment agent based on the reward provided to the detection agent. Our ultimate goal is to make the detector strengthen the learning of the minority class of anomalies. The specific training process of the model is as follows:
(1) Randomly extract samples from the training set as input, the detection agent will select the optimal action (representing normal and abnormal, respectively) {a0, a1}, and obtain the corresponding reward, while the environment agent will obtain the opposite reward.
(2) Randomly enter Da and Du and select the next observation sample. If it enters Da, the next observation is randomly selected from it; if it enters Du, the next observation that tends to be abnormal is selected according to the input observation and the identification result.
(3) According to the obtained reward value and the inferred next observation, the policy functions of the detection agent and the environment agent are updated according to the DQN update rule as described in Section 2 (Mnih et al., 2013).
We hope to learn the optimal action-value function and achieve fault detection by the DQN network. Considering the scarcity of abnormal data, we design dual agents to sample and identify data, respectively.
3.1. Dual-agent detection model
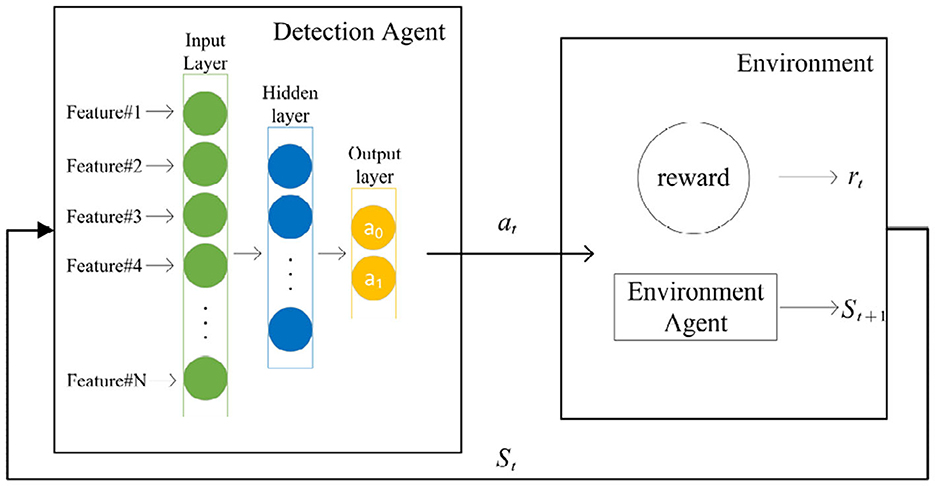
The detection agent, as the detector of the model, is implemented by a simple network with one hidden layer. For each given observation sample St, the proposed model could select an optimal action from two possible actions{a0, a1}. Figure 3 shows the structure of fault detection based on reinforcement learning.
We design an environment agent to select the next round of observation samples, instead of the random sampling from observation by the environment in original reinforcement learning. Both the environment agent and the detection agent are based on DQN and trained in parallel. When the detection agent gives an action (output), the environment agent combines the observation samples about the current round and autonomously selects the next round of observation samples. Therefore, the two agents act as detector and sample selectors and get diametrically opposite rewards, which forces the detector to focus on difficult samples (samples that get less reward). We aim to provide the detector with samples that are close to anomalies as much as possible, refer to the sample selection method in DPLAN (Pang et al., 2020), and apply it to the environment agent. It uses the distance between samples to select the next sample to observe the distance metric functiondis shown in Equation (9).
Where θenv represents the feature vector obtained by the output of the environment agent in DQN; Sis a subset of Du, when the amount of Du is small, it can also be set S = Du; St and St+1 are the samples of the current round and the next round of samples, respectively; c ∈ {0, 1} represents that the model is randomly sampling from DaorDu. In order to encourage the model to fully explore large batches of unlabeled data, we set cto 0 or 1 in a 3:7 ratio; returns the Euclidean distance between each instance in S and St.
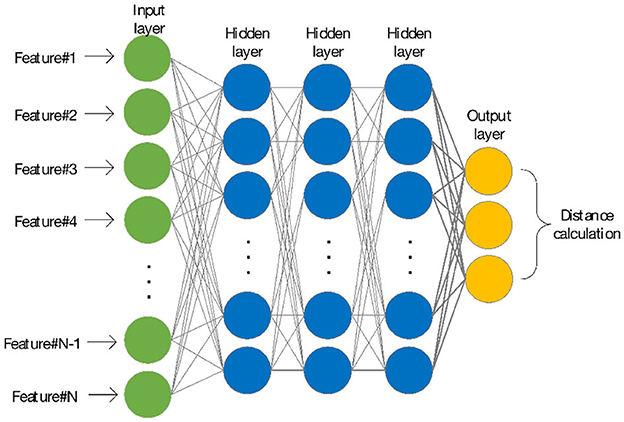
After each round of actions given by the detector, if the model enters the dataset Da, a sample is randomly selected from it; if the model enters the dataset Du, calculate the distance between the current sample and other samples according to the following principles: If the detector determines that the current sample is abnormal, it returns the sample closest to it; otherwise, it returns the sample that is farthest away from it. To measure the similarity between unlabeled vectors, the method can be based on Euclidean distance or cosine similarity. Here, we consider that the Euclidean distance is difficult to reflect the inherent similarity between samples in high dimensions (Tenenbaum et al., 2000). In order to correctly represent the distance relationship between each vector and compare two similarity measures, we design the network of the environment agent, as shown in Figure 4.
The environment agent is a neural network with three hidden layers. After combining with the literature (Huang et al., 2020) and the experiment in Section 4.3.3, it is shown that Euclidean distance in low dimensions can better demonstrate the similarity between vectors and provide possible fault samples for the detection agent more effectively; we finally choose to output a vector with dimension 3 as the benchmark for Euclidean distance calculation. Therefore, no matter what action the detection agent takes, the environment will eventually provide samples that are potentially closest to fault for the next round of observations by the detection agent.
3.2. Reward function
The reward functions are designed for two agents, which produce opposite reward values. The environment agent actively tries to reduce the reward received by the detection agent and force it to learn the most difficult samples by increasing the detector's misprediction. Through this adversarial learning mode, the detector performance is further improved.
3.2.1. Detection agent reward
DPLAN (Pang et al., 2020) designed a joint reward mechanism, which enables their agent can obtain rewards from the two datasets {Da, Du}, respectively. Inspired by this mode, we design new rewards for our detection agent and environment agent. The reward function is defined as Equation (10):
Where represents the reward of the detection agent at time t; at represents the action of the detection agent at time t; θdet represents the hidden layer output of the detector agent, we set θdet as the input of the unsupervised algorithm to ensure that the unsupervised detector always works at low-dimensional space.
In particular, in order to quantify the anomaly level of anomalous instances when the detector identifies unlabeled data, we introduce an efficient unsupervised anomaly detection algorithm—a weakly supervised improvement of iForest (Liu et al., 2012) as an anomaly detector. Barbariol and Susto (2021) found that the optimal detection effect of iForest can often be achieved when there are <100 iTrees (isolation Tree). Through weakly supervised, it can be achieved optimization for the number of iTrees. Therefore, in the case of a small amount of labeled data, we introduce TiWS-iForest (Barbariol and Susto, 2021) as an anomaly detector, and it is fewer iTrees means higher generation efficiency and computational efficiency. By synthesizing the output results of all iTree pairs of samples, the model mapped these results to [0, 1] as an anomaly score, and the larger it is, the more abnormal it is.
Therefore, our detection agent will only get a positive reward when it correctly identifies an abnormal sample in Da and will be penalized when it is considered to be a normal sample (false negative). We default Du to a normal sample when the agent considers it abnormal (false positive), and a penalty will be given according to the abnormal degree of the sample (the more abnormal, the less penalty); otherwise, no reward will be given.
3.2.2. Environment agent rewards
The environment agent will actively try to increase the detection difficulty of the detector by a reward function opposite to the detection agent. The reward function is defined in the following equation:
Where represents the reward of the environment agent at time t, and at represents the action of the detection agent at time t.
When sampling from Da, no reward is provided for the agent; when sampling from Du and the detector identifies as normal, a penalty is given; when sampling from Du and the detector identifies as abnormal, the environment agent will be provided with the opposite reward according to the reward value of the detection agent. In other words, through adversarial training, the observations selected by the training environment agent are more biased toward instances that are difficult for the detector to distinguish. Experiments show that the approach will help improve the final performance of the detector.
4. Experiments
To verify the effectiveness of the proposed method, we designed a series of experiments about fault detection on the multi-sensor data by a hydraulic test bench (Helwig et al., 2015).
4.1. Experimental platform
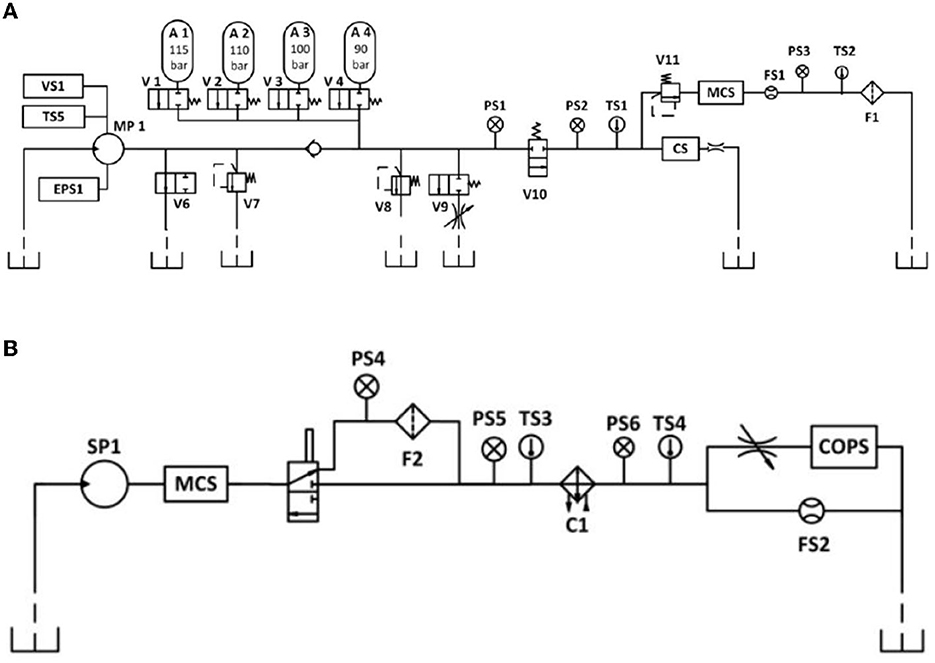
The experimental platform is a hydraulic system, as shown in Figure 5, which consists of a main operating loop (Figure 5A) and a secondary cooling filter loop (Figure 5B) connected by the tank. The machine runs in a fixed working cycle and could simulate specified faults of varying severity. We detect four different types of system faults which are cooler degradation, valve switch degradation, internal pump leakage, and accumulator leakage.
The hydraulic system collects monitoring data from 15 sets of sensors in 2,205 s, including 6 sets of pressure sensors (PS1–PS6), 2 sets of flow sensors (FS1 and FS2), 5 sets of temperature sensors (TS1–TS5), electric power sensor (EPS1), and vibration sensor (VS1), and the sampling frequency is between 1 and 100 Hz.
4.2. Data sample processing
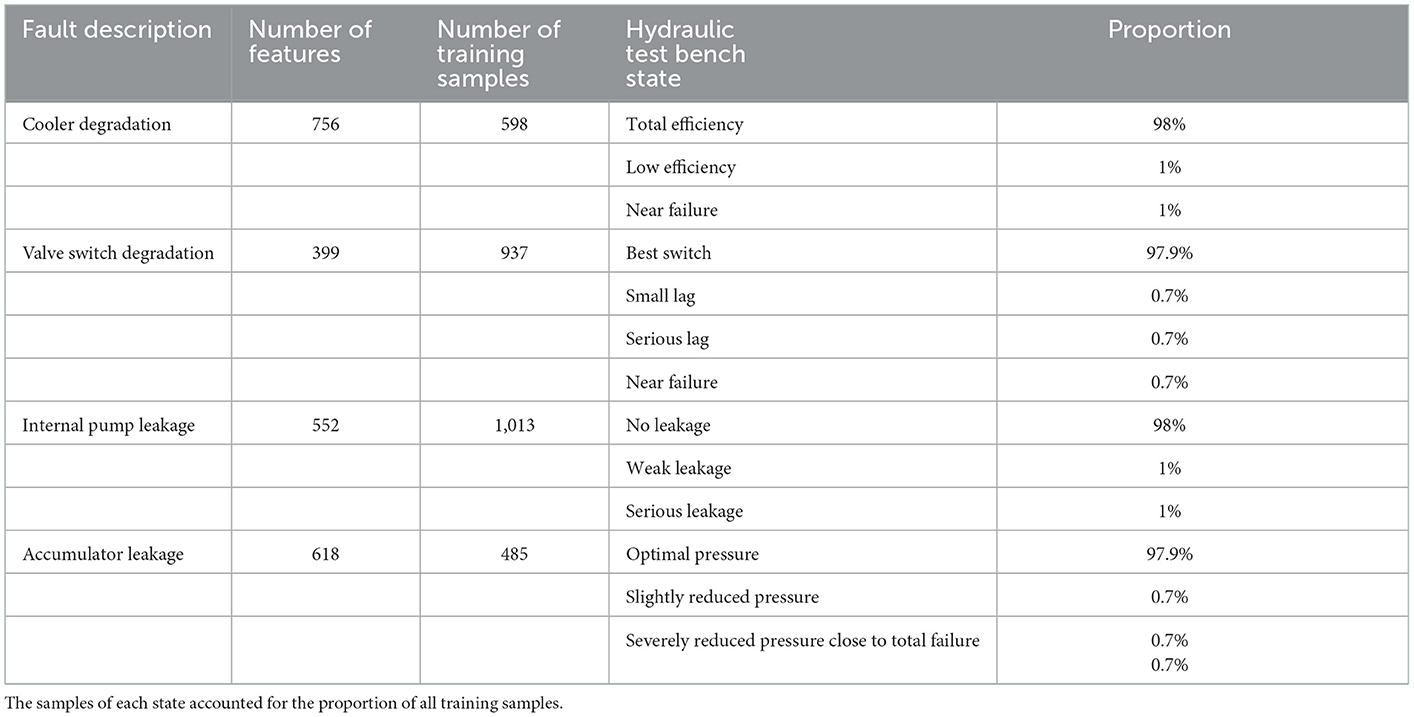
For high-frequency hydraulic press sampling data, we use the signal shape (linear fitting slope), distribution density features (median, variance, skewness, and kurtosis), and Ricker wavelet feature functions to achieve feature extraction. After feature dimension reduction based on principal component analysis (PCA), the original input data are obtained. We construct datasets for 4 four failures, as shown in Table 1, where each dataset contains one normal class and two to three abnormal classes. Considering that only a few labeled anomalies are available in industrial applications (Gao et al., 2021), the number of labeled anomalies is fixed at 2 in each dataset, accounting for 0.2%−0.33% of the training data. It is guaranteed that in the training set and test set, the abnormal pollution rate is fixed at 2 and 5%.
We implement the proposed model on the PyTorch framework and train the network on Ubuntu with AMD Ryzen 5 3600 6-Core (16G) and an NVIDIA Geforce GTX 1650. We use the area under the receiver operating characteristic curve (AUC-ROC) and AUC-PR to evaluate the performance of the model. AUC-ROC evaluates the performance of the model on positive and negative samples; AUC-PR only focuses on the recognition ability of the model to positive samples, which is more suitable for identifying anomalous classes than AUC-ROC.
4.3. Results and analysis
As described in Section 3.1, a small number of anomalous labeled samples and a large number of unlabeled samples are selected to train and test the model. This section compares and analyzes the performance of the proposed model and other benchmark models on the four datasets of “cooler degradation,” “valve switch degradation,” “internal pump leakage,” and “accumulator leakage.”
4.3.1. Results on the test set
We compare the model in this article with a variety of anomaly detection methods, which are divided into two categories according to the implementation method, namely, the unsupervised model [iForest (Liu et al., 2012) and VAE (An and Cho, 2015)] and semi-supervised models [DevNet (Gan et al., 2015), DPLAN (Pang et al., 2020), and Deep SAD (Ruff et al., 2019)]. Besides, the reliability and rigor of the experimental results are ensured by comparing them with the benchmark model on the hydraulic press dataset.
Table 2 shows the results of multiple semi-supervised and unsupervised methods on the four datasets, which are “cooler degradation,” “valve degradation,” “internal pump leakage,” and “accumulator leakage.” From the previously mentioned table, it can be concluded that:
(1) Comparing two unsupervised methods, iForest has achieved better results among the two indexes of the three datasets, and the effect of fault detection of “valve degradation” is close to VAE. It should also be pointed out that VAE runs 5–11 times longer than iForest among the four fault detection tasks. This is mainly due to iForest having low memory requirements and linear time complexity, which makes it less competitively expensive than other unsupervised algorithms. Therefore, considering the overall operation efficiency and detection accuracy of the model, iForest is more suitable as a quantitative algorithm for anomaly level.
(2) Comparing the unsupervised method, the proposed method, DevNet, DPLAN, and Deep SAD perform better on the AUC-PR indicator. This is due to these methods not only help model training through unlabeled data but also learn a few labeled anomalies to improve detection accuracy.
(3) The WS-ARL model proposed in this article has achieved the best results in the AUC-PR and AUC-ROC of four datasets. This is mainly because both Deep SAD and DevNet regard unlabeled data as normal data, which can generate corresponding spherical regions and determine the distribution of abnormal scores. These methods only use labeled data for result optimization. WS-ARL not only learns to label anomalies but also efficiently explores possible faults in unlabeled data. This allows it to gain more knowledge than either of these methods. Compared to DPLAN, WS-ARL consistently provides the detector with a more efficient learning sample by adversarial learning, which makes WS-ARL's performance over multiple datasets more stable.
4.3.2. Comparison of detection results with different numbers of supervised instances
To further study the detection effect in scenarios with more known faults, on the basis that each dataset contains two labeled anomalies, we increase the known fault category and the number of faults. For “cooler degradation” and “internal pump leakage” with two fault categories, we add labeled data of two new fault categories in turn; for “valve degradation” and “accumulator leakage” with three fault categories, we add labeled data of three new fault categories in turn. Each time thereafter, we add a fault instance for each category. The AUC-PR changes with the number of known anomalies, as shown in Figure 6.

Figure 6. (A) The result of cooler degradation. (B) The result of valve degradation. (C) The result of internal pump leakage. (D) The result of accumulator leakage.
In Figures 6A, C, we add two samples of new categories for the first time (the number of faults goes from 2 to 4), and then add one sample at a time for each category (the number of faults goes from 4 to 14). In Figures 6B, D, we add two samples of new categories for the first two times (the number of faults goes from 2 to 6), and then add one sample at a time for each category (the number of faults goes from 6 to 18). The increase in the known anomaly category and the number of anomalies can provide more additional supervision information. It can also be concluded from the previously mentioned figure:
(1) Although the proposed WS-ARL is not optimal in some initial stages of the “valve degradation,” “internal pump leakage,” and “accumulator leakage,” the performance has been rapidly improved as the number increases. This may be due to the fact that the initial stage is to increase the category of an anomaly; more noises lead to the unstable performance of each model. However, WS-ARL still achieved an improvement rate of 26, 30, 77, and 33% after gaining more prior knowledge.
(2) The final detection of the proposed model is optimal in four datasets. Compared with other models, the proposed model obtained about a 1–5% improvement in the AUC-PR.
4.3.3. Comparison of the fault sample observed under different similarity measures
In the article, a special dist formula (refer to Formula 9) is used to select observation samples for the detection agent. Especially, in the unsupervised environment, it relies on a similarity measurement algorithm to ensure that agents focus on fault samples, that is, provide more fault samples for agents to learn. Therefore, we studied the sampling rates of fault samples by different similarity measurement algorithms under different conditions. The results are given in Figure 7, which shows the number of fault samples obtained by the environment agent using two efficient similarity measurement algorithms under different output dimensions during training.
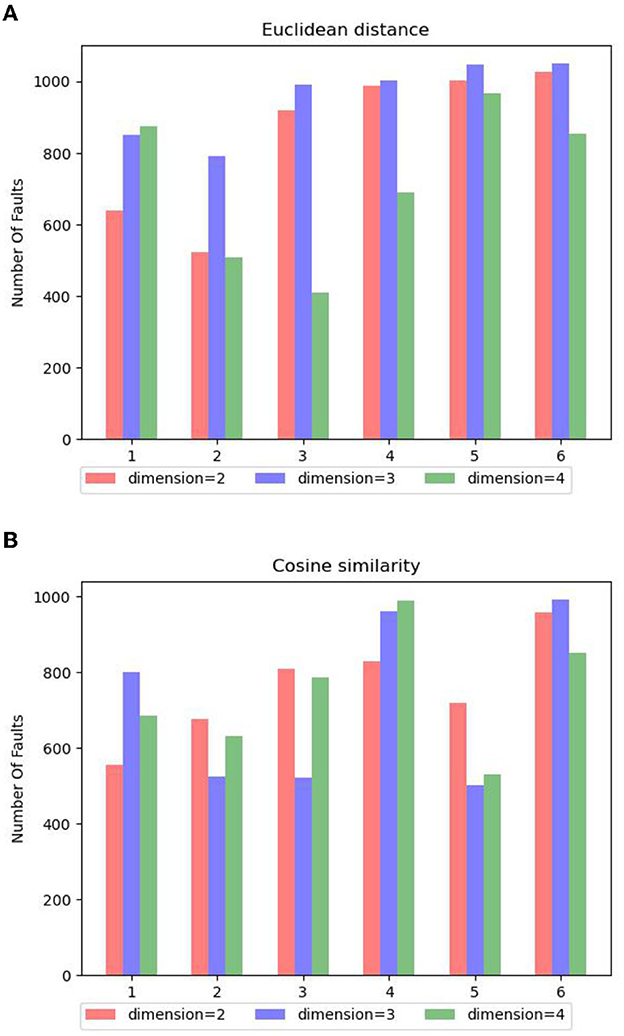
Figure 7. (A) The number of fault samples selected according to Euclidean distance in different dimensions. (B) The number of fault samples selected according to cosine similarity in different dimensions.
In Figures 7A, B, we use Euclidean distance and cosine similarity to select samples when the output dimensions are 2, 3, and 4 where the horizontal axis is the training batch, and the vertical axis is the number of fault samples collected. It can also be concluded from the previously mentioned figure:
(1) In this dataset, the result of cosine similarity is not as stable as Euclidean distance, especially when the dimension is 3 or 4, it cannot provide stable fault sample output. This may be due to the fact that numerical value is an important criterion for fault analysis, and the cosine similarity is not sensitive to the absolute value of the specific value.
(2) Euclidean distance shows excellent sample selection performance when the dimension is 2 or 3, especially when the dimension is 3, the highest number of fault sample selections is obtained, which is consistent with the study by Tenenbaum et al. (2000). Meanwhile, it should be noted that with the increase of dimension, the sample selection performance of Euclidean distance is gradually unstable, which will directly affect the learning effect of the detection agent.
4.3.4. Ablation experiment
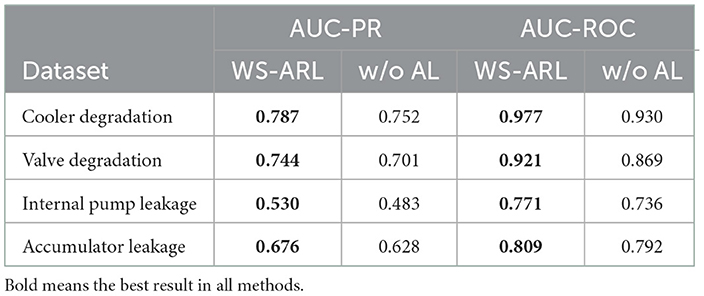
To verify the rationality and effectiveness of the module in WS-ARL, we remove the adversarial learning module of WS-ARL and leave the other modules unchanged (e.g., reward function , distance metric function dis), that is to say, the detection agent is used for both fault detection and sample selection. Experiments are conducted on original WS-ARL and WS-ARL without adversarial learning (Table 3, which is referred to as w/o AL).
In Table 3, we can see that WS-ARL is better than WS-ARL without adversarial learning. This result is consistent with our former analysis since adversarial learning can provide more effective observation samples for the detector, which enables WS-ARL to have a more stable detection performance across multiple datasets.
5. Discussion and conclusion
To address the problem of effective utilization of a small number of labeled anomalies in industrial fault detection, we propose a fault detection framework based on adversarial reinforcement learning. The main idea is to train anomaly detection agents with unlabeled rewards by abnormal data in large batches of unlabeled data discovered by the iForest and labeled rewards by a small batch of labeled abnormal data. At the same time, an environment agent is introduced to guide the collection process of observation samples, which significantly improves the ability of the model to acquire abnormal knowledge and achieve better performance on fault detection.
In the future, we will consider improving the way in which the model obtains the unlabeled abnormal rewards to achieve better detection accuracy.
Data availability statement
Publicly available datasets were analyzed in this study. This data can be found at: https://www.kaggle.com/datasets/jjacostupa/condition-monitoring-of-hydraulic-systems.
Author contributions
LJ, WY, and WH conceived and designed the study and provided administrative support. XJ analyzed and interpreted the data. All authors read and approved the final manuscript.
Funding
This work was supported by the National Key Research and Development Program of China (No. 2018YFB1703000).
Conflict of interest
XJ was employed by China National Heavy Machinery Research Institute Co., Ltd.
The remaining authors declare that the research was conducted in the absence of any commercial or financial relationships that could be construed as a potential conflict of interest.
Publisher's note
All claims expressed in this article are solely those of the authors and do not necessarily represent those of their affiliated organizations, or those of the publisher, the editors and the reviewers. Any product that may be evaluated in this article, or claim that may be made by its manufacturer, is not guaranteed or endorsed by the publisher.
References
An, J., and Cho, S. (2015). Variational autoencoder based anomaly detection using reconstruction probability. Special Lecture IE 2, 1–18. Available online at: http://dm.snu.ac.kr/static/docs/TR/SNUDM-TR-2015-03.pdf
Barbariol, T., and Susto, G. A. (2021). TiWS-iForest: isolation forest in weakly supervised and tiny ML scenarios. arXiv:2111.15432 [cs.LG]. doi: 10.1016/j.ins.2022.07.129
Chawla, N. V., Bowyer, K. W., Hall, L. O., and Kegelmeyer, W. P. (2002). SMOTE: Synthetic minority over-sampling technique. J. Artif. Intell. Res. 16, 321–357. doi: 10.1613/jair.953
Choi, T., Lee, D., Jung, Y., and Choi, H. -J. (2022). “Multivariate time-series anomaly detection using SeqVAE-CNN hybrid model,” in 2022 International Conference on Information Networking (ICOIN) (Jeju-si: Republic of, 2022), 250–253. doi: 10.1109/ICOIN53446.2022.9687205
Gan, C., Wang, N., Yang, Y., Yeung, D. Y., and Hauptmann, A. G. (2015). “DevNet: a deep event network for multimedia event detection and evidence recounting,” in 2015 IEEE Conference on Computer Vision and Pattern Recognition (CVPR) (Boston, MA: IEEE), 2568–2577.
Gao, F., Li, J., Cheng, R., Zhou, Y., and Ye, Y. (2021). ConNet: deep semi-supervised anomaly detection based on sparse positive samples. IEEE Access 9, 67249–67258. doi: 10.1109/ACCESS.2021.3077014
Geiger, A., Liu, D., Alnegheimish, S., Cuesta-Infante, A., and Veeramachaneni, K. (2020). “TadGAN: time series anomaly detection using generative adversarial networks,” in 2020 IEEE International Conference on Big Data (Big Data) (Atlanta, GA: IEEE), 33–43.
Guillermo, C., Lopez-Martin, M., and Carro, B. (2019). Adversarial environment reinforcement learning algorithm for intrusion detection. Comput. Netw. 96–109. doi: 10.1016/j.comnet.2019.05.013
Helwig, N., Pingnalli, E., and Schütze, A. (2015). Detecting and compensating sensor faults in a hydraulic condition monitoring system. Sensor 2015, 616–646. doi: 10.5162/sensor2015/D8.1
Heras, J. A., and Donati, A. (2014). Enhanced telemetry monitoring with novelty detection. AI Mag. 35, 37–46. doi: 10.1609/aimag.v35i4.2553
Huang, R., Cui, C., Sun, W., and Towey, D. (2020). “Poster: is euclidean distance the best distance measurement for adaptive random testing?” in 2020 IEEE 13th International Conference on Software Testing, Validation and Verification (ICST) (Porto: IEEE).
Kim, H. -J., Lee, J., Park, C., and Park, J. -G. (2021). “Network anomaly detection based on GAN with scaling properties,” in 2021 International Conference on Information and Communication Technology Convergence (ICTC) (Jeju Island: IEEE), 1244–1248.
Kingma, D. P., Rezende, D. J., Mohamed, S., and Welling, M. (2014). Semi-supervised learning with deep generative models. NIPS 4, 3581–3589. doi: 10.48550/arXiv.1406.5298
Li, Y., Chen, Z., and Zha, D. (2020). AutoOD: automated outlier detection via curiosity-guided search and self-imitation learning. arXiv:2006.11321 [cs.LG]. doi: 10.48550/arXiv.2006.11321
Liu, F. T., Ting, K. M., and Zhou, Z. H. (2012). Isolation-based anomaly detection.isolation-based anomaly detection. ACM Trans. Knowl. Discov. Data 6, 39. doi: 10.1145/2133360.2133363
Ma, X., and Shi, W. (2020). AESMOTE: adversarial reinforcement learning with SMOTE for anomaly detection. IEEE Trans. Network Sci. Eng. 8, 943–956. doi: 10.1109/TNSE.2020.3004312
Maale, L., Snderby, C. K., Snderby, S. K., and Winther, O. (2016). Auxiliary deep generative models. arXiv:1602.05473 [stat.ML]. doi: 10.48550/arXiv.1602.05473
Malhotra, P., Ramakrishnan, A., Anand, G., Vig, L., Agarwal, P., and Shroff, G. (2016). Lstm-based encoder-decoder for multi-sensor anomaly detection. arXiv 2016, arXiv:1607.00148. doi: 10.48550/arXiv.1607.00148
Markus, M. B., Kriegel, H. P., and Ng, R. T. (2000). LOF: Identifying density-based local outliers. ACM Sigmod Record 29, 93–104. doi: 10.1145/335191.335388
Mnih, V., Kavukcuoglu, K., Silver, D., Graves, A., Antonoglou, I., Wierstra, D., et al. (2013). Playing atari with deep reinforcement learning. arXiv:1312.5602 [cs.LG]. doi: 10.48550/arXiv.1312.5602
Pang, G., Cao, L., Chen, L., and Liu, H. (2018). “Learning representations of ultrahigh-dimensional data for random distance-based outlierdetection,” in KDD (New York, NY: Association for Computing Machinery). 2041–2050.
Pang, G., Hengel, A., Shen, C., and Cao, L. (2020). Toward deep supervised anomaly detection: reinforcement learning from partially labeled anomaly data.knowledge discovery and data mining. ACM 2020, 3467417. doi: 10.1145/3447548.3467417
Pang, G., Shen, C., and van den Hengel, A. (2019). “Deep anomaly detection with deviation networks,” in Proceedings of the 25th ACM SIGKDD International Conference on Knowledge Discovery and Data Mining (KDD '19) (New York, NY: Association for Computing Machinery), 353–362.
Park, D., Kim, H., Hoshi, Y., Erickson, Z., Kapusta, A., and Kemp, C. C. (2017). “A multimodal execution monitor with anomaly classification for robot-assisted feeding,” in 2017 IEEE/RSJ International Conference on Intelligent Robots and Systems (IROS) (Vancouver, BC: IEEE), 5406–5413.
Ruff, L., Vandermeulen, R. A., and Görnitz, N. (2019). Deep Semi-supervised anomaly detection..international conference on learning representations. arXiv:1906.02694 [cs.LG]. doi: 10.48550/arXiv.1906.02694
Sahal, R., Breslin, J. G., and Ali, M. I. (2020). Big data and stream processing platforms for industry 4.0 requirements mapping for a predictive maintenance use case. J. Manuf. Syst. 54, 138–151. doi: 10.1016/j.jmsy.2019.11.004
Su, Y., Zhao, Y., Niu, C., Liu, R., and Pei, D. (2019). “Robust anomaly detection for multivariate time series through stochastic recurrent neural network,” in Proceedings of the 25th ACM SIGKDD International Conference on Knowledge Discovery and Data Mining (KDD '19), 2828–2837.
Sutton, R., and Barto, A. (1998). Reinforcement learning: an introduction. IEEE Trans. Neural Netw. 9, 1054. doi: 10.1109/TNN.1998.712192
Tenenbaum, J. B., Silva, V. D., and Langford, J. C. (2000). A global geometric framework for nonlinear dimensionality reduction. Science 290, 2319–2323. doi: 10.1126/science.290.5500.2319
Valenzuela, J., Wang, J., and Bissinger, N. (2013). Real-time intrusion detection in power system operations. IEEE Trans. Power Syst. 28, 1052–1062. doi: 10.1109/TPWRS.2012.2224144
Vinod, N., and Hinton, G. E. (2010). “Rectified linear units improve restricted boltzmann machines,” in ICML (Madison, WI: Omnipress) 807–814.
Volodymyr, M., Kavukcuoglu, K., Silver, D., Rusu, A. A., Veness, J., Bellemare, M. G., et al. (2015). Human-level control through deep reinforcement learning. Nature 518, 529–533. doi: 10.1038/nature14236
Wang, L., Tan, H., Zhou, F., Zuo, W., and Sun, P. (2022). Unsupervised anomaly video detection via a double-flow ConvLSTM variational autoencoder. IEEE Access 10, 44278–44289. doi: 10.1109/ACCESS.2022.3165977
Willetts, M., Roberts, S., and Holmes, C. (2020). “Semi-unsupervised learning: Clustering and classifying using ultra-sparse labels,” in Proceedings of 2020 IEEE International Conference on Big Data (Big Data) (Atlanta, GA: IEEE), 5286.
Wu, Z., Xu, H., Wang, Y., and Wang, Y. (2021). “Surrogate supervision-based deep weakly-supervised anomaly detection,” in 2021 International Conference on Data Mining Workshops (ICDMW) (Auckland), 975–982. doi: 10.1109/ICDMW53433.2021.00127
Xie, Q., Zhang, D., Yu, B., and Choi, J. (2022). Semisupervised training of deep generative models for high-dimensional anomaly detection. IEEE Trans. Neural Netw. Learn. Syst. 33, 2444–2453. doi: 10.1109/TNNLS.2021.3095150
Xu, H., Feng, Y., Chen, J., Wang, Z., Qiao, H., and Chen, W. (2018). Unsupervised anomaly detection via variational auto-encoder for seasonal KPIs in web applications. arXiv:1802.03903 [cs.LG]. doi: 10.1145/3178876.3185996
Ya, S., Zhao, Y., Niu, C., Liu, R., Sun, W., and Pei, D. (2019). “Robust anomaly detection for multivariate time series through stochastic recurrent neural network,” in Proceedings of the 25th ACM SIGKDD International Conference on Knowledge Discovery and Data Mining (KDD '19) (New York, NY; Association for Computing Machinery) 2828–2837.
Keywords: fault detection, weakly supervised, reinforcement learning, neural network, agent, reward, strategy function, DQN
Citation: Junhuai L, Yunwen W, Huaijun W and Jiang X (2023) Fault detection method based on adversarial reinforcement learning. Front. Comput. Sci. 4:1007665. doi: 10.3389/fcomp.2022.1007665
Received: 30 July 2022; Accepted: 29 December 2022;
Published: 25 January 2023.
Edited by:
Guiming Luo, Tsinghua University, ChinaReviewed by:
Radhya Sahal, Independent Researcher, Cork, IrelandShi Tang, Tsinghua University, China
Yan Hou, Tsinghua University, China
Copyright © 2023 Junhuai, Yunwen, Huaijun and Jiang. This is an open-access article distributed under the terms of the Creative Commons Attribution License (CC BY). The use, distribution or reproduction in other forums is permitted, provided the original author(s) and the copyright owner(s) are credited and that the original publication in this journal is cited, in accordance with accepted academic practice. No use, distribution or reproduction is permitted which does not comply with these terms.
*Correspondence: Wang Huaijun,  d2FuZ2h1YWlqdW5AeGF1dC5lZHUuY24=
 Li Junhuai
 Wu Yunwen
 Wang Huaijun1*