 Nicolas Chiaruttini
 Olivier Burri
 Peter Haub2
 Romain Guiet
 Arne Seitz
94% of researchers rate our articles as excellent or good
Learn more about the work of our research integrity team to safeguard the quality of each article we publish.
Find out more
BRIEF RESEARCH REPORT article
Front. Comput. Sci., 05 January 2022
Sec. Computer Vision
Volume 3 - 2021 | https://doi.org/10.3389/fcomp.2021.780026
This article is part of the Research TopicMethods and Tools for Bioimage AnalysisView all 13 articles
Image analysis workflows for Histology increasingly require the correlation and combination of measurements across several whole slide images. Indeed, for multiplexing, as well as multimodal imaging, it is indispensable that the same sample is imaged multiple times, either through various systems for multimodal imaging, or using the same system but throughout rounds of sample manipulation (e.g. multiple staining sessions). In both cases slight deformations from one image to another are unavoidable, leading to an imperfect superimposition Redundant and thus a loss of accuracy making it difficult to link measurements, in particular at the cellular level. Using pre-existing software components and developing missing ones, we propose a user-friendly workflow which facilitates the nonlinear registration of whole slide images in order to reach sub-cellular resolution level. The set of whole slide images to register and analyze is at first defined as a QuPath project. Fiji is then used to open the QuPath project and perform the registrations. Each registration is automated by using an elastix backend, or semi-automated by using BigWarp in order to interactively correct the results of the automated registration. These transformations can then be retrieved in QuPath to transfer any regions of interest from an image to the corresponding registered images. In addition, the transformations can be applied in QuPath to produce on-the-fly transformed images that can be displayed on top of the reference image. Thus, relevant data can be combined and analyzed throughout all registered slides, facilitating the analysis of correlative results for multiplexed and multimodal imaging.
Whole slide imaging (WSI) is the process of acquiring images of tissue sections. It is typically realized in a line or a tile by tile scanning fashion in order to allow the imaging and visualization of samples exceeding the field of view of a conventional light microscope setup. Most of the commercially available systems accommodate at least two modalities: brightfield and fluorescence imaging. Within the last decade WSI turned out to become more and more important in pathology (Aeffner et al., 2019; Zarella et al., 2019) as well as in fundamental research.
Image processing of WSI images is challenging in many ways, in particular when aiming to register images from different modalities. Images often consist of gigapixel 2D planes, and matching correctly one slide to another usually requires a deformation more complex than a single affine transformation. Besides pure technical problems, life scientists face practical challenges if they want to use published methods. For instance, a grand challenge of non-linear image registration has been performed in 2018 (Borovec et al., 2020). However, it proved very difficult to apply any of the more successful methods, either because they were closed source or because the necessary documentation was not readily available. Moreover, very often a file conversion step is required in order to plug images in these workflows, and an extra effort is required to get the registration result in a usable way for downstream analysis. In short, the quality of the multi-modal registration algorithm is only one factor among many others influencing the adoption/popularity of an imaging analysis workflow.
Based on our group’s experience as a microscopy core facility imaging, the following combination of requirements is until now not met for non-linear WSI registration: open-source, easy to install, capable to read and display multiresolution image files without conversion, capable to freely deform and interactively display deformed images, giving reasonably fast and accurate results, and compatible with a modular and powerful analysis platform.
The individual tasks and requirements mentioned above are however met in different pieces of software:
• For multiresolution file format reading, the OME consortium has built a library, Bio-Formats (Linkert et al., 2010), which can read more than a hundred microscopy oriented file formats. Some formats are unfortunately incompatible with Bio-Formats (3D HISTECH .mrxs) or are not multiresolution (Leica .lif). In these cases file conversion is unfortunately still required to be compatible with open source solutions. If one wants to use open source solutions for data analysis, the output file format should be carefully considered when deciding to buy new instruments.
• QuPath (Bankhead et al., 2017) is a very popular and powerful software for WSI analysis. It supports Bio-Formats multiresolution API, is user interactive, open-source, easy to install, and has powerful analysis capacities, furthermore customizable through scripting.
• Thanks to the ImgLib2 (Pietzsch et al., 2012) library and BigDataViewer (Pietzsch et al., 2015), the open-source ImageJ/Fiji (Schindelin et al., 2012) software can arbitrarily deform, slice and display big images. Among many other plugins of the BigDataViewer ecosystem, BigWarp (Bogovic et al., 2016) can be used to perform manual registration of multiresolution datasets.
• For automated multi-modal registration, many open source libraries exist. We decided to use the powerful and well-established elastix library (Klein et al., 2010; Shamonin, 2013). Elastix is well documented and provides flexibility in terms of registration possibilities, transformation models (affine, spline, etc.), optimizer settings and resolution.
In the following we present a fast and easy to use workflow for whole slide image registration. QuPath, a widely used open-source project for whole slide image display and analysis, serves as the entry point and can be used for further downstream analysis after the registration. This workflow is targeted towards life scientists lowering the entry barrier for whole slide registration and making it more user-friendly and reproducible.
As mentioned above, all the core open source elements needed to build a non-linear WSI registration workflow already exist, however, they do suffer from a lack of interoperability. For instance elastix is a C++ library with python wrappers, without pre-compiled Java wrappers. Moreover, while Fiji and QuPath are both Java-based software, they are incompatible in terms of Java versions. It is difficult however to find and allocate resources in order to make the connections between these components. Nevertheless, bridging these components is needed for life scientists, and this work is the result of such an effort. To bring these components together and provide a complete WSI non-linear registration workflow, the following missing components have been identified and implemented:
• A Fiji/BigDataViewer opener for QuPath projects
• Support of Bio-Formats multi-resolution API for BigDataViewer
• Fiji plugins to bridge elastix and Fiji
• A way to apply, store and reopen the deformation function which makes the correspondence between coordinates of registered images.
This work provides these missing pieces and thus closes the gap to a complete open-source workflow for non-linear WSI registration. It starts from the opening/display/definition of the images down to providing modular tools for the analysis in QuPath. An overview of the workflow is presented in Figure 1, as well as the locations of the missing components that were needed to make it work.
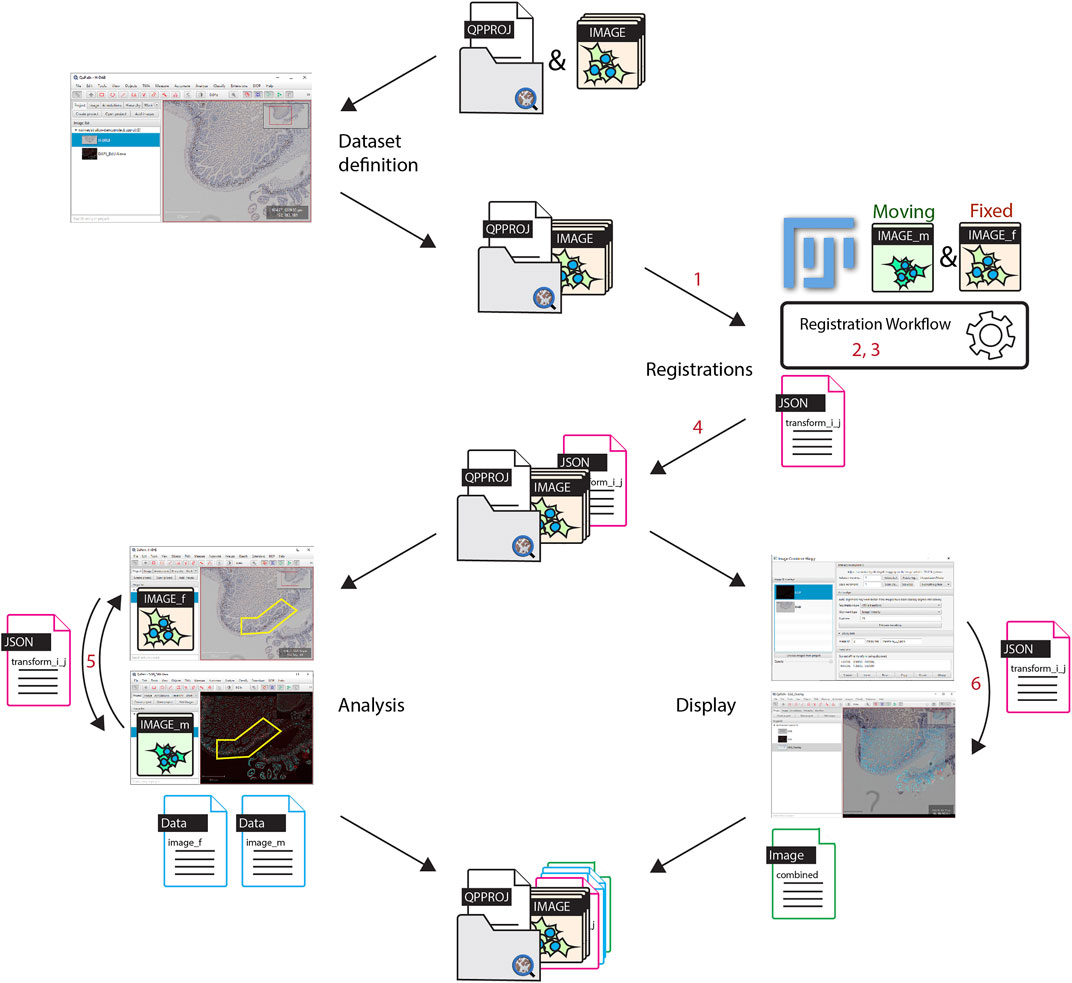
FIGURE 1. Workflow overview. The set of images to be registered are all put into a single QuPath project. Registrations are performed in Fiji, images are opened from a QuPath project and each registration result is stored as a file within the Redundant project entry folder. For the analysis, thanks to the registration result found between two images, regions of interest can be transferred in QuPath from one image to another, in order to generate correlated data. It is additionally possible to create a new combined image within QuPath. Software components implemented for the workflow are labelled in red. 1: opening QuPath project in BigDataViewer; 2: registering workflow in Fiji, 3: bridging Fiji and elastix; 4: Exporting of transformation file; 5: transferring object from one image to another; 6: generation of combined registered images in QuPath.
In short, all images which need to be registered need to be put into a single QuPath project, which is then opened in BigDataViewer. The reference image is used to align and transform all the other images. The non-reference images will be referred to as the moving images. Pairs of reference and moving images are then registered within Fiji, and transformations are exported to QuPath. The analysis and correlation between images can be performed in QuPath by transforming regions either towards the reference or the moving image. It is also possible to generate an image combining the reference and registered images into a new QuPath entry.
The registration workflow, which happens within Fiji is described in Figures 2A,B. In brief: for each pair of images that needs to be registered, the user has to choose the reference image and then select among 4 (optional) successive registration steps: rigid manual B.1—affine auto B.2—spline auto B.3 (based on landmarks)—spline manual B.4.
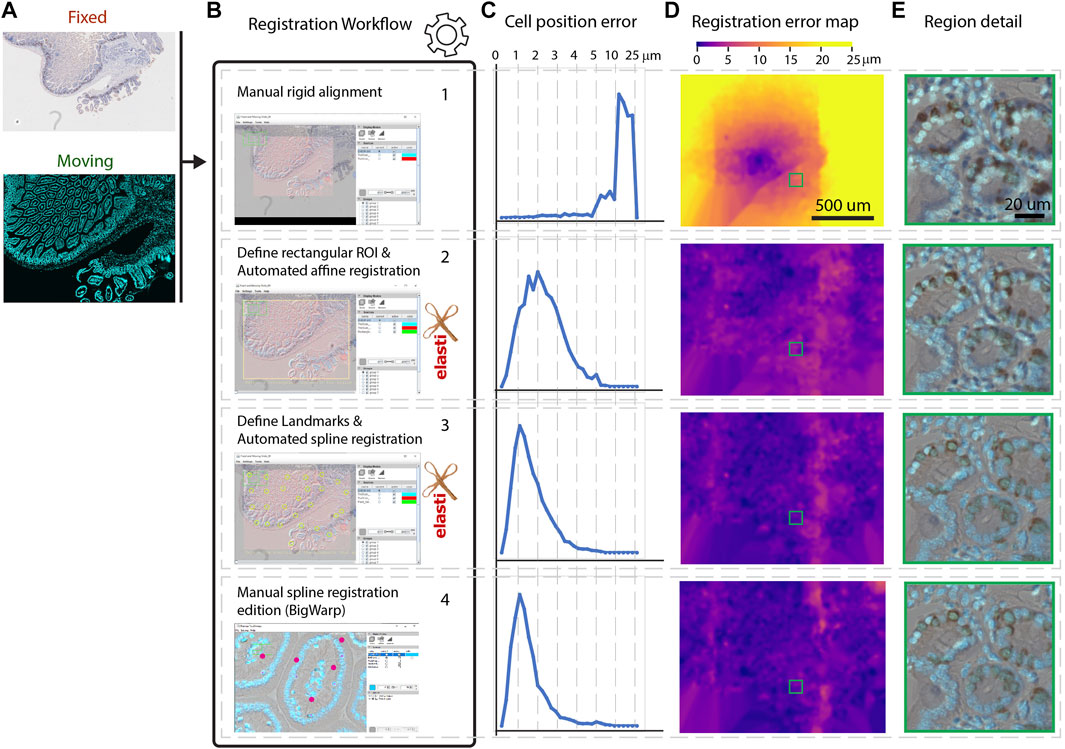
FIGURE 2. Registration workflow steps and registration accuracy. (A) Overview of the whole slide images used for the registration. Moving image: fluorescent image, dividing cells labeled with Alexa555. Fixed image: IHC image, dividing cells stained with DAB. (B). All consecutive optional steps of the registration workflow are used. Images are screenshots of the user interface at these steps. (C). Distribution of landmarks placement error throughout the workflow steps. The x-axis is not linear after 5 µ in order to display all the distribution. (D). Registration error map during workflow steps of the moving image. One typical region set is shown in panel (E).
Step 1. is a manual rigid registration step which is required if the images are not approximately aligned initially. This may happen because Bio-Formats uses the stage location of the microscope to position the images in physical space. If the images to register originate from the same microscope, keeping this offset may be helpful. In other cases, there’s a chance that images won’t overlap at all. The Bio-Formats induced offset can thus be removed at the start of the workflow, and the user can furthermore rigidly move the moving image to improve the alignment before resuming the next steps.
Step 2. consists of an automated affine registration with elastix (see elastix parameters in Supplementary Appendix 1). Since the images are expected to be very large, this affine registration is performed on images that are first resampled at 10 µm per pixel within a rectangular region of the physical space. The moving and the fixed image may cover different physical areas, as in Figure 2A. In the user interface, a rectangular region covering entirely both images is first suggested to the user. This first guess can be modified interactively and thus modified if necessary.
Step 3. consists of a semi automated spline registration. For this step, a set of user-defined patches are each registered automatically in an affine manner (using the same elastix parameters as step 2). With the default parameters, each patch is a 500 × 500 µm area resampled at 1 µm per pixel. This xy sampling is typically sufficient for images from histological slides where objectives often have a numerical aperture below 1.0. For an accurate registration, these patches should be content-rich, and approximately correctly aligned, a condition met if the first coarse registration is successful. To extend the patches registration over the whole image, only the location of the central point (moving/fixed) of each patch is kept to build a landmark based registration. These points are used to extrapolate the transformation over the whole slide using B-Splines of the ImgLib2 library, as in the BigWarp plugin (Bogovic et al., 2016). We therefore assume a continuity in the deformation field beyond the user-defined patches. This has two advantages: 1—only sub-regions of the images have to be loaded, increasing the speed of the workflow; 2—if the user uses well defined sparse regions, the registration will be robust to missing tissue regions. Performing sparse registrations however has a disadvantage: a discontinuous deformation (for instance with an object split in two shifted rigid parts) will be ill registered.
Step 4. consists of manual spline correction. This step calls the BigWarp plugin (Bogovic et al., 2016) with pre-registered images from the previous steps. If an automated spline registration has been performed (Step 3), BigWarp is initialized with the registered landmarks positioned from the previous step. This allows the user to correct the output of the automated spline, as well as to add new landmarks to be more precise in some particular regions, if needed. Providing a way to manually edit the result of an automated workflow can save a significant amount of time when the automation quality is not sufficient for a particular task. This BigWarp manual registration part can be repeated many times in case several rounds of manual corrections are needed. In this case, the previous registration is loaded into BigWarp as the initial state which can be modified and resaved.At the end of the workflow, a transformation file defining how coordinates can be converted from the moving image to the reference image is stored within the QuPath reference image entry folder.In order to demonstrate the performance of this workflow, we applied these four consecutive steps on a test dataset. It consists of a section of a fixed mouse duodenum. Dividing cells have been stained consecutively with two different methods. The fluorescence based 5-Ethynyl-2′-deoxyuridine (EdU) staining with click chemistry was followed by a 3,3′-Diaminobenzidine (DAB) revealing using Anti-Bromodeoxyuridine (BrdU) antibodies, leading to the immunohistochemistry (IHC) image. Each staining step required manipulation of the sample (see materials and methods). This sample requires alignment and registration because it consists of two multi modal images (one fluorescent, one IHC) where different zones of the sample were imaged, with different cameras, and some stitching artefacts are present. However, note that the exact same cells are imaged in the different modalities, which is a requirement for this workflow (i.e. it has not been tested for serial sections). Since the same (dividing) cells are targeted in both images, we expect a very good match between the positively detected cells in both modalities.To assess the quality of the registration in the different steps of the workflow we compare against a ground-truth registration using BigWarp by identifying and placing more than 3,000 landmarks manually, covering the whole slide on identifiable features, in most of the cases individual cells. Making the ground truth required around 6 h of work. Note that on average the uncertainties on the placement of landmarks for the ground truth is of about 1 µm, leading to some uncertainties even in the deformation ground truth.We then assessed the quality of the registration at each step of the workflow, by computing the distance of these landmarks to their target location in the ground truth (Figure 2C.). Figure 2D shows errors map throughout the steps: how far each landmark is to its ground truth is color coded and displayed in the coordinates of the moving image. A typical zoomed in region is displayed in Figure 2E for all successive steps.In step 1, we can see that a 10 µm shift is present and this is clearly not precise enough for individual cells to match. Conversely, as in the ground truth, it is hard to distinguish meaningful differences when landmarks are less than 2 µm from their ground truth location.Based on Figures 2C–E, we can conclude that an automated affine registration already brings good global positioning, since the vast majority of landmarks are positioned within 5 µm of error. The automated spline registration, which has been performed with 32 manually placed landmarks, greatly improves the quality of the registration, since 90% of the cells now have an error below 3 µm. Spending additional time to manually fix registration mismatch in some regions improves the overall registration quality further (92% of the cells have an error below 3 µm). In terms of timing, the automated part of the workflow (steps 2 and 3) takes around 2 min on a 4 core entry-level laptop. 5 additional minutes were needed to perform the corrections during step 4.Figure 3 summarizes how the registration output can be easily plugged into QuPath in order to further analyze the registered images. We first annotated a region hosting most of the dividing cells in the fluorescent (moving) image. We segmented all cells (4,393) within this region using the DAPI channel of the fluorescent image (moving) by using Stardist in its default versatile 2D fluorescent model (Schmidt et al., 2018; Weigert et al., 2020). Thanks to the generated transformation file, the annotations and detections can be transformed and transferred to their target location in the (fixed) DAB image (Figure 3A). Cell properties can then be measured and compared between both images. We choose to segment cells in the fluorescence channel since it is easier to discriminate cells in the DAPI modality. We are thus transferring cell regions of interest (ROIs) from the moving image to the fixed image. Note that the deformation computed in this workflow is invertible, meaning that it is also possible to segment cells regions in the fixed image and then transfer them to the moving image.For downstream analysis in QuPath, we decided to provide a way to transform a region of interest from one slide to another. Since regions of interest are defined with double precision coordinates, very little precision is lost when transforming coordinates. Conversely, generating a transformed image in QuPath creates some interpolation artefacts due to the pixel-based resampling. However, it may be useful to display transformed images over the reference image, e.g. for display and presentation purposes. This can be done with an additional QuPath extension provided in this workflow, called Image Combiner Warpy. With this tool, the transformed images can be overlaid on top of the reference image, based on the transform files and by using various possible sampling methods. Since this overlay process creates only one additional QuPath project entry, using the existing image data, it is executed almost immediately, with no delay time. If effects due to sampling artifacts do not matter, the combined image can be used for analysis in QuPath, including the transformed channels as well as the reference channel. If computation time and storage space are not an issue, and availability as a whole slide image file is important, the combined image project can be fully computed and resaved from within QuPath, for example as an OME tiff.In Figure 3B, we assessed how the correlative measurements performed on cells are varying when each successive step of the workflow is applied (using transferred ROIs). We expect most DAB positive cells to be also positive for the fluorescent EdU stain, since both staining are for dividing cells. If each cell region is correctly transferred, we expect many double positive cells (EdU+/DAB+). To decide whether a cell is positive for DAB, we detected cells in the DAB image and found that a threshold of 0.18 OD in DAB is accurately discriminating dividing cells from non-dividing ones. We proceeded similarly for the fluorescence image and set a threshold of 18 for the mean fluorescence over each detected cell region. If cell regions are incorrectly transferred, very little correlation between stains should be observed. Throughout each step of the workflow we then plot the mean DAB optical density versus the mean fluorescence EdU intensity per individual cell. These graphs allow counting cells which are considered to be dividing cells for both modalities (EdU+/DAB+), non-dividing in both modalities (EdU−/DAB−), and which give different outcomes based on the modalities (EdU+/DAB−) and (EdU−/DAB+).We assess the distance of a registration to the ground truth by counting the number of cells which differ in this count (Table 1). In agreement with the quality of the registration shown in Figure 2, adding more registration steps reduces the difference to the ground truth. Relying only on a manual rigid registration is unsuitable for quantification in this case. The last step in the workflow (spline manual registration) is only giving a minor improvement (changing the classification of only 10 cells among 4,300) and might be omitted in some cases.In summary the comparison of the DAB with the fluorescence images demonstrate that this workflow is able to reach high quality registration. Only 1.5% (12 out of 790) of the double positive cells were missed due to alignment errors.
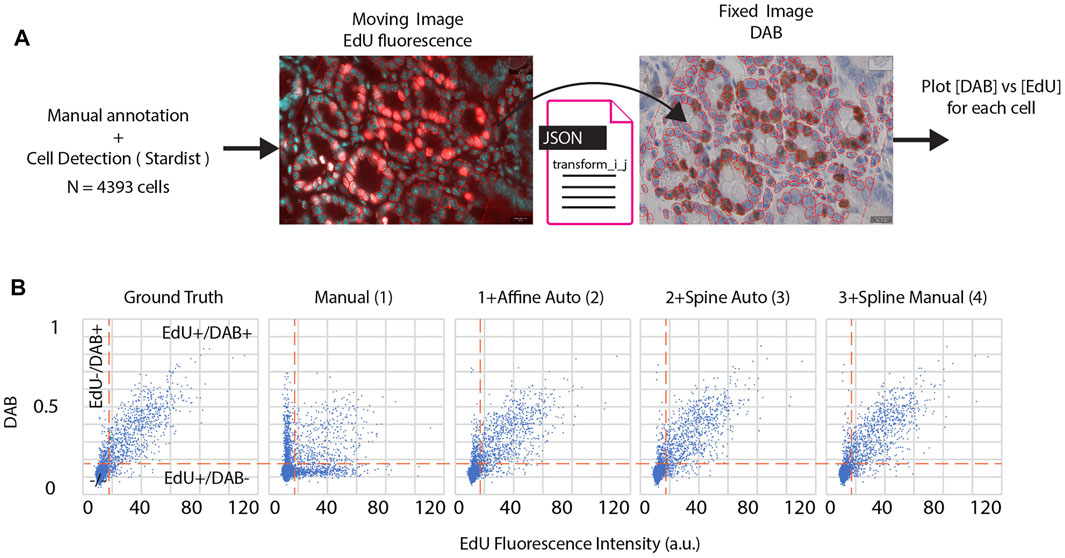
FIGURE 3. (A) The EdU fluorescence image (moving image) is annotated and cells are detected thanks to the DAPI stain within a region of interest. Cells detected in the fluorescence image are transferred to the DAB image (fixed image), using a specific registration result file. Since the transformation is invertible, it would have been possible to segment cells in the DAB image and transfer cells to the fluorescent image.(B). Each cell property for each image can be measured and combined during downstream analysis. Scatter plots of 4,393 detected cells, X: mean fluorescence EdU intensity, Y: mean DAB optical density. Each plot corresponds to a specific transform file, respectively from left to right: - manual annotation of 3,000 + landmarks (ground truth) - manual rigid transformation 1)—manual rigid transformation + automated affine transformation 2)—all steps in 2) + automated spline transformation 3)—all steps in 3) + manual spline transformation 4). Vertical dashed lines: fluorescence threshold (18 a.u.) separating EdU + cells from EdU- cells. Horizontal dashed lines: DAB OD threshold (0.18) separating DAB + cells from DAB- cells.
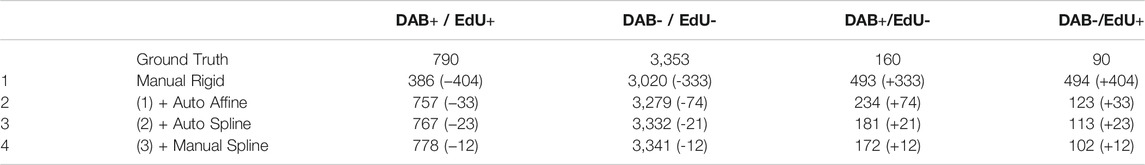
TABLE 1. Comparison of cell classes depending on registration procedure. Counting of cell DAB/EdU classes (+/+, −/−, +/−, −/+) for the ground truth and for the different registration methods used (see Figure 3). In parenthesis is shown the excess or deficit of cells being counted when compared to ground truth. A lower number in absolute value means a result being closer to the one obtained with the ground truth deformation field.
This workflow has been tested for the applications achieving multiplexing by imaging the same sample through several rounds of staining. As the physical size of the image and the target resolution are known, reasonable default parameters for elastix can be used providing a user interface which is almost parameter free. This is particularly important as parameter fine tuning is cumbersome and challenging for non-experts. Omitting this step clearly lowers the entry barrier for the broader life-science community.
Until now this workflow has not been tested for the registration of serial sections where cellular matching from one slice to the next cannot be expected. Conversely in its present form this workflow is not of sufficient precision to match small sub cellular structures, such as membranous organelles. However, due to its modular design, this workflow can be adapted either by using different alignment parameters or by using other alignment methods, opening the way to support other use cases. In particular, elastix is the library we chose for registrations, but other libraries exist, including ones which are only available in python. By using PyImageJ (Rueden et al., 2021), we should be able to integrate cutting edge registration methods into this workflow.
We implemented a workflow for semi-automated non-linear WSI registration which requires minimal user input and can be realized in a few minutes per slide. It facilitates the registration of images for all applications where multiplexing is achieved via several rounds of staining. The performance is almost identical to that of a registration workflow based on manual annotation, but requires far fewer landmarks with the advantages of omitting the time consuming and tedious task of finding landmarks. Therefore it can save several hours of human annotation workload. Thanks to its modular design, it will be extended in the future to support other registration methods and other use cases, such as serial sections alignment (between them or with an atlas) and CLEM.
Sample used for the demo registration (https://doi.org/10.5281/zenodo.5674521 : Mouse duodenum fixed in 4% PFA overnight at 4°C, processed for paraffin infiltration using a standard histology procedure and cut at 4 microns were dewaxed, rehydrated, permeabilized with 0.5% Triton X-100 in PBS 1x and stained with Azide - Alexa Fluor 555 (Thermo Fisher) to detect EdU and DAPI for nuclei. The images were taken using a Leica DM5500 microscope with a PL Fluotar 40X N.A.1.0 oil objective (grayscale CCD camera: DFC350FXR2, pixel dimension: 0.161 µm). Next, the slide was unmounted and stained using the fully automated Ventana Discovery xT autostainer (Roche Diagnostics, Rotkreuz, Switzerland). All steps were performed on automate with Ventana solutions. Sections were pretreated with heat using the CC1 solution under mild conditions. The primary rat anti BrDU (clone: BU1/75 (ICR1), Serotec, diluted 1:300) was incubated 1 h at 37°C. After incubation with a donkey anti rat biotin diluted 1:200 (Jackson ImmunoResearch Laboratories), chromogenic revelation was performed with DabMap kit. The section was counterstained with Harris hematoxylin (J.T. Baker) before a second round of imaging on DM5500 PL Fluotar 40X N.A.1.0 oil (RGB camera: DFC 320 R2, pixel dimension: 0.1725 µ). Before acquisition, a white-balance as well as a shading correction is performed according to Leica LAS software wizard. The fluorescence and DAB images were converted in ome.tiff multiresolution file with the kheops Fiji Plugin (Guiet et al., 2021).
All the tutorials (written and video) necessary to apply the workflow in practice are accessible in https://c4science.ch/w/warpy/ .
The dataset presented in this study can be found in an online repository: https://doi.org/10.5281/zenodo.5674521. Tutorials and links to the code repositories can be found in the documentation at https://c4science.ch/w/warpy/.
The studies involving animals were reviewed and approved by the cantonal veterinary authority (authorization number VD1890.2).
RG and JS-D designed and RG imaged the demo sample. NC and OB wrote the Warpy code. PH wrote the Image Combiner Warpy code. NC performed the data analysis. NC, PH, AS and RG wrote the manuscript.
The authors declare that the research was conducted in the absence of any commercial or financial relationships that could be construed as a potential conflict of interest.
All claims expressed in this article are solely those of the authors and do not necessarily represent those of their affiliated organizations, or those of the publisher, the editors, and the reviewers. Any product that may be evaluated in this article, or claim that m ay be made by its manufacturer, is not guaranteed or endorsed by the publisher.
The histology data was prepared at the EPFL Histology Core Facility. We thank Nathalie Müller and Gian-Filippo Mancini for the preparation of the samples. We thank the Fiji and QuPath open source community for the continuous support they offer, especially Pete Bankhead, John Bogovic, Christian Tischer, Jan Eglinger and Curtis Rueden.
The Supplementary Material for this article can be found online at: https://www.frontiersin.org/articles/10.3389/fcomp.2021.780026/full#supplementary-material
Aeffner, F., Zarella, M., Buchbinder, N., Bui, M., Goodman, M., Hartman, D., et al. (2019). Introduction to Digital Image Analysis in Whole-Slide Imaging: A white Paper from the Digital Pathology Association. J. Pathol. Inform. 10, 9. doi:10.4103/jpi.jpi_82_18
Bankhead, P., Loughrey, M. B., Fernández, J. A., Dombrowski, Y., McArt, D. G., Dunne, P. D., et al. (2017). QuPath: Open Source Software for Digital Pathology Image Analysis. Sci. Rep. 7, 16878. doi:10.1038/s41598-017-17204-5
Bogovic, J. A., Hanslovsky, P., Wong, A., and Saalfeld, S. (2016). “Robust Registration of Calcium Images by Learned Contrast Synthesis,” in 2016 IEEE 13th International Symposium on Biomedical Imaging (ISBI), Prague, Czech Republic, 13-16 April 2016, 1123–1126. doi:10.1109/ISBI.2016.7493463
Borovec, J., Kybic, J., Arganda-Carreras, I., Sorokin, D. V., Bueno, G., Khvostikov, A. V., et al. (2020). ANHIR: Automatic Non-rigid Histological Image Registration Challenge. IEEE Trans. Med. Imaging 39, 3042–3052. doi:10.1109/TMI.2020.2986331
Guiet, R., Chiaruttini, N., Eglinger, J., and Burri, O. (2021). BIOP/ijp-kheops: Zenodo Release. doi:10.5281/ZENODO.5256256
Klein, S., Staring, M., Murphy, K., Viergever, M. A., and Pluim, J. (2010). Elastix: A Toolbox for Intensity-Based Medical Image Registration. IEEE Trans. Med. Imaging 29, 196–205. doi:10.1109/TMI.2009.2035616
Linkert, M., Rueden, C. T., Allan, C., Burel, J.-M., Moore, W., Patterson, A., et al. (2010). Metadata Matters: Access to Image Data in the Real World. J. Cel Biol. 189, 777–782. doi:10.1083/jcb.201004104
Pietzsch, T., Preibisch, S., Tomančák, P., and Saalfeld, S. (2012). ImgLib2-generic Image Processing in Java. Bioinformatics 28, 3009–3011. doi:10.1093/bioinformatics/bts543
Pietzsch, T., Saalfeld, S., Preibisch, S., and Tomancak, P. (2015). BigDataViewer: Visualization and Processing for Large Image Data Sets. Nat. Methods 12, 481–483. doi:10.1038/nmeth.3392
Rueden, C., Evans, E., Yang, L., Pinkert, M., Liu, Y., Hiner, M., et al. (2021). Imagej/Pyimagej: v1.0.2 Zenodo. doi:10.5281/ZENODO.5537065
Schindelin, J., Arganda-Carreras, I., Frise, E., Kaynig, V., Longair, M., Pietzsch, T., et al. (2012). Fiji: an Open-Source Platform for Biological-Image Analysis. Nat. Methods 9, 676–682. doi:10.1038/nmeth.2019
Schmidt, U., Weigert, M., Broaddus, C., and Myers, G. (2018). “Cell Detection with Star-Convex Polygons,” in Medical Image Computing and Computer Assisted Intervention – MICCAI 2018 Lecture Notes in Computer Science. Editors A. F. Frangi, J. A. Schnabel, C. Davatzikos, C. Alberola-López, and G. Fichtinger (Cham: Springer International Publishing), 265–273. doi:10.1007/978-3-030-00934-2_30
Shamonin, D. (2013). Fast Parallel Image Registration on CPU and GPU for Diagnostic Classification of Alzheimer's Disease. Front. Neuroinform. 7. doi:10.3389/fninf.2013.00050
Weigert, M., Schmidt, U., Haase, R., Sugawara, K., and Myers, G. (2020). “Star-convex Polyhedra for 3D Object Detection and Segmentation in Microscopy,” in 2020 IEEE Winter Conference on Applications of Computer Vision (WACV), Snowmass, CO, USA, 1-5 March 2020, 3655–3662. doi:10.1109/WACV45572.2020.9093435
Keywords: ImageJ, Fiji, QuPath, WSI, registration, elastix, BigWarp, BigDataViewer
Citation: Chiaruttini N, Burri O, Haub P, Guiet R, Sordet-Dessimoz J and Seitz A (2022) An Open-Source Whole Slide Image Registration Workflow at Cellular Precision Using Fiji, QuPath and Elastix. Front. Comput. Sci. 3:780026. doi: 10.3389/fcomp.2021.780026
Received: 20 September 2021; Accepted: 25 November 2021;
Published: 05 January 2022.
Edited by:
Florian Levet, UMR5297 Institut Interdisciplinaire de Neurosciences (IINS), FranceReviewed by:
Martin Leonard Jones, Francis Crick Institute, United KingdomCopyright © 2022 Chiaruttini, Burri, Haub, Guiet, Sordet-Dessimoz and Seitz. This is an open-access article distributed under the terms of the Creative Commons Attribution License (CC BY). The use, distribution or reproduction in other forums is permitted, provided the original author(s) and the copyright owner(s) are credited and that the original publication in this journal is cited, in accordance with accepted academic practice. No use, distribution or reproduction is permitted which does not comply with these terms.
*Correspondence: Nicolas Chiaruttini, bmljb2xhcy5jaGlhcnV0dGluaUBlcGZsLmNo; Arne Seitz, YXJuZS5zZWl0ekBlcGZsLmNo
Disclaimer: All claims expressed in this article are solely those of the authors and do not necessarily represent those of their affiliated organizations, or those of the publisher, the editors and the reviewers. Any product that may be evaluated in this article or claim that may be made by its manufacturer is not guaranteed or endorsed by the publisher.
Research integrity at Frontiers
Learn more about the work of our research integrity team to safeguard the quality of each article we publish.