 Jingyao Wu
 Ting Dang
 Vidhyasaharan Sethu
 Eliathamby Ambikairajah
- 1School of Electrical Engineering and Telecommunications, University of New South Wales, Sydney, NSW, Australia
- 2Department of Computer Science and Technology, University of Cambridge, Cambridge, United Kingdom
People perceive emotions via multiple cues, predominantly speech and visual cues, and a number of emotion recognition systems utilize both audio and visual cues. Moreover, the perception of static aspects of emotion (speaker's arousal level is high/low) and the dynamic aspects of emotion (speaker is becoming more aroused) might be perceived via different expressive cues and these two aspects are integrated to provide a unified sense of emotion state. However, existing multimodal systems only focus on single aspect of emotion perception and the contributions of different modalities toward modeling static and dynamic emotion aspects are not well explored. In this paper, we investigate the relative salience of audio and video modalities to emotion state prediction and emotion change prediction using a Multimodal Markovian affect model. Experiments conducted in the RECOLA database showed that audio modality is better at modeling the emotion state of arousal and video for emotion state of valence, whereas audio shows superior advantages over video in modeling emotion changes for both arousal and valence.
1. Introduction
Emotion plays an important role in daily life communications and social interactions (Picard, 2000), and the ability to recognize a person's emotional state is a critical requirement for achieving a more natural human-computer interaction (Cowie et al., 2001). When interacting with each other, people use a range of cues, such as speech patterns, facial expressions, etc. to communicate and recognize emotions. Analogously, Automatic Emotion Recognition (AER) systems based on a myriad of modalities such as speech, text, facial expression, body languages, etc. have been developed (Wu et al., 2014; Avots et al., 2019; Yalamanchili et al., 2021). Among these modalities, audio and visual cues have been most widely studied, which is unsurprising considering that facial and vocal expressions are the most direct and natural modalities by which people communicate emotions (Wu et al., 2014).
The Brunswik's functional lens model may be used to explicitly depict the various elements involved in the communication of emotional states (Zhang and Provost, 2019). As shown in Figure 1, when someone expresses an emotion, this information is carried via multiple modalities (speech and visual expression most commonly). An observer receives all modalities and integrates the information carried in them. While different modalities may contribute differently to the perception of different aspects of emotional state (such as perceiving that the speaker is becoming more aroused vs. perceiving arousal level is high), they are all ultimately combined to provide a unified sense of the ‘recognised' emotional state (Brunswik, 1955; Banse and Scherer, 1996; Zhang and Provost, 2019). The assumption inherent in the previous statement that different aspects of emotions are perceived via differing mechanisms is supported by the observation that when a group of people are all asked to label the evolving emotional state of the same speaker engaged in a conversation, the level of disagreement amongst the raters about change in the emotional state is significantly lower than the level of disagreement about the actual emotion label (Yannakakis et al., 2018).
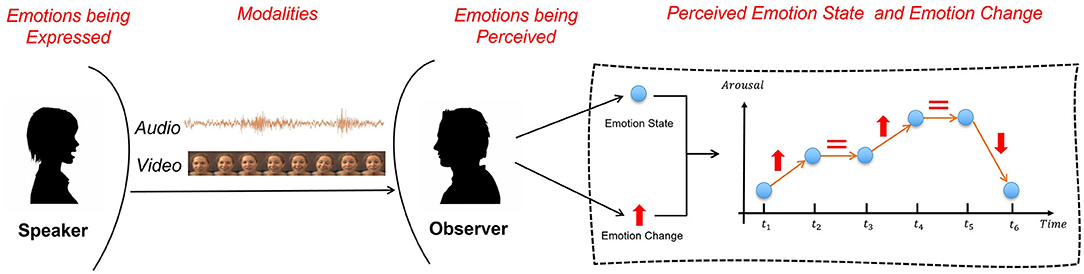
Figure 1. The Brunswik's functional lens model of the emotion expression and perception. The perception of two different aspects of emotion is depicted with the blue dots representing the absolute state at a point in time and the red arrow indicating the change in emotional state from one instance to the next (red equal sign indicates no change in emotion).
Additionally, there is growing interest in the representation and prediction of only the dynamical aspects of emotional state, such as emotion change (Huang and Epps, 2016) and the purely relative labels of emotional state on an ordinal scale (Martinez et al., 2014; Parthasarathy et al., 2017). Despite the recent successes in predicting the emotion states (Kim and Clements, 2015; Han et al., 2020) and emotion changes (Liang et al., 2018) from multiple modalities, these systems either focus on one or another but not both. Subsequently, to the best of the authors' knowledge, till date there has been no analyses of any potential differences in the contributions of different modalities (audio, video, etc.) to the perception of the different aspects of emotional state (state vs. change).
Generally, such emotional states can be described with categorical labels (e.g., happy, sad, angry, etc.), or using a dimensional representations (e.g., arousal, valence, etc.) (Russell, 1980; Grimm et al., 2007). A large body of recent literature has focused on using dimensional representations (Akçay and Oğuz, 2020), since they are able to better describe the complexity of emotions such as blended emotions, emotion transitions, etc. (Gunes and Schuller, 2013; Akçay and Oğuz, 2020). Dimensional representations in turn can employ either numerical or ordinal labels along each dimension and there has been growing interest in the use of ordinal labels in recent years (Yannakakis et al., 2018). Research in psychology suggests that ordinal labels are better aligned with human perceptions (Stewart et al., 2005). Subsequent studies in affective computing have also demonstrated that the use of ordinal labels leads to greater agreement among a group of raters when they are asked to label their perception of the emotional states of a speaker (Martinez et al., 2014; Makantasis, 2021). In the work reported in this manuscript, we focus on ordinal labels within a dimensional emotion representation framework; whereby labels are given as points on ordinal scales corresponding to affect dimensions such as arousal (activate vs. deactivated) and valence (positive vs. negative) (Russell, 1980; Grimm et al., 2007).
Both the static and dynamic aspects of emotion can be associated with the ordinal emotion labels on affective dimensions (Yannakakis et al., 2018). In a recent study we introduced the terminology absolute ordinal label (AOL) and relative ordinal label (ROL), to distinguish between these two aspects of emotion in ordinal scale (Wu et al., 2021). Wherein, AOLs are assigned from a given set of points on the ordinal scale (e.g., low arousal, medium arousal, high arousal); and ROLs represent relative comparisons between pairs of labels on the ordinal scale (e.g., the ranking from the lowest arousal to the highest arousal). Each type of ordinal label represents different and complementary aspects of emotions as depicted in Figure 2. AOLs denoted by the positions of the blue circles represent the absolute arousal (or valence) level, the static emotion state at a given point of time, whereas ROLs denoted by the numbers insides the circles provide a relative level of the emotion state at each time with respect to other times, thus the change of ROLs (i.e., Δ in Figure 2) indicates emotion changes (e.g., arousal increases) with time (orange arrows).
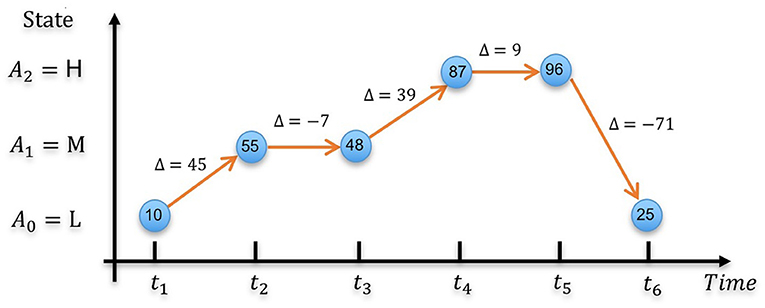
Figure 2. A graphical representation of the complementary characteristics of AOLs and ROLs over 6 time steps within a 100-frame utterances. The position of the blue circles represents AOLs at different time steps with ROLs indicated by the number insides the circles, and the arrows depicting ROL changes between consecutive time steps.
There have been a number of recent advances in both AOL (Metallinou et al., 2012; Kim and Clements, 2015; Han et al., 2020), and ROL (Parthasarathy et al., 2017; Melhart et al., 2020; Makantasis, 2021). However, these have focused only on either absolute or relative ordinal labels and not the joint modeling of both the static and dynamic aspects. The work reported in this paper explores if different modalities contribute to varying degrees to the recognition of static and dynamic aspects of emotions. Specifically, we extend the Dynamic Ordinal Markov Model (DOMM), previously introduced to integrate absolute and relative ordinal information (Wu et al., 2021), to incorporate multimodal inputs and exploit the distinct AOL and ROL prediction subsystems to investigate differences in their contributions. All evaluations are carried out using the widely used RECOLA database (Ringeval et al., 2013).
2. Related Work
Multimodal emotion recognition systems have been benefited from a number of advances in different techniques to fuse the multiple expressive cues (Yalamanchili et al., 2021). These methods can be broadly categorized as either feature level fusion or decision level fusion (Wu et al., 2014). The former is generally carried out by concatenating feature vectors from different modalities (Metallinou et al., 2012; Kim and Clements, 2015), while the latter involves developing indepedent unimodal predictive models and then aggregating the predictions from each modality (Ringeval et al., 2014; Sahoo and Routray, 2016). A combination of both is also possible, for instance Metallinou et al. (2012) first adopts feature level fusion with different weights assigned to audio and video modalities followed by model level fusion to learn a joint representation from multiple modalities. Similarly, Schoneveld et al. (2021) implements LSTM based fusion networks that is trained together with the pre-trained audio and video features. However, these multimodal fusion techniques do not allow for differences in the relative salience of the different modalities toward the static and dynamic aspects of emotion.
Additionally, literature in psychology has also reported on the role of audio and visual cues toward inferring different emotions (Banse and Scherer, 1996). These studies have primarily focused on the relationship between modalities and specific emotions. For instance, facial expressions provide information about the occurrence of pleasant emotional states (Ekman and Oster, 1979), and acoustic features of the speech signals are strongly associated with the speaker's arousal state (Bachorowski, 1999; Russell et al., 2003). Some of these observations of human emotion perception have also been found to have analogues in the automatic emotion recognition system developed by the affective computing community (Tzirakis et al., 2019; Schoneveld et al., 2021).
While there are no studies that directly investigates the relationship between expressive cues and the static and dynamic aspects of emotions, evidence from psychology suggests that people may seek to control their facial expressions when experiencing certain emotions (Crivelli and Fridlund, 2018). Similarly, fine nuances in emotions, that might otherwise be missed, may be perceptible from vocal expression (Simon-Thomas et al., 2009). These observations motivate the work reported in this paper, on exploring the varying contributions of speech and video modalities toward the prediction of emotion state and emotion change.
3. Dynamic Ordinal Markov Model
The Dynamic Ordinal Markov Model (DOMM) is a Markovian framework originally proposed for speech based emotion prediction system that integrates both static and dynamic aspects of ordinal emotion labels (Wu et al., 2021). A high level representation of the DOMM framework is depicted in Figure 3. The emotion state (static aspect) represented by AOLs, and emotion change (dynamic aspect) represented by ROLs, are separately modeled by the AOL and ROL prediction systems. These two subsystems are implemented using an Ordinal Multi-class Support Vector Machine (OMSVM) (Kim and Ahn, 2012) and a RankSVM (Joachims, 2002), respectively. The predictions from both subsystems dynamically update the parameters of a Markov model which is used to make the final predictions.
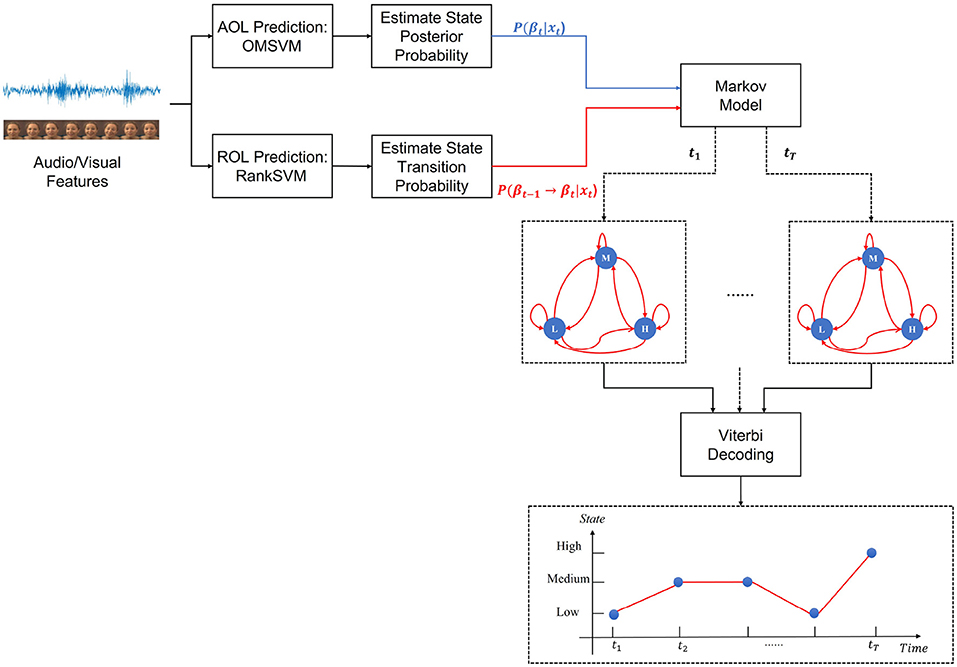
Figure 3. Overview of the DOMM system architecture. In the depicted state diagrams, the blue circles indicate the state (i.e., AOL) with low (L), medium (M) and high (H) and red arrows denote the state transitions. The state posterior probability corresponding to the blue dots are calculated from AOL Prediction subsystem for each state L,M,H at each time step. Similarly, the state transition probability is obtained from the ROL prediction subsystem for all possible state transitions. The predicted emotion state sequence is then obtained using Viterbi decoding based on the time-varying state and transition probabilities. The x axis represents the time step from t1 to tT. The y axis represents the AOLs with low (L), medium (M) and high (H) states. Red line indicates the “best path” after Viterbi tracking which gives the final predicted AOL sequence.
Within the DOMM framework, the AOLs are represented as the states of a Markov model with ROLs reflecting state transitions. The predicted emotion labels are then given as:
where x1 : T = {x1, x2, ..., xT} denotes the sequence of input features, with xt denoting the feature at time t; and β1 : T = {β1, β2, ..., βT} denotes the sequence of DOMM states, with βt denoting the state at time t.
Finally, we note that where represents the set of possible AOLs, for e.g., when the possible AOLs are low (L), medium (M), and high (H), . This framework was developed on the assumption that AOLs are more readily interpretable and consequently predictions should be AOLs, while also recognizing that ROLs are better aligned with the types of judgements humans are better at making and should inform the predictions.
To determine we employ Viterbi decoding, making use of the Markovian property of the DOMM framework by tracking the most probable state sequence (Forney, 1973). This in turn requires an estimate of initial state probability at time t0, and state probabilities, P(βt), and the state transition probabilities, P(βt | βt−1), at each time frame t. The term 'dynamic' in DOMM refers to the fact that both state and state transition probabilities are time-varying quantities and inferred from the input signal. Within the DOMM framework, both these quantities are estimated by the AOL and ROL prediction subsystems. Given a set of AOLs, , the AOL prediction subsystem is implemented as a machine learning model that maps input features to state posteriors, , where denotes the input feature space. Similarly, the ROL prediction subsystem is implemented as a machine learning model that maps input features to the state transition probabilities, . In the realization of the DOMM employed in the experiments reported in this paper, fA is implemented as an Ordinal Multiclass SVM (OMSVM) model (Kim and Ahn, 2012) and fR is implemented using a RankSVM model (Joachims, 2002).
The OMSVM is a variation of the conventional Multi-class SVM that utilizes the ordinal pairwise partition algorithm to group the AOLs and models each group of AOLs with a series of SVMs which enables it to capture the ordinal nature of the labels (Kim and Ahn, 2012). The state posterior probabilities, P(βt), is computed by applying a sigmoid function to the OMSVM outputs as suggested in Platt (1999):
where Hλ(xt) denotes the OMSVM output corresponding to the AOL λ, given an input feature vector xt; a and b denote constant sigmoid function parameters which are determined during model training.
The ROL prediction subsystem employed in this work employs a RankSVM model trained to predict the relative rank, αt of the arousal/valence labels within an utterance. The state transition probabilities, P(βt−1 → βt), are then estimated from the change in relative rank between consecutive frames, Δαt = αt − αt−1, as follows:
where αt = G(xt), with G(xt) denoting the RankSVM output given the input feature vector xt. The conditional probabilities on the right-hand side of Equation (3) are all estimated from models obtained from the labeled training data.
Specifically, a model of P(Δαt | βt−1 = λ) is inferred using the Kernel Density Estimation (KDE) (Platt, 1999) based on the set of relative rank differences obtained from all training data points where the preceding point corresponded to the AOL, λ. The set of these models obtained for possible AOLs, , can then be used to determine any desired P(Δαt | βt−1). Similarly, P(Δαt | βt−1 = λ1, βt = λ2) is estimated from the set of training points labeled as λ2, where the previous point was labeled as λ1. Again, from the set of models corresponding to all pairwise combinations of λ1 and λ2, any desired P(Δαt | βt−1, βt) can be determined. Finally, the set of prior probabilities, P(βt | βt−1), can be estimated as:
where , Nλ1 denotes the number of training points labeled as λ1, and Nλ1 → λ2 denotes the number of occurrences of pairs of training data points with a point labeled λ1 followed by a point labeled λ2 in the training sets.
The initial probability P(β0) is directly estimated from training data as:
where Nλ denotes the number of training points labeled as λ and N denotes the total number of data points in the training sets.
4. Proposed Methodology
The structure of the DOMM framework makes it an appropriate choice to investigate the varying degrees of salience of different modalities toward inferring the static and dynamic aspects of emotion. Specifically, since the AOL prediction and ROL prediction subsystems are independently trained and explicitly cater to the static and dynamic aspects of emotion labels, respectively, we can study if cues from different modalities are particularly well suited for one or another. In the investigations reported in this paper, we train and compare a range of DOMM systems where the AOL and ROL prediction subsystems are trained to use either audio (A), or video (V), or a combination of audio and video (AV) features as inputs. This allows us to compare every possible combination of audio and video modalities to model and predict the static and dynamic aspects of emotion as outlined in Figure 4.

Figure 4. An overview of the proposed analyses to determine relative salience of audio and video modalities toward the perception of emotion state and emotion change. The 9 possible DOMM systems corresponding to different combinations modalities used for estimating state and transition probabilities are all evaluated on the same test data. A table of these measures of prediction accuracy, as illustrated, allows for the identification of broad trends around the relative salience of each modality toward the prediction of emotion state and emotion change.
Specifically, we train three versions of the AOL prediction system:
where, σ(·) denotes the sigmoid function, Φ denotes the modality, and the feature vector is obtained by concatenating and and three versions of the ROL prediction system given as:
where, similar to Equation (3), , with G(·) representing a RankSVM, and .
These sets of AOL and ROL prediction subsystems lead to 9 possible combinations as depicted in Figure 4. The emotion state prediction accuracies of all combinations are estimated and compared to ascertain the relative salience of the speech and video modality toward the modeling of emotion state and emotion change. For instance, looking down the first column of the table prediction accuracies in Figure 4, the entries represent the scenario where the RankSVM models emotion change based on audio cues, denoted by the superscript A, while the OMSVM predicts emotion state from one of the three possible input feature vectors, as denoted by the subscript.
Similarly, the second and third columns represent the configurations where the RankSVM takes either video (V) or audiovisual (AV) features as input. If audio was significantly more salient for the prediction of emotion state compared to video features then we should expect the entries in the first row to be consistently higher than those in the second row. Additionally, if video features carried little useful information about emotion state then the entries in the third row would be similar to those in the first row. Likewise, comparing columns allows us to make inferences about the relative salience of the audio and video feature to emotion change modeling. Finally, we note that even though the predictions made by DOMM systems are AOLs and the performance measures are accuracies of predictions of AOLs, the predictions are obtained via Viterbi decoding of a Markov model and incorrect estimates of the transition probabilities will lead to incorrect predictions of the state sequence.
5. Experiment Settings
5.1. Database Description
No publicly corpora that can be used to train emotion prediction systems come with absolute and relative ordinal labels. Consequently, in this work we use the well-established Remote Collaborative and Affective Interactions (RECOLA) database (Ringeval et al., 2013) and convert the interval labels to AOLs and ROLs. The RECOLA dataset (Ringeval et al., 2013) is a widely used multimodal corpus containing both audio and video modalities. It consists of 9.5 h of audiovisual recordings spanning 23 dyadic interactions among 46 participants. The experiments reported in this paper were conducted with the data provided for the AVEC 2016 challenge which included 9 utterances of 5 min duration each in both the training and development sets (Valstar et al., 2016). The challenge development set is employed as the test set in this experiment since the labels of the test set are not public. Each utterance is annotated by 6 raters with continuous arousal and valence ratings between –1 and 1, sampled at intervals of 40 ms.
Delay compensation is applied to compensate for human perception delays in the labels as suggested by Huang et al. (2015) with a delay of 4 s for arousal and 2 s for valence. Finally, the ratings are aggregated over a 2 s window, as per Parthasarathy and Busso (2016) who suggest that a window size between 1 and 3 s is appropriate for retaining salient trends in the ratings while reducing noise.
The AOLs are converted from interval labels individually for each annotator and the final consensus AOLs are inferred via majority vote among the 6 individual AOLs (one per annotator). The conversion scheme is carried out by setting thresholds to divide the interval labels into three levels of arousal (valence) state: [low, medium, high]. Specifically, if yt denotes the average arousal/valence intensity at window t and θ1 and θ2 denotes two thresholds. The AOLs are obtained as: βt = Low for yt ≤ θ1; βt = Medium for θ1 < yt ≤ θ2; βt = High for yt > θ2. For arousal labels, the thresholds were chosen as θ1 = −0.14 and θ2 = 0.14 and for valence these were set as θ1 = 0 and θ2 = 0.17. In both cases the thresholds were chosen to provide an even distribution across the low, medium and high states as outlined in Wu et al. (2021). The resultant distribution of absolute states are given in Table 1. Additionally, we repeated out analyses on two other sets of thresholds for both arousal and valence. The results can be found in the Supplementary Tables S7–S10.
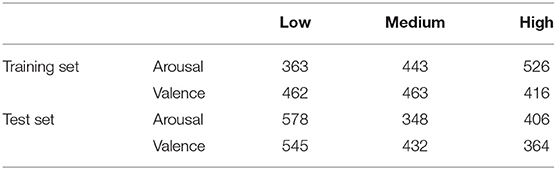
Table 1. Absolute ordinal labels distribution on RECOLA dataset with thresholds: θa1 = −θa2 = 0.14 for arousal and θv1 = 0 and θv2 = 0.17 for valence.
Likewise, the ROLs for each annotator are first converted by performing pairwise comparisons across each 2 s window based on the mean arousal (valence) intensity. The global ROLs are computed by adopting the Qualitative Agreement (QA) method (Parthasarathy and Busso, 2018). Within each utterance, a matrix of pairwise comparisons amongst all windows for each individual annotator is first collected as shown in Figure 5. For instance, the valence rating within the third window is less than that within the second window, leading to a down-arrow in the cell located at the second row and third column. A consensus matrix is then obtained via majority vote among matrices from all annotators and the final rank sequence of ROLs is obtained from this consensus matrix.

Figure 5. Illustration of QA method (Parthasarathy and Busso, 2018). (A) Individual comparison matrix obtained from interval labels for one rater. Up-arrow indicates an increase; down-arrow indicates a decrease and equal denotes tie. (B) Consensus matrix obtained by aggregating individual matrix collected from multiple raters using majority votes.
5.2. Features
5.2.1. Audio Features
Two sets of widely used audio features, the extended Geneva Minimalistic Acoustic Parameter Set (eGeMAPS) (Eyben et al., 2015) and the Bag-of-Audio-Words (BoAW) (Schmitt et al., 2016) were employed in the experiments reported in this paper. The 88-dimension extended Geneva Minimalistic Acoustic Parameter Set (eGeMAPS) was chosen since it is a standard feature set used in affective computing to simplify benchmarking and provided by the AVEC 2016 challenge (Valstar et al., 2016). It comprises of arithmetic mean and coefficient of variation functionals applied to 18 low-level descriptors (LLDs) extracted from the minimalistic acoustic parameter set along with another 8 functionals applied to pitch and loudness. Additional 7 LLDs are extracted from the extension parameter set with 4 statistics over the unvoiced segments, 6 temporal features, and 26 additional cepstral parameters and dynamic parameter (Eyben et al., 2015). The features were extracted using the OpenSMILE toolkit (Eyben et al., 2010) and for additional details about eGeMAPS, readers are referred to Eyben et al. (2015).
The Bag-of-Audio-Words (BoAW) features were extracted by first computing 20 dimensional MFCCs and their deltas. The 'audio words' were determined as clusters in this space (Schmitt et al., 2016). The BoAW features employed in our experiments were generated using 100 clusters, leading to a 100-dimensional BoAW representations. The extraction was implemented using OpenXbow (Schmitt and Schuller, 2017). Principal Component Analysis (PCA) was then employed for dimensional reduction resulting in 40 dimensional features. Their first-order derivatives were then computed and concatenated with the 40 principal components, leading to an 80-dimensional feature representation.
5.2.2. Video Features
The video features utilized in the experiments reported in this paper comprise of two standard features sets provided in the AVEC 2016 challenge, the appearance features and geometry features (Valstar et al., 2016). The video appearance feature is computed using Local Gabor Binary Patterns from Three Orthogonal Planes (LGBP-TOP) by first convolving the input video frames with a bank of Gabor Filters to obtain Gabor magnitude response images. The LBP operator is applied to the resulted image slices along 3 orthogonal plans (x-y, x-t, y-t), resulting in three LBP histograms per Gabor response. Finally, all the histograms are then concatenated into a single LGBP-TOP histogram across all video frames. PCA is then applied for feature reduction and an 84-dimensional feature set was obtained (Valstar et al., 2016).
The geometry features are extracted by first tracking the 49 facial landmarks and aligning them with a mean shape from stable points located around nose and eyes. Then the coordinate differences between them are computed, together with their deltas leading to 196 features. The landmarks are split into groups with (i) left eye and eyebrow; (ii) right eye and eyebrow; and (iii) the mouth. The Euclidean distances and angles between the points are computed within each group. A final Euclidean distance is computed between the mean of stable landmarks and aligned landmarks in the video frame. The extraction process resulting in 316 dimensional features. Details refer to Valstar et al. (2016). Finally, for the audio-visual front-end we employed feature level fusion by directly concatenating the individual audio and video features extracted using the above methods.
5.3. Backend Implementation
The OMSVM subsystem for AOL prediction is implemented using ClassificationECOC MATLAB toolbox (an error correction output code multi-class classifier) (Escalera et al., 2009). The state posterior probabilities were then computed using the FitPosterior function (Platt, 1999). The RankSVM model used in the ROL prediction subsystem was implemented using the toolkit referred to in Chapelle and Keerthi (2010). Both the OMSVM and RankSVM models employs linear kernels and both used c = 1 × 10⁻⁴ as suggested in Fan et al. (2008) and Kim and Clements (2015).
5.4. Evaluation Metrics
Two measures of AOL prediction accuracy are adopted in the experiments reported in this paper. Firstly, Unweighted Average Recall (UAR), which is a commonly employed evaluation metric in nominal classification tasks in AER literature (Metallinou et al., 2012; Zhang et al., 2016), and has also been utilized for evaluation in AOL prediction systems (Kim and Ahn, 2012). UAR (%) ranges between 0 and 100% with 33.3% indicating a chance level prediction in this three class prediction task (balanced classes). However, UAR does not taken into account the ordinality in the labels. For instance, incorrectly predicting “Low arousal” as “Medium arousal” or “High arousal” carries the same penalty in UAR, although the latter is obviously a more significant error. Consequently, the weighted Cohen,s Kappa coefficient (Cohen, 1968), kw which is used to measure the consistency between two AOL sequences is also reported since it takes the ordinal nature of AOLs into consideration. The coefficient kw indicates the level of agreement between two different AOL sequences (predictions vs. ground truth) as given by Equation 8, with kw = 1 indicating perfect agreement and kw = 0 indicating only chance agreement (Cohen, 1968).
where, i, j ∈ [1, 2, 3] denote possible AOLs (1-low, 2-medium, 3-high); pij is the entry located at the ith row and jth column of the confusion matrix denoting the proportion of test instances corresponding the AOL i being predicted as AOL j; pi· denotes the fraction of all groundtruth AOLs that correspond to the label i; q·j denotes the fraction of instances where the AOLs are correctly predicted as j; and wij is the element at ith row and jth column of matrix .
Finally, Kendall's Tau (τ) (Kendall, 1938) is used to evaluate the performance of ROL predictions, which is a typical evaluation metric that measures the consistency between two ranks and has been used in several AER works (Lotfian and Busso, 2016; Parthasarathy et al., 2017). It can vary between –1 and 1 indicating the range from complete antithesis to perfect match (Kendall, 1938), as shown in Equation (9):
where T refers to total number of comparisons given by , with n referring to the highest rank index. C denotes the number of concordant pairs and D denotes the number of discordant pairs.
6. Results and Discussion
The two subsystems that model emotion state (AOL prediction subsystem) and emotion change (ROL prediction subsystem) are first evaluated with different modalities. Following this, we use the DOMM framework to analyse the relative contributions of speech and video modalities toward inferring static and dynamic aspects of emotion. The code used to implement these experiments and demo scripts can be accessed at: https://github.com/JingyaoWU66/Multimodal_DOMM.git.
6.1. Validating Subsystems
The performance achieved with each single modality of OMSVM in terms of UAR (%) and kw, and RankSVM in terms of τ are reported in Tables 2, 3. The best results obtained with audio-visual feature across all combinations of different feature sets of each modality are also reported. For arousal, this was achieved by the combination of eGemaps (audio) and appearance (video); and for valence, the combination of BoAW (audio) and geometric (video) features. When it comes to AOL prediction with the OMSVM, it can be seen that the audio modality outperforms video modality for arousal prediction for all feature sets in terms of both UAR and kw. The converse is true when it comes to valence predictions with video outperforming audio. This is in line with previously reported observations that audio features are more salient for arousal recognition, whereas valence recognition is more accurate with visual features (Schoneveld et al., 2021). The feature level fusion of audio and video modality outperforms video only for valence prediction, suggesting that audio-visual features contains more useful information; whereas this is not observed for arousal predictions. This suggests that the more salient audio modality carries the necessary information for arousal prediction. More importantly, it also indicates that simple feature level fusion may not be the optimal approach for leveraging multimodal inputs.
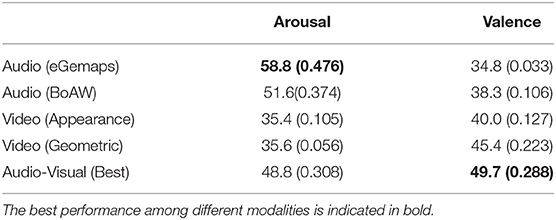
Table 2. OMSVM evaluation with different modalities in terms of unweighted average recall UAR (%) and weighted kappa kw (reported inside parenthesis).
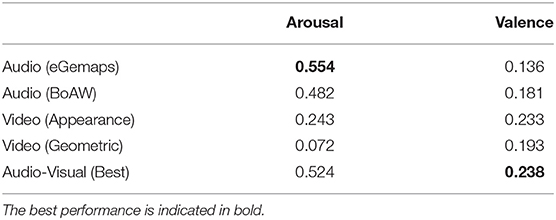
Table 3. RankSVM evaluation with different modalities in terms of Kendall's tau (τ).
With respect to ROL prediction with the RankSVM, audio modality achieves the highest τ among all three feature sets for arousal, suggesting that as in the case with emotion state prediction, audio features are also well suited for predicting change in arousal state, especially when compared to video features. For valence prediction, video features outperforms audio, but the best τ is achieved when both audio and video features are fused, suggesting both modalities contain complementary information about change in valence.
6.2. Salience of Audio and Video Modalities for Modeling Emotion State
As outlined in section 4, there are nine possible combinations of emotion state and emotion change prediction based on audio and/or video features (refer to table depicted in Figure 4) within the DOMM framework. To ascertain the relative salience of the modalities toward emotion state prediction, we would compare the performance metrics within each column (with each row denoting a different modality for emotion state modeling). In all the results tables reported in this section, in addition to the nine combinations, we also report the means across each row which would give an indication of the “average” salience of each modality for emotion state modeling. For instance, to determine the salience of audio modality for emotion state prediction, we first compute , where the performances due to the three different RankSVM subsystems are averaged. The higher the value of is, the more salient audio modality is, for emotion state prediction. Four different combinations of audio and video feature sets are evaluated, with Tables 4, 5 showing the results obtained using eGemaps (audio) and appearance (video), and Tables 6, 7 showing the results obtained using BoAW (audio) and geometric (video). These two combinations led to more accurate predictions when compared to the other two possible combinations of audio and video features. These are reported in the Supplementary Tables S1–S4.
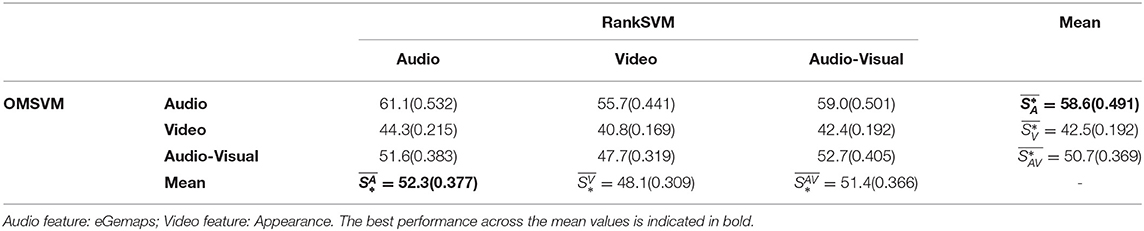
Table 4. Performance of Arousal prediction in terms of Unweighted Average Recall (UAR %) and weighted kappa kw (reported inside parenthesis).
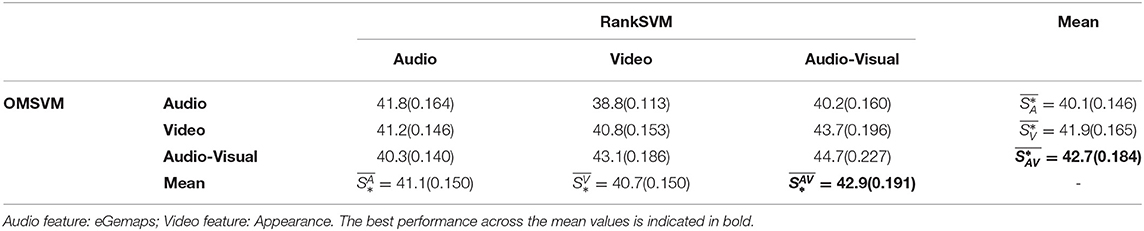
Table 5. Performance of Valence prediction in terms of Unweighted Average Recall (UAR %) and weighted kappa kw (reported inside parenthesis).
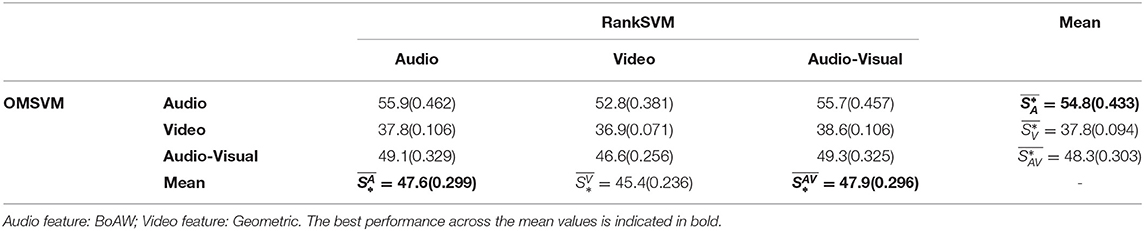
Table 6. Performance of Arousal prediction in terms of Unweighted Average Recall (UAR %) and weighted kappa kw (reported inside parenthesis).
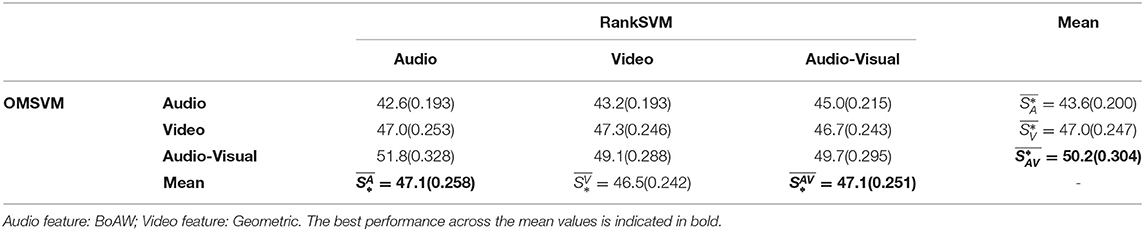
Table 7. Performance of Valence prediction in terms of Unweighted Average Recall (UAR %) and weighted kappa kw (reported inside parenthesis).
As can be seen from Table 4, the best average UAR for arousal state prediction is 58.6% and best kw is achieved as 0.491, achieved by audio input (which also outperforms ), suggesting that audio modality contributes most to the static arousal prediction. Furthermore, within each column, the audio modality is consistently superior to video modality and audio-visual modality, indicating that OMSVM consistently predicts arousal state most accurately from audio regardless of the input modality to the RankSVM subsystem. Similar trends are also observed in Table 6 and the tables included in the Supplementary Material where different feature sets are utilized.
From the valence prediction accuracies reported in Tables 5, 7, it can be seen that is higher than both and , both in terms of UAR and kw. Additionally, is better performed than , both results indicating that video is more salient than audio when it comes to predicting valence state. Similar trends are also observed within each column, with performing the best amongst the three different systems, when the RankSVM input is either video or audio-visual. For the outliers when the RankSVM input is audio (first column of Table 5), does not correspond to the best performance, but this configuration does not lead to the best overall performance and it may be that the gains of audio-visual input to the OMSVM is offset by the audio based RankSVM resulting in less accurate ROL prediction (refer Table 3).
6.3. Salience of Audio and Video Modalities for Modeling Emotion Change
To investigate the salience of different modalities for predicting change in emotions, the impact of varying the input modality to RankSVM based ROL prediction subsystem can be studied. Specifically, this can be done by comparing the prediction accuracy across rows in Tables 4–7. Additionally, the average performance for each modality obtained by computing the mean over all input modalities for the OMSVM (i.e., means of the columns) are also reported, such as , representing the average accuracy when using audio for predicting emotion change.
From Tables 4, 6 it can be seen that corresponds to the highest prediction accuracy, followed by and then in terms of both UAR and kw. This suggests that audio is, on average, the most salient modality for the purposes of modeling change in arousal. Furthermore, it can also be seen that within each row, the performance when using audio for RankSVM always outperforms video modality, further validating the observation that audio is more salient for modeling emotion change.
Looking across the rows of the valence prediction accuracies reported in Tables 5, 7, it can be observed that achieves the highest prediction accuracy (in terms of both UAR and kw), suggesting that both audio and video modalities are salient when it comes to predicting changes in valence. Interestingly, is higher than . Particularly, in Table 7, achieves the similar performance with in terms of UAR, but even performs better when incorporates ordinality in kw evaluation. This appears to run counter to the conventional wisdom that video is more salient than audio for valence prediction (Metallinou et al., 2012; Schoneveld et al., 2021). However, it is worth noting that valence state prediction results do conform to those expectations and the valence change prediction results might be suggesting that fine nuances related to valence changes in audio modality can be better perceived when compared to video.
7. Conclusion
There is a large body of literature devoted to recognizing speakers, static emotion state (e.g., arousal level at a point in time), and a growing interest in the prediction of dynamic changes in emotion (e.g., change of arousal level between consecutive time steps). In this manuscript, we consider a unified model that integrates both static and dynamic aspects of emotion perception. In particular, the differences in relative salience of audio and video modalities toward modeling the static and dynamic aspects of emotions are investigated.
Using the Dynamic Ordinal Markov Model (DOMM) framework, extensive analyses were carried out by varying the input modalities to the OMSVM (modeling static aspects) and the RankSVM (modeling dynamic aspects) subsystems, covering all possible combinations of different feature sets of audio and video inputs. The DOMM framework is particularly well suited for this analyses because it is able to separately model the static and dynamic aspects of emotion with different input modalities, prior to integrating them for ordinal emotion prediction. The experimental comparisons were carried out on the widely used RECOLA dataset, and prediction accuracy was quantified in terms of both UAR and weighted Kappa. Results obtained from a range of different system configurations consistently show that audio modality achieves superior advantages in modeling emotion state on arousal and video modality is more salient for modeling emotion state on valence.
Additionally, our results also show that emotion changes for both arousal and valence are better captured by audio modality, either by itself or when fused with video input. This is consistently observed across the rows in Tables 4–7, where the highest prediction accuracy is achieved with audio input to the RankSVM regardless of the input modalities for the OMSVM. This also aligns with the findings in psychology that people might convey their intention rather than the true emotions via facial expressions, while their vocal expressions allow for better discrimination between emotional state even if the differences are only fine nuances.
Data Availability Statement
Publicly available datasets were analyzed in this study. This data can be found here: RECOLA database: https://diuf.unifr.ch/main/diva/recola/download.html.
Author Contributions
JW, TD, and VS made the contributions to the conception, design and analysis to the study. JW conducted the experiments and drafted the article. VS and EA contributed to framing and contextualizing the research problem. All authors contributed to drafting the manuscript.
Conflict of Interest
The authors declare that the research was conducted in the absence of any commercial or financial relationships that could be construed as a potential conflict of interest.
Publisher's Note
All claims expressed in this article are solely those of the authors and do not necessarily represent those of their affiliated organizations, or those of the publisher, the editors and the reviewers. Any product that may be evaluated in this article, or claim that may be made by its manufacturer, is not guaranteed or endorsed by the publisher.
Supplementary Material
The Supplementary Material for this article can be found online at: https://www.frontiersin.org/articles/10.3389/fcomp.2021.767767/full#supplementary-material
References
Akçay, M. B., and Oğuz, K. (2020). Speech emotion recognition: emotional models, databases, features, preprocessing methods, supporting modalities, and classifiers. Speech Commun. 116, 56–76. doi: 10.1016/j.specom.2019.12.001
Avots, E., Sapiński, T., Bachmann, M., and Kamińska, D. (2019). Audiovisual emotion recognition in wild. Mach. Vis. Appl. 30, 975–985. doi: 10.1007/s00138-018-0960-9
Bachorowski, J.-A. (1999). Vocal expression and perception of emotion. Curr. Directions Psychol. Sci. 8, 53–57. doi: 10.1111/1467-8721.00013
Banse, R., and Scherer, K. R. (1996). Acoustic profiles in vocal emotion expression. J. Personal. Soc. Psychol. 70, 614. doi: 10.1037//0022-3514.70.3.614
Brunswik, E. (1955). Representative design and probabilistic theory in a functional psychology. Psychol. Rev. 62, 193. doi: 10.1037/h0047470
Chapelle, O., and Keerthi, S. S. (2010). Efficient algorithms for ranking with svms. Inf. Retrieval 13, 201–215. doi: 10.1007/s10791-009-9109-9
Cohen, J. (1968). Weighted kappa: nominal scale agreement provision for scaled disagreement or partial credit. Psychol. Bull. 70, 213. doi: 10.1037/h0026256
Cowie, R., Douglas-Cowie, E., Tsapatsoulis, N., Votsis, G., Kollias, S., Fellenz, W., et al. (2001). Emotion recognition in human-computer interaction. IEEE Signal Process. Mag. 18, 32–80. doi: 10.1109/79.911197
Crivelli, C., and Fridlund, A. J. (2018). Facial displays are tools for social influence. Trends Cogn. Sci. 22, 388–399. doi: 10.1016/j.tics.2018.02.006
Ekman, P., and Oster, H. (1979). Facial expressions of emotion. Ann. Rev. Psychol. 30, 527–554. doi: 10.1146/annurev.ps.30.020179.002523
Escalera, S., Pujol, O., and Radeva, P. (2009). Separability of ternary codes for sparse designs of error-correcting output codes. Pattern Recognit. Lett. 30, 285–297. doi: 10.1016/j.patrec.2008.10.002
Eyben, F., Scherer, K. R., Schuller, B. W., Sundberg, J., André, E., Busso, C., et al. (2015). The geneva minimalistic acoustic parameter set (gemaps) for voice research and affective computing. IEEE Trans. Affect. Comput. 7, 190–202. doi: 10.1109/TAFFC.2015.2457417
Eyben, F., Wöllmer, M., and Schuller, B. (2010). “Opensmile: the munich versatile and fast open-source audio feature extractor,” in Proceedings of the 18th ACM International Conference on Multimedia (Firenze), 1459–1462.
Fan, R.-E., Chang, K.-W., Hsieh, C.-J., Wang, X.-R., and Lin, C.-J. (2008). Liblinear: a library for large linear classification. J. Mach. Learn. Res. 9, 1871–1874. doi: 10.5555/1390681.1442794
Grimm, M., Kroschel, K., Mower, E., and Narayanan, S. (2007). Primitives-based evaluation and estimation of emotions in speech. Speech Commun. 49, 787–800. doi: 10.1016/j.specom.2007.01.010
Gunes, H., and Schuller, B. (2013). Categorical and dimensional affect analysis in continuous input: current trends and future directions. Image Vis. Comput. 31, 120–136. doi: 10.1016/j.imavis.2012.06.016
Han, W., Jiang, T., Li, Y., Schuller, B., and Ruan, H. (2020). “Ordinal learning for emotion recognition in customer service calls,” in ICASSP 2020-2020 IEEE International Conference on Acoustics, Speech and Signal Processing (ICASSP) (Barcelona: IEEE), 6494–6498.
Huang, Z., Dang, T., Cummins, N., Stasak, B., Le, P., Sethu, V., et al. (2015). “An investigation of annotation delay compensation and output-associative fusion for multimodal continuous emotion prediction,” in Proceedings of the 5th International Workshop on Audio/Visual Emotion Challenge (Brisbane), 41–48.
Huang, Z., and Epps, J. (2016). “Detecting the instant of emotion change from speech using a martingale framework,” in 2016 IEEE International Conference on Acoustics, Speech and Signal Processing (ICASSP) (IEEE), 5195–5199.
Joachims, T. (2002). “Optimizing search engines using clickthrough data,” in Proceedings of the Eighth ACM SIGKDD International Conference on Knowledge Discovery and Data Mining (Edmonton), 133–142.
Kendall, M. G. (1938). A new measure of rank correlation. Biometrika 30, 81–93. doi: 10.2307/2332226
Kim, J. C., and Clements, M. A. (2015). Multimodal affect classification at various temporal lengths. IEEE Trans. Affect. Comput. 6, 371–384. doi: 10.1109/TAFFC.2015.2411273
Kim, K.-J., and Ahn, H. (2012). A corporate credit rating model using multi-class support vector machines with an ordinal pairwise partitioning approach. Comput. Oper. Res. 39, 1800–1811. doi: 10.1016/j.cor.2011.06.023
Liang, P. P., Zadeh, A., and Morency, L.-P. (2018). “Multimodal local-global ranking fusion for emotion recognition,” in Proceedings of the 20th ACM International Conference on Multimodal Interaction (Boulder), 472–476.
Lotfian, R., and Busso, C. (2016). “Practical considerations on the use of preference learning for ranking emotional speech,” in 2016 IEEE International Conference on Acoustics, Speech and Signal Processing (ICASSP) (Shanghai: IEEE), 5205–5209.
Makantasis, K. (2021). Affranknet+: ranking affect using privileged information. arXiv preprint arXiv:2108.05598.
Martinez, H. P., Yannakakis, G. N., and Hallam, J. (2014). Don't classify ratings of affect; rank them! IEEE Trans. Affect. Comput. 5, 314–326. doi: 10.1109/TAFFC.2014.2352268
Melhart, D., Sfikas, K., Giannakakis, G., and Liapis, G. Y. A. (2020). “A study on affect model validity: nominal vs ordinal labels,” in Workshop on Artificial Intelligence in Affective Computing (Stockholm: PMLR), 27–34.
Metallinou, A., Wollmer, M., Katsamanis, A., Eyben, F., Schuller, B., and Narayanan, S. (2012). Context-sensitive learning for enhanced audiovisual emotion classification. IEEE Trans. Affect. Comput. 3, 184–198. doi: 10.1109/T-AFFC.2011.40
Parthasarathy, S., and Busso, C. (2016). “Defining emotionally salient regions using qualitative agreement method,” in Interspeech (San Francisco), 3598–3602.
Parthasarathy, S., and Busso, C. (2018). “Preference-learning with qualitative agreement for sentence level emotional annotations,” in Interspeech 2018, Hyderabad.
Parthasarathy, S., Lotfian, R., and Busso, C. (2017). “Ranking emotional attributes with deep neural networks,” in 2017 IEEE International Conference on Acoustics, Speech and Signal Processing (ICASSP) (New Orleans, LA: IEEE), 4995–4999.
Platt, J. (1999). Probabilistic outputs for support vector machines and comparisons to regularized likelihood methods. Adv. Large Margin Classifiers 10, 61–74.
Ringeval, F., Amiriparian, S., Eyben, F., Scherer, K., and Schuller, B. (2014). “Emotion recognition in the wild: incorporating voice and lip activity in multimodal decision-level fusion,” in Proceedings of the 16th International Conference on Multimodal Interaction (Istanbul), 473–480.
Ringeval, F., Sonderegger, A., Sauer, J., and Lalanne, D. (2013). “Introducing the recola multimodal corpus of remote collaborative and affective interactions,” in 2013 10th IEEE international Conference and Workshops on Automatic Face and Gesture Recognition (FG) ( Shanghai: IEEE), 1–8.
Russell, J. A. (1980). A circumplex model of affect. J. Pers. Soc. Psychol. 39, 1161. doi: 10.1037/h0077714
Russell, J. A., Bachorowski, J.-A., and Fernández-Dols, J.-M. (2003). Facial and vocal expressions of emotion. Ann. Rev. Psychol. 54, 329–349. doi: 10.1146/annurev.psych.54.101601.145102
Sahoo, S., and Routray, A. (2016). “Emotion recognition from audio-visual data using rule based decision level fusion,” in 2016 IEEE Students Technology Symposium (TechSym) (Kharagpur: IEEE), 7–12.
Schmitt, M., Ringeval, F., and Schuller, B. W. (2016). “At the border of acoustics and linguistics: bag-of-audio-words for the recognition of emotions in speech,” in Interspeech (San Francisco), 495–499.
Schmitt, M., and Schuller, B. (2017). Openxbow—introducing the passau open-source crossmodal bag-of-words toolkit. J. Mach. Learn. Res. 18, 1–5.
Schoneveld, L., Othmani, A., and Abdelkawy, H. (2021). Leveraging recent advances in deep learning for audio-visual emotion recognition. Pattern Recognit. Lett. 146, 1–7. doi: 10.1016/j.patrec.2021.03.007
Simon-Thomas, E. R., Keltner, D. J., Sauter, D., Sinicropi-Yao, L., and Abramson, A. (2009). The voice conveys specific emotions: evidence from vocal burst displays. Emotion 9, 838. doi: 10.1037/a0017810
Stewart, N., Brown, G. D., and Chater, N. (2005). Absolute identification by relative judgment. Psychol. Rev. 112, 881. doi: 10.1037/0033-295X.112.4.881
Tzirakis, P., Zafeiriou, S., and Schuller, B. (2019). “Real-world automatic continuous affect recognition from audiovisual signals,” in Multimodal Behavior Analysis in the Wild (Elsevier), 387–406.
Valstar, M., Gratch, J., Schuller, B., Ringeval, F., Lalanne, D., Torres Torres, M., et al. (2016). “Avec 2016: depression, mood, and emotion recognition workshop and challenge,” in Proceedings of the 6th International Workshop on Audio/Visual Emotion Challenge (Amsterdam), 3–10.
Wu, C.-H., Lin, J.-C., and Wei, W.-L. (2014). Survey on audiovisual emotion recognition: databases, features, and data fusion strategies. APSIPA Trans. Signal Inf. Process. 3, e12. doi: 10.1017/ATSIP.2014.11
Wu, J., Dang, T., Sethu, V., and Ambikairajah, E. (2021). A novel markovian framework for integrating absolute and relative ordinal emotion information. arXiv preprint arXiv:2108.04605.
Yalamanchili, B., Dungala, K., Mandapati, K., Pillodi, M., and Vanga, S. R. (2021). “Survey on multimodal emotion recognition (mer) systems,” in Machine Learning Technologies and Applications: Proceedings of ICACECS 2020 (Singapore: Springer), 319–326.
Yannakakis, G. N., Cowie, R., and Busso, C. (2018). The ordinal nature of emotions: an emerging approach. IEEE Trans. Affect. Comput. 12, 16–35. doi: 10.1109/TAFFC.2018.2879512
Zhang, B., and Provost, E. M. (2019). “Automatic recognition of self-reported and perceived emotions,” in Multimodal Behavior Analysis in the Wild (Elsevier), 443–470.
Keywords: emotion recognition, multimodal, emotion dynamics, ordinal data, machine learning
Citation: Wu J, Dang T, Sethu V and Ambikairajah E (2021) Multimodal Affect Models: An Investigation of Relative Salience of Audio and Visual Cues for Emotion Prediction. Front. Comput. Sci. 3:767767. doi: 10.3389/fcomp.2021.767767
Received: 31 August 2021; Accepted: 02 December 2021;
Published: 23 December 2021.
Edited by:
Oya Celiktutan, King's College London, United KingdomReviewed by:
Heysem Kaya, Utrecht University, NetherlandsAlexey Karpov, St. Petersburg Federal Research Center of the Russian Academy of Sciences (SPC RAS), Russia
Copyright © 2021 Wu, Dang, Sethu and Ambikairajah. This is an open-access article distributed under the terms of the Creative Commons Attribution License (CC BY). The use, distribution or reproduction in other forums is permitted, provided the original author(s) and the copyright owner(s) are credited and that the original publication in this journal is cited, in accordance with accepted academic practice. No use, distribution or reproduction is permitted which does not comply with these terms.
*Correspondence: Jingyao Wu, amluZ3lhby53dUB1bnN3LmVkdS5hdQ==