 Natasha Clarke
 Thomas R. Barrick
 Peter Garrard
- Neurosciences Research Centre, Molecular and Clinical Sciences Research Institute, St George’s University of London, London, United Kingdom
Alzheimer’s disease (AD) has a long pre-clinical period, and so there is a crucial need for early detection, including of Mild Cognitive Impairment (MCI). Computational analysis of connected speech using Natural Language Processing and machine learning has been found to indicate disease and could be utilized as a rapid, scalable test for early diagnosis. However, there has been a focus on the Cookie Theft picture description task, which has been criticized. Fifty participants were recruited – 25 healthy controls (HC), 25 mild AD or MCI (AD+MCI) – and these completed five connected speech tasks: picture description, a conversational map reading task, recall of an overlearned narrative, procedural recall and narration of a wordless picture book. A high-dimensional set of linguistic features were automatically extracted from each transcript and used to train Support Vector Machines to classify groups. Performance varied, with accuracy for HC vs. AD+MCI classification ranging from 62% using picture book narration to 78% using overlearned narrative features. This study shows that, importantly, the conditions of the speech task have an impact on the discourse produced, which influences accuracy in detection of AD beyond the length of the sample. Further, we report the features important for classification using different tasks, showing that a focus on the Cookie Theft picture description task may narrow the understanding of how early AD pathology impacts speech.
Introduction
Alzheimer’s disease (AD) includes a long “pre-clinical” period, during which pathological change accumulates in a patient’s brain with no apparent effect on their behavior or performance (Jack et al., 2010). Memory decline often emerges during a period of subtle cognitive alteration known as Mild Cognitive Impairment (Albert et al., 2011), however, disease modifying compounds tested in this prodromal stage have failed to show a treatment effect. Thus, there is a need to identify signs of pathology even earlier (Cummings et al., 2016).
There are two broad approaches to detecting pathology: brief cognitive screening tests and biological markers (biomarkers) of disease. Of the former, the Mini Mental State Examination (MMSE) and Montreal Cognitive Assessment can be administered rapidly (Folstein et al., 1975; Nasreddine et al., 2005), and have reasonably good diagnostic accuracy (AUCs of 85% and 74% for distinguishing MCI from controls (Carnero-Pardo, 2014; Ciesielska et al., 2016)). The detailed Addenbrooke’s Cognitive Examination (Hsieh et al., 2013) is more accurate (91% AUC (Matias-Guiu et al., 2016)), but takes longer to administer.
Biomarkers include Magnetic Resonance Imaging (MRI), cerebrospinal fluid (CSF) analysis and Positron Emission Tomography (PET). All three approaches can distinguish AD from controls with accuracies of over 90% (Bloudek et al., 2011), but are less accurate for MCI (Mitchell, 2009; Lombardi et al., 2020). Moreover, they are costly to the healthcare provider and inconvenient for patients, limiting widespread use (Lovestone, 2014; Laske et al., 2015). At the time of writing Amyloid PET is restricted to research use (McKhann et al., 2011).
There is evidence that connected spoken or written language (discourse) begins to change early in the course of AD, possibly prior to MCI (Forbes-McKay and Venneri, 2005; Garrard et al., 2005; Ahmed et al., 2013). Improvements in automated Natural Language Processing have led to the suggestion that computational analysis of connected speech could act as a rapid, low-cost, scalable, and non-invasive assay for early stages of AD (Clarke et al., 2020; de la Fuente Garcia et al., 2020).
A common approach to obtaining a sample of discourse involves the patient describing a scene, such as that depicted in the “Cookie Theft” picture (Goodglass et al., 1983). Standard machine learning algorithms using features automatically extracted from transcripts of the resulting descriptions can classify patients with AD vs. controls with 81% accuracy, while a deep learning approach has achieved similar accuracy in classifying MCI vs. controls (Fraser et al., 2016; Orimaye et al., 2018). Alternative methods of sampling discourse, such as recording unstructured or semi-structured spontaneous speech, have been found to be similarly distinguishable (Garrard, 2009; Berisha et al., 2015; Asgari et al., 2017; Mirheidari et al., 2019).
Another approach involves narration of a learned story (either well-known, such as Cinderella, or a novel narrative presented in pictures)-a cognitively complex task that entails the integration of a story’s characters and events within a temporal framework (Ash et al., 2007; Drummond et al., 2015; Toledo et al., 2017). Less well studied is the task of describing a process (such as how to change a tyre). For a review of relevant studies see Petti et al. (2020) and de la Fuente Garcia et al. (2020).
For reasons related to its simplicity, standardization and task constraints, and existence of large volumes of data (particularly the DementiaBank (MacWhinney, 2019)), picture description appears to have largely captured the field of discourse analysis (de la Fuente Garcia et al., 2020). There are, however, significant drawbacks to relying on picture descriptions, including limited richness and length (Ash et al., 2006), the somewhat unnatural nature of the task, and (in the case of the Cookie Theft picture) an outdated depiction of domestic life (Berube et al., 2019). Similarly, procedural recall places constraints on discourse but rarely occurs in everyday conversation and so can result in overly simplified speech (Sherratt and Bryan, 2019). By contrast, conversational speech is instinctive and naturalistic, though without constraints, samples can vary widely in length and content (Boschi et al., 2017). Recall of both overlearned and novel narratives have the potential to produce acceptably long and complex discourse samples, but recollection and engagement may vary.
There have been few formal comparisons of the sensitivities of different speech sampling approaches to early AD. Sajjadi et al. (2012) reported that conversation elicited using semi-structured interviews contained more fillers, (e.g. “er” and “um”), abandoned units (elements of speech that are started but not completed) and grammatical function words than picture descriptions. Conversely, picture descriptions gave rise to more semantic errors, such as substituting the word “dog” for “cat” (Sajjadi et al., 2012). Beltrami et al. (2016) found that a logistic regression classifier showed marginally superior accuracy when trained using acoustic, rhythmic, lexical and syntactic features derived from descriptive discourse compared to two personal narrative tasks (recalling a dream and describing a working day) in an Italian-speaking population of patients with MCI (F1 = 0.78 vs. 0.70 and 0.76). It seems likely, therefore, that the task used to elicit spoken discourse affects not only the accuracy of machine learning classification but also the nature of the features that distinguish patients’ discourse from that of controls. Here, we report the accuracy of a series of classifiers using input features automatically extracted from five different speech tasks. We report the features found to be important for classification using the two tasks with the highest accuracy—overlearned narrative recall, and picture description.
Materials and Methods
Participants
Fifty participants (see Table 1) were recruited from the St George’s University Hospitals NHS Cognitive Disorders Clinic: 25 healthy controls (HC) and 25 patients with mild AD (n = 13) or MCI (n = 12) (Petersen criteria (Petersen, 2004)). Diagnoses had been made within two years prior to recruitment using imaging, neuropsychological and/or CSF biomarkers as well as clinical information. HC were either friends and family of patients attending clinic or recruited through the Join Dementia Research system (www.joindementiaresearch.nihr.ac.uk). None of the participants gave a history of other conditions which may affect cognition or language such as stroke, epilepsy or chronic mental health conditions, and all provided informed consent. All spoke English as first language. Ethical approval was granted by the Research Ethics Service Committee London–Dulwich, on November 25, 2016 (ref 16/LO/1990).
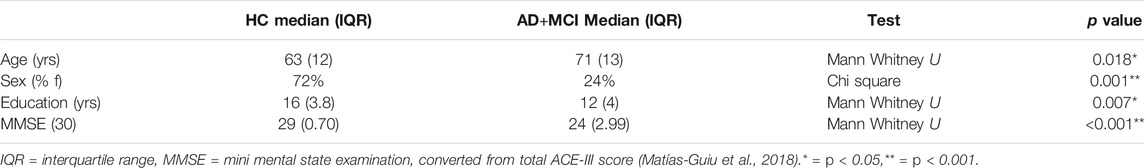
TABLE 1. Participant demographics.
Procedures
Global cognition was assessed with the Addenbrooke’s Cognitive Examination Third Edition (ACE-III) (Hsieh et al., 2013), a widely used measure scored from 0 – 100, with lower scores representing worse functioning.
Connected Speech Tasks
All tasks were administered by the same individual (NC). Only words spoken by the participant were analyzed. We refer to these different approaches as: Picture Description (PD); Conversational Speech (CS); Overlearned Narrative Recall (ONR); Procedural Recall (PR); and Novel Narrative Retelling (NNR).
Picture Description
PDs were elicited using a novel version of the Cookie Theft stimulus, consisting of an updated and colored adaptation the original (Berube et al., 2019). Participants were given the instruction “Tell me everything you see going on in this picture.” No time-constraints were imposed.
Conversational Speech
CS was generated using the Map Task (Thompson et al., 1993), in which the participant and the researcher have an A4 map with landmarks depicted, (e.g. “fast flowing river”). The participant’s map depicts a route traversing the landmarks with a start and finish point. Acting as “Instruction Giver,” they must describe the route to the “Instruction Follower” (the researcher), who recreates the route as faithfully as possible by drawing onto their copy of the map.
Overlearned Narrative Recall
Participants were asked to recall the story of Cinderella from memory. They were given the instruction “I’d like you to tell me, with as much detail as you can, the story of Cinderella.”
Procedural Recall
Participants were asked to recount the procedure for making a cup of tea. They were given the instruction “I’d like you to tell me, in as much detail as you can, how you would make a cup of tea.”
Novel Narrative Retelling
The wordless picture book “Frog, Where Are You?” (by Mercer Mayer) was used as a stimulus for the generation of a novel narrative. Participants looked through the book once, before describing the story based on the pictures.
Transcription
The resulting sample from each connected speech task was transcribed according to conventions detailed in Garrard et al. (2011). Transcription was completed by a single researcher with a subset of 10% re-transcribed by an independent researcher who was blind to participant diagnosis. The inter-rater reliability for transcription of this sample was 84% based on the Levenshtein distance (Navarro, 2001).
Data Analysis
Linguistic Feature Extraction
Two hundred and eighty-six linguistic features, consisting of fine-grained indices reflecting a range of linguistic and para-linguistic phenomena, were extracted from each connected speech task transcript (Table 2). See Supplementary Material for full descriptions of features and extraction methods.
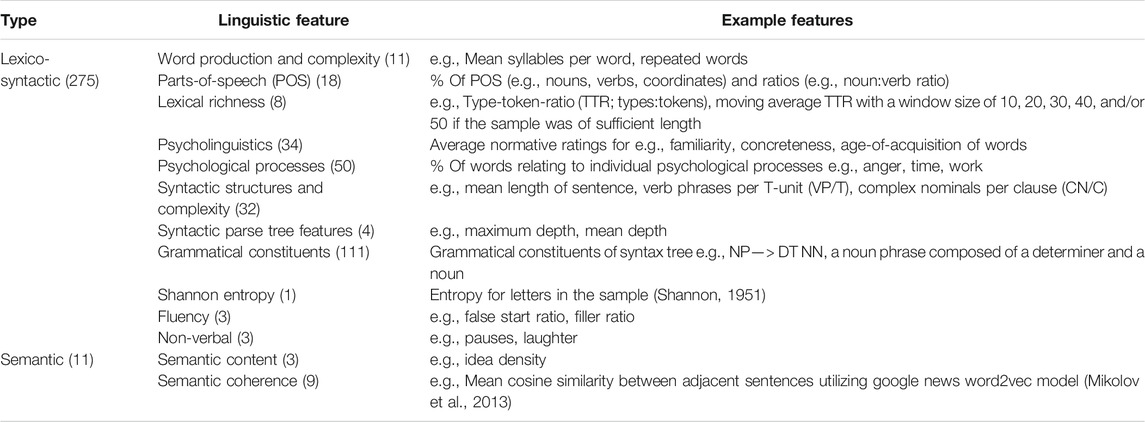
TABLE 2. Linguistic domains covered by features extracted from each task transcript (number of features in brackets).
Feature Selection
Sparse features (defined as those with > 50% zero values for either class) were removed. To render feature scales invariant values were transformed to a scale between 0 and 1 using the MinMax method. To minimize the danger of overfitting, feature selection was applied in each training fold, using i) feature ranking on mutual information with the class, selecting the top 5, 10, 20, and 40; or ii) logistic regression combined with recursive feature elimination (RFE; Guyon et al., 2002), in which each feature is recursively removed from the set and the regression re-trained to classify groups until the optimal subset of 10 features is found1.
Machine Learning
Four participant groups were considered: i) those with clinical evidence to suggest the presence of AD pathology, i.e., mild AD plus those with MCI (AD+MCI); ii) MCI alone, iii) AD alone, and iv) healthy controls (HC). Each vector of selected features was used to train a series of linear support vector machines (SVM) to output three binary classifications: HC vs. AD+MCI, HC vs. AD; and HC vs. MCI. SVM have previously been used to achieve good results with similar data (de la Fuente Garcia et al., 2020), and a linear kernel was chosen to enable extraction of coefficients. The value of C was set to 100 (as in Fraser et al., 2019).
We calculated accuracy and balanced accuracy, due to class imbalance for subgroup classifications. The latter (Equation 1) is similar to conventional accuracy when the classifier performs equally well on either class (or when classes are balanced) but is lower if conventional accuracy is high only due to superior performance on the majority class (Brodersen et al., 2010). TP = true positives, TN = true negatives, FN = false negatives, FP = false positives.
We also report sensitivity [TP/(TP + FN)], specificity [TN/(TN + FP)], and the AUC. K-fold cross-validation was carried out using an 80:20 training:test split; the value of k = 5 was chosen to ensure a reasonable sized test set, given the small dataset. Feature scaling and selection was calculated on each training fold and applied to the test fold. The reported performance is an average across the five folds, with standard deviation reported to indicate variability.
Extraction of Important Features
To identify features important for group classification the learnt coefficients, corresponding to weights associated with each feature during training, were extracted from each fold and ranked by absolute value. Features selected in only one fold were excluded from further analysis. This method uses information from both the feature selection step and the final training step as an indication of importance and aims to find features that are most stable across the model, thus potentially more generalizable.
Between group analyses were conducted for important features using the non-parametric Mann Whitney U test, due to non-Gaussian distribution of features in at least one group. Results were Bonferroni adjusted for multiple comparisons and all p-values are reported in their corrected form (significance threshold (α) = 0.05).
Demographic Variables
HC and AD+MCI groups were not balanced for age, sex and years in education (Table 1). To explore potential confounding on classification results, important linguistic features from the highest accuracy HC vs. AD+MCI classification were used as input in a linear regression to predict age and education, and a linear SVM to classify sex.
Results
Accuracy of Speech Tasks for Classifying Healthy Controls vs. Alzheimer’s disease + Mild Cognitive Impairment
Table 3 shows the classification performance achieved on discourse samples derived from each of the five tasks. ONR, PD and PR produced similar average accuracies and AUCs, but overall sensitivities and specificities varied, with the highest accuracy (0.78) and specificity (0.82) associated with samples generated under the ONR condition.
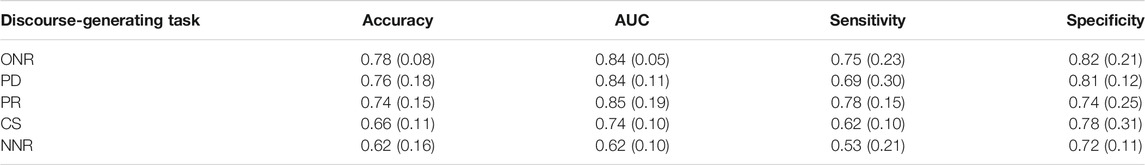
TABLE 3. HC vs. AD+MCI mean (s.d) SVM classification performance across five-fold cross validation for five connected speech tasks, ranked by accuracy.
PD achieved the second highest accuracy (0.76), with similar specificity (0.81) and the same AUC (0.84) as ONR but a lower sensitivity (0.69 compared to 0.75). The condition with the third highest accuracy (PR) achieved the highest sensitivity of all tasks (0.78) but second lowest specificity (0.74). The lowest accuracies and AUCs were obtained using CS and NNR. The s.d. of the mean accuracy and AUC for ONR is smaller than for the remaining tasks (0.08 and 0.05, compared to 0.18 and 0.11 for the second most accurate task, PD) indicating less variability given different training and test data.
Important Features for Classification of Healthy Controls vs. Alzheimer’s disease + Mild Cognitive Impairment
In the interests of brevity, we focused on the features important for the two most accurate tasks – ONR and PD – which both utilized multivariate feature selection.
Overlearned Narrative Recall Features
Table 4 shows 12 features, ranked by number of folds and mean rank across all folds, that were selected in at least two cross-validation folds for ONR samples. A further 14 features were selected only in one fold and were not considered for further analysis.
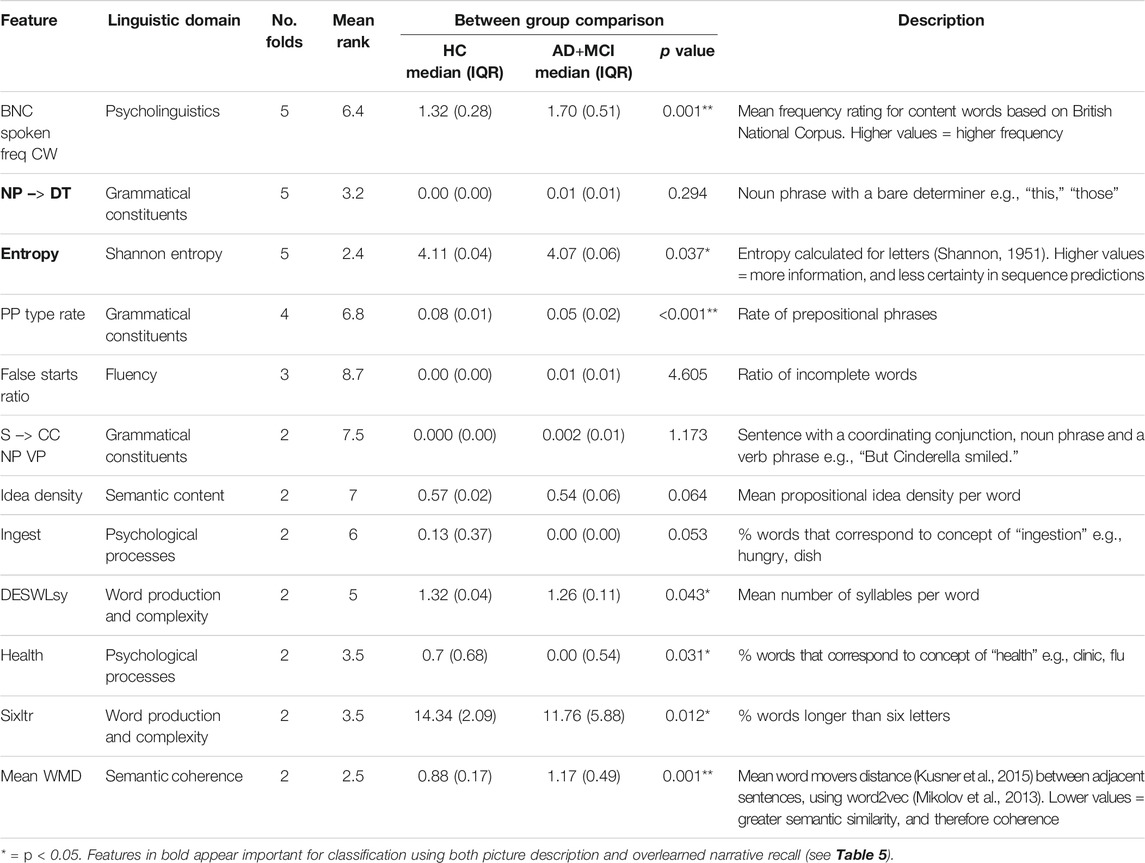
TABLE 4. Important features of overlearned narrative recall for classifying HC vs. AD+MCI. Ordered by number of folds and then mean rank. Mann Whitney U tests Bonferroni adjusted for multiple comparisons and reported in corrected form.
Between-group comparisons of the values of the features selected in the HC vs. AD+MCI classification using the ONR sample are displayed in Table 4. Seven of these features differed significantly: the mean frequency for content words measured according to the British National Corpus (BNC); Shannon entropy for letters; rate of prepositional phrases; percentage of words relating to health; number of syllables per word; the percentage of words longer than six letters; and coherence between adjacent sentences. Comparative scaled values are displayed in Figure 1.
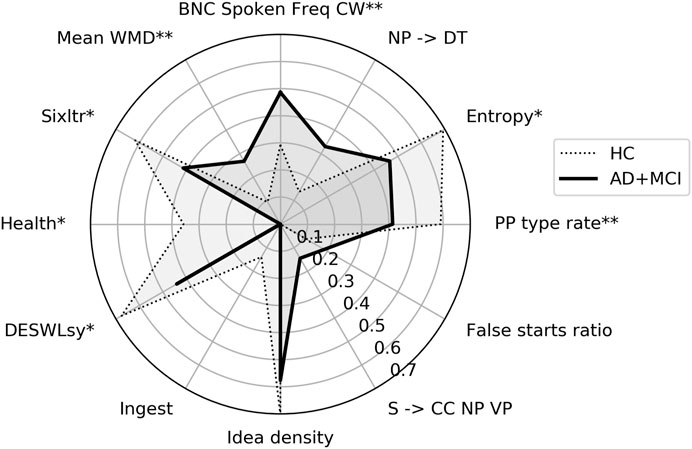
FIGURE 1. Radar plot showing features important for HC vs. AD+MCI classification using overlearned narrative recall. HC = healthy control, AD+MCI = Alzheimer’s disease and Mild Cognitive Impairment group. Features have been scaled to between 0 and 1 using MinMax scaling and medians plotted. * = p < 0.05, ** = p < 0.001.
Picture Description Features
Eleven features were selected in at least two folds using PD samples to classify HC vs. AD+MCI (Table 5). A further 11 features were selected only in one fold and eliminated from further analysis.
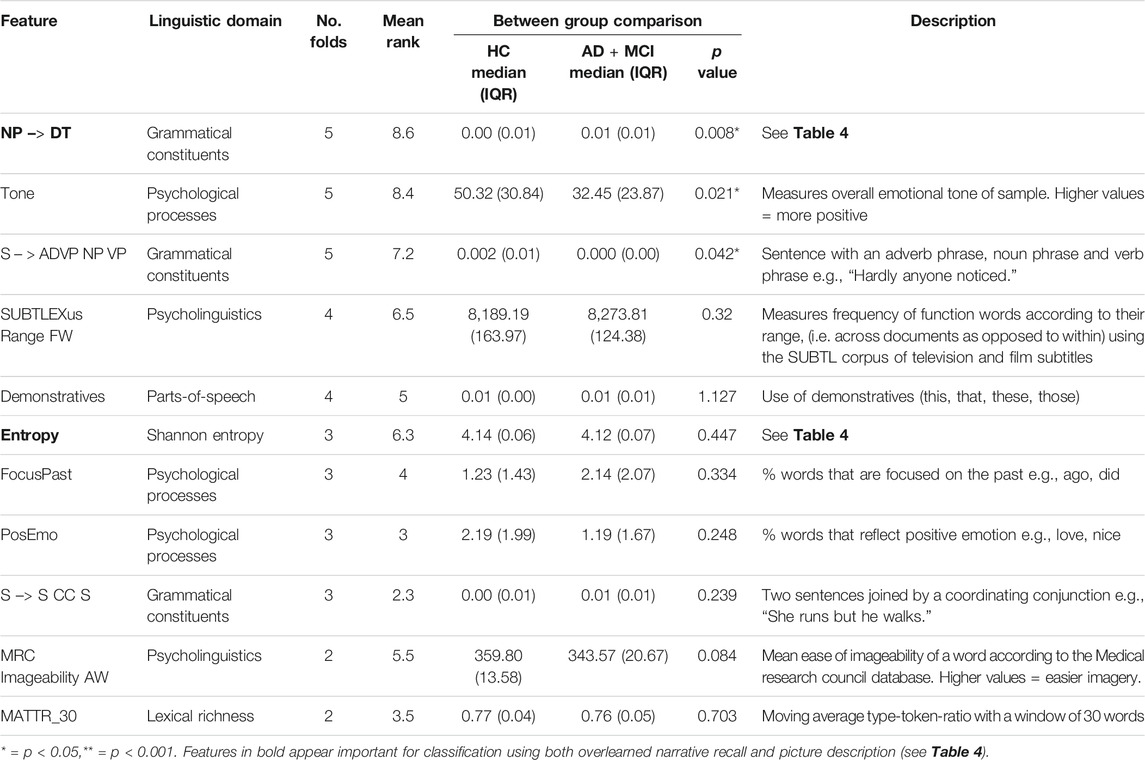
TABLE 5. Important features of picture description for classifying of HC vs. AD + MCI. Mann Whitney U tests Bonferroni adjusted for multiple comparisons and reported in corrected form.
Group comparisons showed significant differences between the values of three features: noun phrases consisting of a bare determiner, emotional tone and sentences composed of an adverbial phrase, noun phrase and verb phrase. Comparative scaled values are plotted in Figure 2.
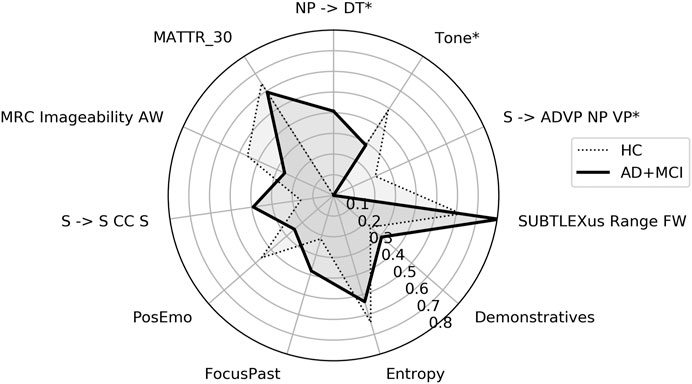
FIGURE 2. Radar plot showing features important for HC vs. AD+MCI classification using picture description. HC = healthy control, AD+MCI = Alzheimer’s disease and Mild Cognitive Impairment group. Features have been scaled to between 0 and 1 using MinMax scaling and medians plotted. * = p < 0.05.
Comparisons of the selected features between the two discourse types reveal that both classifiers learned class membership from grammatical constituents, psycholinguistics and psychological processes (Tables 4 and 5). Two individual features (noun phrases consisting of bare determiners, and entropy) were important to both tasks. By contrast, features relating to semantic richness (Idea Density) and coherence (Mean WMD), as well as word complexity (DESWLsy and Sixltr) were important only for classification in ONR, while lexical richness (MATTR_30) was important only in PD. Moreover, a greater number of features important to the classification of ONR than to the classification of PD showed differences in values between groups.
Accuracies in Subgroup Classifications
MCI and AD subgroups were explored, as important clinically distinctive groups that may differ in management and disease course.
Healthy Controls Versus Alzheimer’s disease
Table 6 reports classification performance for HC vs. AD alone. The highest mean balanced accuracy was achieved with ONR samples (0.90), higher than accuracy classifying the mixed AD+MCI group and balanced accuracy for the MCI alone group (both 0.78). AUC, sensitivity and specificity were also highest of all tasks (0.94, 0.83, and 0.96 respectively). PD produced the lowest balanced accuracy (0.59) and sensitivity (0.50), but third highest AUC (0.75).
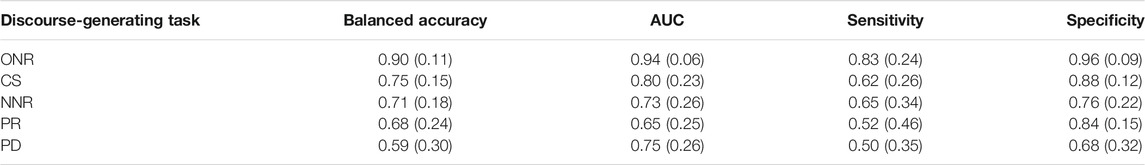
TABLE 6. HC vs. AD mean (s.d) SVM classification performance across five-fold cross-validation for five connected speech tasks, ranked by accuracy.
Healthy Controls Versus Mild Cognitive Impairment
Table 7 reports classification performance for HC vs. MCI alone. The pattern of speech task performance more closely resembles that of HC vs. AD+MCI (Table 3); ONR achieved the highest balanced accuracy (0.78), AUC (0.82), sensitivity (0.67) and specificity (0.90) and NNR produced the lowest balanced accuracy (0.50), AUC (0.50) and sensitivity (0.27). Only the two top performing tasks (ONR and CS) reached sensitivity above chance level.
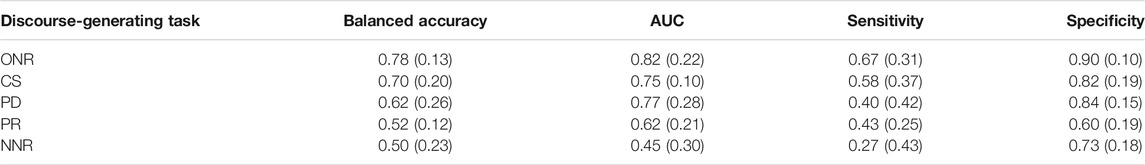
TABLE 7. HC vs. MCI mean (s.d) SVM classification performance across five-fold cross-validation for five connected speech tasks, ranked by accuracy.
Comparing the three classifications, performance was higher in all four metrics for HC vs. AD compared to HC vs. MCI, and HC vs. AD+MCI (Figure 3). Accuracy/balanced accuracy was equal for both HC vs. MCI and HC vs AD+MCI classifications (0.78); AUC and sensitivity were higher for HC vs. AD+MCI but specificity was lower, suggesting poorer correct classification of HC given a mixed patient group, compared to MCI only.
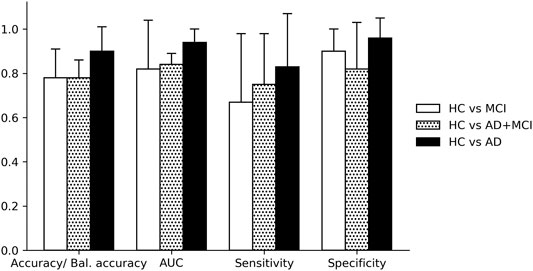
FIGURE 3. Classification performance for groups and subgroups. HC = healthy control, MCI = Mild Cognitive Impairment, AD = Alzheimer’s disease, AD+MCI = Alzheimer’s disease and Mild Cognitive Impairment group. All classifications used linguistic features from the overlearned narrative recall task. Error bars + 1 sd.
Demographic Variables
A linear regression with the twelve important features from ONR (Table 4) as input failed to predict age (whole sample r2 = −0.14, HC alone r2 = −11.9, AD+MCI alone r2 = −1.33) or years in education (whole sample r2 = −0.30, HC alone r2 = −11.83, AD+MCI alone r2 = −5.60)2. Balanced accuracy for classification of sex was greater than chance (0.55), however the male/female split included both HC and AD+MCI participants in both groups.
Discussion
The accuracy of linguistic features automatically extracted from five connected speech tasks for classifying mild AD and MCI was compared. Differences were observed in classification performance using SVM, which, although small for the top performing tasks, indicated differential clinical utility for classifying mild AD and MCI based on task choice.
When comparing cognitively healthy controls with those judged likely on clinical grounds to harbor AD pathology, (i.e. diagnosed with either MCI or AD) the highest accuracy (78%) was achieved using data obtained using ONR. The same data also yielded the highest accuracy in smaller, but clinically relevant, subgroup classifications (mild AD alone or MCI alone compared to HC (90% and 78% respectively)). These results suggest that an overlearned narrative recall task may be the best approach to obtaining discourse samples for detecting early or pre-symptomatic cases of AD, a goal that has become central to successful clinical trial outcomes.
PD achieved the second highest accuracy (76%) supporting the role of a new, updated version of this commonly used task. Sensitivity was lower (69% compared to 75% for ONR), and the task performed poorly for classification of AD only. The accuracy of features probably increases with sample length (Fraser et al., 2016), so the shorter samples obtained from the AD group may have hindered classification. PR, which is also a short task, achieved the third highest accuracy (74%) and was ranked third for detecting mild AD and fourth for MCI.
Although conversational discourse elicited using a map reading task achieved only 66% accuracy to detect AD+MCI, accuracy improved in the subgroup analyses: CS gave the second highest accuracy for mild AD and MCI groups alone, suggesting that critical differences in CS may develop between the MCI and mild dementia stages.
NNR with a picture-book stimulus produced the worst performance for AD+MCI and the MCI subgroup classification. In a previous study in which retellings of the same task were scored by a linguist, only 15% of AD patients grasped the overall theme of the story (Ash et al., 2007). Fine-grained linguistic features alone are unlikely to capture this deficiency and global scoring has not yet been adequately automatized (though see Dunn et al. (2002) for a potential approach based on Latent Semantic Analysis).
The minimum sample length required for meaningful analysis has been subject to debate (Sajjadi et al., 2012). Our main results (AD+MCI classification) suggest that little accuracy is lost when classifying shorter samples (PD and PR), and the lowest accuracy was achieved using the longest samples (NNR). Conditions of the task may therefore be of more importance than resulting sample length, useful for clinical adoption. However, when little data is available, and samples are short (such as in the AD alone classification), classification performance may suffer.
Features Important for Classification
Although the advantage of ONR may simply be task-related, (i.e. due to the involvement of memory as well as language), it is also instructive to examine features that were robustly selected and the overlap with those selected from PD samples. As in Sajjadi et al. (2012) and Beltrami et al. (2016) a multi-domain linguistic impairment was detected in the patient group, with changes evident in lexical, semantic and syntactic features, and speech tasks showing varying sensitivity to these changes.
Word Frequency
In keeping with the findings of Garrard et al. (2005) and those of Masrani et al. (2017) participants in the AD+MCI group used words with higher lexical frequency. Studies of patients with isolated degradation of semantic knowledge due to focal left anterior temporal atrophy semantic dementia (SD) have found that specific terms are replaced with higher frequency generic usages (Bird et al., 2000; Fraser et al., 2014; Meteyard et al., 2014). Word frequency can therefore be seen as reflecting the integrity of the brain’s store of world knowledge, a deficit that is seen in a high proportion of patients with early AD (Hodges et al., 1992).
Entropy
Entropy was retained in five folds using ONR, and three for PD. Entropy quantifies the information content contained in a string of letters (Shannon, 1951): the more predictable a letter is on the basis of those that come before it, the lower its entropy. Averaged over letters, entropy was significantly lower in the AD+MCI group using ONR, suggesting greater predictability in these samples. Entropy in discourse samples elicited using PD correlates with global cognition (Hernández-Domínguez et al., 2018), and the findings of the current study also suggest that lower values are indicative of early AD, and that this is constant across tasks. Lower levels of entropy may inherently vary between tasks Chen et al. (2017); the current study found lower values in ONR than in PD discourse, with between-group differences significant in the former. The value of entropy may therefore be greater when considering more cognitively demanding tasks.
Emotional Tone
The overall emotional tone (a “summary variable” calculated by LIWC2015 (Pennebaker et al., 2015)) of the sample was an important feature in PD, with the tone adopted by the AD+MCI group significantly more negative than HC. The same did not apply in ONR samples, for which the emotional tone is more tightly constrained by the story itself. Use of positive words was also lower in the AD+MCI group. Individuals with depression use more negative words in their writing (Rude et al., 2004), and depression commonly coexists with AD, for which it may also be a risk factor in older adults (Kitching, 2015; Herbert and Lucassen, 2016).
Grammatical Constituents
Classifications based on both ONR and PD retained in all folds the increased frequency with which participants in the AD + MCI group formed a noun phrase using a bare determiner (NP – > DT), e.g. “look at this” as opposed to “look at this jar”. Determiners can serve a deictic purporse, so speech tasks with a pictorial stimulus may be more sensitive to their use; Sajjadi et al. (2012) reported a greater proportion of function words, including determiners, in PD than CS, and the difference between groups in the current study was significant for PD only. Greater numbers of determiners (Petti et al., 2020) and fewer nouns (Bucks et al., 2000; Jarrold et al., 2014) have been independently reported as features of AD discourse, but it is likely that specifying the role of the determiner in the sentence (as in NP –> DT) adds discriminatory power. A similar interpretation may obtain in the case of sentences consisting of an adverbial phrase, noun phrase and verb phrase (S –> ADVP NP V), which were also more frequent in HC discourse and may either denote richer descriptions of the picture, or a greater tendency to relate utterances to one another, e.g. by using “then”.
Remaining Features
We make note of two remaining features: imageability (MRC Imageability AW) and word-movers distance (WMD). Although selected in fewer than five folds, median imageability measured in PD was numerically lower in the AD+MCI group. This “reverse imageability effect” has also been observed in speech of SD patients (Bird et al., 2000; Hoffman et al., 2014), and can be explained as a consequence of reliance on a more generic, and thus higher frequency, vocabulary: consider the less imageable “place” and the more imageable “cathedral” (Bird et al., 2000; Hoffman et al., 2014).
The mean WMD, although retained in only two folds of the ONR classifier, was significantly different between groups. Using word2vec embeddings, WMD measures the minimum cumulative distance required to travel between collections of word vectors in a high-dimensional semantic space, analogous with coherence (Mikolov et al., 2013; Kusner et al., 2015). Other measures of coherence, however, are based on the cosine of the angle between the vectors of consecutive sentences, which requires multiple word vectors to be combined into a sentence vector (Dunn et al., 2002; Holshausen et al., 2014; Mirheidari et al., 2018). This step is obviated by WMD. To the best of the author’s knowledge this is the first study to show WMD as a discriminatory feature of AD and MCI speech. The measure may show differences in ONR alone because the presence of the stimulus in PD acts as a continuous referential prompt, facilitating the coherent connection of sequential utterances.
Strengths and Limitations
Demographic variables were not balanced across groups, unfortunately a common issue (de la Fuente Garcia et al., 2020). Given that the linguistic function of participants pre-diagnosis is not known, conclusions regarding between-group differences are drawn with caution. We have explored demographic variables and find little evidence of mediation, although they may still act as moderators. The population studied is small, which may account for small differences in accuracy observed for the three highest scoring tasks classifying AD+MCI. Subgroup sizes are further reduced, and these results are therefore less reliable. We have attempted to improve reliability by reporting results of cross-validation. Hyper-parameters were not tuned, e.g. via a grid search, which may improve results.
Acoustic features were not studied as extraction was beyond the scope of the study—their inclusion may have improved performance, seen in previous research such as Fraser et al. (2016) and Beltrami et al. (2016). One strength is that our AD+MCI group (and AD subgroup) were more mildly affected than those classified in Fraser et al. (2016) (mean MMSE 18.5, compared to AD+MCI mean of 24 and AD subgroup mean of 22.5), and so likely represent a more challenging classification task.
Compared to current tests, the reported AUC for detecting MCI is higher than the MMSE (82% compared to 74% (Ciesielska et al., 2016)) with similar sensitivity but better specificity (67% and 90% compared to 66% and 73%). Compared to FDG-PET for AD detection sensitivity is slightly lower with better specificity (83% and 96% compared to 86% for both (Patwardhan et al., 2004)).
Conclusion and Future Work
The results of the current study indicate that linguistic analysis could be used to detect mild AD and MCI, as well as these subgroups compared to healthy controls - an important clinical task – in a novel dataset. Computational analysis of language would offer a rapid, scalable and low-cost assessment of individuals, that could be built in to remote assessment, such as via a smartphone app, less obtrusive and anxiety provoking than current biomarker tests. We have shown, in a direct comparison of the same participants, that the choice of speech task impacts subsequent performance of classifiers trained to recognize mild AD and MCI based on linguistic features. Tasks that probe memory and language may be optimal. Although some features appear important for classification independent of discourse type, tasks may be sensitive to different linguistic features in early AD; due to the reliance on PD in previous studies, some features susceptible to disease may have garnered less attention. This has implications for future work seeking to characterize AD and MCI based on speech, and clinical adoption of computational approaches. Future work could look to explore use of different tasks in larger samples, and include novel features found here important in classifying groups to improve sensitivity to disease, such as the WMD and analysis of emotional tone. Longitudinal assessment of healthy individuals prior to a possible later diagnosis of AD is needed, in order to identify very early linguistic changes and delineate the impact of Alzheimer pathology on language from other factors. Such studies are underway and beginning to provide important insights (Mueller et al., 2018).
Data Availability Statement
The raw data supporting the conclusion of this article will be made available by the authors, without undue reservation.
Ethics Statement
The studies involving human participants were reviewed and approved by the Research Ethics Service Committee London-Dulwich. The patients/participants provided their written informed consent to participate in this study.
Author Contributions
All authors contributed to conception and design of the study. NC collected the data, performed the analysis and wrote the first draft of the manuscript. All authors contributed to manuscript revision, read, and approved the submitted version.
Funding
This research was funded by the Medical Research Council (grant number MR/N013638/1).
Conflict of Interest
The authors declare that the research was conducted in the absence of any commercial or financial relationships that could be construed as a potential conflict of interest.
Supplementary Material
The Supplementary Material for this article can be found online at: https://www.frontiersin.org/articles/10.3389/fcomp.2021.634360/full#supplementary-material
Footnotes
1The feature set size of 10 was pre-determined according to the highest average accuracy when using the filter approach: taking the mean accuracy across all five tasks for each threshold of k, 10 was the highest.
2Negative r2 values indicate that predicting the mean dependent variable for each instance would explain more variance than a model based on the input feature.
References
Ahmed, S., Haigh, A.-M. F., de Jager, C. A., and Garrard, P. (2013). Connected Speech as a Marker of Disease Progression in Autopsy-Proven Alzheimer's Disease. Brain 136 (12), 3727–3737. doi:10.1093/brain/awt269
Albert, M. S., DeKosky, S. T., Dickson, D., Dubois, B., Feldman, H. H., Fox, N. C., et al. (2011). The Diagnosis of Mild Cognitive Impairment Due to Alzheimer's Disease: Recommendations from the National Institute on Aging-Alzheimer's Association Workgroups on Diagnostic Guidelines for Alzheimer's Disease. Alzheimer's Demen. 7 (3), 270–279. doi:10.1016/j.jalz.2011.03.008
Asgari, M., Kaye, J., and Dodge, H. (2017). Predicting Mild Cognitive Impairment from Spontaneous Spoken Utterances. Alzheimer's Demen. Translational Res. Clin. Interventions 3 (2), 219–228. doi:10.1016/j.trci.2017.01.006
Ash, S., Moore, P., Antani, S., McCawley, G., Work, M., and Grossman, M. (2006). Trying to Tell a Tale: Discourse Impairments in Progressive Aphasia and Frontotemporal Dementia. Neurology 66 (9), 1405–1413. doi:10.1212/01.wnl.0000210435.72614.38
Ash, S., Moore, P., Vesely, L., and Grossman, M. (2007). The Decline of Narrative Discourse in Alzheimer's Disease. Brain Lang. 103 (1), 181–182. doi:10.1016/j.bandl.2007.07.105
Beltrami, D., Calzà, L., Gagliardi, G., Ghidoni, E., Marcello, N., Favretti, R. R., et al. (2016). “Automatic Identification of Mild Cognitive Impairment through the Analysis of Italian Spontaneous Speech Productions,” in LREC, Portorož, Slovenia, May 23–28, 2016, 16, 2086–2093.
Berisha, V., Wang, S., LaCross, A., and Liss, J. (2015). Tracking Discourse Complexity Preceding Alzheimer's Disease Diagnosis: A Case Study Comparing the Press Conferences of Presidents Ronald Reagan and George Herbert Walker Bush. Jad 45 (3), 959–963. doi:10.3233/jad-142763
Berube, S., Nonnemacher, J., Demsky, C., Glenn, S., Saxena, S., Wright, A., et al. (2019). Stealing Cookies in the Twenty-First Century: Measures of Spoken Narrative in Healthy versus Speakers with Aphasia. Am. J. Speech Lang. Pathol. 28 (1S), 321–329. doi:10.1044/2018_AJSLP-17-0131
Bird, H., Lambon Ralph, M. A., Patterson, K., and Hodges, J. R. (2000). The Rise and Fall of Frequency and Imageability: Noun and Verb Production in Semantic Dementia. Brain Lang. 73 (1), 17–49. doi:10.1006/brln.2000.2293
Bloudek, L. M., Spackman, D. E., Blankenburg, M., and Sullivan, S. D. (2011). Review and Meta-Analysis of Biomarkers and Diagnostic Imaging in Alzheimer's Disease. Jad 26 (4), 627–645. doi:10.3233/jad-2011-110458
Boschi, V., Catricalà, E., Consonni, M., Chesi, C., Moro, A., and Cappa, S. F. (2017). Connected Speech in Neurodegenerative Language Disorders: A Review. Front. Psychol. 8, 269. doi:10.3389/fpsyg.2017.00269
Brodersen, K. H., Ong, C. S., Stephan, K. E., and Buhmann, J. M. (2010). The Balanced Accuracy and its Posterior Distribution. Proc.—Int. Conf. Pattern Recognition, 3121–3124. doi:10.1109/ICPR.2010.764
Bucks, R. S., Singh, S., Cuerden, J. M., and Wilcock, G. K. (2000). Analysis of Spontaneous, Conversational Speech in Dementia of Alzheimer Type: Evaluation of an Objective Technique for Analysing Lexical Performance. Aphasiology 14 (1), 71–91. doi:10.1080/026870300401603
Carnero-Pardo, C. (2014). Should the Mini-Mental State Examination Be Retired?. Neurología (English Edition) 29 (8), 473–481. doi:10.1016/j.nrleng.2013.07.005
Chen, R., Liu, H., and Altmann, G. (2017). Entropy in Different Text Types. Digital Scholarship Humanities 32 (3), fqw008–542. doi:10.1093/llc/fqw008
Ciesielska, N., Sokołowski, R., Mazur, E., Podhorecka, M., Polak-Szabela, A., and Kędziora-Kornatowska, K. (2016). Is the Montreal Cognitive Assessment (MoCA) Test Better Suited Than the Mini-Mental State Examination (MMSE) in Mild Cognitive Impairment (MCI) Detection Among People Aged over 60? Meta-Analysis. Psychiatr. Pol. 50 (5), 1039–1052. doi:10.12740/pp/45368
Clarke, N., Foltz, P., and Garrard, P. (2020). How to Do Things with (Thousands of) Words: Computational Approaches to Discourse Analysis in Alzheimer's Disease. Cortex 129, 446–463. doi:10.1016/j.cortex.2020.05.001
Cummings, J., Aisen, P. S., Dubois, B., Frölich, L., Jack, C. R., Jones, R. W., et al. (2016). Drug Development in Alzheimer's Disease: the Path to 2025. Alz Res. Ther. 8 (1), 1–12. doi:10.1186/s13195-016-0207-9
de la Fuente Garcia, S., Ritchie, C., and Luz, S. (2020). Artificial Intelligence, Speech, and Language Processing Approaches to Monitoring Alzheimer’s Disease: A Systematic Review. J. Alzheimers Dis., (Preprint), 1–27.
Drummond, C. u., Coutinho, G., Fonseca, R. P., Assunção, N., Teldeschi, A., de Oliveira-Souza, R., et al. (2015). Deficits in Narrative Discourse Elicited by Visual Stimuli Are Already Present in Patients with Mild Cognitive Impairment. Front. Aging Neurosci. 7. doi:10.3389/fnagi.2015.00096
Dunn, J. C., Almeida, O. P., Barclay, L., Waterreus, A., and Flicker, L. (2002). Latent Semantic Analysis: A New Method to Measure Prose Recall. J. Clin. Exp. Neuropsychol. 24 (1), 26–35. doi:10.1076/jcen.24.1.26.965
Folstein, M. F., Folstein, S. E., and McHugh, P. R. (1975). “Mini-mental State”. J. Psychiatr. Res. 12, 189–198. doi:10.1016/0022-3956(75)90026-6
Forbes-McKay, K. E., and Venneri, A. (2005). Detecting Subtle Spontaneous Language Decline in Early Alzheimer's Disease with a Picture Description Task. Neurol. Sci. 26 (4), 243–254. doi:10.1007/s10072-005-0467-9
Fraser, K. C., Lundholm Fors, K., Eckerström, M., Öhman, F., and Kokkinakis, D. (2019). Predicting MCI Status from Multimodal Language Data Using Cascaded Classifiers. Front. Aging Neurosci. 11, 205. doi:10.3389/fnagi.2019.00205
Fraser, K. C., Meltzer, J. A., Graham, N. L., Leonard, C., Hirst, G., Black, S. E., et al. (2014). Automated Classification of Primary Progressive Aphasia Subtypes from Narrative Speech Transcripts. Cortex 55 (1), 43–60. doi:10.1016/j.cortex.2012.12.006
Fraser, K. C., Meltzer, J. A., and Rudzicz, F. (2015). Linguistic Features Identify Alzheimer's Disease in Narrative Speech. Jad 49, 407–422. doi:10.3233/JAD-150520
Garrard, P. (2009). Cognitive Archaeology: Uses, Methods, and Results. J. Neurolinguist. 22 (3), 250–265. doi:10.1016/j.jneuroling.2008.07.006
Garrard, P., Haigh, A.-M., and de Jager, C. (2011). Techniques for Transcribers: Assessing and Improving Consistency in Transcripts of Spoken Language. Literary Linguistic Comput. 26 (4), 389–405. doi:10.1093/llc/fqr018
Garrard, P., Maloney, L. M., Hodges, J. R., and Patterson, K. (2005). The Effects of Very Early Alzheimer's Disease on the Characteristics of Writing by a Renowned Author. Brain 128 (2), 250–260. doi:10.1093/brain/awh341
Guyon, I., Weston, J., Barnhill, S., and Vapnik, V. (2002). Gene Selection for Cancer Classification Using Support Vector Machines. Machine Learn. 46, 389–422. doi:10.1007/978-3-540-88192-6-810.1023/a:1012487302797
Herbert, J., and Lucassen, P. J. (2016). Depression as a Risk Factor for Alzheimer's Disease: Genes, Steroids, Cytokines and Neurogenesis—what Do We Need to Know?. Front. Neuroendocrinology 41, 153–171. doi:10.1016/j.yfrne.2015.12.001
Hernández-Domínguez, L., Ratté, S., Sierra-Martínez, G., and Roche-Bergua, A. (2018). Computer-based Evaluation of Alzheimer’s Disease and Mild Cognitive Impairment Patients during a Picture Description Task. Alzheimer’s Demen. Diagn. Assess. Dis. Monit. 10, 260–268. doi:10.1016/j.dadm.2018.02.004
Hodges, J. R., Salmon, D. P., and Butters, N. (1992). Semantic Memory Impairment in Alzheimer's Disease: Failure of Access or Degraded Knowledge?. Neuropsychologia 30 (4), 301–314. doi:10.1016/0028-3932(92)90104-t
Hoffman, P., Meteyard, L., and Patterson, K. (2014). Broadly Speaking: Vocabulary in Semantic Dementia Shifts towards General, Semantically Diverse Words. Cortex 55 (1), 30–42. doi:10.1016/j.cortex.2012.11.004
Holshausen, K., Harvey, P. D., Elvevåg, B., Foltz, P. W., and Bowie, C. R. (2014). Latent Semantic Variables Are Associated with Formal Thought Disorder and Adaptive Behavior in Older Inpatients with Schizophrenia. Cortex 55 (1), 88–96. doi:10.1016/j.cortex.2013.02.006
Hsieh, S., Schubert, S., Hoon, C., Mioshi, E., and Hodges, J. R. (2013). Validation of the Addenbrooke's Cognitive Examination III in Frontotemporal Dementia and Alzheimer's Disease. Dement Geriatr. Cogn. Disord. 36, 242–250. doi:10.1159/000351671
Jack, C. R., Knopman, D. S., Jagust, W. J., Shaw, L. M., Aisen, P. S., Weiner, M. W., et al. (2010). Hypothetical Model of Dynamic Biomarkers of the Alzheimer's Pathological Cascade. Lancet Neurol. 9 (1), 119–128. doi:10.1016/S1474-4422(09)70299-6
Jarrold, W., Peintner, B., Wilkins, D., Vergryi, D., Richey, C., Gorno-Tempini, M. L., et al. (2014). Aided Diagnosis of Dementia Type through Computer-Based Analysis of Spontaneous Speech. Proc. Workshop Comput. Linguistics Clin. Psychol. Linguistic Signal Clin. Reality, 27–37. doi:10.3115/v1/W14-3204
Kitching, D. (2015). Depression in Dementia. Aust. Prescr 38 (6), 209–211. doi:10.18773/austprescr.2015.071
Kusner, M. J., Sun, Y., Kolkin, N. I., and Weinberger, K. Q. (2015). “From Word Embeddings to Document Distances,” in Proceedings of the 32nd International Conference on Machine Learning, 957–966.
Laske, C., Sohrabi, H. R., Frost, S. M., López-de-Ipiña, K., Garrard, P., Buscema, M., et al. (2015). Innovative Diagnostic Tools for Early Detection of Alzheimer's Disease. Alzheimer's Demen., 11, 561–578. doi:10.1016/j.jalz.2014.06.004
Lombardi, G., Crescioli, G., Cavedo, E., Lucenteforte, E., Casazza, G., Bellatorre, A. G., and Filippini, G. (2020). Structural Magnetic Resonance Imaging for the Early Diagnosis of Dementia Due to Alzheimer's Disease in People with Mild Cognitive Impairment. Cochrane Database Syst. Rev. (3). doi:10.1002/14651858.cd009628.pub2
Lovestone, S. (2014). Blood Biomarkers for Alzheimer's Disease. Genome Med. 6 (8), 8–11. doi:10.1186/s13073-014-0065-7
MacWhinney, B. (2019). Understanding Spoken Language through TalkBank. Behav. Res. 51 (4), 1919–1927. doi:10.3758/s13428-018-1174-9
Masrani, V., Murray, G., Field, T., and Carenini, G. (2017). “Detecting Dementia through Retrospective Analysis of Routine Blog Posts by Bloggers with Dementia,” in BioNLP 2017, 232–237. Retrieved from: http://www.aclweb.org/anthology/W17-2329 (Accessed September 12, 2017).
Matias-Guiu, J. A., Cortés-Martínez, A., Valles-Salgado, M., Rognoni, T., Fernández-Matarrubia, M., Moreno-Ramos, T., et al. (2016). Addenbrooke's Cognitive Examination III: Diagnostic Utility for Mild Cognitive Impairment and Dementia and Correlation with Standardized Neuropsychological Tests. Int. Psychogeriatr. 29 (1), 105–113. doi:10.1017/S1041610216001496
Matías-Guiu, J. A., Pytel, V., Cortés-Martínez, A., Valles-Salgado, M., Rognoni, T., Moreno-Ramos, T., et al. (2018). Conversion between Addenbrooke's Cognitive Examination III and Mini-Mental State Examination. Int. Psychogeriatr. 30 (8), 1227–1233. doi:10.1017/S104161021700268X
McKhann, G. M., Knopman, D. S., Chertkow, H., Hyman, B. T., Jack, C. R., Kawas, C. H., et al. (2011). The Diagnosis of Dementia Due to Alzheimer's Disease: Recommendations from the National Institute on Aging-Alzheimer's Association Workgroups on Diagnostic Guidelines for Alzheimer's Disease. Alzheimer's Demen. 7 (3), 263–269. doi:10.1016/j.jalz.2011.03.005
Meteyard, L., Quain, E., and Patterson, K. (2014). Ever Decreasing Circles: Speech Production in Semantic Dementia. Cortex 55 (1), 17–29. doi:10.1016/j.cortex.2013.02.013
Mikolov, T., Chen, K., Corrado, G., and Dean, J. (2013). Efficient Estimation of Word Representations in Vector Space, 1–12. doi:10.1162/153244303322533223
Mirheidari, B., Blackburn, D., Walker, T., Reuber, M., and Christensen, H. (2019). Dementia Detection Using Automatic Analysis of Conversations. Computer Speech Lang. 53, 65–79. doi:10.1016/j.csl.2018.07.006
Mirheidari, B., Blackburn, D., Walker, T., Venneri, A., Reuber, M., and Christensen, H. (2018). Detecting Signs of Dementia Using Word Vector Representations. Proc. Interspeech 2018, Hyderabad, India, September 2–6, 2018, 1893–1897. doi:10.21437/Interspeech.2018-1764
Mitchell, A. J. (2009). CSF Phosphorylated Tau in the Diagnosis and Prognosis of Mild Cognitive Impairment and Alzheimer's Disease: a Meta-Analysis of 51 Studies. J. Neurol. Neurosurg. Psychiatry 80 (9), 966–975. doi:10.1136/jnnp.2008.167791
Mueller, K. D., Koscik, R. L., Hermann, B. P., Johnson, S. C., and Turkstra, L. S. (2018). Declines in Connected Language Are Associated with Very Early Mild Cognitive Impairment: Results from the Wisconsin Registry for Alzheimer's Prevention. Front. Aging Neurosci. 9, 1–14. doi:10.3389/fnagi.2017.00437
Nasreddine, Z. S., Phillips, N. A., Bédirian, V., Charbonneau, S., Whitehead, V., Collin, I., et al. (2005). The Montreal Cognitive Assessment, MoCA: A Brief Screening Tool for Mild Cognitive Impairment. J. Am. Geriatr. Soc. (53), 695–699. doi:10.1029/WR017i002p00410
Navarro, G. (2001). A Guided Tour to Approximate String Matching. ACM Comput. Surv. 33 (1), 31–88. doi:10.1145/375360.375365
Orimaye, S. O., Wong, J. S.-M., and Wong, C. P. (2018). Deep Language Space Neural Network for Classifying Mild Cognitive Impairment and Alzheimer-type Dementia. PLoS ONE 13 (11), e0205636–15. doi:10.1371/journal.pone.0205636
Patwardhan, M. B., McCrory, D. C., Matchar, D. B., Samsa, G. P., and Rutschmann, O. T. (2004). Alzheimer Disease: Operating Characteristics of PET- A Meta-Analysis. Radiology 231 (1), 73–80. doi:10.1148/radiol.2311021620
Pennebaker, J. W., Boyd, R. L., Jordan, K., and Blackburn, K. (2015). The Development and Psychometric Properties of LIWC2015. Austin, TX: University of Texas at Austin.
Petersen, R. C. (2004). Mild Cognitive Impairment as a Diagnostic Entity. J. Intern. Med. 256, 183–194. doi:10.1111/j.1365-2796.2004.01388.x
Petti, U., Baker, S., and Korhonen, A. (2020). A Systematic Literature Review of Automatic Alzheimer's Disease Detection from Speech and Language. J. Am. Med. Inform. Assoc. 27 (0), 1784–1797. doi:10.1093/jamia/ocaa174
Rude, S., Gortner, E.-M., and Pennebaker, J. (2004). Language Use of Depressed and Depression-Vulnerable College Students. Cogn. Emot. 18 (8), 1121–1133. doi:10.1080/02699930441000030
Sajjadi, S. A., Patterson, K., Tomek, M., and Nestor, P. J. (2012). Abnormalities of Connected Speech in Semantic Dementia v.s Alzheimer's Disease. Aphasiology 26 (6), 847–866. doi:10.1080/02687038.2012.654933
Shannon, C. E. (1951). Prediction and Entropy of Printed English. Bell Syst. Tech. J. 30 (1), 50–64. doi:10.1002/j.1538-7305.1951.tb01366.x
Sherratt, S., and Bryan, K. (2019). Textual Cohesion in Oral Narrative and Procedural Discourse: the Effects of Ageing and Cognitive Skills. Int. J. Lang. Commun. Disord. 54 (1), 95–109. doi:10.1111/1460-6984.12434
Thompson, H. S., Anderson, A., Bard, E. G., Doherty-Sneddon, G., Newlands, A., and Sotillo, C. (1993). The HCRC Map Task Corpus. Proc. Workshop Hum. Lang. Technology, 25–30. doi:10.3115/1075671.1075677
Toledo, C. M., Aluísio, S. M., Santos, L. B., Brucki, S. M. D., Trés, E. S., Oliveira, M. O., et al. (2017). Analysis of Macrolinguistic Aspects of Narratives from Individuals with Alzheimer's Disease, Mild Cognitive Impairment, and No Cognitive Impairment. Alzheimer's Demen. Diagn. Assess. Dis. Monit. 10, 31–40. doi:10.1016/j.dadm.2017.08.005
Keywords: machine learning, natural language processing, dementia, connected speech, alzheimer's disease, mild cognitive impairment, discourse, spontaneous speech
Citation: Clarke N, Barrick TR and Garrard P (2021) A Comparison of Connected Speech Tasks for Detecting Early Alzheimer’s Disease and Mild Cognitive Impairment Using Natural Language Processing and Machine Learning. Front. Comput. Sci. 3:634360. doi: 10.3389/fcomp.2021.634360
Received: 27 November 2020; Accepted: 04 May 2021;
Published: 31 May 2021.
Edited by:
Fasih Haider, University of Edinburgh, United KingdomReviewed by:
Mohammad Soleymani, University of Southern California, United StatesLoredana Sundberg Cerrato, Nuance Communications, United States
Copyright © 2021 Clarke, Barrick and Garrard. This is an open-access article distributed under the terms of the Creative Commons Attribution License (CC BY). The use, distribution or reproduction in other forums is permitted, provided the original author(s) and the copyright owner(s) are credited and that the original publication in this journal is cited, in accordance with accepted academic practice. No use, distribution or reproduction is permitted which does not comply with these terms.
*Correspondence: Natasha Clarke, cDE2MDc1NDRAc2d1bC5hYy51aw==