 Adel Shaban
 Elaine Pearson
 Victor Chang1
95% of researchers rate our articles as excellent or good
Learn more about the work of our research integrity team to safeguard the quality of each article we publish.
Find out more
ORIGINAL RESEARCH article
Front. Comput. Sci. , 06 July 2021
Sec. Human-Media Interaction
Volume 3 - 2021 | https://doi.org/10.3389/fcomp.2021.617056
This article is part of the Research Topic Web Accessibility View all 9 articles
This study presents a gamified application for children with learning disabilities, designed to train and improve their working memory capacity. The application takes the form of a treasure hunt and is designed according to a framework incorporating a set of guidelines derived from accessibility, usability, and cognitive load theory principles, and from gamification techniques. The aim is to motivate and engage the children in working memory-training activities and exploit their working memory capacity. The main focus of this study is the evaluation of the cognitive load level induced by the application, the children’s perceived experience, and their training performance over the training period. A sample of 12 Egyptian children with learning disabilities completed a five-week training period using the application, followed by an evaluation process. The evaluation took the form of a simple usability survey, an unstructured observation, and a cognitive load measurement scale. The purpose was to evaluate the children’s perceived experience, assess the level of cognitive load experienced in each of the activities, and measure the expected improvement in the children’s training performance. The results revealed that all the children enjoyed playing the gamified application, were eager to participate in the daily training, and the cognitive load experienced during the training was found to be generally appropriate, although some areas for improvement were identified. Finally, the children’s training performance and their perceived experience were better in the gamified activities with a lower cognitive load level.
User experience (UX) as one of the concepts of human–computer interaction (HCI) and its evaluation in the games particularly developed for children have become recently an interesting topic for many researchers (Rico-Olarte et al., 2017). UX is a wide field that studies the whole experience of a user with a product, a system, or a service. This field usually focuses on issues such as usability, ergonomics, cognitive load, and affective experiences. Therefore, HCI concepts, incorporating UX, were originally proposed to ensure that the user interface of a system is easy to use, functional, and enjoyable in addition to reducing the memory load for the users (Hermawati and Lawson, 2016).
Thus, a successful user interface must respect the limits of human cognitive processing (Tracy and Albers, 2007) and in turn try to diminish the cognitive overload to improve usability and, as a result, can also free up mental resources that could be directed to maximize understanding of the educational content, especially for individuals with a deficiency in working memory capacity (Tracy and Albers, 2007; Hollender et al., 2010). A clear example of those individuals with a deficiency in working memory capacity is children with learning disabilities (Swanson and Siegel, 2001; Maehler and Schuchardt, 2016). These children also often have a lower level of motivation (Zisimopoulos and Galanaki, 2009; Saputra, 2015); therefore, they can be supported using three approaches: training their limited working memory capacity (MacCormack and Matheson, 2015), developing effective learning environments that minimize the cognitive overload that might hamper learning (MacCormack and Matheson, 2015), or designing engaging and motivational gamified applications (Saputra, 2015). The challenge in designing such applications is to consider the needs of this group of children (e.g., less demanding tasks), motivation (e.g., embedding appropriate game elements and improving their experience with the application), and the cognitive characteristics (e.g., limited working memory capacity) (Cooper, 1998; Ottersen and Grill, 2015).
Few gamified applications exist that are designed according to specific guidelines for children with learning disabilities. Therefore, this study works on combining the fields of HCI and accessibility with principles of gamification to produce a gamified application specifically to improve the working memory capacity of children with learning disabilities. The current application, “The Treasure,” was designed according to a framework incorporating a set of guidelines (as shown in the Supplementary Figure S1, and Supplementary Table S1) derived from HCI, accessibility, gamification techniques, and cognitive load theory. It explores how these concepts can be successfully applied to reduce the cognitive load level while maintaining the challenge and motivation for those children to focus on achieving the tasks in a fun and engaging way. The developed application takes the form of a meaningful story with six gamified activities to train verbal, visuospatial, and executive functions of the WM. The Treasure application was designed as a contest between a passive virtual competitor (the pirate) and the child. The child plays against the pirate to collect the treasure through correct responses; the goal is to beat the pirate and win the treasure.
There is little research about evaluation of gamified cognitive training applications regarding user experience, particularly for children with learning disabilities. To illustrate, Marcelle et al. (2018) revealed that COGMED, which is considered the most common commercial working memory training program, was developed by “leading neuroscientists” using a top-down expert-driven method, and none of end-user validation research was implemented to assess the trainees’ experience. This study also indicated the significance of active end-user involvement in the development process of the cognitive applications, which can prevent deployment of intolerable training models. Hence, for children with learning disabilities, it is reasonable to evaluate these applications in terms of cognitive load to ensure that such applications do not overload their limited working memory, and the user experience to ensure that those applications are easy to use, functional, and enjoyable, and thereby motivate their engagement.
Therefore, the aims of this study are to fill the research gap identified in the previous paragraph by the following:
1. Develop a gamified working memory training application to explore how best to support children with learning disabilities to improve their working memory capacity.
2. Evaluating the user experience, the induced cognitive load level, and the children’s training performance, and identifying if there are any intercorrelations.
3. Improving the application’s design based on the evaluation process outcome.
While there are some conventional and commercial applications to train the working memory (WM), the conventional ones are frequently considered tedious or repetitive which deeply affects the user’s motivation to learn and consequently the potential for learning transfer (Pereira et al., 2015), and the available commercial ones (e.g., CogMed) often cannot support their impressive beneficial claims sufficiently with empirical evidence (e.g., (Owen et al., 2010; Hulme and Melby-Lervåg, 2012; Shipstead et al., 2012). Therefore, some researchers such as Ninaus et al. (2015) incorporated a set of particular gamification elements, for example, points, setting, or progression bars, into a conventional WM training system to motivate university students; the results revealed that the performance and efficiency in a WM task can be enhanced. In addition, Prins et al. (2010) found that working memory training with game elements considerably enhances motivation, training performance, and working memory for children with ADHD. Conversely, other studies revealed that gamification could increase the cognitive load level by inducing unneeded stress or new cognitive demands and distract the trainees from the main purpose (Katz et al., 2014; Nebel et al., 2016; Turan et al., 2016). As a result, embedding gamification elements into working memory training applications of children with learning disabilities should be used with caution, meeting their needs and characteristics, not overloading working memory or taxing their cognitive abilities.
Therefore, the cognitive load imposed by the gamified application should be evaluated to ensure that the application induces an appropriate level that does not tax the cognitive abilities of children with learning disabilities. Measuring cognitive load is considered one of the constant challenges in scientific research, and the common approaches can be divided into three categories: subjective, objective, and psychophysiological measures. Both the objective and psychophysiological measures are intrusive and could disturb the learner and increase the load; in addition, the psychophysiological measures are known of its difficulty and its high cost (Klepsch et al., 2017). The subjective ratings scale developed by Paas (1992), as one of the subjective measures, was used in this study because it is easy to use, cost-effective, and does not intrude upon the task, and the previous results showed that it is a reliable measure (Paas, 1992; Joseph, 2013).
In addition, the motivational aspects of the gamified application should be evaluated to ensure a rewarding user experience. There is no consensus regarding what is the best method of UX evaluation (Rico-Olarte et al., 2017), where this selection process relies on the purpose of the developed system or technology. There are several methods such as video recording, direct observation, and survey method. This systematic review study (Rico-Olarte et al., 2017) divided the UX evaluation methods into subjective and objective ones, and the results indicated that the most commonly used methods are the subjective ones.
Also González et al. (2009) divided the usability (one of UX concepts) evaluation methods into qualitative and quantitative ones; the results showed that both methods are needed: quantitative evaluation is required to get numerical values that represent the usability level, while qualitative evaluation is required to identify any usability problems. Therefore, both a usability survey (subjective quantitative) and an unstructured observation (subjective qualitative) were used in this study.
While training on particular tasks, people typically progress through several levels by practice. The improvement in the training performance on the trained tasks can result from task-specific practice, rather than actual improvement in the users’ abilities (Shipstead et al., 2012). The human performance can be predicted by other measures such as the usability and the cognitive load.
However, there is no consistency regarding how cognitive load relates to the usability (one of the UX concepts). Some studies measured the cognitive load to test the usability of the websites, aiming to recognize the areas of high cognitive load and thereby enable the Web designers to understand the causal factors and improve the design and functionality (Tracy and Albers, 2007; Albers, 2011). Other studies also attempted to enhance the website usability by minimizing the cognitive load level such as Longo et al. (2012); Reis et al. (2012), and the results revealed that better usability can be perceived in the case of a lower cognitive load level.
On the other hand, other studies considered both concepts as non-overlapping or not fully overlapping constructs but can be used together for better prediction of human performance. For example, some researchers, such as Longo (2018), investigated the intercorrelation between the perception of usability and the cognitive load induced by a set of tasks and their impact on the user’s performance using three websites: YouTube, Wikipedia, and Google. The results revealed that both usability and cognitive load could be jointly employed to explain the human performance. In particular, the experienced cognitive load seems to explain the human performance better than the perception of usability. Hence, in this study, the UX, the training performance, and the cognitive load level will be measured separately, and their intercorrelation will be examined.
Cognitive load refers to the amount of working memory resources used to process new information; however, our brain has a limited amount of these cognitive resources (Cook, 2009). Thus, a poor design can easily exhaust this limited power, and therefore, a successful user interface must respect the limits of human cognitive processing (Tracy and Albers, 2007).
Cognitive load theory differentiates between three kinds of cognitive processing demands that occur in the working memory during learning: intrinsic, extraneous, and germane cognitive load. A potential problem is that the processing demands evoked by the learning task may exceed the processing capacity of the working memory—a situation known as cognitive overload (Mayer and Moreno, 2003), so the cognitive load theory supports the design of educational interfaces that effectively minimize the learner’s load.
The cognitive load theory principles were one of the components that were embedded in the framework; according to it, the current application was designed. This framework which was described in Pearson and Shaban (2019; Shaban and Pearson, (2019) incorporated a set of guidelines that covers the following:
1. Learning Environment (interface and interaction): To decrease extraneous cognitive load through well-designed activities and interface layout, and excluding non-essential material.
2. Tasks or Activities (learning materials): To manage the intrinsic cognitive load by simplifying the presented material and avoiding complexity.
3. User: To foster the germane cognitive load (free up more mental resources used to process new information and acquire knowledge).
The description for the framework and the suggested guidelines is shown in the Supplementary Figure S1, and Supplementary Table S1.
Gamification is a technique where designers insert game design elements and techniques in non-game (real-world) contexts to enhance desired behaviors (Deterding, 2012). The main goal of gamification is to invoke the same psychological experiences as games. Three gamification principles such as mechanics, dynamics, and emotions (MDE framework) can be defined, depending on the game design literature (Hunicke et al., 2004; Robson et al., 2015).
Mechanics (the game elements) include goals, rules, contexts, boundaries, and the types of interactions used by game designers. They are divided into setup, rule, and progression mechanics, which are the main aspects not only for games but also for the gamified experience.
Dynamics are the types of behaviors generated by the players while engaging in the gamified experience such as competition, cooperation, and cheating. While the mechanics are set by the designer, the dynamics are related to the player actions when he follows the chosen mechanics.
Emotions depict the in-demand emotional states (psychological outcomes) evoked among individual players when they interact with a gamified experience (Stieglitz et al., 2017). These emotions can be positive such as excitement, amusement, and wonder, or negative feelings such as disappointment at loss.
Therefore, the use of game elements only should not be considered as gamification. This use must be associated with the desired psychological and behavioral outcomes (Hamari et al., 2014).
The MDE framework aids in illustrating how the game designers and individual players perceive a gamified experience differently (Robson et al., 2015). Game designers focus on selecting appropriate mechanics (game elements), followed by a focus on anticipating dynamics (behavioral outcomes), and, last, on players’ emotions (psychological outcomes). For players, on the other hand, emotions are most important. The emotions and the associated dynamics (their actions) are more important than the rules (the mechanics or elements) that make them positive (Robson et al., 2015). In good gamified experiences, players’ emotional states and the evoked dynamics (their behaviors) shape the mechanics that control play, and vice versa.
In this study, since the participants often have a lower level of motivation and have a limited working memory capacity, a set of appropriate gamification mechanics (context, goals, points, levels, incentives and rewards, virtual competitor, virtual helper, and progress reports) was applied to engage and motivate them intrinsically along with minimizing the load on their working memory capacity. It is expected that using those game mechanics will induce challenge (the dynamics) between the child and the virtual competitor and thereby evoke positive emotions such as achievement, enjoyment, and satisfaction toward the gamified application.
The Web-based gamified application was developed using a design framework incorporating a set of guidelines derived from HCI, cognitive load theories, and gamification techniques (see the Supplementary Table S1). These guidelines were selected to ensure that task presentation promotes ease of use (diminish extraneous load); manage interactivity and complexity of the working memory tasks relevant to learners’ experience (manage intrinsic load), and help users to devote mental resources to the main tasks (increase germane load).
Hence, the developed application, “The Treasure” takes the form of a meaningful story with six short gamified activities (Numbers, Compass, Map, Letters, Tools, and Faces) (see Table 1). Each activity has its own goal as well as points, levels, and incentives to keep them engaged and interested over time. The child plays against the pirate to collect the treasure through correct responses; the goal is to beat the pirate and win the treasure. A virtual competitor is used instead of external competition with others (such as using leader boards) in addition to increasing the competitive time to cut the competition anxiety and thereby lower the cognitive load (Hwang et al., 2013).
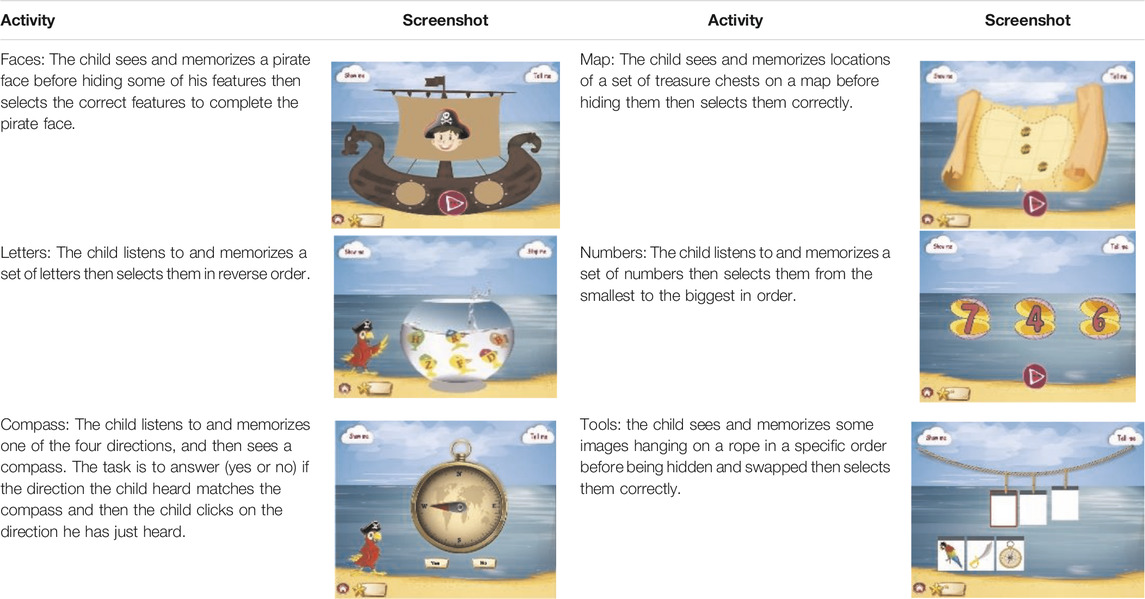
TABLE 1. Set of screenshots for the six activities of the developed application.
Points, in the form of golden stars, are used to increase players’ enjoyment, and they are a highly suitable game mechanic for gamified cognitive testing (Hanus and Fox, 2015). The child gets a golden star for each correct response (level), and the child must achieve a score of > 80% (approximately 24/30 golden stars in all six activities) to win the treasure.
The levels of the activity indicate the child’s progress where each activity has five levels, and the difficulty level increases as the child proceeds to higher levels. A virtual assistant in the form of a parrot helps the users throughout the application, and provides a simulated example before each activity.
Other options include audio support and a reporting function to show the child’s progress. Finally, the idea of “mandatory fun” can reduce intrinsic motivation; therefore, children have the autonomy to choose to participate or not in the training (Hanus and Fox, 2015).
After the designing process of the application, it was developed and became accessible for both the trainer and the target users using the following URL (http://www.wm-app.net/welcome.aspx). The training took place at a computer laboratory in a primary school in Egypt where the computers were connected to the Internet. Each child in the training group (12 children) engaged in daily training, 20–35 min per day, 5 days per week over the period from 11th of April to 16th of May (approximately 5 weeks)—a total of 27 sessions. Each child also engaged in the evaluation process after finishing the training. The procedures of the study were approved by the Ethical Committee of Fayoum University, Egypt, with written consent from parents, and the children participated voluntarily.
A sample of Egyptian children, diagnosed with learning disabilities and aged 8–9 years, was chosen to form the experimental sample group. Those children with learning disabilities are operationally defined as “children who have scores below the 25th percentile on standardized reading and/or mathematics achievement measure meanwhile they have general IQ scores on standardized tests above 85” (Swanson and Sáez, 2003). A combined method was adopted based on the cutoff scores to select the participants as follows:
Two academic tests (Arabic and math) were authored and statistically standardized by using a random sample (30 Egyptian students of third grade) to evaluate the suitability of the tests and determine the tests’ percentiles. The calculated reliability coefficients of both tests are excellent (0.97 and 0.95 for Arabic and math tests) and can be used with a high level of confidence. Based on the previous results, Arabic and math tests were reapplied on 55 children, aged 8–9 years, in the third grade to identify the students who have poor academic achievement in Arabic and/or math (<25th percentile) compared to their peers. Finally, according to the results, only 26 students whose scores were less than 25 percentiles and agreed to participate in the study were chosen.
The abbreviated battery of the fifth edition of the Stanford–Binet Intelligence Scale was applied on 21 out of 26 students to test the sample IQ (the other five students disagreed to continue in the diagnosing process, so they were excluded). The students with at least average intelligence (85–110) were selected. As a result, 16 participants were diagnosed as having learning disabilities depending on the former criteria; low academic achievement and their IQ test scores on Stanford–Binet Intelligence Scale above 85 and less than 110. Finally, 12 of those 16 students formed the experimental group who completed the training and the evaluation process, with parental consent.
To verify the purpose of the study, a set of questions was drawn up as follows:
1. What are the children’s perceptions and experiences with the application?
2. What is the expected improvement in children’s training performance after a five-week training period?
3. Do the gamified activities induce an appropriate level of cognitive load?
4. What is the effect of the cognitive load level imposed by the application on the children’s training performance?
5. What is the effect of the cognitive load level imposed by the application on the children’s perceived experience?
6. What are the proposed solutions based on the evaluation’s outcomes?
A mixed-method of evaluation, qualitative, and quantitative approaches was applied after a five-week training period on the experimental group:
1. User Experience: To evaluate the children’s experience with the application, a simple usability survey (quantitative and qualitative) and an unstructured observation (qualitative) were performed.
2. Training performance: The children’s training performance in each activity was evaluated using the average sum scores of the stars achieved by the children over all training sessions.
3. Cognitive load level: A subjective ratings of mental effort was used to assess the cognitive load level in each activity of the application.
4. The SPSS package was used to analyze and evaluate the responses of the user experience survey, the cognitive load scale, and children’s training performance and to identify if there is a correlation among them.
The usability survey consists of two parts: a closed-ended questionnaire (quantitative), focusing on the general impression and feedback, and an interview-based questionnaire (qualitative), concerning the user experience and suggestions for the activities.
This part of the questionnaire included initially 16 closed-ended questions developed by the researcher based on the suggested guidelines for developing the current application (see the Supplementary Table S1) and the examples provided in the studies of (Nielsen, 2000; Seo and Woo, 2010). The children were individually (one-to-one) asked to rate the survey questions on the standard three-point Likert scale (1 = disagree, 2 = not sure (neutral), and 3 = agree) or they could select one of the three smiley faces. During implementation of the survey, the required instructions were given to the children such as reading and explaining each question along with a Likert scale to help them give the appropriate feedback.
This part included five open-ended questions developed by the authors based on the examples provided in Seo and Woo, (2010) usability study. During the interview, the children were asked three questions individually about their experience with the application such as “What games do you like to play? and Why?”, “What are the games you do not like to play? and Why?”, and “What do you like most about the treasure application?” In addition, two other questions regarding their desired amendments and suggestions for the application were asked. Finally, a good opportunity was provided to the children to discuss their responses and suggestions for the application with the researchers.
The interview-based questionnaire was transcribed and then analyzed using a thematic analysis research method (using Nvivo 12). In total, 133 codes were applied to data under four global themes to summarize the five questions of the interview. The four global themes are preferred activities, unpreferred activities, the best thing about the application, and suggestions for improving the application. These four global themes were suggested to assist the evaluation of children’s perceived experience.
The overarching thematic map for the interview is designed (as shown Figure 1), using Nvivo 12, to provide an overview of the four global interview’s themes and individual thematic networks. Additionally, a visual representation of reasons for preferred and unpreferred activities, the best thing about the application, and children’s suggestions for improving the application activities is given in Table 2.
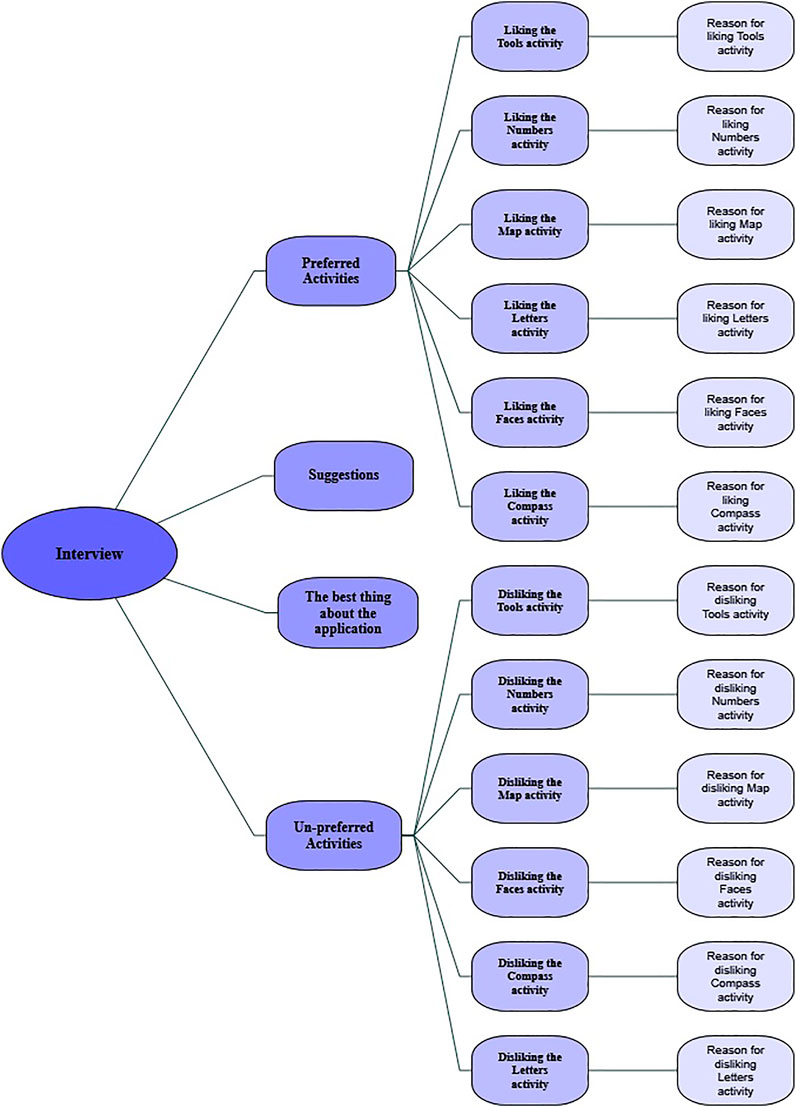
FIGURE 1. Overarching thematic map for the interview-based questionnaire shows the four global interview’s themes and its individual thematic networks.

TABLE 2. Children’s response in the interview based question.
The usability survey’s content was validated by a set of professionals in educational technology and HCI (4 researchers). First, the initial copy of the usability survey was presented to them individually and then the researchers were asked to review and score of each item on a four-point scale (1: not relevant; 2: somewhat relevant; 3: quite relevant; and 4: highly relevant) regarding their relevance and clarity. A content validity index (Polit and Beck, 2006) was calculated based on scoring of the four researchers. Only items with a content validity index score of 1 were retained.
Regarding the closed-ended usability survey, 5 out of 16 items were deleted, and two items were reworded to be understandable for children. Regarding the interview-based questionnaire, the question “what are the most attractive features in treasure application?” was reworded to “what games do you like to play? Why?” The final copy of the usability survey (closed-ended), including the children responses, is given in Table 3.

TABLE 3. Children’s responses on the close-ended usability questionnaire.
The closed-ended usability survey was applied after the training period on the experimental sample group to assess the children’s experience after engaging with the application. First, the closed-ended usability survey results were analyzed through data aggregation and statistical analysis (e.g., frequency, mean, and standard deviation) using the SPSS package. By using the psych package in R (Revelle, 2019; Revelle, 2020), the survey achieved a substantial reliability degree with a Cronbach’s alpha (α) 0.91 and Omega Polychoric covariance matrix 0.95, which indicates that the closed-ended survey is consistent and acceptable in evaluating the children’s experience with the gamified application.
The unstructured observation method was used to observe the engagement of each child with the application as an indicator of the user experience. In every training session during the five-week training period, all the children were observed to determine which of the activities they enjoyed playing and chose to start the sessions with; what were the activities they did not enjoy and delayed playing until last; the children’s reactions and comments on aspects of the application; and their desire or reluctance to continue with the training. Any competition between the children and the pirate (virtual competitor), and their reaction (positive or negative) to the application generally were also observed and recorded. Finally, the facilitator wrote a report at the end of the training for each child.
The unstructured observation was transcribed and then analyzed using thematic analysis research method. In total, 99 codes were applied to data under three global themes to summarize the unstructured observation report. The three global themes are activities found to be easy, activities found to difficult, and strategies. These three global themes were suggested to assist the evaluation of children’s perceived experience.
The overarching thematic map for the unstructured observation is designed (as shown in Figure 2), using Nvivo 12, to provide an overview of the three global unstructured observation’s themes and individual thematic networks.
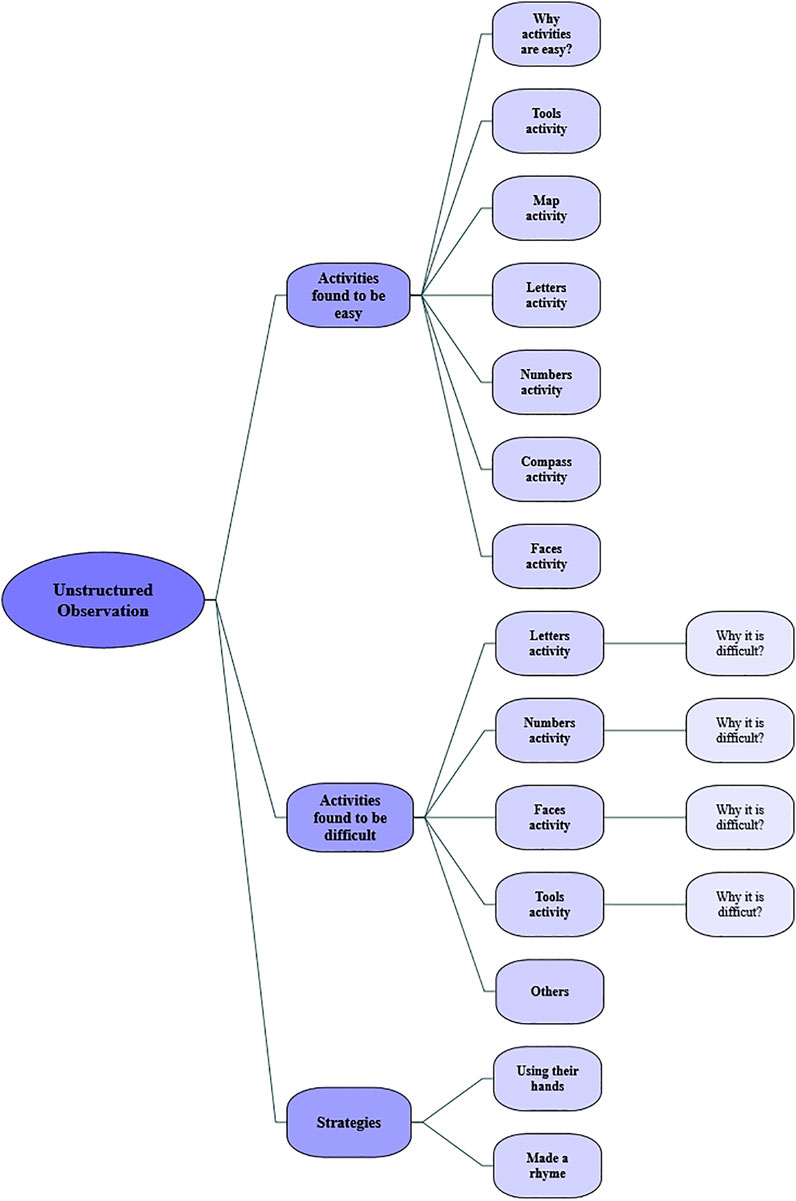
FIGURE 2. Overarching thematic map for the unstructured observation shows the three global unstructured observation’s themes and its individual thematic networks.
The subjective ratings scale developed by Paas (1992) is considered as one of the most well-known subjective cognitive load measures. This is a 9-point Likert scale to rate the cognitive load level (Turan et al., 2016). Since the experimental group of this study has learning disabilities, the 9-point Likert scale was simplified to a 3-point Likert scale (1: easy, 2: a bit difficult, and 3: very difficult) in addition to providing three smiley faces to help the children to select the most appropriate response for the difficulty level (cognitive load). Each child was asked individually the following question “How easy or difficult did you find the game of ….?” for the six activities. The children were required to rate each activity (easy, a bit difficult, or very difficult to play), or they could select the appropriate smiley face to represent their experience.
To validate the simplified cognitive load scale, the reviewers (four researchers) reworded the cognitive load scale’s question “How easy or difficult did you find the activity of, for example, Numbers?” to “How easy or difficult did you find the game of, for example, Numbers?” In addition to that, the option of “2 neutral” was amended to “2: a bit difficult” to be meaningful for the children, as shown in Figure 3.
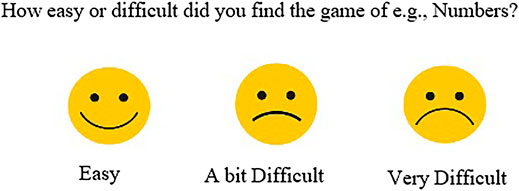
FIGURE 3. Simplified cognitive load scale (a subjective rating scale). Three smiley faces were used to represent the children’s opinion (easy, a bit difficult, and very difficult) about the experienced cognitive load level imposed by the application.
The simplified cognitive load scale was applied after the training period on the experimental sample group to assess the cognitive load level imposed by each activity. First, the results were analyzed through data aggregation and statistical analysis (e.g., frequency, mean, and standard deviation) using the SPSS package. By using the psych package in R (Revelle, 2019; Revelle, 2020), the scale achieved a substantial reliability degree with Cronbach’s alpha (α): of 0.54 and Omega Polychoric covariance matrix of 0.82, which indicates that the simplified cognitive load scale is consistent and acceptable in evaluating the level of cognitive load in the activities.
Once all the evaluation methods have been carried out, the collected data have been analyzed to answer the following research study questions:
The usability survey and the unstructured observation were used to identify the children’s perceptions and experiences as follows:
The closed- and open-ended usability survey was conducted to assess the children’s experience after engaging with the application. Generally, it is obvious that the majority of children (86.5%) perceived a good experience with the gamified application compared to only 5% did not perceive that.
Regarding the application’s design, more than 90% of children reported that the navigation throughout the application was easy, and the application is visually appealing. Similarly, the majority of the children thought that their friends would like to use this application, and using three images as a password eased to login the application. This means that using a visual password (as shown in Figure 4) was helpful because it mitigated the burden of creating and memorizing text password (minimize text input). Finally, around two-thirds of children indicated that it was easy to learn to use the application.
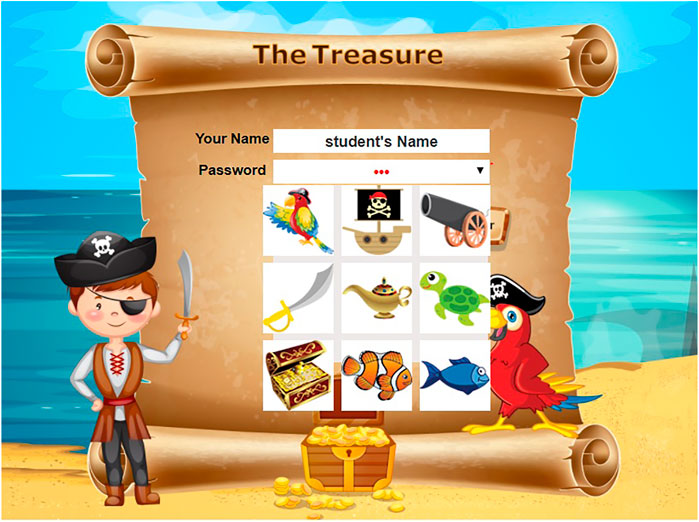
FIGURE 4. Visual password consisting of nine images from which the user selects three images to form his own password.
In regard to the application’s activities, the vast majority of children enjoyed playing the activities and liked the story of the application as a contest to get the treasure. This indicates that using the meaningful story (treasure hunt), in the form of a contest with the virtual competitor (the pirate), as a gamification element motivated the trainees to engage in the training. On the other hand, only 8% of children stated that it was too hard to play the application’s activities.
In terms of the feedback and instructions, more than 90% of children agreed that the training video before each activity was helpful, and the parrot voice was clear and friendly. This means good design with appropriate gamification element (e.g., virtual helper) can be useful for those children, as well as providing them with instant support during the learning process could be helpful. Similarly, more than 80% of children reported that the positive feedback provided throughout the training helped them keep playing the application’s activities.
These results taken together suggest that the gamified application is well-designed with relevant support and appropriate to train, motivate, and engage these children. The interview-based questionnaire was applied, and the responses were analyzed to identify the children’s perceived experience during the training period.
By using Nvivo 12, the children’s responses regarding the preferred and unpreferred app’s activities were analyzed, as shown in Figure 5. In terms of the preferred activities, it is obvious that all the children (100%) liked the Numbers activity the most. In addition to that, more than three-quarters of children reported that they liked the Compass, Map, Tools, and Faces activities. By contrast, the Letters activity was found to be the least preferred one, as it was preferred by around 40% of children.
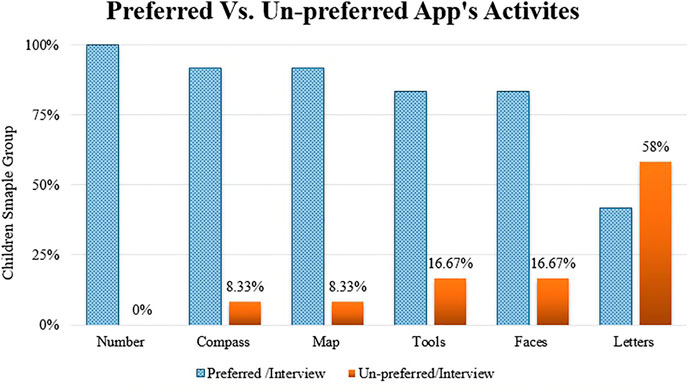
FIGURE 5. Preferred and unpreferred app’s activities according to the children’s responses on the interview-based questionnaire.
Regarding the unpreferred activities, half of the children stated that they do not like the Letters activity, 17% of the children did not like the Faces and the Tools activities, and only 8% said that they do not prefer both the Map and Compass activities. The children preferred some activities such as (Numbers, Compass, Map, Tools, and Faces) because these activities are easy to play, and the children managed to get more stars and thereby get the treasure, as illustrated before in Table 2. In contrast, 58% disliked playing the Letters activity because of its difficulty (memorizing many letters and recalling them in reverse order), and consequently, it was difficult to get more stars. The most motivating aspect identified by the children was their trials to win the treasure. Finally, when asked, the children recommended that the Letters activity should be changed to make it easier to play. They suggested three solutions; cutting the number of letters required to be remembered and recalled; or recalling letters in order, rather than in reverse order; or replacing the letters with numbers.
The unstructured observation method was used to evaluate the children’s engagement and thereby the user experience during the five-week training period. The unstructured observation was transcribed and then analyzed using thematic analysis research method.
By using Nvivo 12, the unstructured observation report was analyzed, as shown in Figure 6. In terms of the activities which were noticed to be played smoothly during the training period, it is obvious that all the children (100%) played the Map and Compass activities easily. Similarly, it was observed that 92 and 75% of children played the Faces and Numbers activities smoothly, respectively. Likewise, nearly 70% of children found the Tools activity was easy to be played. This is because the children regarded themselves as being in a race with the pirate, which motivated them to compete hard to get the treasure. Generally, all the children were willing to play the activities and found them interesting and exciting.
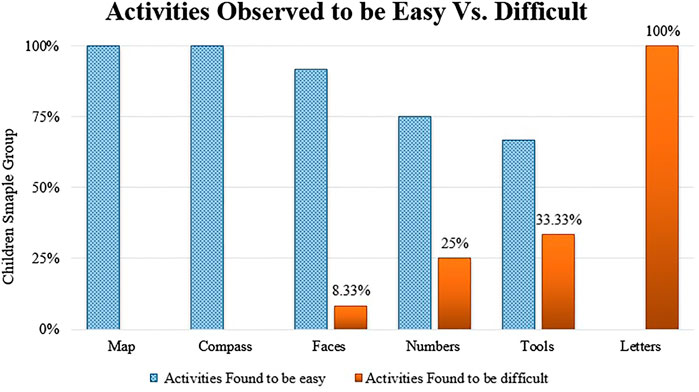
FIGURE 6. Activities found to be easy or difficult according to the results of the unstructured observation.
Regarding the activities which were noticed to be difficult to be played during the training period, the results showed that all the children struggled to play the Letters activity, especially the higher levels, that they would delay playing until last. This is because the children failed to repeat the letters in reverse order, some of them used to recall the letters in order, and some of them could lose their patience while listening to the letters. It was also noticed that narrating the letters distracted some children during playing. Similarly, 33% of children found difficulty playing Tools activity because they were found to be impulsive during memorizing the places of images, particularly while playing the higher levels, so they would delay playing it until last.
At the beginning of the training, 25% of children found difficulty playing the Numbers activity because they struggled either to differentiate between the smallest and the biggest numbers or to put them in order. Therefore, they were supported by watching some tutorial videos on how to sort numbers in order during the training period. Similarly, one of the children could not identify the directions of the Compass activity, so the child was advised to watch the training videos (the simulated examples before each activity).
However, the children did manage to find their own strategies to cope with difficult activities. For example, in the Letters activity, some of the children tried to use their hands with each finger resembling one letter to memorize the letters—a situation known as using an external memory tool (Budiu, 2018). Similarly, in the Tools activity, some of them named each image and made a rhyme (repeat as a song) to remind themselves with the images. Finally, in the Faces activity, the children used the colors of faces’ parts such as red hat, green eyes, and black mustache to help themselves in memorizing the faces’ parts. These strategies could be used to support such children with learning disabilities during their daily activities or educational process. Therefore, a combination of a WM training and some effective strategies such as rehearsal strategies and simplifying the learning activities could be helpful for those children to meet their WM needs and minimize the WM overload.
Generally, the trainer noticed that some children showed some behaviors particularly during playing the Letters, Tools, and Faces activities. For example, some of the children were found to be easily distracted all the time, some of them could lose their concentration quickly, and others were noted to be impulsive during playing the application’s activities. Hence, it is recommended that those particular learning group should be provided with a quiet learning environment, or at least minimizing the background noise is favorable to avoid their easily distraction.
The Wilcoxon signed-rank test, a non-parametric SPSS test, was used to identify the expected improvement in the children’s training performance after engaging in the training. The expected improvement in each activity was identified by comparing the children’s training performance at the beginning and at the end of the training period. The average sum scores (the collected stars) of the first four training sessions for each of the six activities represented the pretraining performance, and the average sum scores of the last four training sessions represented the post-training performance. The results indicated that the mean scores for the six activities are higher in the post-training performance (mean = 15.75) than the mean scores for the six activities of the pretraining performance (M = 8.51). Also, the Wilcoxon test showed that Z value = 3.062, and p < 0.05, whenever the calculated Z-value is greater than the Z-table value (1.96), which indicates that there is a statistically significant difference between the pre- and post-training performance in favor of the training performance with higher mean scores (post-training performance), that is, the children’s training performance in all application activities improved after engaging in the training period. Similarly, as shown later, Figure 7 demonstrates how greatly the children’s training performance improved in each of the six activities after the training period.
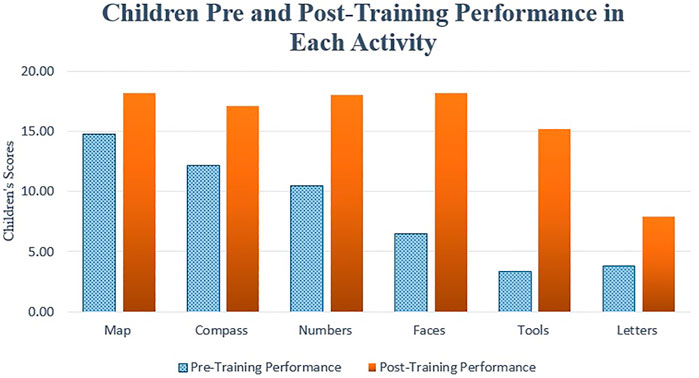
FIGURE 7. Children pre–post training performance in each activity. It compares between the average of the children’s sum scores in the first four tries (as a pretraining performance), and the last four tries (as a post-training performance) for the entire experimental sample group in each activity.
The subjective ratings of mental effort scale were applied to each child individually to measure the cognitive load in each activity. The individual responses from each child for the six activities were recorded and analyzed using the SPSS package. The descriptive analysis of the data (children’s responses) revealed that the cognitive load mean value of the six activities is 1.47 with a standard deviation (S.D) of 0.35 (see Table 4). This means the cognitive load level of the six activities ranges between low to moderate (1 < 1.47 < 2). Generally, more than two-thirds of the children considered the application as easy, whereas only 13% rated it as very difficult to be played. This means the current gamified application did not cause a high cognitive load level because it did not overload their working memory capacity. In detail, the cognitive load level was the least in three activities (Numbers, Compass, and Map), with a cognitive level around 1, and was the highest in the Letters activity, with a cognitive level just below 3, and was moderate in the Tools and Faces activities, with a cognitive level just below 1.5. To conclude, the cognitive load level in the six activities can be considered as appropriate except in the Letters activity, which was high.
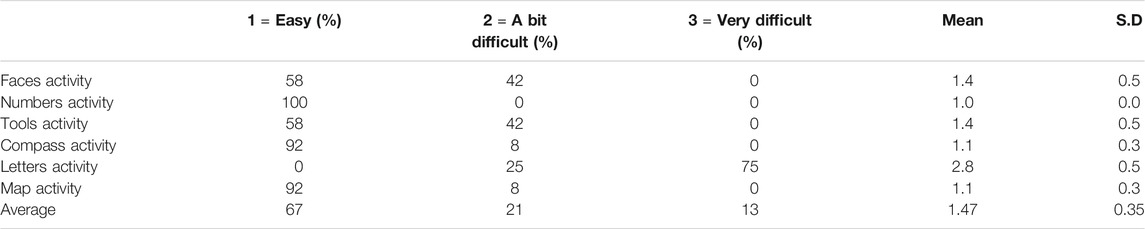
TABLE 4. Descriptive analysis of the cognitive load for the six activities.
To identify the effect of the cognitive load level on the children’s training performance, the average of cognitive load level imposed by each activity for the entire experimental sample group and the children’s training performance (the average of the stars achieved by all children over all training sessions in each activity) were analyzed. The children’s training performance has markedly varied with the induced cognitive load, as shown in Figure 8. It is clear that the children’s training performance was high in the first three activities, Numbers, Compass, and Map (with a low cognitive load level), and was moderate in the Tools and Faces activities (with a moderate cognitive load level). Conversely, the training performance was low when the cognitive load level was high in the Letters activity, which reflects the high level of challenge of this activity.
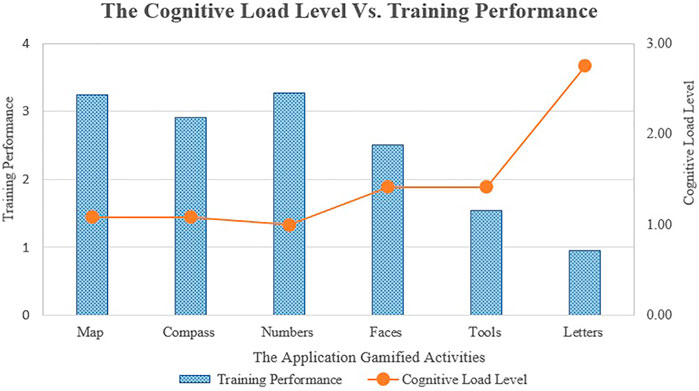
FIGURE 8. Cognitive load level vs. the children’s training performance. It compares between the average of cognitive load level imposed by each activity for the entire experimental sample group and the children’s training performance (the average of the stars achieved by all children over all training sessions in each activity).
In addition to that, the induced cognitive load level by each activity was compared with the amount of improvement in the children’s training performance in each activity, as shown in Figure 9. The amount of improvement in each activity was calculated by the following equation: the post-training performance (the achieved stars by all children in the first four tries) minus the pretraining performance (the achieved stars by all children in the last four tries). It is obvious that the amount of improvement in the children’s training performance was better in the activities with a moderate cognitive load level than the activities with either a low or high cognitive load level. This indicates that an appropriate level of challenge is required to motivate those children as happened in the activities with a moderate level of cognitive load such as Tools and Faces activities. On the other hand, if the activity is highly challenging, this could hinder children from improving their performance as in Letters activity (with a high level of cognitive load). Also, if the activity is easy to be played and thereby will not urge those children to perform hard, no noticeable improvement can be seen as the training performance of those children will be high from the beginning as happened in Numbers, Compass, and Map activities (with low cognitive load levels).
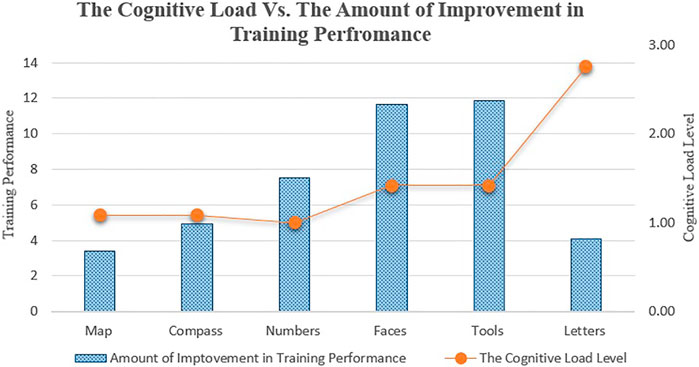
FIGURE 9. Cognitive load level vs. the amount of improvement in children’s training performance. It compares between the induced cognitive load level by each activity and the amount of improvement in the children’s training performance (the difference between post- and pretraining performance) in each activity.
The effect of the cognitive load level for the six activities on the children’s training performance for the six activities was confirmed by using the statistical package SPSS. The results confirmed that there is a strong negative statistically significant correlation between the cognitive load level in the application’s activities and the children’s training performance for the six activities (Pearson correlation coefficient = -0.874, p = 0.023). On the other hand, the results also showed that there is a very weak negative statistically nonsignificant correlation between the cognitive load level in the application’s activities and the amount of improvement in children’s training performance for the six activities (Pearson correlation coefficient = −0.179, p = 0.734).
To identify the effect of the cognitive load level on the children’s perceived experience, the results of the cognitive load scale and the results of the usability survey (interview-based questionnaire part) were analyzed. In detail, the average of the cognitive load level for each activity was compared with both the preferred and unpreferred activities. The average of cognitive load level for each activity was measured by calculating the average of ratings for each activity by the experimental sample group. The preferred activities were identified by the number of children who liked playing the activities, and on the other hand, the unpreferred activities were identified by the number of children who did not like playing the activities.
The statistical package SPSS was used to identify the correlation between the cognitive load level of each activity and the preferred and un-preferred activities. Regarding the correlation between the cognitive load level in each activity and the unpreferred activities, the results indicated that there is a very high positive statistically significant correlation between the cognitive load level in each activity and the number of children who did not like playing the activity (Pearson correlation coefficient = 0.995, p = 0.00). This means that the children did not prefer playing the activities with a high cognitive load level.
On the other hand, the results indicated that there is a very high negative statistically significant correlation between the cognitive load level in each activity and the preferred activities (Pearson correlation coefficient = −0.995, p = 0.00). This means that the children liked playing the activities with a low cognitive load level.
Additionally, based on the unstructured observation results, it is clear that all the children enjoyed the activities with less cognitive load (e.g., Map and Compass) and preferred to start playing with those activities more than the activities with a moderate (e.g., Tools) or high cognitive load level (e.g., Letters), which children preferred to delay until last. This could suggest that the lower the cognitive load level induced by the application, the better user experience there will be.
Taking the results of the aforementioned questions, it is clear that the lower the cognitive load level the gamified application induces, the better training performance and user experience there will be. This suggests that the users’ perceived experience and the induced level of cognitive load could be a good predictor for the users’ training performance. Generally, the gamified applications developed for children with learning disabilities should be designed with an appropriate cognitive load level (moderate level) to motivate them, improve their training performance, and enhance their perceived positive experience.
According to the results of the evaluation of the children’s perceived experience, the children’s training performance, and the cognitive load level induced by the gamified application, the children faced some difficulties during the training in three activities: Letters, Numbers, and Compass. Starting with the Letters activity, the children suggested three solutions to make it easier:
1. Cutting the number of the letters required to be remembered and recalled.
2. Recalling the letters in order, not in reverse order.
3. Replacing the letters with numbers.
Three cognitive psychology experts at Fayoum University in Egypt advised the solution of “replacing the letters with numbers” because the numbers are easier to be remembered than the letters, and the other two suggested solutions would change the nature of the Letters activity.
In terms of the Numbers and Compass activities, it was suggested that children could be better supported by embedding a set of training videos on how to sort numbers and how to identify the four directions.
Regarding the Letters activity, the researchers redesigned the activity by replacing the letters with numbers because the numbers are easier to be remembered than the letters. The redesigned Letters activity was named Fishing, and the same experimental group played the Fishing activity four tries to evaluate the children’s training performance and the induced cognitive load level.
Following that, the two versions of the Letters activity were compared regarding the children’s training performance and the cognitive load level. Therefore, two hypotheses were tested:
1. It is expected that the Letters activity would impose a high level of cognitive load compared to the Fishing activity.
2. It is expected that the experimental sample group would perform better in the Fishing activity than in the Letters activity.
To verify the first suggested hypothesis, the non-parametric Wilcoxon test was used to analyze the scores of the cognitive load scale (subjective ratings of mental effort) for both the Letters and Fishing activities. The results indicated that the mean scores are higher in the Letters activity (2.75) than the Fishing one (2.17). Also, Z value = 2.11 and p = 0.035, whenever the calculated Z-value is greater than the Z-table value (1.96). This indicates that there is a statistically significant difference between the levels of cognitive load in the two versions of the Letters activity in favor of the activity with higher mean scores (Letters activity). This means that the level of cognitive load is lessened in the new version where it was reduced from high (2.75) to moderate (2.17). By looking at the results in more detail, as shown in Table 5, it can be found that although three-quarters of children considered the Letters activity very difficult, this percentage is reduced to only 33.3% after amending the activity. In addition, around 17% of children rated the new version of the activity as easy, meanwhile no child considered the old version as easy. By contrast, only a quarter of children considered the old version as a bit difficult compared to a half of children rated the new version as a bit difficult. This is most likely because they played the new version only four times.
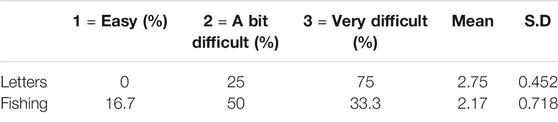
TABLE 5. Descriptive analysis of the Letters and Fishing activities.
To verify the second suggested hypothesis, the non-parametric Wilcoxon test was again used to analyze the sum scores of the first four tries of the Letters activity (the achieved stars by the children) and the total four tries of the Fishing activity (the achieved stars by the children) to compare the children’s training performance in both activities. The results indicated that the mean scores are higher in the Fishing activity (mean = 11.9) than the Letters one (mean = 3.8). Also, Z value = 3.077 and p < 0.05, whenever the calculated Z-value is greater than the Z-table value (1.96). This indicates that there is a statistically significant difference between the children’s training performance in the Letters and Fishing activities in favor of the activity with higher mean scores (Fishing activity).
This result means that children’s training performance in the Fishing activity was greatly better than the Letters activity. That result can also be shown clearly in Figure 10, when comparing the average scores for the first four tries of the Letters activity, the last four tries of the Letters activity, and the total four tries of the Fishing activity. It is clear that the children’s training performance in the first four tries of the Fishing activity is better than the children’s training performance in the first four tries of the Letters activity or even in the last four tries of the Letters activity after the training period. To conclude, by redesigning the Letters activity, the level of cognitive load became lower and the training performance became better.
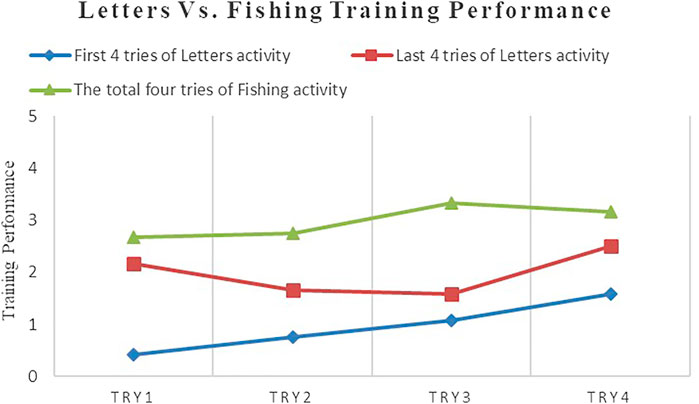
FIGURE 10. Letters vs. Fishing activity. It demonstrates the children’s average scores in the first and the last four tries of Letters activity compared to the children’s average scores in the total four tries of Fishing activity.
Evaluation of the children’s experience, the children’s training performance, and the cognitive load level of a gamified working memory application was the main focus of this study. Twelve children diagnosed as having learning disabilities formed the experimental group of this study. The evaluation process encompasses a simple usability survey and an unstructured observation to identify the children’s experience, and a cognitive load scale to assess the cognitive load level in the application activities.
The usability survey and the unstructured observation confirmed that the children enjoyed playing the gamified application and were eager to participate in the daily training. The cognitive load scale indicated that the gamified application did not induce high cognitive load level, except in one activity. By using the correlation coefficient, it was demonstrated that there is a negative statistically significant correlation between the cognitive load level on the one hand and either the children’s training performance or the children’s experience on the other hand. In addition, the results showed that the users’ perceived experience and the induced level of cognitive load could be a good predictor for the users’ training performance. Based on the evaluation outcomes, a set of suggestions such as redesigning the Letters activity and incorporating a set of training videos was recommended to improve the application design. Based on that, the Letters activity was redesigned by replacing the letters with numbers, with the aim of reducing the cognitive load level and improving the user’s training performance.
To conclude, the gamified cognitive applications developed specifically for children with learning disabilities must consider their characteristics, motivate the child, and aim to reduce the cognitive load level. These applications, with the appropriate level of cognitive load, could engage them, improve their UX, and enhance their training performance.
The Letters activity and its modified version (the Fishing activity) should be applied on different sample groups for a longer period to further investigate the user experience, the training performance, and the induced cognitive load level. Based on the unstructured observation carried out during the training period, it is recommended that children with learning disabilities could be supported during their daily activities or educational process by using external memory tools such as a physical scratch pad to help them get around their working memory limitations. This physical scratch pad will act as a “fake” working memory, rather than putting a burden on their own working memory. The evaluation process recruited the experimental sample group without involving a control one; this is because the training was performed after finishing the scholastic term, so there was no external intervention affecting the sample group.
Furthermore, the size of the experimental sample group was not large (12) in this evaluation because of the following:
1. Identification of the experimental sample group was an onerous process as it required a minimum of four weeks to apply and analyze the results of two types of tests (academic and IQ tests) to a large group of children based on their percentage in the community.
2. The chosen sample group was selected from four classrooms, so it was challenging to offer a flexible schedule for their training.
3. The evaluation was performed after a five-week training period with a total of 27 sessions.
4. The training took place in a school laboratory with a limited number of computer devices, which hampered the training process in a large group.
Nevertheless, the evaluation process was thorough, comprehensive, and repeatable; therefore, the results can be considered reliable.
The original contributions presented in the study are included in the article/Supplementary Material, further inquiries can be directed to the corresponding author.
The studies involving human participants were reviewed and approved by Faculty of Education, Fayoum University, Egypt. Written informed consent to participate in this study was provided by the participants’ legal guardian/next of kin.
Regarding the contribution of the first author, AS, as a part of his Ph.D., he developed the application and the study tools, applied study tools, analysed the results, and wrote the whole paper. Regarding the contribution of the co-author, EP, she was the director of the study, supervised the process of developing the application and the study tools, provided the first author with the framework of the paper, and rewrote the abstract. Regarding the contribution of the co-author, VC, he participated in the deep analysis of the perceived experience results (performing the thematic analysis for the qualitative data) and will review the paper before publishing.
The authors declare that the research was conducted in the absence of any commercial or financial relationships that could be construed as a potential conflict of interest.
The Supplementary Material for this article can be found online at: https://www.frontiersin.org/articles/10.3389/fcomp.2021.617056/full#supplementary-material
Albers, M. J. (2011). “Tapping as a Measure of Cognitive Load and Website Usability,” in Proceedings of the 29th ACM International Conference on Design of Communication SIGDOC ’11 (New York, NY: ACM), 25–32. doi:10.1145/2038476.2038481
Budiu, R. (2018). Working Memory and External Memory. Nielsen Norman Group. Available at: https://www.nngroup.com/articles/working-memory-external-memory/ (Accessed January 2, 2019).
Cook, A. E. (2009). Measurement of Cognitive Load during Multimedia Learning Activities. Cognitive Effects of Multimedia Learning, 34–50. Available at: https://www.igi-global.com/chapter/measurement-cognitive-load-during-multimedia/6604 (Accessed January 17, 2018).
Cooper, G. (1998). Research into Cognitive Load Theory and Instructional Design at UNSW. Available at: https://www.researchgate.net/publication/264878140_Research_into_Cognitive_Load_Theory_and_Instructional_Design_at_UNSW (Accessed June 17, 2021).
González, M., Masip, L., Granollers, A., and Oliva, M. (2009). Quantitative Analysis in a Heuristic Evaluation experiment. Adv. Eng. Softw. 40, 1271–1278. doi:10.1016/j.advengsoft.2009.01.027
Hamari, J., Koivisto, J., and Sarsa, H. (2014). “Does Gamification Work? -- A Literature Review of Empirical Studies on Gamification,” in 2014 47th Hawaii International Conference on System Sciences, Waikoloa, HI, 3025–3034. doi:10.1109/HICSS.2014.377
Hanus, M. D., and Fox, J. (2015). Assessing the Effects of Gamification in the Classroom: A Longitudinal Study on Intrinsic Motivation, Social Comparison, Satisfaction, Effort, and Academic Performance. Comput. Educ. 80, 152–161. doi:10.1016/j.compedu.2014.08.019
Hermawati, S., and Lawson, G. (2016). Establishing Usability Heuristics for Heuristics Evaluation in a Specific Domain: Is There a Consensus? Appl. Ergon. 56, 34–51. doi:10.1016/j.apergo.2015.11.016
Hollender, N., Hofmann, C., Deneke, M., and Schmitz, B. (2010). Integrating Cognitive Load Theory and Concepts of Human-Computer Interaction. Comput. Hum. Behav. 26, 1278–1288. doi:10.1016/j.chb.2010.05.031
Hulme, C., and Melby-Lervåg, M. (2012). Current Evidence Does Not Support the Claims Made for CogMed Working Memory Training. J. Appl. Res. Mem. Cogn. 1, 197–200. doi:10.1016/j.jarmac.2012.06.006
Hunicke, R., LeBlanc, M., and Zubek, R. (2004). “MDA: A Formal Approach to Game Design and Game Research,” in Proceedings of the AAAI Workshop on Challenges in Game AI, San Jose, CA, 1722.
Hwang, M.-Y., Hong, J.-C., Cheng, H.-Y., Peng, Y.-C., and Wu, N.-C. (2013). Gender Differences in Cognitive Load and Competition Anxiety Affect 6th Grade Students' Attitude toward Playing and Intention to Play at a Sequential or Synchronous Game. Comput. Educ. 60, 254–263. doi:10.1016/j.compedu.2012.06.014
Joseph, S. (2013). Measuring cognitive load: A comparison of self-report and physiological methods (Order No. 3560171). ProQuest Dissertations Publishing. Available at: http://ezproxy.tees.ac.uk/dissertations-theses/measuring-cognitive-load-comparison-self-report/docview/1355756885/se-2?accountid=14650 (Accessed June 17, 2021).
Katz, B., Jaeggi, S., Buschkuehl, M., Stegman, A., and Shah, P. (2014). Differential Effect of Motivational Features on Training Improvements in School-Based Cognitive Training. Front. Hum. Neurosci. 8, 242. doi:10.3389/fnhum.2014.00242
Klepsch, M., Schmitz, F., and Seufert, T. (2017). Development and Validation of Two Instruments Measuring Intrinsic, Extraneous, and Germane Cognitive Load. Front. Psychol. 8, 1997. doi:10.3389/fpsyg.2017.01997
Longo, L. (2018). Experienced Mental Workload, Perception of Usability, Their Interaction and Impact on Task Performance. PLOS ONE 13, e0199661. doi:10.1371/journal.pone.0199661
Longo, L., Rusconi, F., Noce, L., and Barrett, S. (2012). “The Importance of Human Mental Workload in Web Design,” in Proceedings of the 8th International Conference on Web Information Systems and Technologies, Porto, Portugal, April 2012 (SciTePress, 2012). Available at: https://arrow.dit.ie/scschcomcon/179.
MacCormack, J., and Matheson, I. (2015). Understanding Working Memory and Learning Disabilities. LD@school. Available at: https://www.ldatschool.ca/understanding-working-memory-and-lds/ (Accessed August 30, 2019).
Maehler, C., and Schuchardt, K. (2016). Working Memory in Children with Specific Learning Disorders And/or Attention Deficits. Learn. Individual Differences 49, 341–347. doi:10.1016/j.lindif.2016.05.007
Marcelle, E. T., Ho, E. J., Kaplan, M. S., Adler, L. A., Castellanos, F. X., and Milham, M. P. (2018). Cogmed Working Memory Training Presents Unique Implementation Challenges in Adults with ADHD. Front. Psychiatry 9, 388. doi:10.3389/fpsyt.2018.00388
Mayer, R. E., and Moreno, R. (2003). Nine Ways to Reduce Cognitive Load in Multimedia Learning. Educ. Psychol. 38, 43–52. doi:10.1207/S15326985EP3801_6
Nebel, S., Schneider, S., and Rey, G. D. (2016). From Duels to Classroom Competition: Social Competition and Learning in Educational Videogames within Different Group Sizes. Comput. Hum. Behav. 55, 384–398. doi:10.1016/j.chb.2015.09.035
Nielsen, J. (2000). Ecommerce UX Research Report | Nielsen Norman Group. Nielsen Norman GroupAvailable at: https://www.nngroup.com/reports/ecommerce-user-experience/ (Accessed August 13, 2019).
Ninaus, M., Pereira, G., Stefitz, R., Prada, R., Paiva, A., Neuper, C., et al. (2015). Game Elements Improve Performance in a Working Memory Training Task. Int. J. Serious Games 2. doi:10.17083/ijsg.v2i1.60
Ottersen, J., and Grill, K. M. (2015). Benefits of Extending and Adjusting the Level of Difficulty on Computerized Cognitive Training for Children with Intellectual Disabilities. Front. Psychol. 6, 1233. doi:10.3389/fpsyg.2015.01233
Owen, A. M., Hampshire, A., Grahn, J. A., Stenton, R., Dajani, S., Burns, A. S., et al. (2010). Putting Brain Training to the Test. Nature 465, 775–778. doi:10.1038/nature09042
Paas, F. G. W. C. (1992). Training Strategies for Attaining Transfer of Problem-Solving Skill in Statistics: A Cognitive-Load Approach. J. Educ. Psychol. 84, 429–434. doi:10.1037/0022-0663.84.4.429
Pearson, E., and Shaban, A. (2019). “Evaluation of a Prototype Interactive Working Memory Application for Children with Learning Disabilities,” in Proceedings of the 16th Web For All 2019 Personalization - Personalizing the Web (W4A ’19) (New York, NY, retain: ACM). doi:10.1145/3315002.3332440
Pereira, G., Ninaus, M., Prada, R., Wood, G., Neuper, C., and Paiva, A. (2015). “Free Your Brain a Working Memory Training Game,” in Games and Learning Alliance Lecture Notes in Computer Science. Editor A. De Gloria (Cham: Springer International Publishing), 132–141. doi:10.1007/978-3-319-22960-7_13
Polit, D. F., and Beck, C. T. (2006). The Content Validity index: Are You Sure You Know What's Being Reported? Critique and Recommendations. Res. Nurs. Health 29, 489–497. doi:10.1002/nur.20147
Prins, P. J. M., Dovis, S., Ponsioen, A., ten Brink, E., and van der Oord, S. (2011). Does Computerized Working Memory Training with Game Elements Enhance Motivation and Training Efficacy in Children with ADHD?. Cyberpsychology, Behav. Soc. Networking 14, 115–122. doi:10.1089/cyber.2009.0206
Reis, H. M., Borges, S. S., Durelli, V. H. S., Fernando de S. Moro, L., Brandão, A. A. F., Barbosa, E. F., et al. (2012). Towards Reducing Cognitive Load and Enhancing Usability through a Reduced Graphical User Interface for a Dynamic Geometry System: An Experimental Study. IEEE Int. Symp. Multimedia, 445–450. doi:10.1109/ISM.2012.91
Revelle, W. (2020). Psych: Procedures for Psychological, Psychometric, and Personality Research. Available at: https://CRAN.R-project.org/package=psych (Accessed August 8, 2020).
Revelle, W. (2019). Using R and the Psych Package to Find ω. Northwestern University: Department of Psychology, Northwestern UniversityAvailable at: https://personality-project.org/r/psych/HowTo/Rold-for-omega.pdf (Accessed June 17, 2021).
Rico-Olarte, C., López, D. M., and Kepplinger, S. (2017). “User Experience Evaluation Methods in Games for Children with Cognitive Disabilities : A Systematic Review,” in German Medical Data Sciences: Visions and Bridges (Amsterdam, Netherlands: IOS Press).
Robson, K., Plangger, K., Kietzmann, J. H., McCarthy, I., and Pitt, L. (2015). Is it All a Game? Understanding the Principles of Gamification. Business Horizons 58, 411–420. doi:10.1016/j.bushor.2015.03.006
Saputra, M. R. U. (2015). LexiPal: Design, Implementation and Evaluation of Gamification on Learning Application for Dyslexia. Int. J. Comput. Appl. 131, 37–43. doi:10.5120/ijca2015907416
Seo, Y.-J., and Woo, H. (2010). The Identification, Implementation, and Evaluation of Critical User Interface Design Features of Computer-Assisted Instruction Programs in Mathematics for Students with Learning Disabilities. Comput. Educ. 55, 363–377. doi:10.1016/j.compedu.2010.02.002
Shaban, A., and Pearson, E. (2019). “A Learning Design Framework to Support Children with Learning Disabilities Incorporating Gamification Techniques,” in Extended Abstracts of the 2019 CHI Conference on Human Factors in Computing Systems CHI EA ’19 (New York, NY: ACM), LBW0284:1–LBW0284:6. doi:10.1145/3290607.3312806
Shipstead, Z., Hicks, K. L., and Engle, R. W. (2012). Cogmed Working Memory Training: Does the Evidence Support the Claims? J. Appl. Res. Mem. Cogn. 1, 185–193. doi:10.1016/j.jarmac.2012.06.003
S. Stieglitz, C. Lattemann, S. Robra-Bissantz, R. Zarnekow, and T. Brockmann (Editors) (2017). Gamification: Using Game Elements in Serious Contexts (Cham: Springer International Publishing). Available at: //www.springer.com/gb/book/9783319455556 (Accessed January 12, 2019).
Swanson, H. L., and Sáez, L. (2003). “Memory Difficulties in Children and Adults with Learning Disabilities,” in Handbook of Learning Disabilities (New York: The Guilford Press).
Swanson, H. L., and Siegel, L. S. (2001). Learning Disabilities as a Working Memory Deficit. Issues Educ. 7, 1–48.
Tracy, J. P., and Albers, M. J. (2007). Measuring cognitive load to test the usability of web sites. Annual Conference-society for technical communication 53, 256.
Turan, Z., Avinc, Z., Kara, K., and Goktas, Y. (2016). Gamification and Education: Achievements, Cognitive Loads, and Views of Students. Int. J. Emerg. Technol. Learn. 11, 64–69. doi:10.3991/ijet.v11i07.5455
Keywords: cognitive load, evaluation, gamification, learning disabilities, training performance, user experience, working memory training
Citation: Shaban A, Pearson E and Chang V (2021) Evaluation of User Experience, Cognitive Load, and Training Performance of a Gamified Cognitive Training Application for Children With Learning Disabilities. Front. Comput. Sci. 3:617056. doi: 10.3389/fcomp.2021.617056
Received: 13 October 2020; Accepted: 31 May 2021;
Published: 06 July 2021.
Edited by:
Faustina Hwang, University of Reading, United KingdomReviewed by:
António Fernando Coelho, University of Porto, PortugalCopyright © 2021 Shaban, Pearson and Chang. This is an open-access article distributed under the terms of the Creative Commons Attribution License (CC BY). The use, distribution or reproduction in other forums is permitted, provided the original author(s) and the copyright owner(s) are credited and that the original publication in this journal is cited, in accordance with accepted academic practice. No use, distribution or reproduction is permitted which does not comply with these terms.
*Correspondence: Adel Shaban, YS5zaGFiYW5AdGVlcy5hYy51aw==
Disclaimer: All claims expressed in this article are solely those of the authors and do not necessarily represent those of their affiliated organizations, or those of the publisher, the editors and the reviewers. Any product that may be evaluated in this article or claim that may be made by its manufacturer is not guaranteed or endorsed by the publisher.
Research integrity at Frontiers
Learn more about the work of our research integrity team to safeguard the quality of each article we publish.