 Reed M. Reynolds
 Lucy Popova
 Bo Yang3
- 1Communication Department, University of Massachusetts, Boston, MA, United States
- 2School of Public Health, Georgia State University, Atlanta, GA, United States
- 3Department of Communication, University of Arizona, Tucson, AZ, United States
- 4University of South Australia, Adelaide, SA, Australia
- 5Department of Health Promotion, Education and Behavior, Arnold School of Public Health, University of South Carolina, Columbia, SC, United States
Experiments are widely used in communication research to help establish cause and effect, however, studies published in communication journals rarely use discrete choice experiments (DCEs). DCEs have become a mainstay in fields such as behavioral economics, medicine, and public policy, and can be used to enhance research on the effects of message attributes across a wide range of domains and modalities. DCEs are powerful for disentangling the influence of many message attributes with modest sample sizes and participant burden. The benefits of DCEs result from multiple design elements including stimulus sets that elicit direct comparisons, blocked and/or fractional factorial structures, and a wide range of analytic options. Though sophisticated, the tools necessary to implement a DCE are freely available, and this article provides resources to communication scholars and practitioners seeking to add DCEs to their own methodological repertoire.
Introduction
Imagine a researcher named Lauren wants to know how a person’s appearance contributes to first impressions. In many cultures, the face receives the most visual attention during initial encounters and it shapes inferences about personal characteristics (Gullberg and Holmqvist, 1999) in ways relevant for interpersonal relationships and social-influence campaigns alike (Moslehi et al., 2024), in terms of beauty, status, similarity, and so forth. As Lauren contemplates the topic, the abundance of influential factors becomes clear—face shape, facial expression, hair, eye color, etc. But with so many variables, she wonders how many experiments she needs to understand what really drives the process. As it turns out, the number may be smaller than most researchers realize. While the complexity of communication is increasingly studied (Ianovici et al., 2023; Sherry, 2015), conventional experimental designs in communication research limit the number of variables that can be manipulated within a single study either because of participant burden to respond to, or researcher burden to create large numbers of message conditions.
This article offers a primer on discrete choice experiments (DCEs; Carson and Louviere, 2011; Friedel et al., 2022), including tools and recommendations immediately usable by researchers. DCEs are an experimental paradigm underutilized in the field of communication (e.g., Cunningham et al., 2014; Iyengar and Hahn, 2009; Messing and Westwood, 2014), but prevalent in disciplines such as marketing (Carson et al., 1994; Louviere and Woodworth, 1983), healthcare (de Bekker-Grob et al., 2012; Folkvord et al., 2022; Lack et al., 2020; Quaife et al., 2018; Soekhai et al., 2019; Tünneßen et al., 2020), tobacco control (Regmi et al., 2018; Reynolds et al., 2022; Salloum et al., 2018; Thrasher et al., 2018b; Ntansah et al., 2025), policy impact assessment (Lagarde and Blaauw, 2009), and political science (Poertner, 2020). In contrast to traditional message-effects or message evaluation research, DCEs leverage comparison sets of multiple stimuli (often called choice sets), as well as blocked and/or fractional-factorial designs, and flexible analysis options that amplify statistical power to detect effects of message attributes. DCEs enable simultaneous testing of large numbers of independent variables without extremely large sample sizes and can be used in conjunction with standard survey items or other experimental inductions (Hawkins et al., 2014). The efficiency to estimate effects with small numbers of participants may be the clearest benefit of DCEs, but their flexibility also enables wide-ranging applications in message-evaluation, message-effects, and media-selection research. DCEs can quickly identify message features with the best chance to make an impact. Although DCEs are not applicable in every situation and are subject to several limitations, they merit additional attention by communication scholars.
Overview of DCEs
DCEs build upon on foundations of general experimental design but may be unfamiliar even to experienced researchers. Experiments are indispensable for establishing cause and effect; they involve at least one induction (a.k.a. intervention, manipulation, treatment) that exposes subjects to contrasting conditions, with the goal of estimating an induction’s effect by comparing observations across those conditions (Memon et al., 2019). To accomplish this, experiments should ensure that all subjects or trials have equal probability of assignment to each condition (i.e., factor-level combination). Randomization allows this by preventing (on average) subject characteristics from correlating with condition assignment, which could bias estimates of induction effects. Experiments should also employ, to the extent possible, strict minimization of differences between conditions except for the focal variable targeted by the induction. If experimental groups differ in ways other than the intended treatment, the precise cause of differences in outcomes cannot be established because confounding factors might be responsible. Accordingly, experiments are most valuable when they can eliminate plausible alternative explanations for the observed effect.
An ideal experiment on communication effects would manipulate all relevant variables simultaneously using a full factorial design, however, large numbers of experimental factors are infeasible, and communication research typically includes only a small number of factors per experiment (e.g., Carpenter, 2013). This piecemeal approach is powerful if integrated into an ongoing research program, but can also be inefficient, requiring more subjects and more time overall. In addition, experimental conditions can be compared more meaningfully within a single study rather than across multiple studies because the benefits of randomization can be leveraged, giving each condition the same expected distribution for all individual differences. The family of DCE methods offers several benefits in this regard. To assist the presentation of terminology we provide a brief glossary of terms in Table 1.
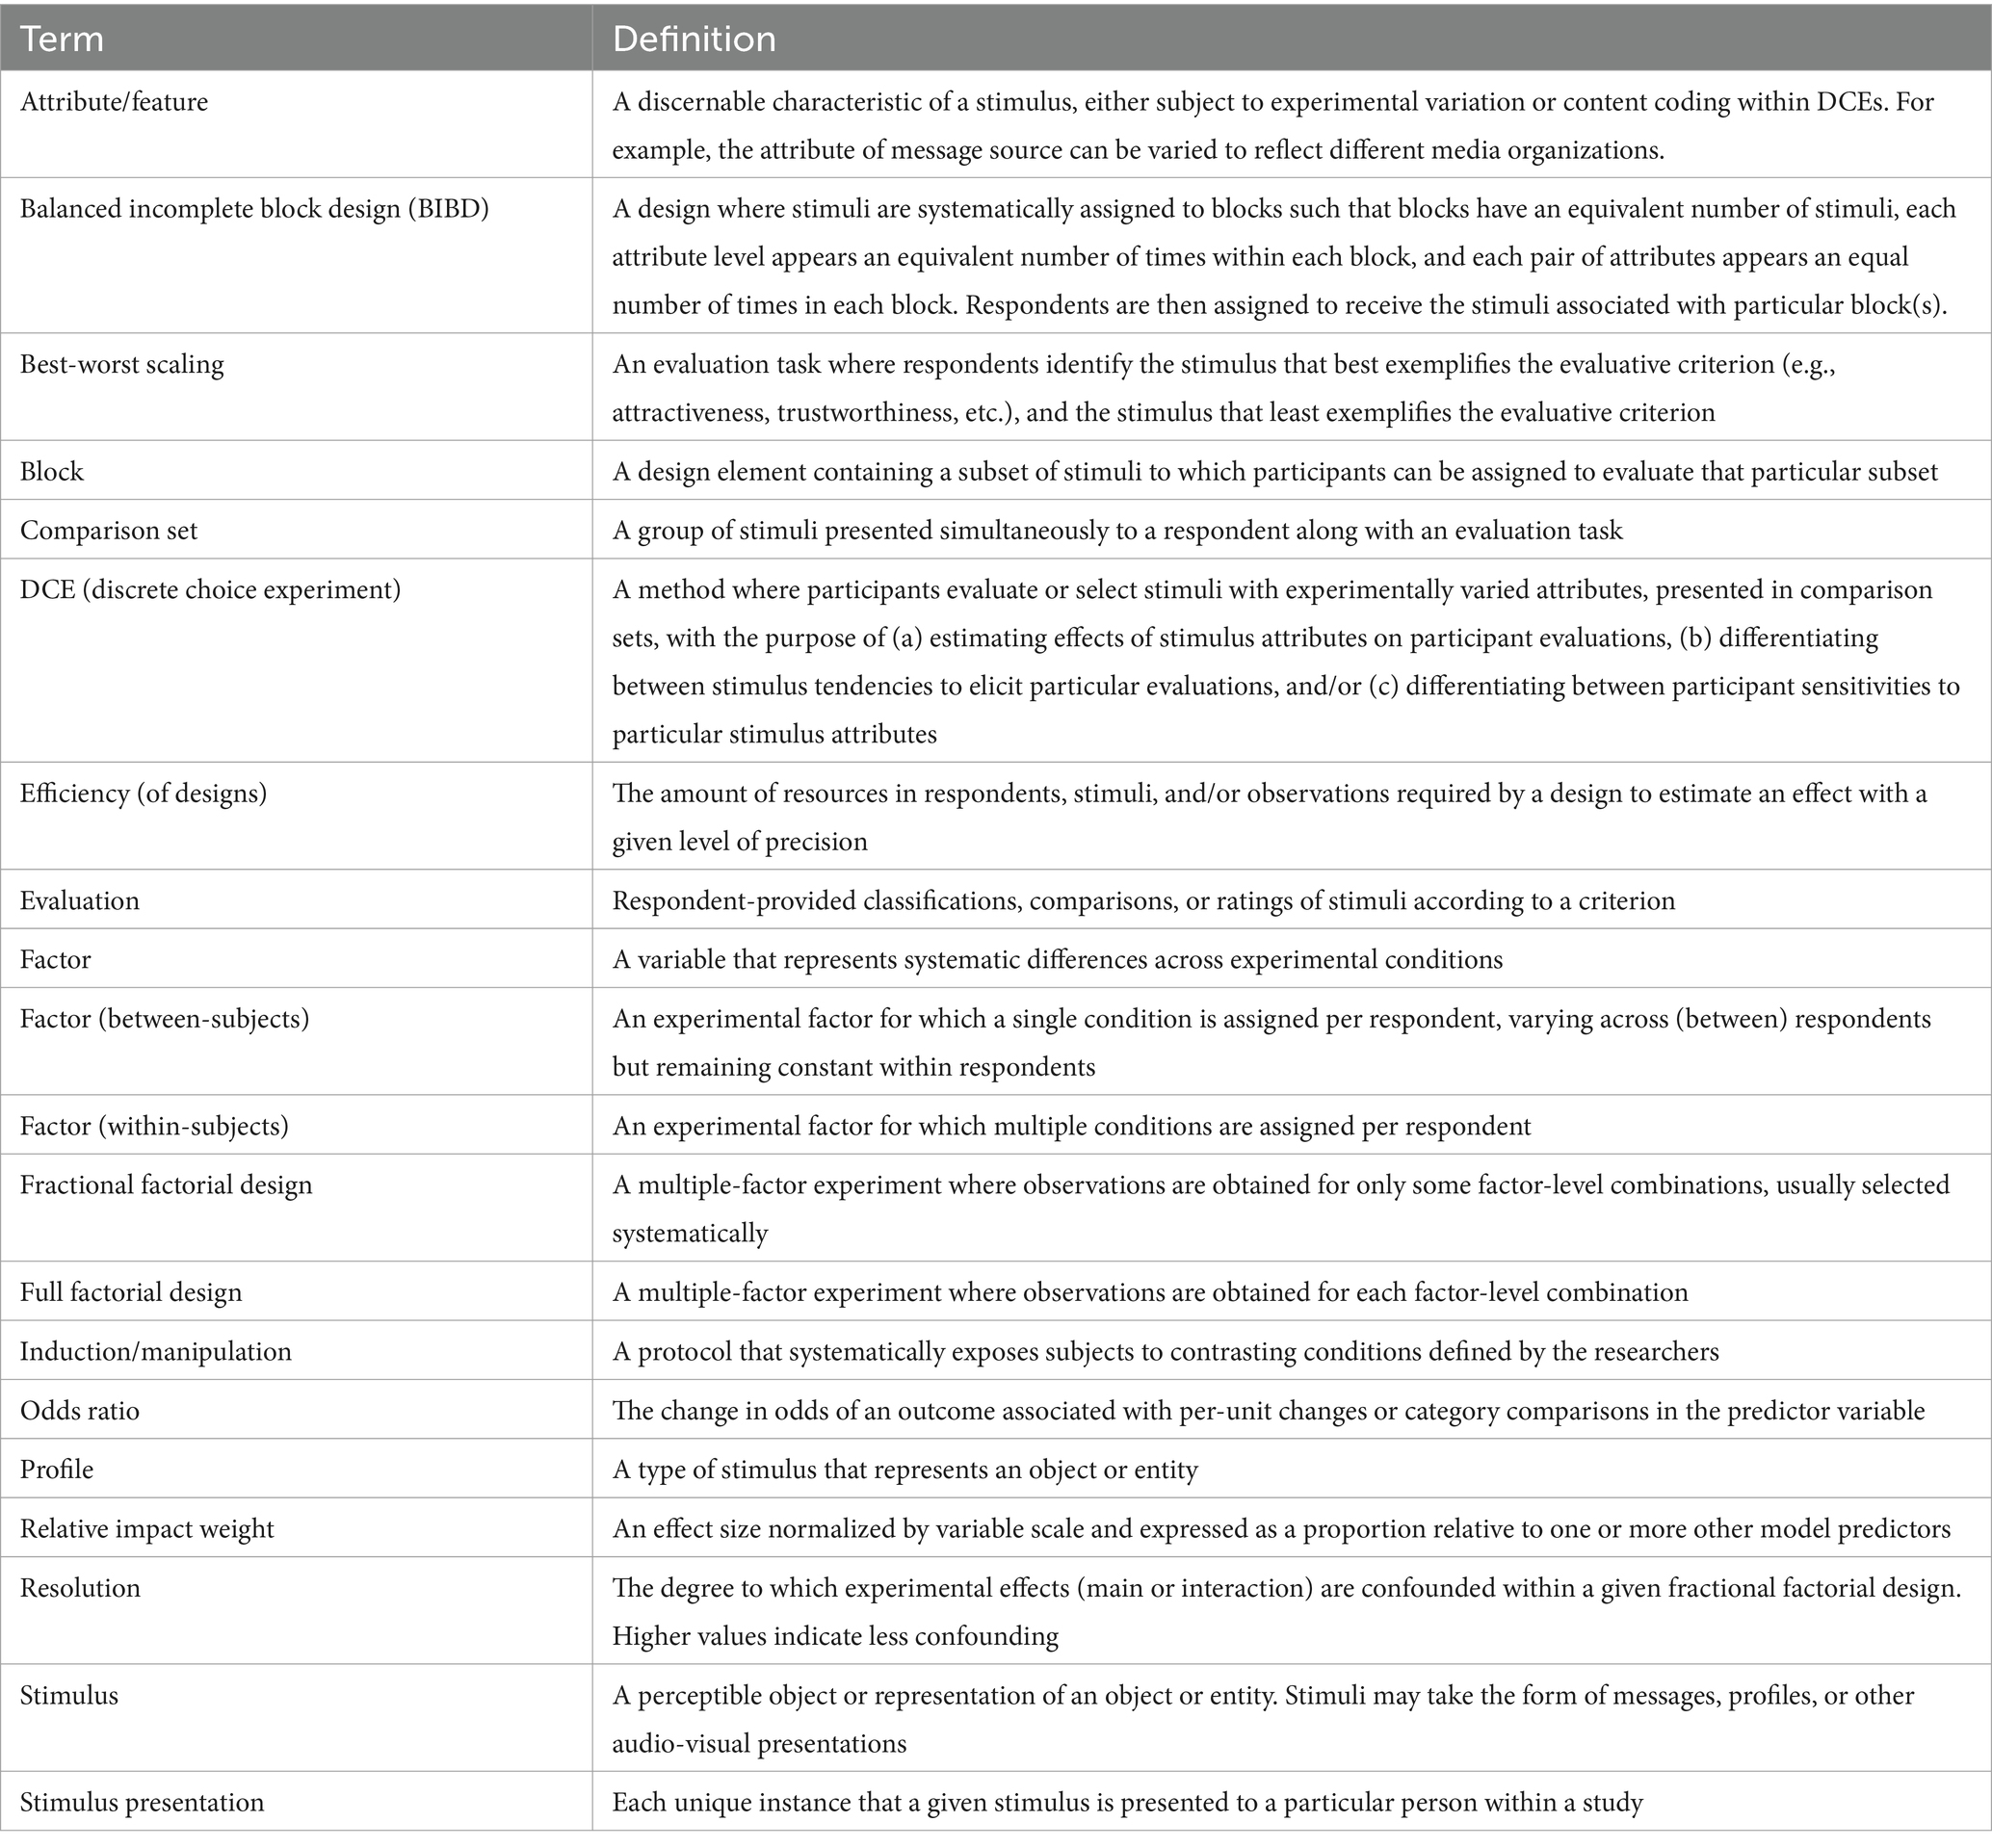
Table 1. Brief glossary of DCE terms.
Discrete choice experiments (DCE) refer to a collection of procedures, design characteristics, and analytic frameworks where participants compare and evaluate stimuli, usually presented in sets. Stimuli can take the form of messages or can depict profiles of entities or objects that each represent a unique combination of attributes (Lancsar and Louviere, 2008; Louviere et al., 2000). A DCE’s basic purpose is to infer the relative impact of each stimulus attribute on stimulus evaluation; in other words, to identify the message components responsible for perceptions of that message.1 In the context of communication research, stimuli may include most any kind of message and stimulus-features may include most any kind of message variable. Evaluations take the form of participant-provided comparisons or ratings of objects specified by the researcher. For example, our researcher, Lauren, may present sets of contrasting images of faces and ask subjects to select the one that appears most trustworthy. The task is simple, yet the design is distinct from conventional rating or selection tasks. Returning to our example, Lauren would have the ability to estimate the extent that perceptions of trustworthiness result from attributes of the eyes relative to the mouth expression, skin color, and so on. Although responses may occur at various levels of measurement, DCEs usually involve a ranking or choice task for each set, resulting in ordinal or dichotomous data (see Carson et al., 2022; Louviere et al., 2010). DCEs are related to the framework of conjoint analysis and stated preference designs (see Eggers et al., 2021; Louviere et al., 2010; Mühlbacher and Johnson, 2016). Below, we discuss specific design implementations.
Case 1 designs: attribute evaluation
Because DCEs belong to a family of methods, we consider variations that serve a similar purpose but with perhaps more limitations than full-fledged DCEs. One such method is often called a case 1 design which elicits explicit attribute evaluations. Returning to our example case, Lauren could address trustworthiness inferences in a rudimentary way by giving subjects a written list of personal attributes and asking how important each feature is (perceived to be) for determining trustworthiness. Figure 1 illustrates a sample attribute evaluation (case 1) task that Lauren might use. It contains seven facial features identified as potentially relevant to trustworthiness evaluations. This task could be constructed as a simple selection of attributes with the most or least importance, however, ratings may also be used. In case 1 and case 2 designs, ratings may reduce estimation problems associated with dominant attributes (Soekhai et al., 2021).
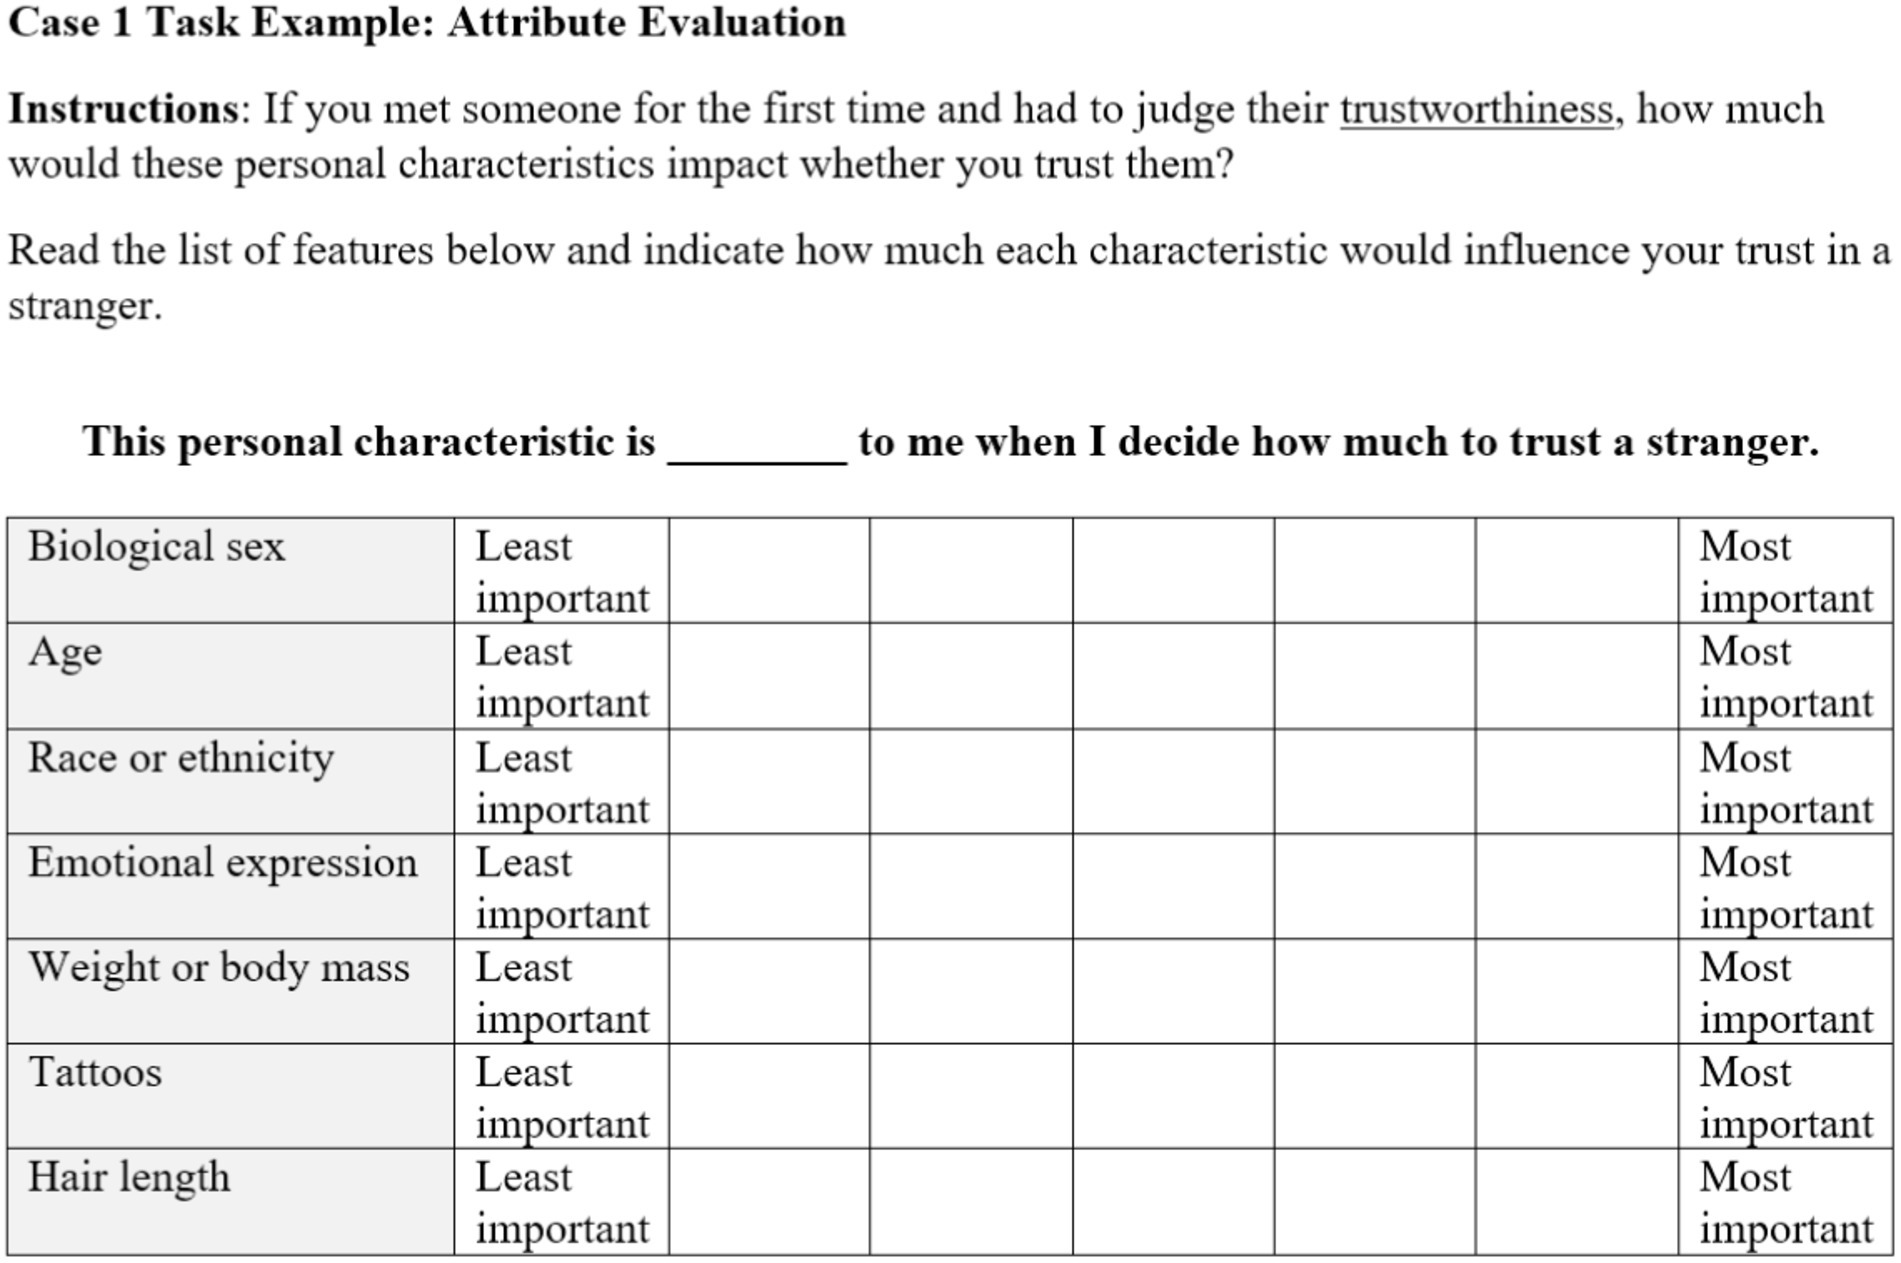
Figure 1. Example attribute evaluation task. Here, the evaluations are collected using semantic differential scales rather than dichotomous selection.
Case 1 attribute evaluation designs have the advantage of simple construction and efficient implementation; however, they have limited ability to determine the actual effect of message features. If Lauren relied on this method, her study would have involved no actual facial displays, nor systematic variation to create levels of each attribute. From a design perspective, therefore, case 1 designs have limited ability to show the effects of said features. In addition, subjects are explicitly asked to predict the influence of each item, but predictions of this kind are susceptible to biases, as people often fail to realize or wish to conceal the cognitive processes underlying their decisions (Nisbett and Wilson, 1977). For an example of a case 1 design, see Cheung et al. (2016).
Case 2 designs: stimulus-attribute evaluation
Another method in the DCE family is the case 2, or stimulus-attribute evaluation design. As in the case 1 method described above, the researchers develop a list of features expected to influence evaluations of an object or message. In addition, researchers articulate levels of each feature category. In our example, the feature category “emotional expression” could be instantiated by the two levels, happy and angry. Levels can be constructed for every feature category of interest (e.g., eyebrow shape, skin tone), permitting a full or fractional factorial design. The method proceeds as a repeated measures design where articulated feature-level combinations are presented one-by-one. Most commonly, case 2 designs use stimuli formed by concrete descriptions of feature-level combination (e.g., Cheung et al., 2016), however, it is possible to use graphical representation as stimuli as well. The outcomes are participant evaluations of the importance or impact of specific features. As in case 1 designs, the researcher specifies the evaluative criterion, such as trustworthiness, attractiveness, competence, etc. Figure 2 illustrates a case 2 stimulus that Lauren might use in her study.
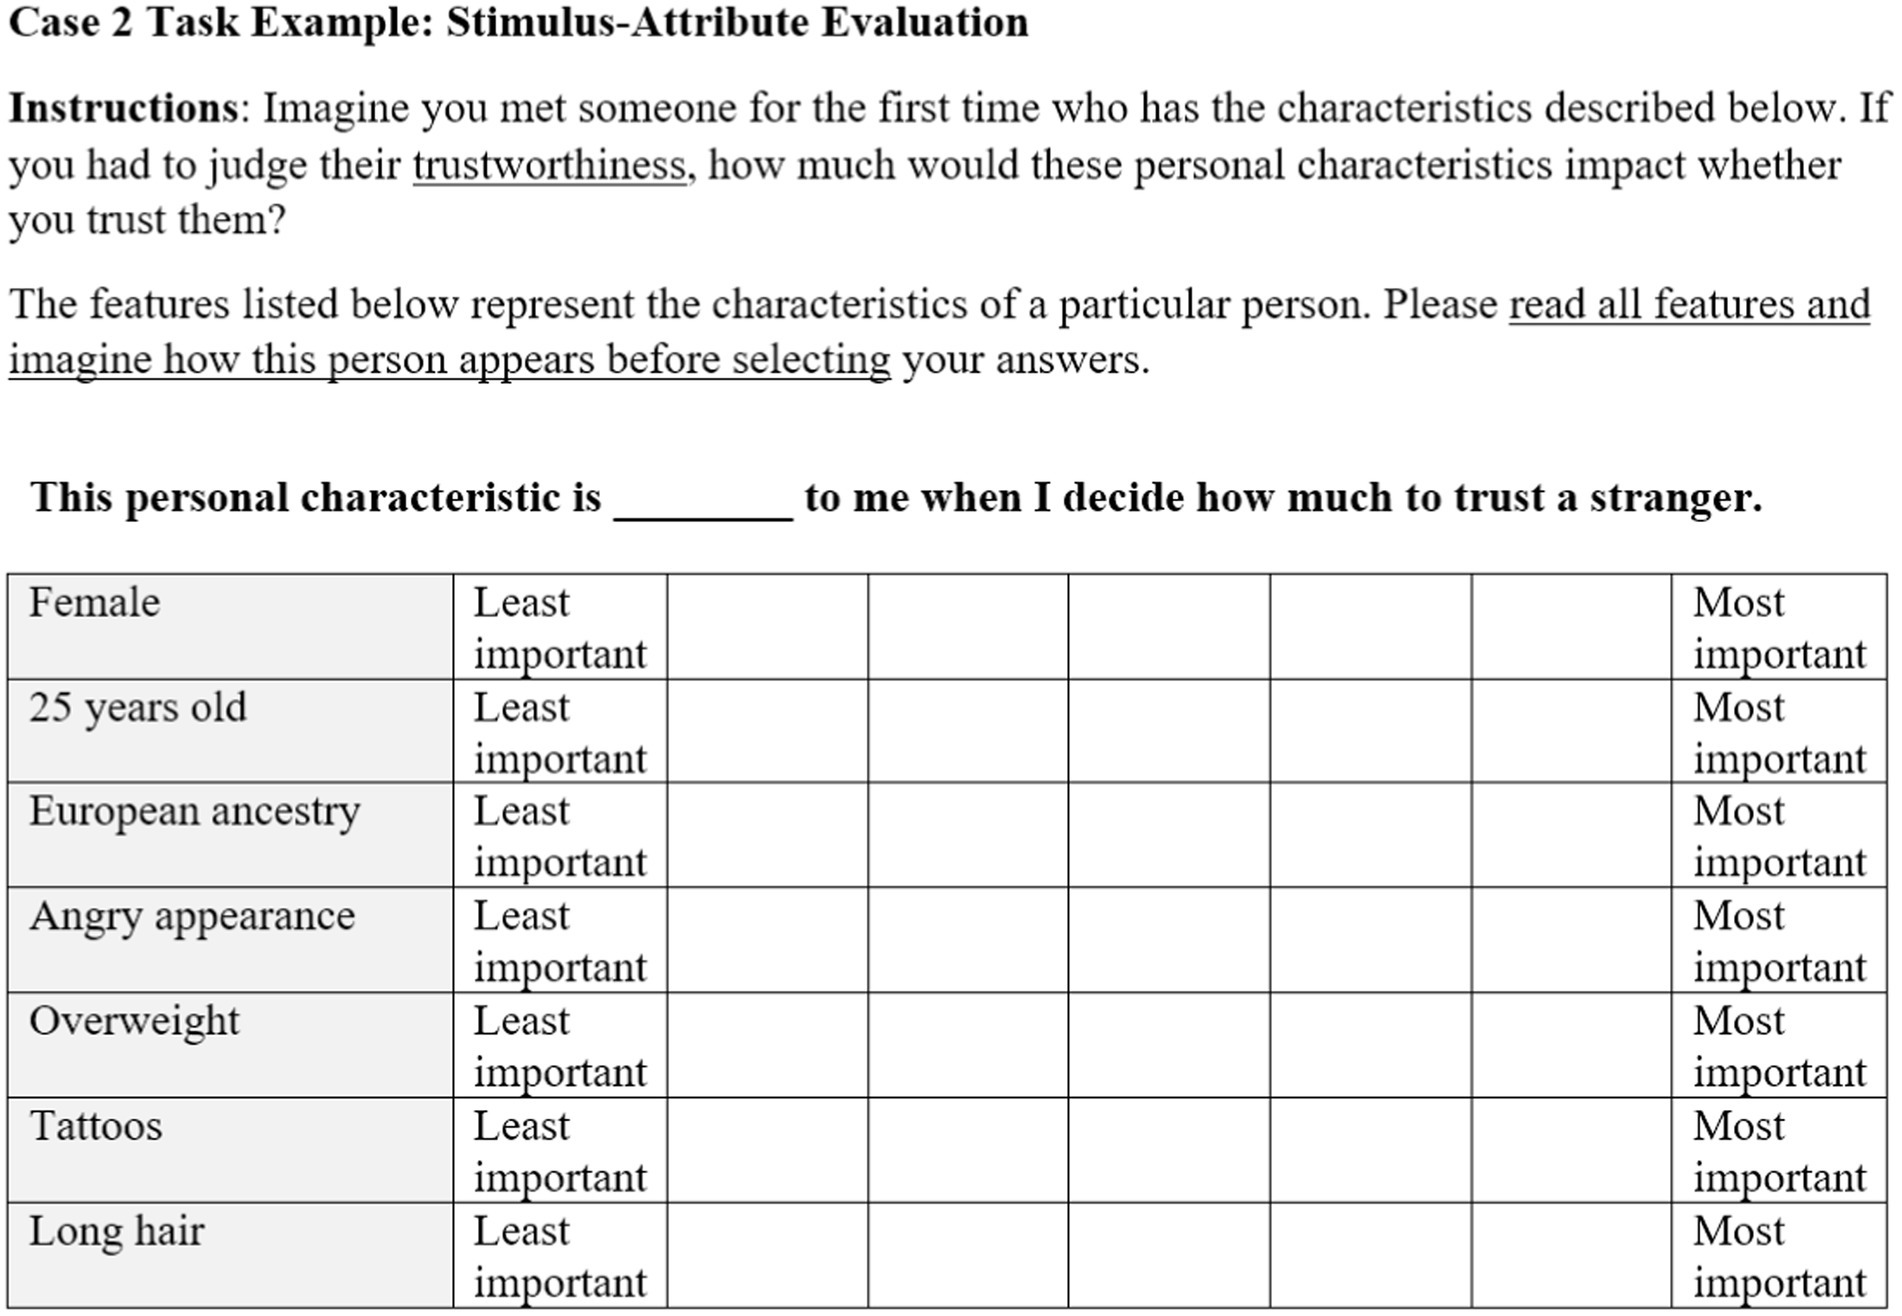
Figure 2. Example stimulus-attribute evaluation task. Here, the evaluations are collected using semantic differential scales rather than dichotomous selection.
Case 2 designs have several advantages over case 1. Each attribute is tied to the particular level displayed, leaving less ambiguity about how participants interpret their meaning. Researchers also control the levels included or excluded from the study, based on relevance to the given research question. By using a factorial design that includes different combinations of attribute levels, researchers can also analyze nonlinear effects of each attribute type. For example, the description of the intensity of a smile could be manipulated by varying degrees, and the data could reveal that the apparent intensity of a smile has a curvilinear relationship with evaluations. The factorial design can also test interaction effects between attribute types; for example, in Lauren’s study on facial features, the data may reveal that individuals from out-groups are perceived as particularly untrustworthy when they are not smiling.
Although case 2 designs are more robust, they have several limitations. First, they rely on bias-prone introspection, like case 1 designs. Specifically, as shown in Figure 2, participants are asked to evaluate the impact of each attribute on their overall judgment of the stimulus. In other words, participants do not evaluate stimuli directly, rather, participants rate the impact of each attribute in shaping their evaluation. As a consequence, responses may be vulnerable to bias and a lack of ability to introspect about the causes of behavior and cognitive processes (Nisbett and Wilson, 1977). People may be influenced by perceived skin color, for instance, but fail to realize or admit the influence of that factor and therefore provide inaccurate responses. For examples of case 2 designs, see Cheung et al. (2016), Coast et al. (2006), and Soekhai et al. (2021).
Figure 2 shows another potential limitation of common case 2 designs. There, each attribute is instantiated as a specific level described in textual form. This is not inherently problematic, as messages often include textual elements. However, in this case the phenomenon of interest is a person’s visual appearance, and verbal descriptions (a) are subject to varied interpretations, and (b) place higher cognitive burden on participants to imagine the described attributes. This illustrates the importance of modality in conveying profile information and the benefits of stimuli that resemble the objects they represent.
Case 0 designs: stimulus evaluation
Although not generally considered a DCE, stimulus evaluation (SE) designs are an important point of comparison. These are the conventional designs commonly used in communication research (e.g., Bente et al., 2020; Reynolds et al., 2019), especially for message-effect studies. SE designs elicit evaluations of stimuli directly rather than evaluations of stimulus attributes. Just as case 2 DCEs, stimulus evaluation designs articulate all combinations of attribute-levels, but do elicit inferences about specific stimulus attributes. Typically, participants give separate evaluations of each stimulus, and researchers then estimate the effect of each attribute on subject evaluations, enabled by the factorial design (Judd et al., 2012). Figure 3 displays an example of a stimulus evaluation task for the trustworthiness study. Despite the merits of SE designs, DCEs are a more efficient alternative in many cases.

Figure 3. Example task from a stimulus evaluation design. Image generated with artificial intelligence software (Midjourney, 2024).
Case 3 designs: multi-stimulus discrete choice experiments
Below we present the commonly used and more sophisticated DCE designs that use some features of the designs previously discussed. DCEs use stimuli depicting attribute-level combinations to instantiate the range of relevant attributes. In addition, DCEs presenting multi-stimuli simultaneously, using sets to elicit comparative evaluations (Carson and Louviere, 2011). In DCEs, participants do not evaluate attributes or attribute levels,2 but directly evaluate the stimuli in each set, often by providing relative rankings of the options presented. For illustration, we have presented the work of Thrasher et al. (2018a) who developed sets of messages designed to motivate smokers to quit (see Figure 4). Messages varied along five attributes including message topic, information type (i.e., testimonial vs. factual), image (i.e., present vs. absent), call to action (i.e., present vs. absent), and contact information (i.e., present vs. absent). Although DCEs may be constructed with multiple evaluation tasks, here, participants selected the most and least helpful message out of each comparison set, applicable to the best-worst scaling analytic framework (discussed below). The design used by Thrasher et al. (2018a) had 64 possible message conditions, however, fractional factorial designs permit fewer messages and a manageable number of comparison sets (see below). DCEs go beyond traditional self-report techniques in several ways. They can more efficiently quantify the effect of stimuli, provide information about the relative importance of stimulus attributes to general audiences, and estimate each individuals’ sensitivity to a given attribute (Cleland et al., 2018; Turk et al., 2020). Comparison sets in DCE designs can include real or hypothetical stimuli (Cleland et al., 2018) and are applicable to virtually any context (Lancsar and Louviere, 2008).

Figure 4. Example stimulus-comparison set (adapted from(Thrasher et al., 2018a).
The multi-stimulus design of DCEs has several advantages. First, the evaluation task can approximate real-life decision scenarios where individuals weigh trade-offs between competing options, consistent with Random Utility Theory (e.g., Gerasimou, 2010; Hess et al., 2018; Lancaster, 1966; Mas-Colell et al., 1995; McFadden, 1974; Thurstone, 1927). This can help maximize the ability to discern between even similar stimuli. In addition, multi-stimulus DCEs require no inference about which features are responsible for a given evaluation, allowing evaluations that generalize to real contexts (Cleland et al., 2018).
A number of DCE design elements require further consideration, including the selection and number of attributes, the number and size of comparison sets, blocked designs, fractional factorial designs, response measures, and analysis options. Below, we discuss these topics in detail and provide recommendations about the trade-offs implied by design choices. To summarize, Table 2 presents a concise overview of characteristics of each design.
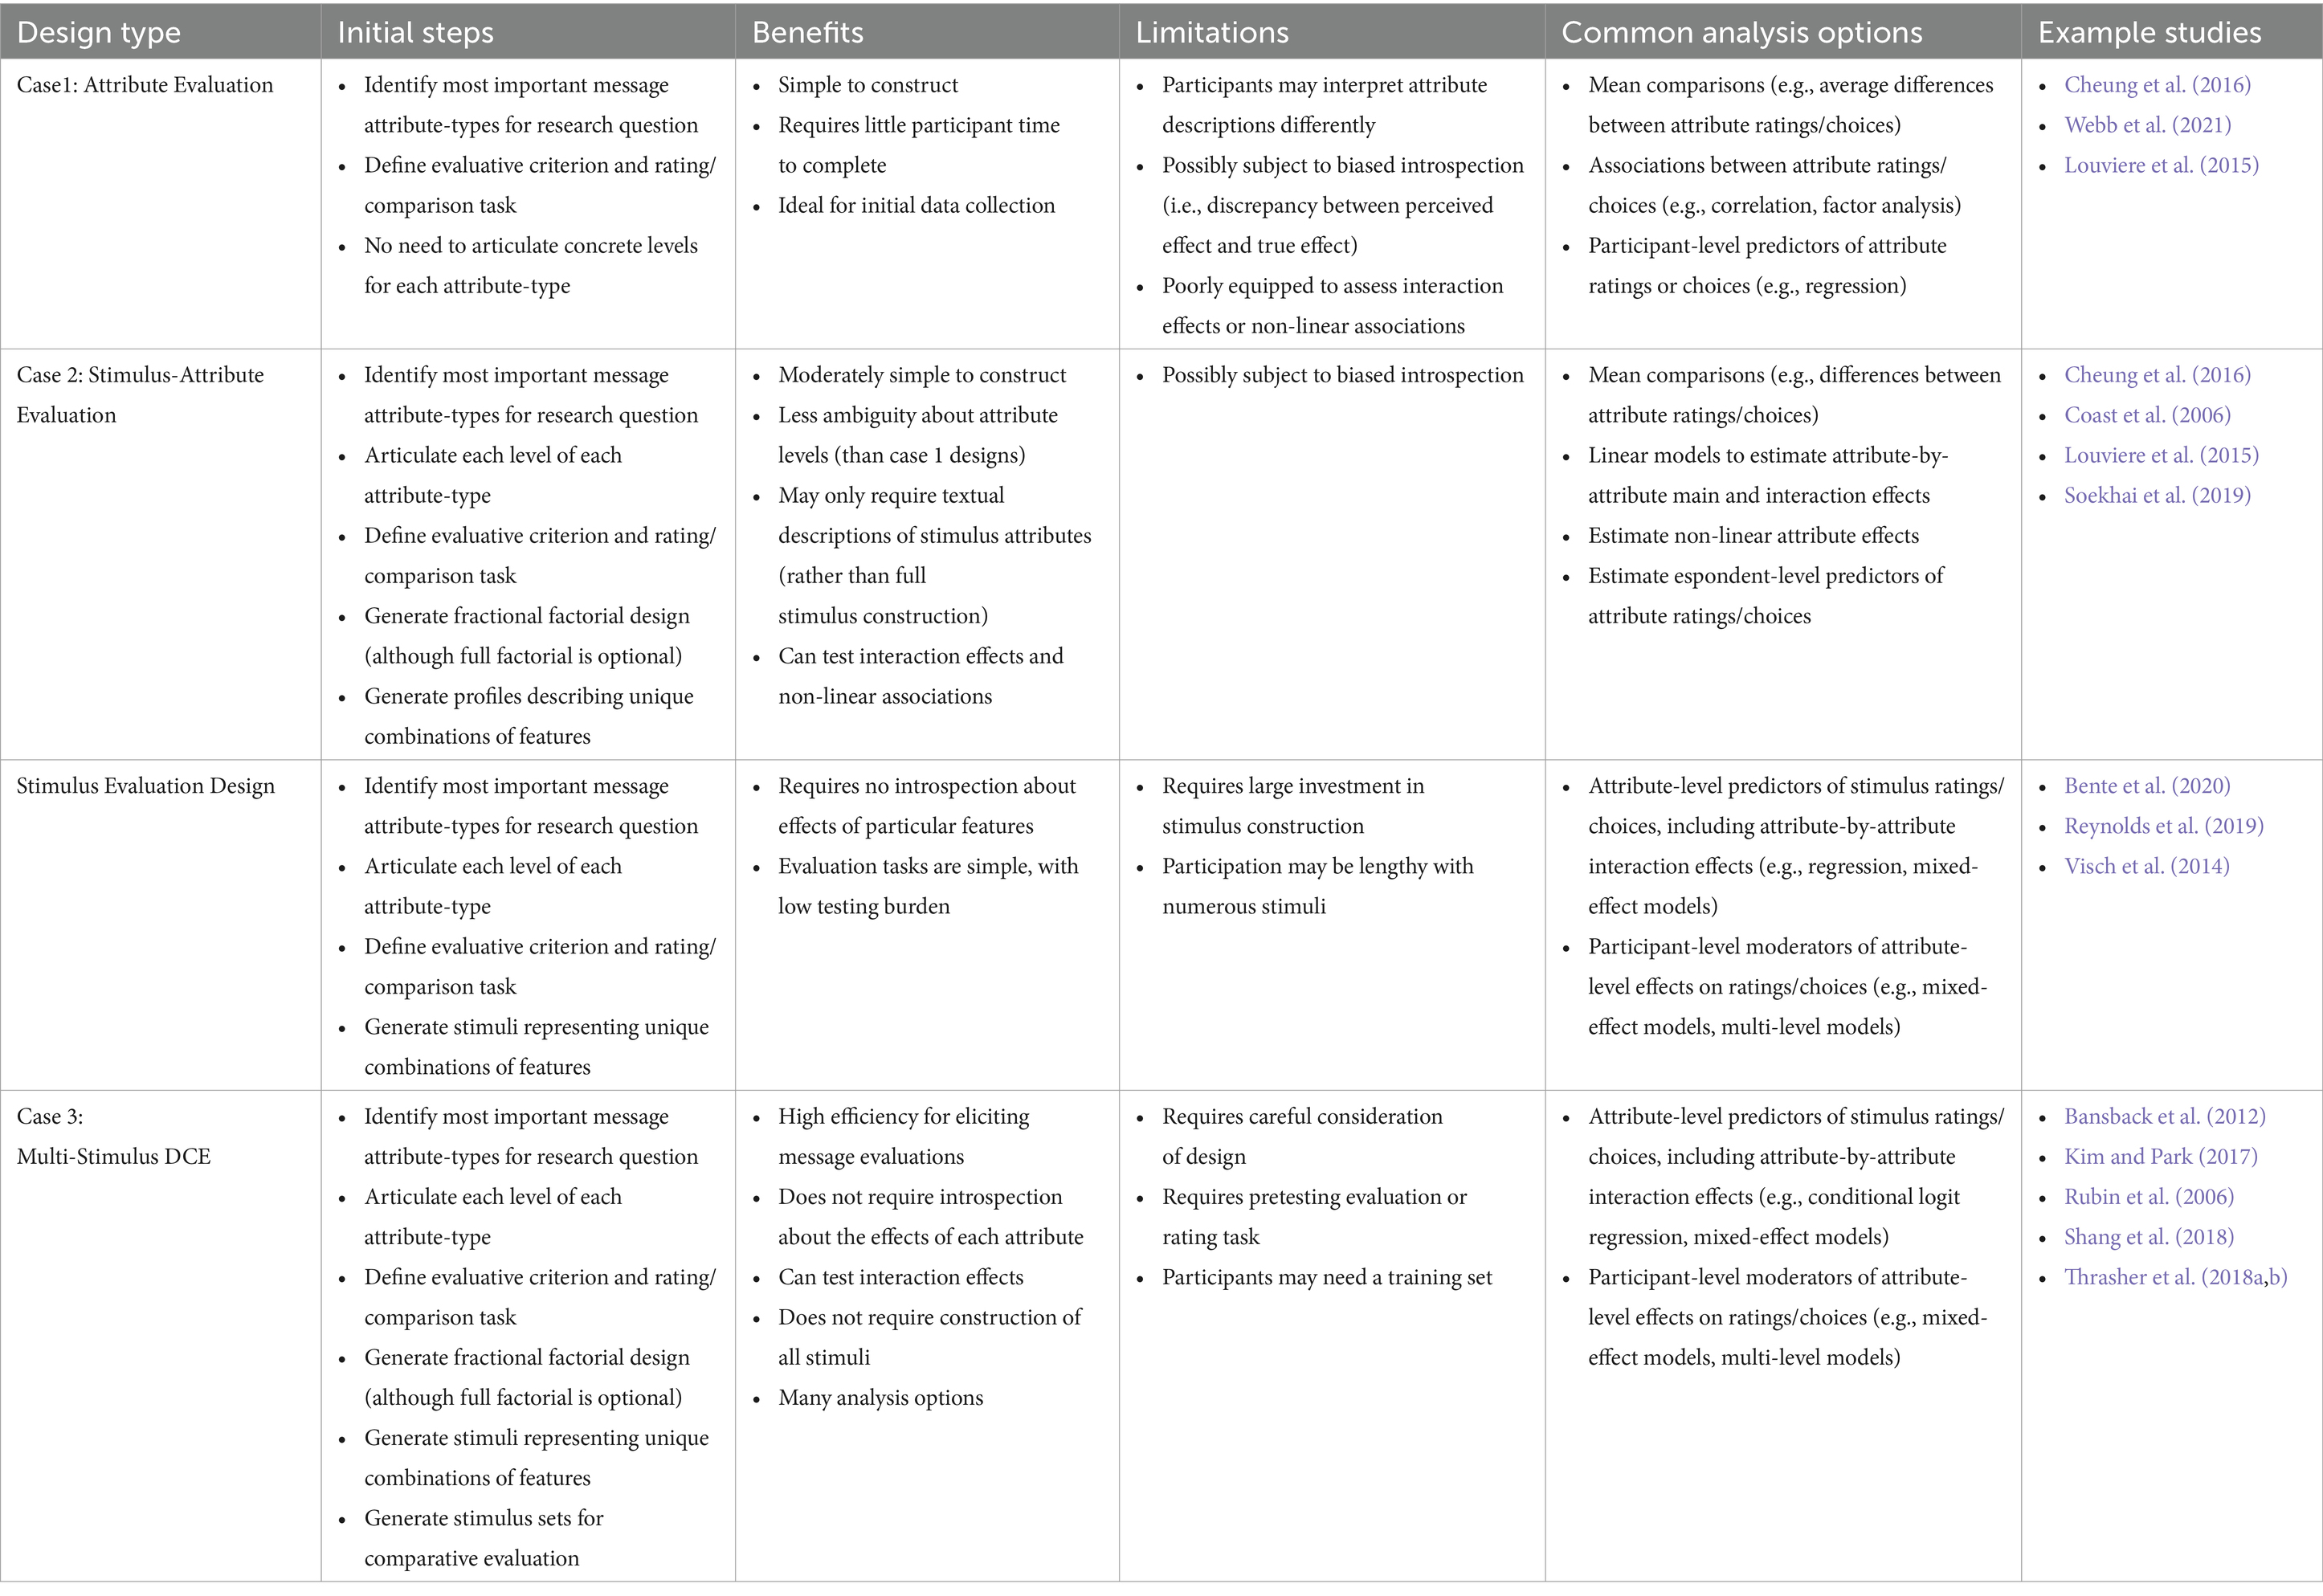
Table 2. Summary table of design characteristics.
DCE design elements
Attributes and levels
DCEs begin like any experiment, with a clear research question and conceptualization of key variables. Although DCEs are flexible and efficient, judicious selection of factors and levels still helps satisfy limitations of sample size and participant attention. Once researchers have identified key attributes, they will determine the levels to include. Attribute levels should constitute meaningful categories that likely occur within the context under study. For Lauren’s study, she was aware of several cultural artifacts and stereotypes that influence rapport-building (Bente et al., 2020), leading to her decision to manipulate features that might be associated with stereotypes, such as ancestry or ethnicity, emotional expression, tattoos, etc. Ideally, chosen levels should span a wide range to capture the extremities of the attribute while maintaining realism. Intermediate levels may be important as well, especially where non-linear effects are suspected, but a weak induction (one with small differences between levels) can result in a failure to find an effect.
So-called “control” conditions may also be considered for each attribute, and researchers should consider what kind of reference category allows the most meaningful comparison. Critically, the goal is to eliminate confounding variables as plausible explanations for observed effects. Constructing control levels can be complex. For example, at times withholding content can serve as a control, whereas at other times filler content is more suitable to preserve realism and similarity in message length and task characteristics. When in doubt, a researcher can include multiple control conditions per attribute. In the context of facial-feature research, a control stimulus could depict a face with a neutral, or calm expression, rather than omitting features. Researchers should also consider their ability to produce the content required for each stimulus. Although constructing high-quality stimuli can be difficult and costly, researchers can also adapt content found in existing popular media or research literature.
When stimuli cannot be perfectly controlled, some attributes may vary in addition to the ones intended by the experimental induction. Although this could result in confounding, the problem can be addressed, to an extent, content coding stimuli. This means assigning additional attributes to stimuli and statistically accounting for their effect. This is critical when additional attributes are associated with experimental inductions and may be associated with the outcome of interest. For example, style of dress may be associated with the presence of tattoos, biasing estimates of tattoo effect. Appropriate coding and statistical adjustment may help prevent confounding, assuming the confounding variable is not perfectly correlated with the attribute of interest.
Experimental design, stimulus construction, and comparison sets
DCE’s often use fractional factorial and balanced incomplete block designs (BIBDs) to accommodate the large number of possible attribute-level combinations represented by stimuli. Suppose that in Lauren’s study on facial feature effects, she decided to include seven factors. For the sake of simplicity, suppose she decided to have only two levels per factor (see Table 3). Multiplying the number of levels from each factor shows the design has 128 attribute-level combinations. This may be too many conditions to present to people during an experiment because of time, cost, participant willingness, or fatigue effects (Caussade et al., 2005). Large numbers of stimuli may also strain the researcher’s ability to generate the needed stimuli.
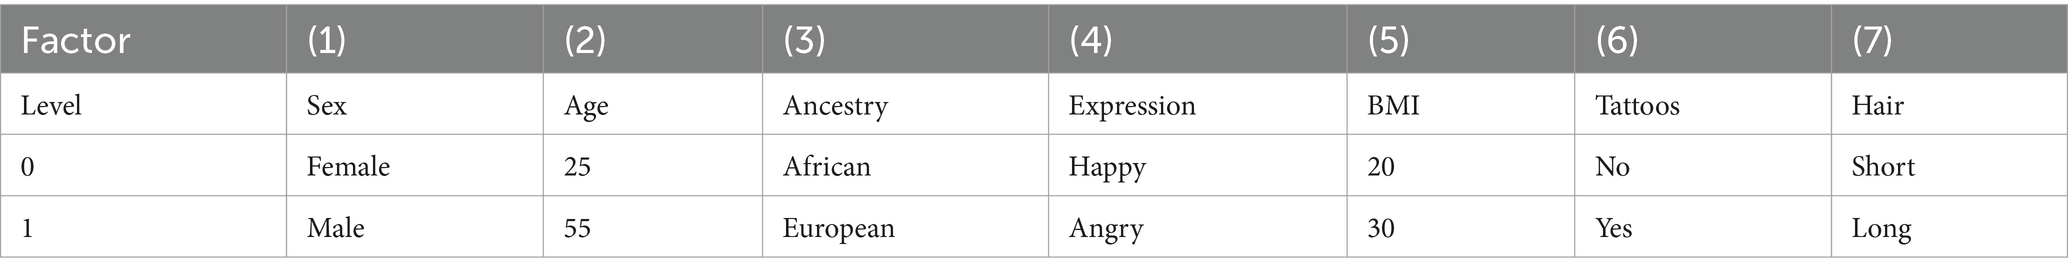
Table 3. Example stimulus factors and levels for DCE.
DCEs ultimately elicit evaluations within sets of contrasting stimuli, displaying two or more simultaneously, to estimate the influence of focal attributes. As indicated above, by stimulus we mean a concrete instantiation of a particular combination of message-attribute levels. Returning to the personal appearance context, Lauren could use cartoon illustrations, AI-generated images, or real photographs. The choice should consider the availability of existing content, the researcher’s own resources and skill at generating content representing the focal attributes, and the need to control for non-focal attributes.
Figure 5 shows an example of four contrasting stimuli within a hypothetical comparison set. The first stimulus, for example, depicts a male of African ancestry with a happy expression, higher BMI, 25 years old, tattoos, and long hair. To estimate all main and interaction effects in this study, a full-factorial design with 128 stimuli would be needed. Following the recommendations of Reeves et al. (2016), researchers can also construct multiple stimuli per condition to reduce confounding of stimulus idiosyncrasies with attribute levels. This could be done, for example, by randomly sampling from pools of profiles or messages with multiple long hair styles and multiple short hair styles. This would help determine whether the long vs. short distinction is meaningful and potentially increase confidence about the generalizability of results.

Figure 5. Example comparison set with stimuli representing combinations of features. Image generated with artificial intelligence software (Midjourney, 2024).
Balanced incomplete block designs
As the number of experimental conditions grows, due to more factors and/or more levels within factors, it may be impossible to expose each participant to all stimuli, even using comparison sets. In such cases, DCEs often adopt a balanced incomplete block design (BIBD) so that each stimulus is presented to a random subset of participants. The blocking procedure may help maintain efficient and unbiased estimation of attribute effects.
In a BIBD, stimuli are systematically assigned to blocks, or arrays, and participants are randomly assigned to receive the stimuli associated with a particular block. Within each block, stimuli are further assigned to comparison sets that facilitate the simultaneous display of multiple stimuli to a participant (discussed below under Comparison Set Construction). In some cases, stimuli may be repeated across blocks for the purpose of establishing common reference stimuli for all participants, potentially allowing greater statistical control of inter-rater differences.
Constructing blocks demands care. For example, if Lauren distributed stimuli so that only a single block contained happy expressions, the within-subject variance for that factor would be minimal, and it might then correlate with participant-level differences, given that randomization works imperfectly. To avoid this problem and estimate attribute effects more precisely, blocks are more effective when ‘balanced’, meaning they satisfy three conditions. First, blocks have equivalent size so that all participants receive the same number of stimuli (representations of attribute combinations). Second, stimuli are assigned such that each attribute level appears an equivalent number of times within each block. For example, Lauren would ensure that the number of stimuli with long hair is equivalent to the number with short hair within each block, and so on for each attribute. Third, each pair of attributes (i.e., each unique two-attribute combinations within a stimuli) appears an equal number of times in each block (Rink, 1987). Implementing BIBDs is complex but software can generate such designs for experiments with different numbers of factors and levels (e.g., the free R package DoE.base; Grömping, 2018).
To illustrate BIBDs, Table 4 presents an example block used by Lauren in her study. Notice that only 16 stimuli are included, requiring 1/8 of the possible 128. The specific stimuli included meet the requirements for a BIBD. The levels of each factor are displayed, to be represented numerically for the purpose of analysis (e.g., short hair = 0, long hair = 1). In this block, each attribute level occurs eight times and each pair of attribute-levels occurs four times. For example, stimuli 13–16 depict 55-year-old males, and no other stimuli have that combination. Analyzing the block also reveals that all factors are perfectly uncorrelated (r = 0), enhancing the efficiency of estimating independent effects. In a full factorial BIBD DCE, this block would be constructed alongside seven other 16-stimulus blocks to evenly distribute the other 112 stimuli. Appendix A illustrates sample code and output from the R package DoE.base that can help select a desired block design given a specified design.
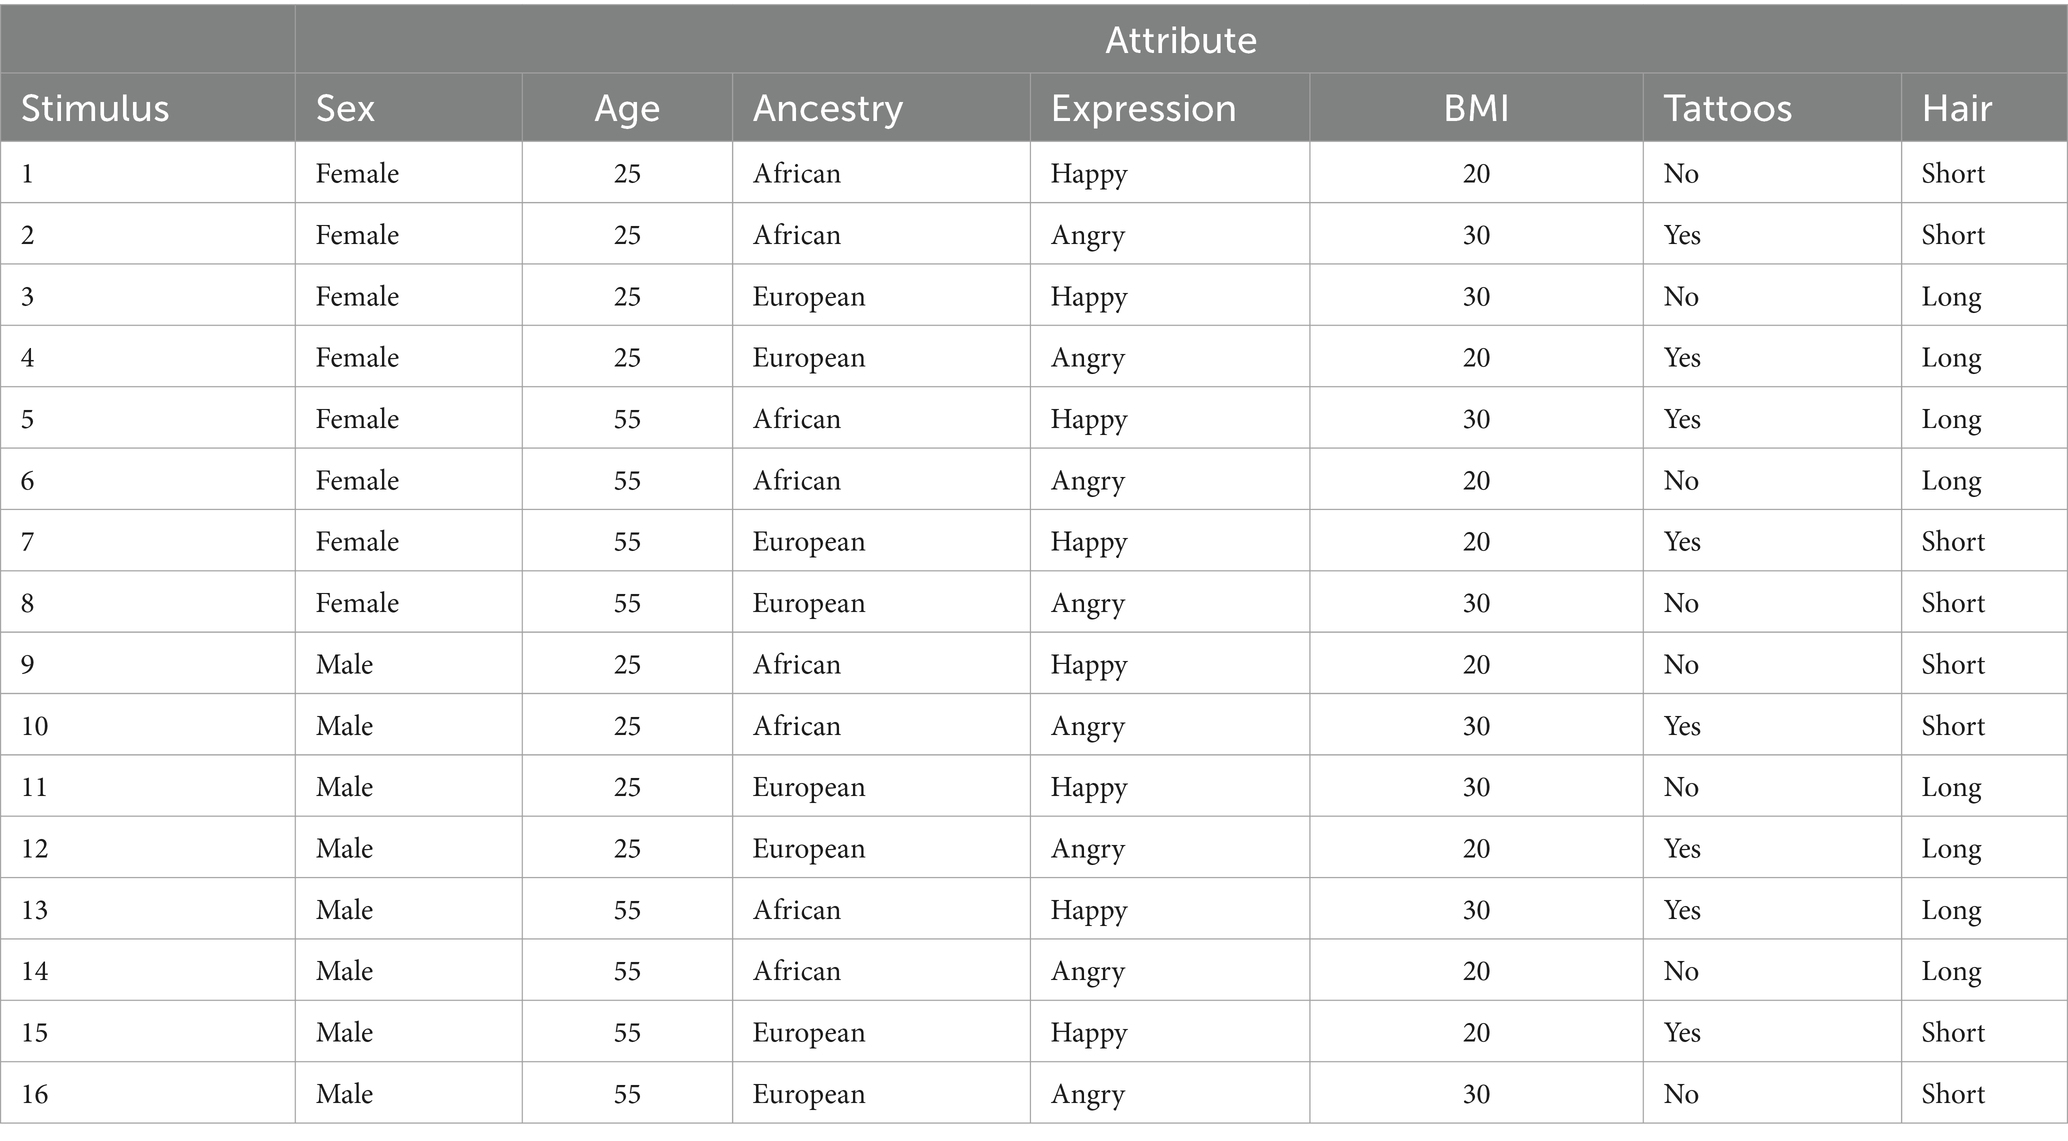
Table 4. Example balanced incomplete block for 2x2x2x2x2x2x2 design.
Fractional factorial designs
DCEs also commonly use fractional factorial designs (FFDs) to further reduce the number of stimuli required. Constructing fractional factorial designs uses the same criteria as BIBDs, however, some stimuli will be omitted from the design (not be included in any block). As with BIBDs, software tools exist to assist in generating these designs (e.g., DoE.base; Grömping, 2018). Choosing the attribute combinations to be omitted requires considering several assumptions and research objectives. Perhaps most important is the potential for non-additive effects among the factors; from our example study, this could occur if happy expressions influence trustworthiness differently on account of another facial feature. Fractional factorial designs can be specified to allow estimation of some or none of the possible interaction effects. In the DCE literature, the concept resolution captures the extent to which experimental effects are confounded within a given FFD design. Put simply, higher resolution designs involve less confounding between and among main and interaction effects. Box and Hunter (1961) discuss the concept in detail and define three of the most common categories of fractional factorial designs. As they state, a resolution 3 design confounds main effects with two-factor interactions. A resolution 4 design does not confound main effects with two-factor interactions, but two-factor interactions are confounded with one another. In resolution 5 designs, “no main effect or two-factor interaction is confounded with any other main effect or two-factor interaction, but two factor interactions are confounded with three factor interactions” (Box and Hunter, 1961, p. 319).
Higher resolution designs involve less confounding but generally require more stimuli. Designs of resolution less-than 3 are not useful because they confound main effects with other main effects. Importantly, only a full factorial design can estimate all main and interaction effects; thus, fractional factorial designs will fail to observe interaction effects and they will produce biased estimates of main effects if particular interactions do exist. Therefore, we recommend that fractional factorial designs be used with caution and in a way that main effects are unconfounded with at least all two-way interactions (i.e., resolution IV design or higher). Even without a priori expectations of interaction effects, prudence should require evidence of no interaction before proceeding with an FFD. The risk of bias is real because interaction effects are commonplace in communication research (e.g., Keller and Lehmann, 2008; Lang and Yegiyan, 2008; Reynolds, 2020). Moreover, the ability to test for interactions is a strength of multi-factor experiments that may be missed when omitting conditions. Appendix B displays example R code and output to help select a suitable fractional factorial balanced incomplete block design.
Random stimulus sampling
As an alternative to blocked designs, perhaps the simplest way to accommodate excessively large numbers of attribute combinations is through random sampling of stimuli. In Lauren’s study, a unique random subset of the 128 stimuli could be selected for each participant. Randomization requires no complex blocking procedure and does not omit any portion of the factorial space. In this way it is less likely to produce biased estimates of main effects that result from confounding with interactions. Randomization is also easy to implement at the point of survey construction if the set of all stimuli can be generated. Recent research has also shown that random stimulus-sampling designs do not lose much efficiency as compared with blocked designs, especially when population parameters are uncertain (Walker et al., 2018).3 Despite the advantages of random stimulus sampling, like the full factorial design, they may not be feasible if the entire set of possible stimuli cannot be constructed, for example, if it is too expensive to do so. As another limitation, simple random stimulus sampling does not ensure that each participant is exposed to equal (or any) instances of each attribute level. In aggregate this is not problematic because general attribute effects can still be estimated, however, if one is interested in modelling individuals (e.g., Louviere, 2013) then a blocked design may be preferable to ensure that sufficient attribute combinations are presented to every participant e.g., (see Das et al., 2018).
Comparison set construction
In many non-DCE designs, stimuli are presented one-by-one (i.e., the size of each set is 1). In contrast, DCEs typically present multiple stimuli simultaneously. In this way, evaluation occurs with direct comparisons between stimuli within the set. By using a comparison task, a single set can generate information about multiple stimuli. Comparison sets will contain at least two stimuli but most often contain four to efficiently generate evaluations for subsequent analysis (Caussade et al., 2005). As the number of stimuli within each comparison set grows, the difficulty of comparing stimuli tends to increase, particularly when stimuli reflect many complex attributes (DeShazo and Fermo, 2002). Developing comparison sets involves deciding how many stimuli will appear within each set, and then deciding how many times stimuli will reappear across sets. The total number of comparison sets must accommodate these parameters. Repeating stimuli across comparison sets generates more comparisons, allowing more precise estimates of attribute effects. Importantly, pretesting may be necessary to assess task difficulty and participant fatigue. Table 5 displays an example collection of comparison sets for Lauren’s 16-stimulus FFD.
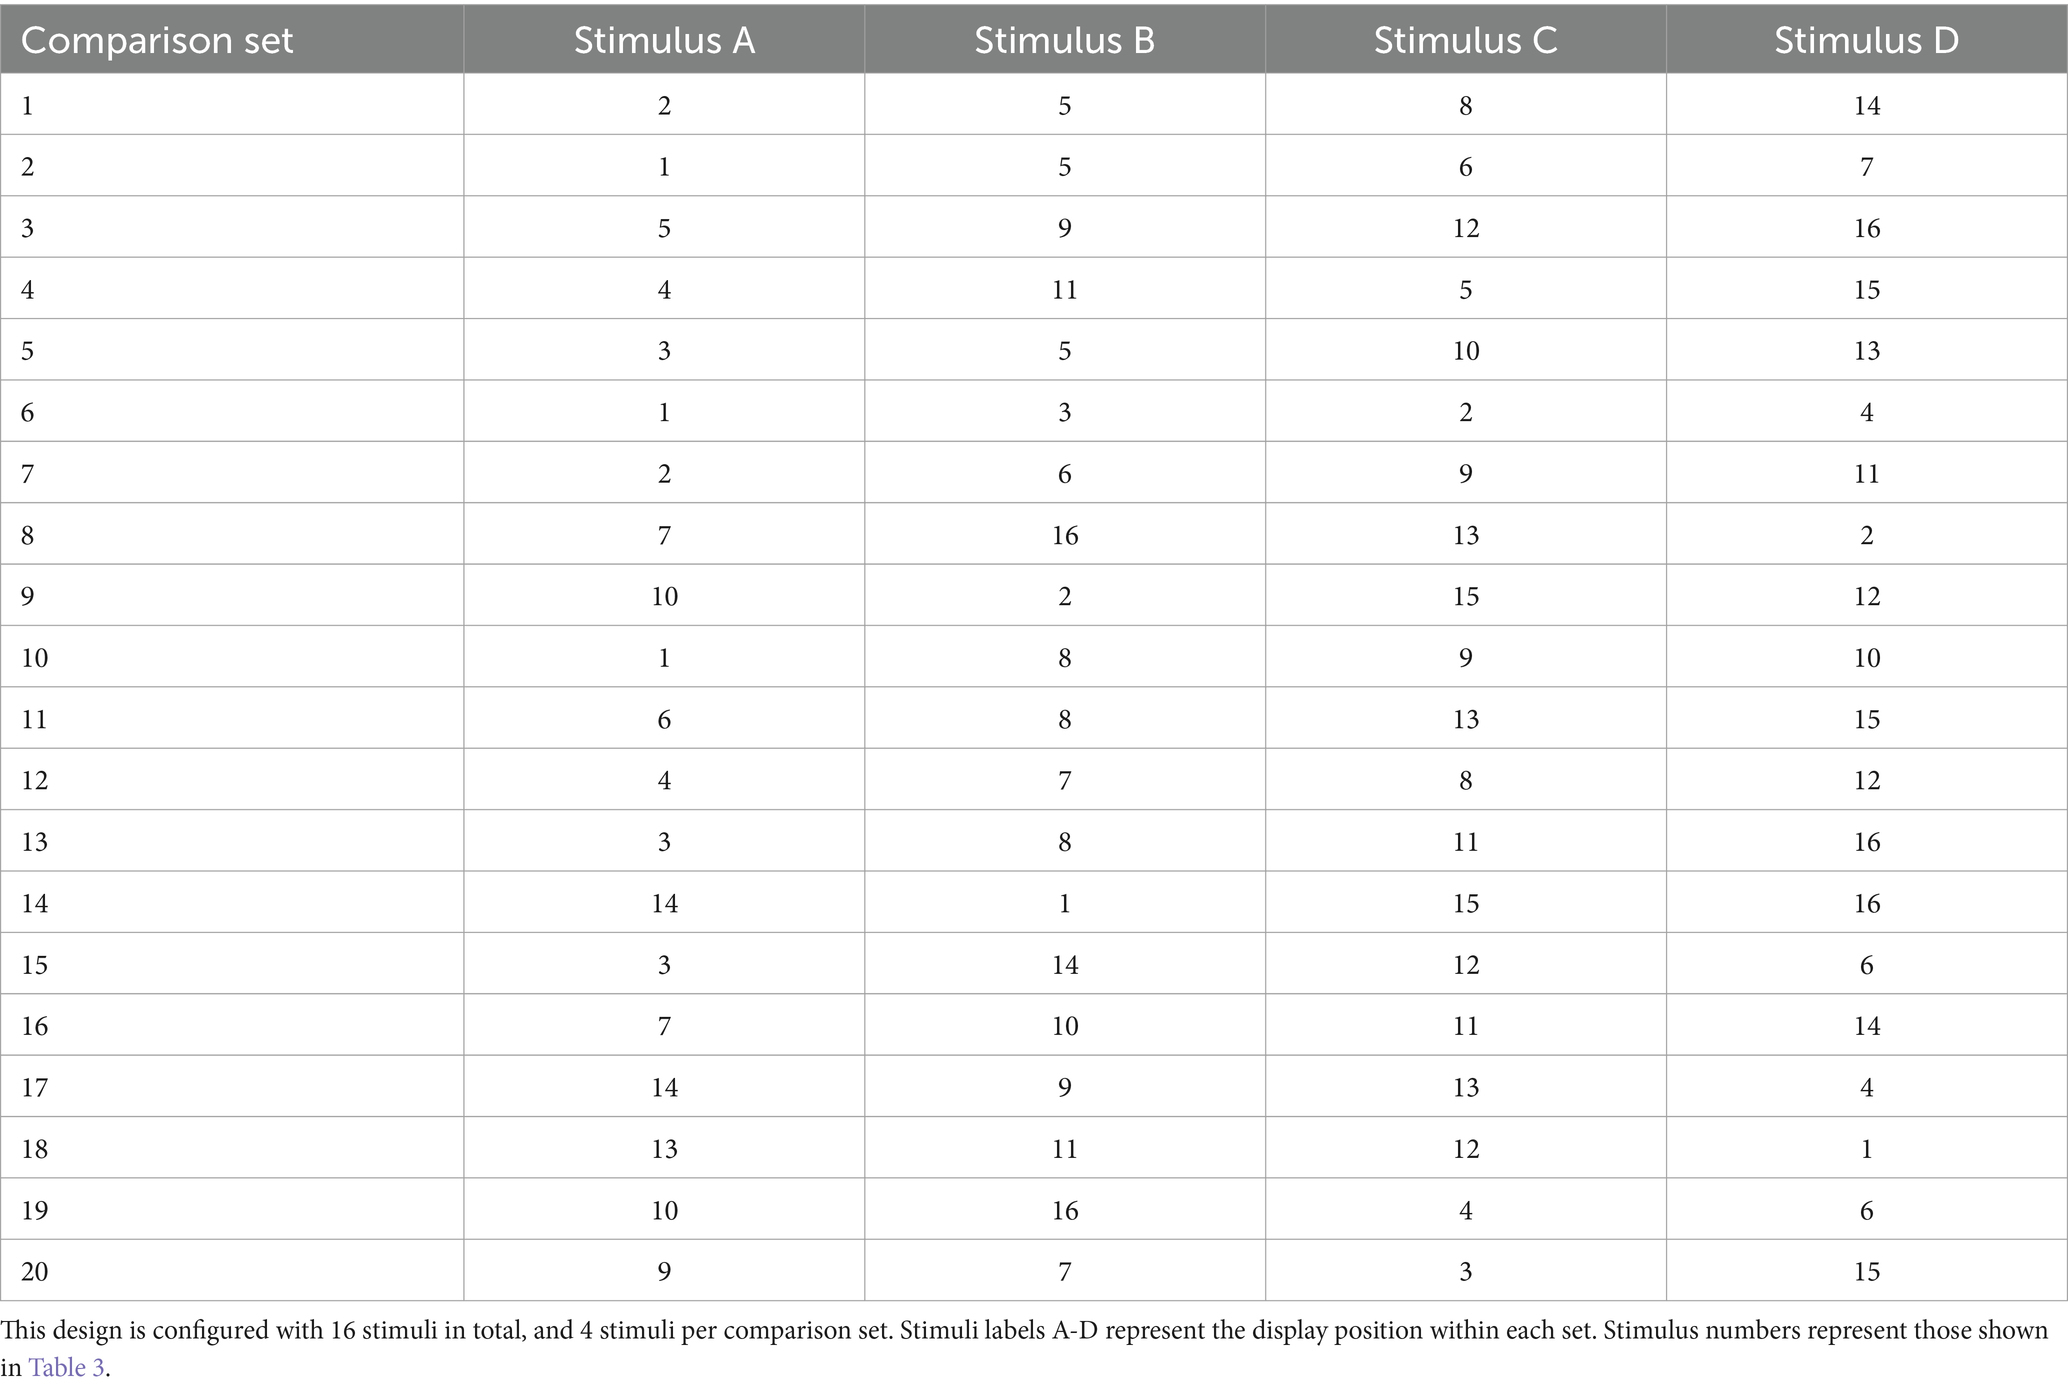
Table 5. Example block of comparison sets for a multi-profile DCE.
Assigning stimuli to comparison sets generally applies the same criteria used for BIBDs. First, any particular comparison set should not contain multiple instances of the same stimulus, as that would involve comparing a stimulus to itself. Second, the property of balance can enhance parameter estimate precision. Specifically, all stimuli can appear an equal number of times across comparison sets. For example, each stimulus in Table 5 appears five times. The headings Stimulus A-D indicate the unique stimuli to be displayed for each comparison set. During implementation, stimuli can be displayed in various spatial orientations (e.g., horizontally or vertically), and the position of stimuli within comparison sets can be randomized and recorded if order effects are a concern. A third criterion for balanced sets involves each pair of stimuli (i.e., each unique 2-stimulus combination) occurring an equal number of times across comparison sets. Table 5 illustrates this, as each stimulus co-occurs with every other stimulus exactly once. When these design criteria are met, stimuli should receive the same number of evaluations and estimates of stimulus-attribute effects should be more precise. Note that balanced comparison sets are only possible for some combinations of design parameters. Designs will be more efficient if they approximate balance, even if perfect balance cannot be achieved. Alternately, researchers may use random sampling of stimuli (without replacement) to create comparison sets. Random sampling may be less efficient but remains unbiased (Walker et al., 2018). It is less efficient because it does not guarantee maximum contrast between attributes within comparison sets, but it is unbiased because randomization removes, on average, any association between profile evaluation and other variables of interest.
Length considerations for DCEs
Researchers should consider the acceptable testing burden when setting design parameters such as the number of attributes, attribute levels, factorial structure, number of blocks, size of choice sets, number of choice sets, and type of evaluation tasks. Although the issue of maximum length remains controversial (Hess et al., 2012), there is some evidence that error variance and participant attrition increase as the number of comparison sets approaches 20 or more, perhaps due to fatigue (Bech et al., 2011); however, this reduction of power does not imply that parameter estimates will be biased (Louviere, 2004). Error variance may also be inflated in initial DCE tasks within an experiment (Louviere, 2013), suggesting that a training set may be helpful. The influence of DCE length, including the set number and set size, depends on factors including participant motivation, processing ability, and testing modality (Savage and Waldman, 2008). A researcher can empirically assess the effect of fatigue by estimating differences (e.g., in means, variances, or covariances) associated with presentation order. According to a recent meta-analysis on DCEs in the domain of tobacco control, the number of comparison sets ranged from 4 to 24 (M = 10.4, SD = 5.9; Regmi et al., 2018). For more on BIB designs, see Louviere et al. (2015) and Van der Linden et al. (2004).
Measurement scales and DCE tasks
DCEs are designed to elicit evaluations of stimuli or the effect stimuli are perceived to have. Conceptually, by evaluation we mean a person’s ascription of a quality to the object being evaluated. Decisions about the task and instrumentation can influence results enormously (Reynolds, 2020). Researchers should decide which message quality or perceived message effect they would like to address with their DCE, and this becomes the evaluative criterion given to participants. Lauren’s example study focuses on evaluations of trustworthiness—how much a person would trust another based on facial appearance. Lauren could as easily implement another evaluative criterion, such as attractiveness, friendliness, or similarity. In fact, DCE protocols can include multiple evaluations of the same comparison sets (e.g., trustworthiness and attractiveness). Pretesting is advisable to ensure that the evaluation task is clear, distinct, and within participants’ ability to perform.
One of the most prevalent DCE evaluation tasks relies on comparative judgments within each comparison set. Known as “best-worst” scaling, this method asks subjects to identify (a) the stimulus that best exemplifies the evaluative criterion, and (b) the one that worst exemplifies the evaluative criterion (Marley and Louviere, 2005). A best-worst task is less cognitively demanding than ranking every stimulus within a set, although it implies a full ranking when comparison sets contain only 3 stimuli. To collapse best-worst choices into a single indicator, Louviere et al. (2015) describe a method of recoding the data as 1 (best), −1 (worst), or 0 [not selected; for examples of best-worst scaling, see Najafzadeh et al. (2012) and Wright et al. (2017)]. Figure 5 displays an example of best-worst scaling applied to Lauren’s facial-feature study. Best-worst scaling is most often used with comparison sets of size 3 or 4. Best-worst scaling does have important limitations. For example, as an ordinal scale, it does not indicate the cardinal value of the evaluations provided; it will be unclear whether the option selected as “best” is considered good or bad. In addition, best-worst scaling may not capture the magnitude of differences between stimuli. For example, in a forced choice, similar stimuli will be given a rank that may reflect only a small difference.
Researchers have developed several ways to address these limitations of best-worst evaluations. For example, evaluation tasks can include a “no difference” option alongside stimuli, or researchers may add the question as a follow-up to every evaluation task. This inclusion informs researchers about whether participants truly differentiated the stimuli within a given comparison set. Comparison sets where “no difference” is indicated can be excluded from analysis, or models can be compared with and without these data. If excluding data, a researcher may want to determine whether any variables of interest are associated with the “no difference” selection. Empirical evidence shows that DCEs and best-worst scaling in DCEs can provide accurate estimates of the relative impact of stimulus attributes on individual evaluations, such as consumer preferences (Louviere et al., 2015; Salampessy et al., 2015). DCE’s can include multiple evaluative tasks simultaneously to achieve the most robust findings. For example, Lauren might ask which profiles seem more or less trustworthy than the average person, or simply elicit quantitative evaluations (e.g., ratings) from which rankings can be inferred.
DCE data and analysis
DCEs can estimate the relative effect of each stimulus attribute on stimulus evaluations. They can also account for other variables such as individual participant-level differences, other between- or within-subject experimental conditions, or other stimulus characteristics (including additional evaluations elicited concurrently). Raw data may resemble those displayed in Table 6, that were simulated to resemble Lauren’s facial feature experiment. The data represent the responses of one participant across all comparison sets. Numbers in the two right-most columns indicate which of the 16 stimuli was selected as appearing most and least trustworthy for each comparison set.
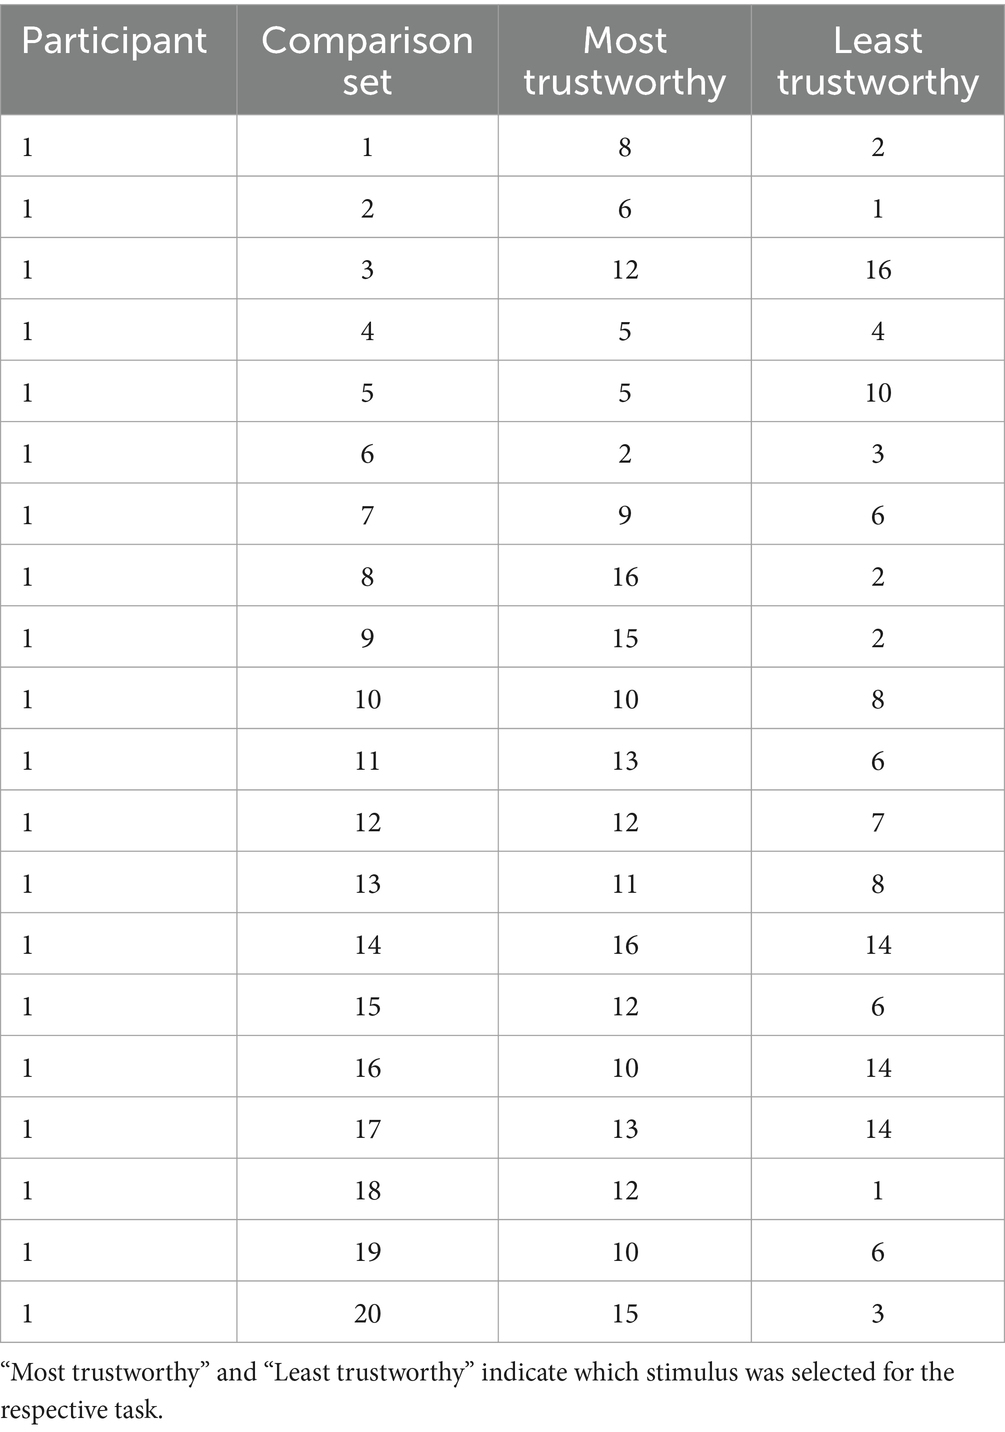
Table 6. Example raw data for DCE with best-worst evaluative task.
For analysis, this raw data can be combined with those from Tables 3, 4 and restructured to enable the appropriate regression model. In particular, the attribute-level indicators should be included. A long-format data structure can be created with stimulus-presentations as the unit of analysis, expanding the number of observations. A stimulus presentation is the unique instance that each stimulus was presented to a particular person. In Lauren’s study (per Table 4), each stimulus is presented five times per subject. Therefore, the long-form data should have a number of cases equal to the number of stimuli times the number of presentations for each stimulus times the number of raters. Table 7 displays example data for Lauren’s facial feature study, showing rows from the first five comparison sets for the first participant. The BWS column is a best-worst-score described by Louviere et al. (2015) that (in this case) combines the most-trustworthy and least-trustworthy items into a single variable. The most and least choices can be analyzed in separate models, which allows estimation of asymmetry between choosing vs. rejecting (Krucien et al., 2019; Shafir, 1993). Some attributes may have a bigger impact on being rated worst (least) relative to being rated best (most). There may be cases where best-choice and worst-choice models indicate effects of opposite direction for the same attribute. For example, attributes that generate ambivalent responses from individuals, or polarizing evaluations across subpopulations may be more likely to be rated best and worst.
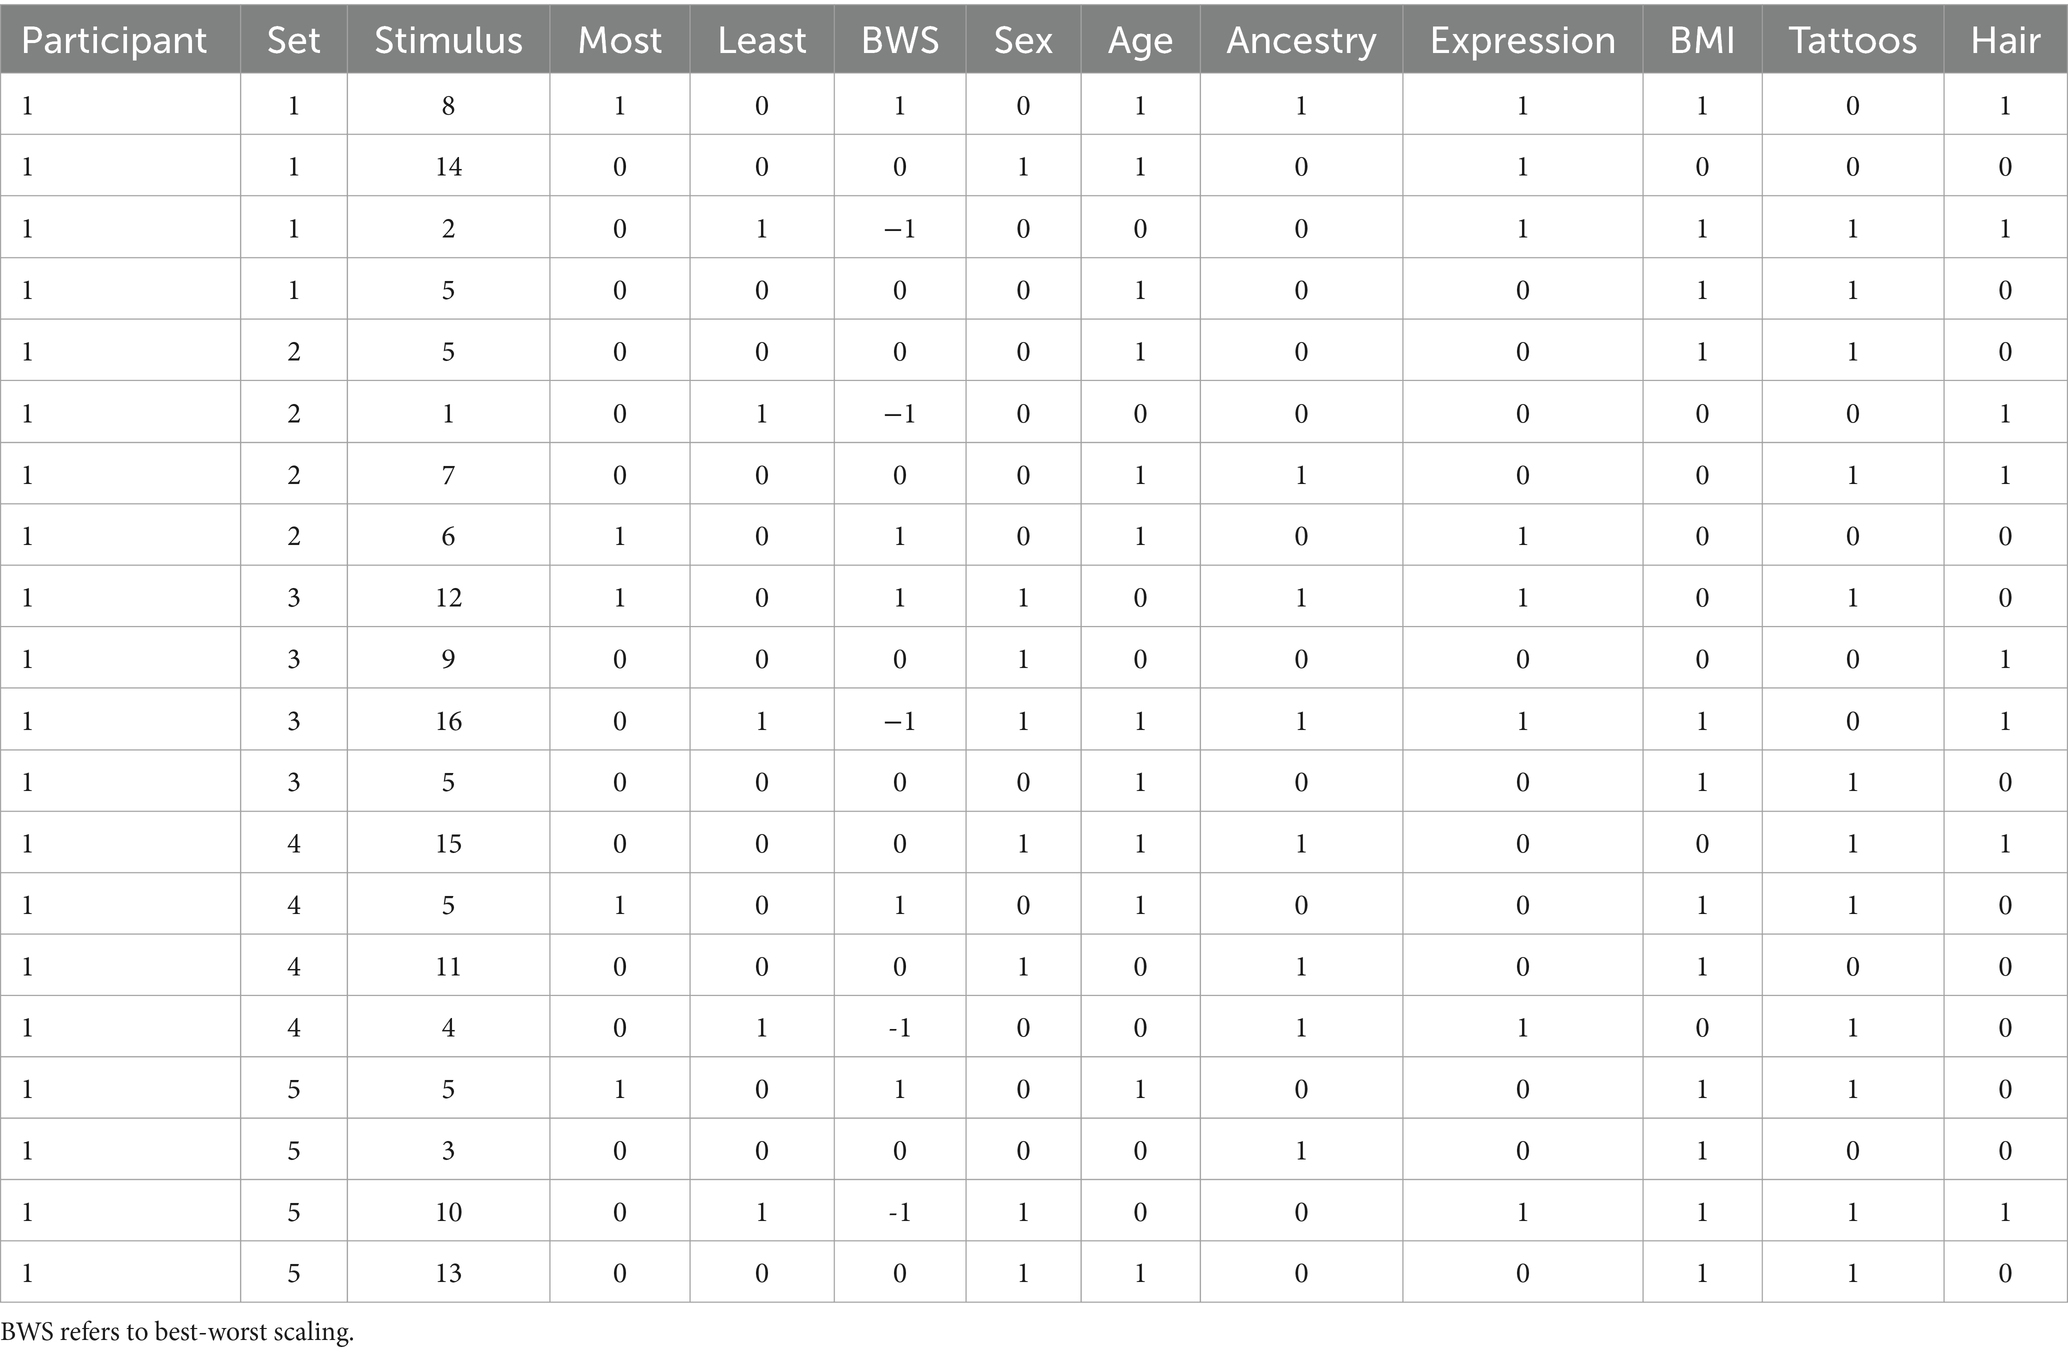
Table 7. Example long-form data for DCE with best-worst evaluative task.
With the data structured this way, several analytic techniques are available, depending on the research questions and viability of model assumptions. A simple approach could use one of the dichotomous outcome variables (Most or Least) and estimate a variety of logistic regression models (Long and Freese, 2006; Sadique et al., 2013). This approach overcomes some limitations of the linear probability model applied to a dichotomous outcome, such as out-of-bounds predictions and heteroscedasticity (but see Hellevik, 2009).
As usual with DCEs, the data here are clustered in several respects; this means that rows do not represent independent observations. For example, within a choice set presentation, the likelihood of selecting a stimulus depends on the likelihood of selecting the alternatives. Also, evaluations made by the same participant are likely to have similar characteristics, relative to evaluations from others. In addition, design elements may cause clustering due to effects of blocks, presentation order, etc. (Louviere et al., 2008). Clustering causes additional variance in evaluations that may be of interest or may be considered a nuisance (Cameron and Miller, 2015; Galbraith et al., 2010; McNeish and Kelley, 2019). Analysis of DCE data should account for clustered data where applicable, as failing to do so may bias parameter estimates and produce inaccurate standard errors. Several approaches are available, each with advantages and disadvantages (Galbraith et al., 2010). Specifically, researchers may aggregate observations within clusters to generate non-clustered data. Researchers may also estimate fixed-effect models to statistically adjust for variables responsible for the clustering (Huang, 2016). Another approach is to estimate a mixed-effect models. A mixed-effect model includes random-effect components that allow parameter estimates—such as means or regression coefficients—to vary across clusters (Hole and Kolstad, 2012; Hossain et al., 2018; Sándor and Wedel, 2002). Mixed-effect models can quantify how much variability exists between and within clusters, for example, how much message features influence people in different ways.
Multiple tools are available to analyze clustered DCE data. For example, Stata’s CM module and its cmmixlogit command can perform the analysis to include both fixed and random effects. Selecting the appropriate model also can be empirically guided. For example, using likelihood-ratio tests, one can compare the fit of competing models (e.g., Lewis et al., 2011; Norris et al., 2006), such as fixed vs. random effects models. Here, overfitting is a concern (Lever et al., 2016), and in general simpler models are preferable unless their fit is substantially worse, or they are theoretically infeasible.
Regardless of the specific model used, researchers should be mindful of the multiple factors that influence evaluations. These commonly include variance associated with differences between comparison sets (and the different alternatives) and differences between participants (for discussion of additional sources of variance, see Hess and Rose, 2012). Accounting for these factors enables more accurate estimates of the general effect of each attribute. Both wide and long-form data permit several types of co-predictors. For example, the researchers can model the effect of participant-level characteristics such as age, sex, extraversion, and so forth, including interactions between such characteristics and stimulus attributes (e.g., Kim and Park, 2017; King et al., 2007). The models can include additional evaluations, for example, ratings of the profile’s attractiveness as a correlate of trustworthiness. Models can also include other experimental factors such as distractor conditions.
As with typical regression models, interaction terms can be added to estimate non-additive effects; however, as discussed earlier, fractional factorial designs compromise the ability to test all possible interactions between attribute categories. Attribute-by-attribute interactions must be pre-specified and be reflected in the design if a FFD is used. In Lauren’s study, she might test what stimulus attributes promote or diminish perceptions of trustworthiness, what groups of participants are more sensitive to a given cue, and what situations are more or less likely to bias trustworthiness attributions (e.g., after priming or persuasive messages). Recent scholarship has also developed frameworks for modelling single individuals from repeated-measures DCEs, including person-specific cue-sensitivity, variability, as well as latent cluster analysis (Louviere, 2013; Frischknecht et al., 2014). Data can also be expanded into a so-called “exploded” form (Chapman and Staelin, 1982; Lancsar et al., 2017), generated by inferring new observations from the choices actually observed, relying on the Independence of Irrelevant Alternatives (IIA) assumption (see Buckell et al., 2018; Herne, 1997).
While the long-form data give the researcher flexibility, the data can be aggregated for more basic analysis. For example, Louviere et al. (2015) discusses one method of averaging across raters. After this transformation the data have a number of rows equal to the number of total stimulus-presentations across all stimuli. In this formulation, a conditional logit model can be used to estimate the impact of attributes on the aggregated choices. One limitation of this approach is the inability to estimate effects resulting from participant-level variables. Ultimately, researchers should decide what assumptions are reasonable for their design, and what techniques are most applicable to their research goals. Many assumptions can be empirically tested with model diagnostics.
Effect sizes for DCEs
Effect sizes convey the magnitude of association among variables and can be estimated in numerous ways (Ferguson, 2016). As presented below in our simulated data analysis, some DCE effects can be represented as differences in means or proportions, bivariate association, or regression coefficients. A researcher should consider their research objectives when choosing effect size statistics. Some effect size metrics lead to substantively different interpretations (McGrath and Meyer, 2006), while others are simply linear transformations that are more or less familiar to different audiences. Importantly, effect sizes will depend on each variable’s designated levels and observed variance, as well as model specification. For our simulated DCE, the effect of hair length is a contrast between long and short within the context of the study, and not a universal effect of hair length.
Regression coeffects are most common in DCE analysis, but can be easily mis-interpreted. They estimate independent effects, adjusting for other stimulus-level and participant-level variables. Odds ratios (ORs) have been among the most commonly reported effect sizes in DCEs (de Bekker-Grob et al., 2012) because of the limitations of OLS for categorical or ordinal outcomes (but see Hellevik, 2009). ORs are a standard output of statistical software and represent the change in odds of an outcome associated with per-unit changes or category comparisons in the predictor variable (for formulas, see Schechtman, 2002). Odds ratios can be difficult to compare, however, because their values neither linearly nor monotonically convey strength of association. In addition, as a type of unstandardized, unnormalized coefficient, odds ratios are influenced by the scale of variable increments as well as variance. Several normalization procedures are available for DCE coefficients that can help gauge and compare effect sizes (Gonzalez, 2019; Lancsar et al., 2007). One approach represents effect sizes as the impact relative to other model predictors, for example, as a pairwise ratio, or as a proportion of the model’s overall predictive power. Regardless of the approach, scale-normalization or standardization are critical for comparing coefficients within a study.
Power analysis for DCEs
Power analysis can estimate the likelihood that a design will detect an effect of a given size, or determine what design is necessary to achieve a particular power. Failing to consider the power of a DCE may lead to uninformative results. Recently, de Bekker-Grob et al. (2012) conducted a review of power analysis practices for DCEs. As they discuss, when determining sample size for DCEs, key inputs are (1) desired significance level, (2) desired power, (3) intended statistical model to be used (e.g., multinomial logit, rank-order logit), (4) anticipated effect sizes, and (5) design characteristics including the number of parameters to be estimated, the number of stimuli per comparison set, and the number of comparison sets to be used. de Bekker-Grob et al. (2012) include R code that calculates the sample size needed from the parameters listed above. In addition, they provide simplified but commonly-used formula to roughly estimate a minimum number of subjects needed for DCEs. They provide the formula as N > 500c / (t · a), where t is the number of comparison sets assigned to each participant, a is the number of alternative within each set, and c is the product of the number of levels for the two largest factors (de Bekker-Grob et al., 2012).
Example DCE analysis
Data were simulated to illustrate results that might be obtained from Lauren’s DCE on personal attributes and perceived trustworthiness. In this case, long-form non-exploded data were used due to their analytic flexibility and to reduce sensitivity to violations of the IIA assumption. Initially, descriptive statistics were calculated to show the proportion of selections rated most and least trustworthy for each level of the seven factors (see Table 8). Expected proportions (chance-level) are 0.25 because participants selected one stimulus out of four for each task. Results show some factors deviate from chance-level proportions. Regression analysis will examine these associations in more detail.
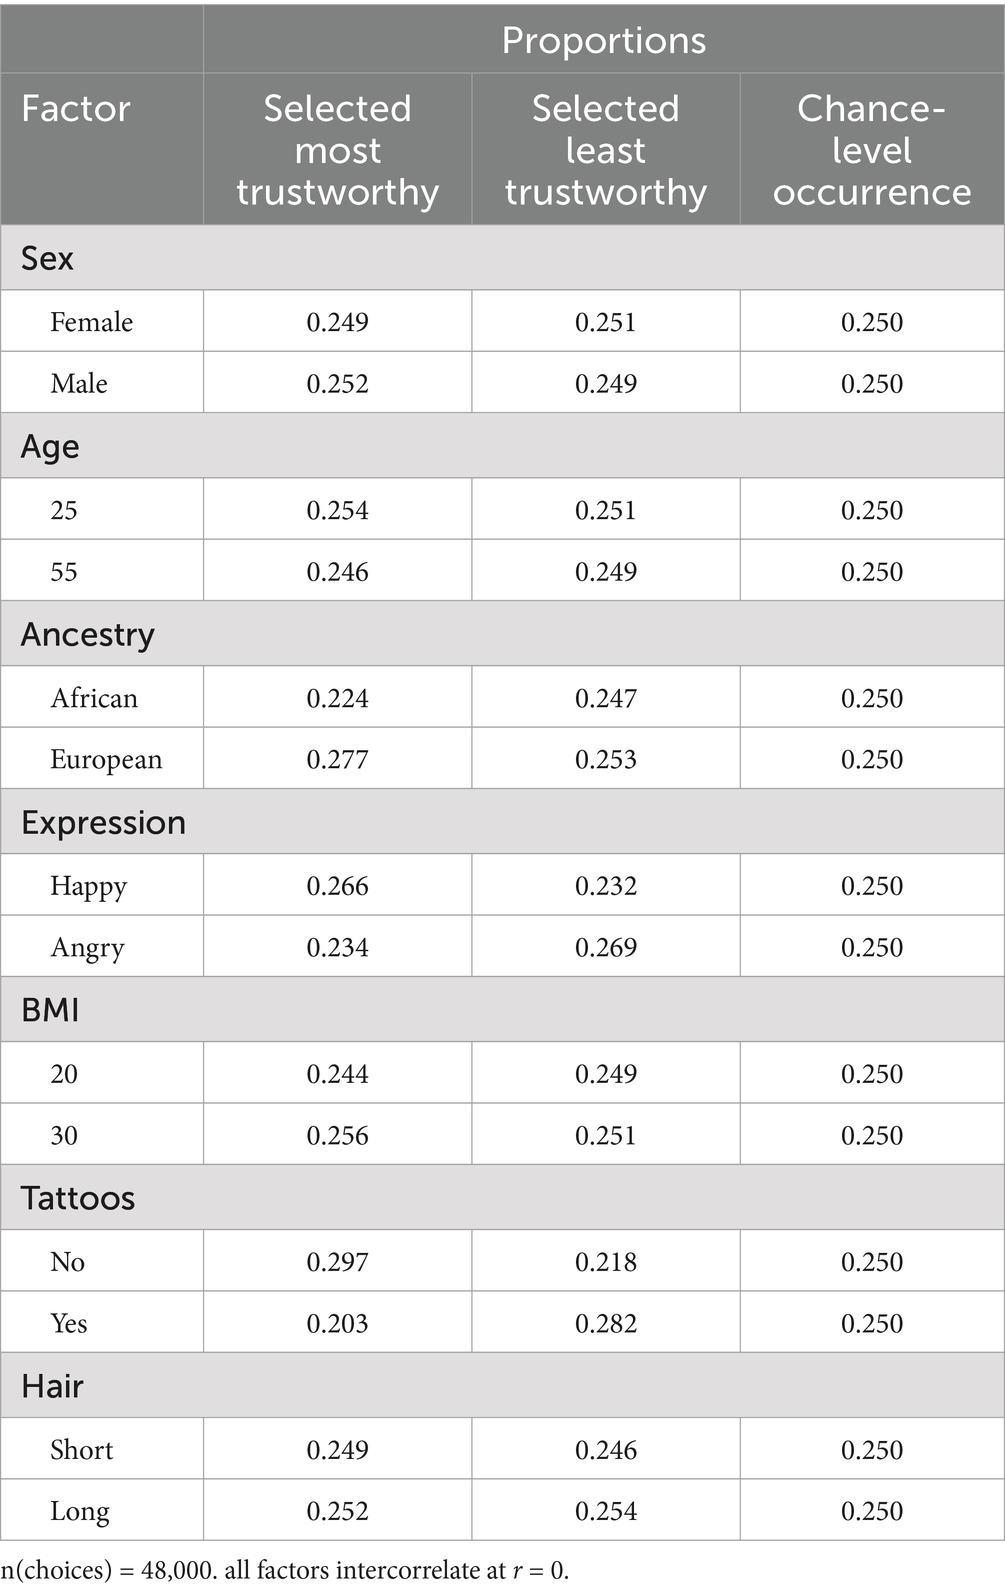
Table 8. Proportion of selections by condition.
Using the simulated data, mixed-effect logistic regression was conducted with the best (most) and worst (least) as dependent variables in separate models. This tests the symmetry between coefficients of best and worst models, an assumption of combining best and worst choices into a single scale. As displayed in Table 9, each attribute (F1-F7) was entered as a fixed-effect predictor, along with indicators for the fixed-effect of each comparison set and the left-to-right position of each stimulus within each comparison set. Although fixed-effect models can account for clustered data structures (Huang, 2016), this becomes less feasible with larger numbers of clusters. Here, for example, choices are clustered within participants, but including a fixed effect would require 600 participant-indicator variables, a computationally demanding process that also reduces the ratio of observations per parameter estimate to unacceptable levels (see Vittinghoff and McCulloch, 2007). For illustration, participants were specified as a random factor with random intercepts. In addition, cluster-robust standard errors were calculated to adjust for clustering within participants and because the participant is presumed to be the basic sampling unit in this example.
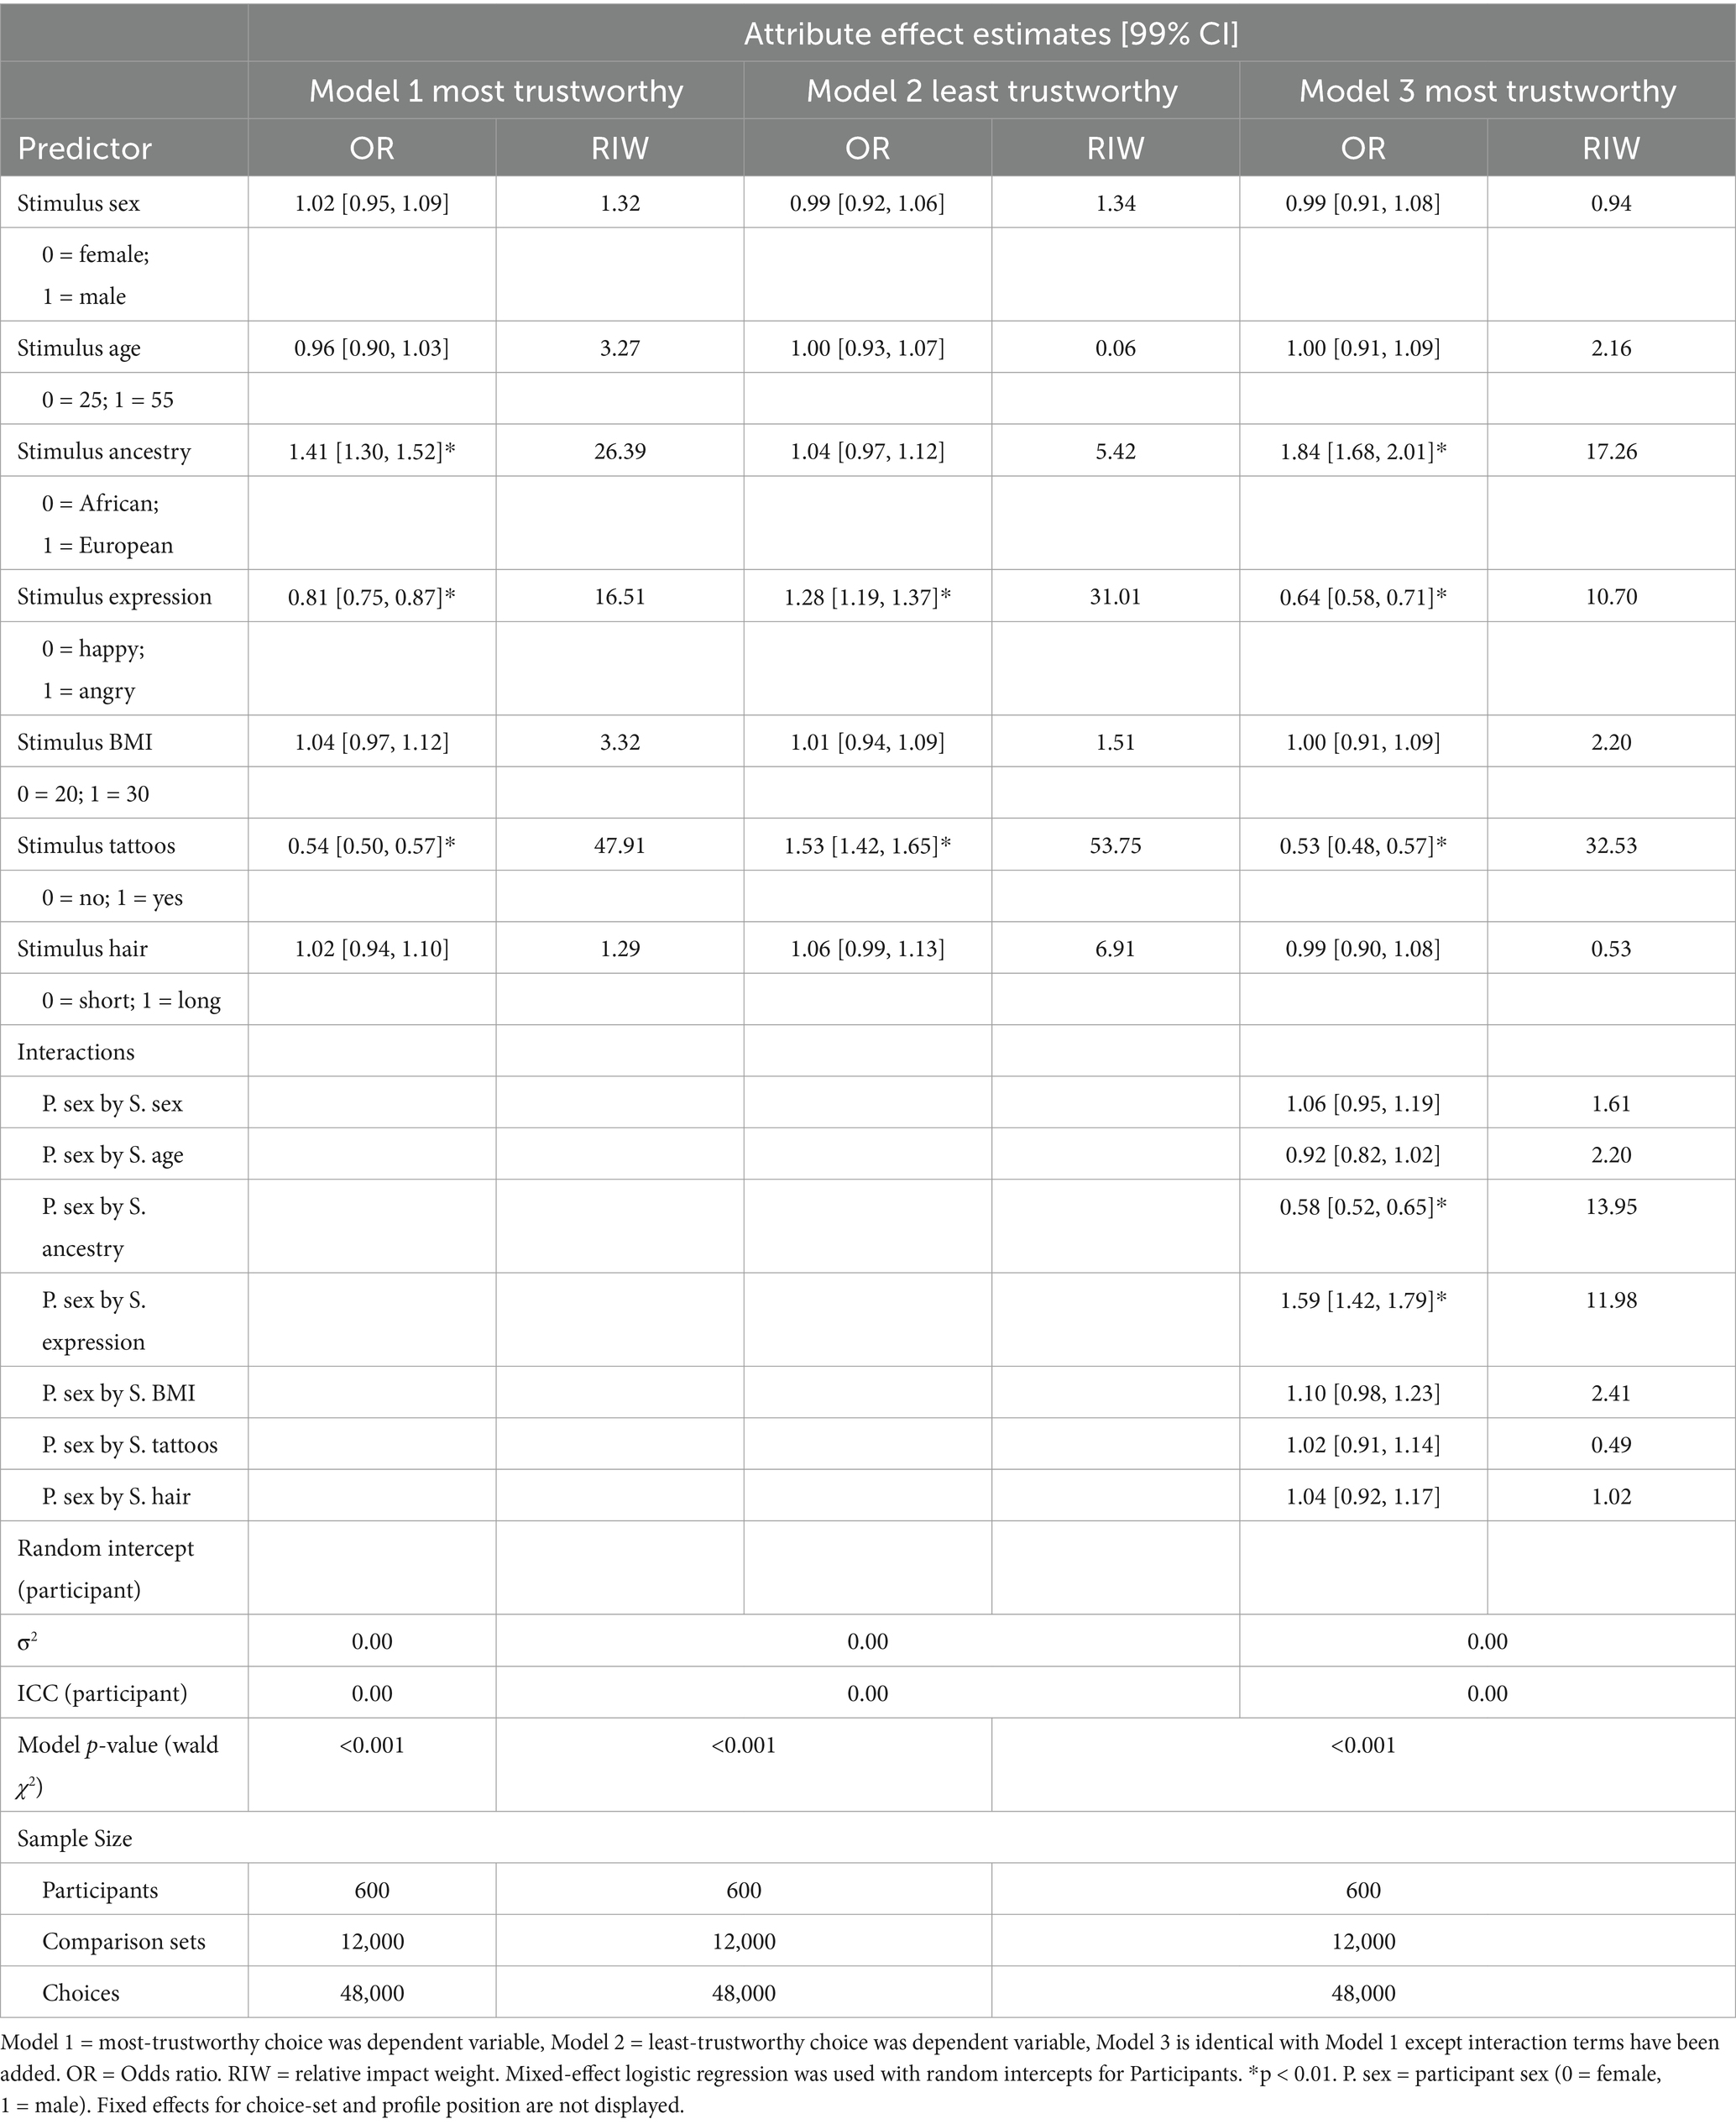
Table 9. Predictors of perceived trustworthiness.
Results of the simulated data in Table 9 show the overall model is significant. Coefficients are reported two ways. First, odds ratios (OR) represent the model-adjusted independent effect of each predictor on the odds of a stimulus being selected relative to not being selected (see Schechtman, 2002). For ORs, coefficients from 1 to ∞ indicate greater likelihood, and coefficients from 1 to 0 indicate reduced likelihood. Second, relative impact weights (RIW) quantify the magnitude of effect, normalizing the scaling factor of each variable, expressed as a percentage of the other predictors displayed (Gonzalez, 2019).
Results of the simulated data show that several stimulus attributes were associated with stimulus evaluations. In addition, results indicate asymmetry between most and least models. Specifically, in the most-trustworthy model, European ancestry (versus African) was associated with a 1.41 times increased likelihood of being evaluated as most trustworthy (relative to not being selected), p < 0.001. This result would be consistent with the presence of racial stereotypes that influence interpersonal perception. If results were symmetrical between most and least models, European ancestry would be associated with a reduced likelihood of being selected least trustworthy, however, there was no effect in the least-trustworthy model. A Brant test (Liu, 2009) formally tested the hypothesis of symmetry between all coefficients, indicating significant asymmetry, χ2(7) = 44.7, p < 0.001. If desired, variables can be omitted to test asymmetry for specific coefficients. As a result, in this case most and least choices should not be combined (see Krucien et al., 2019). The moderating effect of DCE tasks (e.g., most vs. least choices) may be of interest, potentially indicating framing effects, ambivalence, or heterogenous effects across sub-populations. Here, we have focused on the most-trustworthy model; in general, positively valenced choices generally show less error variance (Krucien et al., 2019).
Model 1 also shows a significant effect of emotional expression and tattoos; angry expressions were associated with a 0.81 reduction in odds of being evaluated as most trustworthy, relative to happy expressions, adjusting for other stimulus attributes, p < 0.001. Similarly, tattoos were associated with 0.54 times decreased odds of being evaluated as most trustworthy, p > 0.001.
Model 3 shows a significant interaction between participant sex and emotion within the stimulus, OR = 1.59, p < 0.001. That pattern of results indicates that, compared to male participants, female participants were significantly less likely to evaluate a profile as most trustworthy when they expressed anger, controlling for other stimulus attributes. Participant sex also moderated the effect of stimulus ancestry on trustworthiness, OR = 0.58, such that women were significantly more likely than men to rate people as most trustworthy if they are European. These kinds of results could indicate differences in stereotypes across different populations.4 In all models, the effect of tattoos was the strongest, indicated by its relatively high RIW.
Note that the coefficient for participant sex is not displayed. In strictly comparative discrete choice models, participant-level direct effects are not meaningful without respect to the attributes of the stimuli being evaluated. In addition, Table 9 shows zero variance in intercepts between participants for the random effect. This is ensured by the design, as the comparative task involved the same number of sets and selections for all individuals. An alternative level of measurement, such as quantitative rating scales would allow variance in intercepts between participants; it would also enable direct effects of participant characteristics to be estimated, rather than only interactions between stimulus attributes and participant characteristics.
As a reminder, the design in this example has a resolution 3 fractional factorial structure meaning it cannot estimate interactions between stimulus attributes. It may be, for example, that attributes like tattoos and expression have non-additive effects. As discussed previously, estimating these would require a higher resolution design (resolution 4 or higher, or a full factorial design).
Distributions of individual-level coefficients can also be estimated. Here, the correlation between each two-level factor and each selection (most—not most) was estimated for each participant (Rodgers and Nicewander, 1988). As a participant-level variable, the correlation magnitude can then be correlated with other variable or treated as an outcome. Table 10 shows such output, including confidence intervals, and differences in correlations between men and women. Importantly, when treating the participant as the unit of analysis, using one observation per participant is generally appropriate, or adjusting standard errors to avoid inflating Type 1 error. In total, the simulated results illustrate how DCEs can reveal factors contributing to interpersonal perceptions of trustworthiness. This approach can be leveraged for other kinds of message effects or message selection studies.
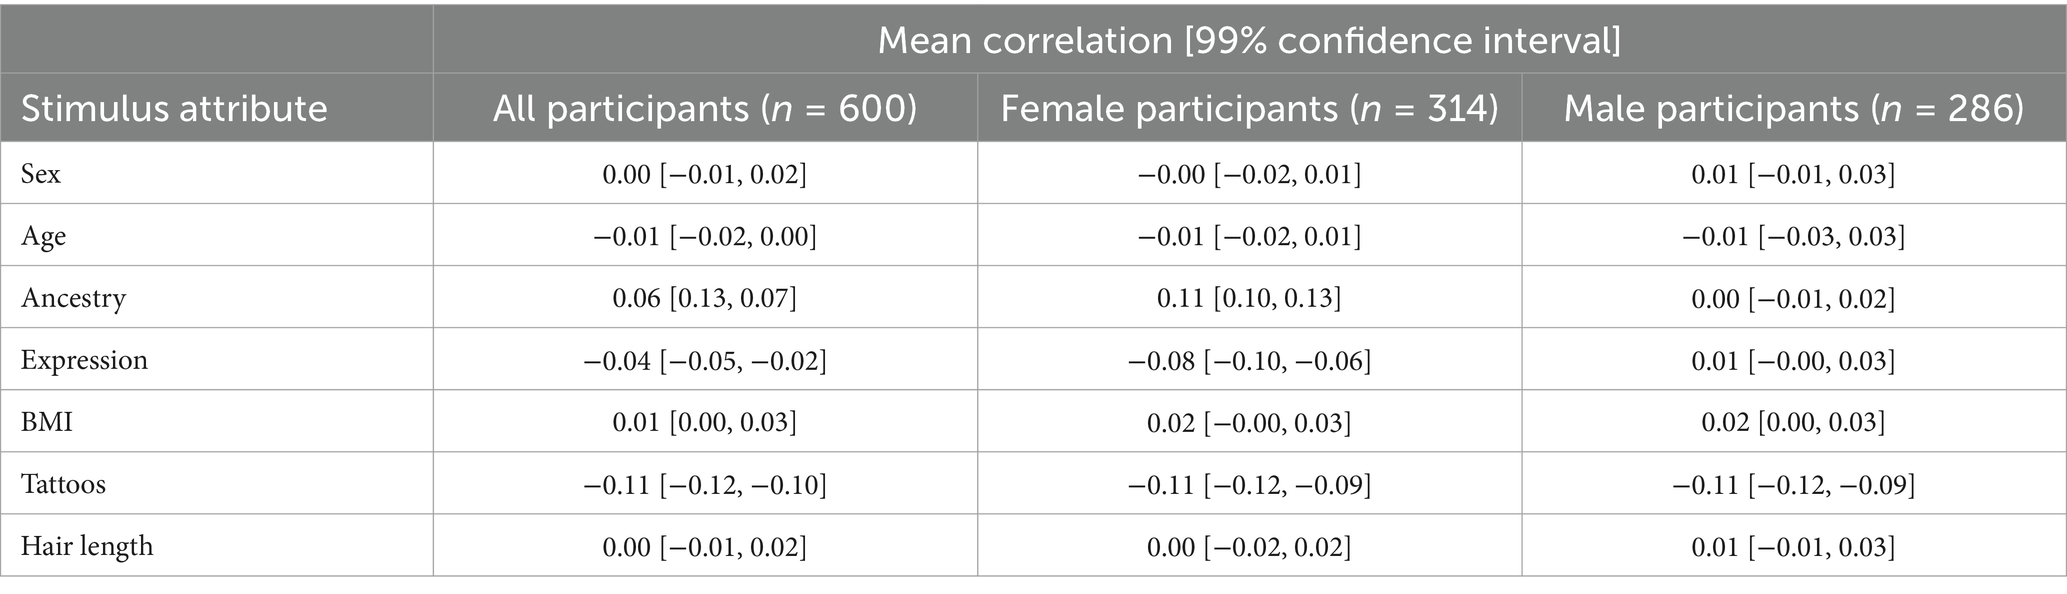
Table 10. Correlations between stimulus attributes and most-trustworthy selections by participant sex.
Limitations of DCEs
The limitations of DCEs inform their suitability for a given research context. First, because they can accommodate designs with many experimental conditions, DCEs may be time consuming or expensive to implement. DCE designs also entail more complexity than conventional designs, although this obstacle can be minimized with freely available software and experience. In addition, DCEs are not equally suitable for all types of stimuli. For example, DCEs may induce high cognitive burden when messages are difficult, complex, or require a long processing times (Bryan and Dolan, 2004). In such cases, participants may have less ability to successfully compare stimuli within sets, or may fatigue quickly after a few sets (but see the above discussion on fatigue effects). DCE researchers can compensate by selecting designs with fewer stimuli within sets and fewer sets overall.
Because they emphasize comparisons between groups of stimuli, DCEs are not suitable for assessing all types of message effects. This is likely true where the intended effect requires a single message exposure without contrasting content, or highly immersive long-form audio-visual material. Additional research is needed to test the boundaries of DCE’s applicability to various kinds of message-effects research. As discussed above, the comparative tasks of typical DCEs provide estimates of the relative impact of message attributes rather than the absolute evaluation of messages. The relative impact of attributes may be most helpful to target factors for use in subsequent research or content generation. This limitation can be removed by including other measures within or alongside a DCE design.
Conclusion
DCEs have become a mainstay in several fields and have been used to predict critical real-world outcomes as well as to test theory. However, communication scholars have yet to take full advantage of their potential. As we have demonstrated in this article, DCE’s are highly applicable to studies on the effects of message attributes across a wide range of domains and modalities. Efficiency is perhaps their main benefit, as DCEs can disentangle the influence of many attributes with modest sample sizes and reasonably short experimental sessions. The benefits of DCEs accrue as a result of multiple design elements, including the use of stimulus sets to elicit direct comparisons, blocked or fractional factorial structures, and the breadth of analytic frameworks available. Though sophisticated, the tools necessary to implement a DCE are freely available, and this article provides resources to communication researchers who examine large numbers of factors at once and who seek to implement DCEs themselves.
Data availability statement
The original contributions presented in the study are included in the article/Supplementary material, further inquiries can be directed to the corresponding author.
Author contributions
RR: Conceptualization, Data curation, Formal analysis, Methodology, Software, Writing – original draft, Writing – review & editing. LP: Writing – review & editing. BY: Writing – review & editing. JL: Methodology, Writing – review & editing. JT: Writing – review & editing.
Funding
The author(s) declare that financial support was received for the research, authorship, and/or publication of this article. This research was supported by the National Cancer Institute of the National Institutes of Health and the Food and Drug Administration Centre for Tobacco Products (R01CA239308). The content is solely the responsibility of the authors and does not necessarily represent the official views of the National Institutes of Health or the Food and Drug Administration.
Conflict of interest
The authors declare that the research was conducted in the absence of any commercial or financial relationships that could be construed as a potential conflict of interest.
Publisher’s note
All claims expressed in this article are solely those of the authors and do not necessarily represent those of their affiliated organizations, or those of the publisher, the editors and the reviewers. Any product that may be evaluated in this article, or claim that may be made by its manufacturer, is not guaranteed or endorsed by the publisher.
Supplementary material
The Supplementary material for this article can be found online at: https://www.frontiersin.org/articles/10.3389/fcomm.2025.1385422/full#supplementary-material
Footnotes
1. ^The method does not rule out simultaneously estimating effects of participant characteristics or other factors. In other words, DCEs can synergize with conventional survey and experimental paradigms.
2. ^Although multiple methods may be used in a single experiment.
3. ^As Walker et al. (2018) show, the most substantial way to increase design efficiency is by excluding “dominant” or “dominated” stimuli. In economic contexts these can be clearly identified as some attribute levels are universally preferred over others (e.g., lower prices). There is less universality in communication contexts, however, and so pruning stimuli from the design space a priori may be inadvisable.
4. ^But note that these data were simulated using random parameters and variable labels for illustration.
References
Bansback, N., Brazier, J., Tsuchiya, A., and Anis, A. (2012). Using a discrete choice experiment to estimate health state utility values. J. Health Econ. 31, 306–318. doi: 10.1016/j.jhealeco.2011.11.004
Bech, M., Kjaer, T., and Lauridsen, J. (2011). Does the number of choice sets matter? Results from a web survey applying a discrete choice experiment. Health Econ. 20, 273–286. doi: 10.1002/hec.1587
Bente, G., Novotny, E., Roth, D., and Al-Issa, A. (2020). Beyond stereotypes: analyzing gender and cultural differences in nonverbal rapport. Front. Psychol. 11:599703. doi: 10.3389/fpsyg.2020.599703
Box, G. E., and Hunter, J. S. (1961). The 2 k—p fractional factorial designs. Technometrics 3, 311–351. doi: 10.1080/00401706.1961.10489951
Bryan, S., and Dolan, P. (2004). Discrete choice experiments in health economics. Eur. J. Health Econ. 5, 199–202. doi: 10.1007/s10198-004-0241-6
Buckell, J., Marti, J., and Sindelar, J. L. (2018). Should flavours be banned in cigarettes and e-cigarettes? Evidence on adult smokers and recent quitters from a discrete choice experiment. Tob. Control. 8, 168–175. doi: 10.1136/tobaccocontrol-2017-054165
Cameron, A. C., and Miller, D. L. (2015). A practitioner’s guide to cluster-robust inference. J. Hum. Resour. 50, 317–372. doi: 10.3368/jhr.50.2.317
Carpenter, C. J. (2013). A meta-analysis of the effectiveness of the “but you are free” compliance-gaining technique. Commun. Stud. 64, 6–17. doi: 10.1080/10510974.2012.727941
Carson, R. T., Eagle, T. C., Islam, T., and Louviere, J. J. (2022). Volumetric choice experiments (VCEs). J. Choice Model. 42:100343. doi: 10.1016/j.jocm.2022.100343
Carson, R. T., and Louviere, J. J. (2011). A common nomenclature for stated preference elicitation approaches. Environ. Resour. Econ. 49, 539–559. doi: 10.1007/s10640-010-9450-x
Carson, R. T., Louviere, J. J., Anderson, D. A., Arabie, P., Bunch, D. S., Hensher, D. A., et al. (1994). Experimental analysis of choice. Mark. Lett. 5, 351–367. doi: 10.1007/BF00999210
Caussade, S., de Dios Ortúzar, J., Rizzi, L. I., and Hensher, D. A. (2005). Assessing the influence of design dimensions on stated choice experiment estimates. Transp. Res. B Methodol. 39, 621–640. doi: 10.1016/j.trb.2004.07.006
Chapman, R. G., and Staelin, R. (1982). Exploiting rank ordered choice set data within the stochastic utility model. J. Mark. Res. 19, 288–301. doi: 10.2307/3151563
Cheung, K. L., Wijnen, B. F., Hollin, I. L., Janssen, E. M., Bridges, J. F., Evers, S. M., et al. (2016). Using best–worst scaling to investigate preferences in health care. PharmacoEconomics 34, 1195–1209. doi: 10.1007/s40273-016-0429-5
Cleland, J., Porteous, T., and Skåtun, D. (2018). What can discrete choice experiments do for you? Med. Educ. 52, 1113–1124. doi: 10.1111/medu.13657
Coast, J., Salisbury, C., De Berker, D., Noble, A., Horrocks, S., Peters, T. J., et al. (2006). Preferences for aspects of a dermatology consultation. Br. J. Dermatol. 155, 387–392. doi: 10.1111/j.1365-2133.2006.07328.x
Cunningham, C. E., Walker, J. R., Eastwood, J. D., Westra, H., Rimas, H., Chen, Y., et al. (2014). Modeling mental health information preferences during the early adult years: a discrete choice conjoint experiment. J. Health Commun. 19, 413–440. doi: 10.1080/10810730.2013.811324
Das, A., Horsley, D., and Singh, R. (2018). Pseudo generalized Youden designs. J. Comb. Des. 26, 439–454. doi: 10.1002/jcd.21594
de Bekker-Grob, E. W., Ryan, M., and Gerard, K. (2012). Discrete choice experiments in health economics: a review of the literature. Health Econ. 21, 145–172. doi: 10.1002/hec.1697
DeShazo, J. R., and Fermo, G. (2002). Designing choice sets for stated preference methods: the effects of complexity on choice consistency. J. Environ. Econ. Manag. 44, 123–143. doi: 10.1006/jeem.2001.1199
Eggers, F., Sattler, H., Teichert, T., and Völckner, F. (2021). “Choice-based conjoint analysis” in Handbook of market research. eds. C. Homburg, et al. (Cham: Springer International Publishing), 781–819.
Ferguson, C. J. (2016). “An effect size primer: a guide for clinicians and researchers” in Methodological issues and strategies in clinical research (4th ed.). ed. A. E. Kazdin . 4th ed (Washington, DC: American Psychological Association), 301–310.
Folkvord, F., Peschke, L., Gümüş Ağca, Y., van Houten, K., Stazi, G., Roca-Umbert, A., et al. (2022). Preferences in the intention to download a COVID tracing app: a discrete choice experiment study in the Netherlands and Turkey. Front. Commun. 7:900066. doi: 10.3389/fcomm.2022.900066
Friedel, J. E., Foreman, A. M., and Wirth, O. (2022). An introduction to “discrete choice experiments” for behavior analysts. Behav. Process. 198:104628. doi: 10.1016/j.beproc.2022.104628
Frischknecht, B. D., Eckert, C., Geweke, J., and Louviere, J. J. (2014). A simple method for estimating preference parameters for individuals. Int. J. Res. Mark. 31, 35–48. doi: 10.1016/j.ijresmar.2013.07.005
Galbraith, S., Daniel, J. A., and Vissel, B. (2010). A study of clustered data and approaches to its analysis. J. Neurosci. 30, 10601–10608. doi: 10.1523/JNEUROSCI.0362-10.2010
Gerasimou, G. (2010). Consumer theory with bounded rational preferences. J. Math. Econ. 46, 708–714. doi: 10.1016/j.jmateco.2010.08.015
Gonzalez, J. M. (2019). A guide to measuring and interpreting attribute importance. Patient Patient Center. Outcomes Res. 12, 287–295. doi: 10.1007/s40271-019-00360-3
Grömping, U. (2018). R package DoE.Base for factorial experiments. J. Stat. Softw. 85, 1–41. doi: 10.18637/jss.v085.i05
Gullberg, M., and Holmqvist, K. (1999). Keeping an eye on gestures: visual perception of gestures in face-to-face communication. Pragm. Cogn. 7, 35–63. doi: 10.1075/pc.7.1.04gul
Hawkins, G. E., Marley, A. A. J., Heathcote, A., Flynn, T. N., Louviere, J. J., and Brown, S. D. (2014). Integrating cognitive process and descriptive models of attitudes and preferences. Cogn. Sci. 38, 701–735. doi: 10.1111/cogs.12094
Hellevik, O. (2009). Linear versus logistic regression when the dependent variable is a dichotomy. Qual. Quant. 43, 59–74. doi: 10.1007/s11135-007-9077-3
Herne, K. (1997). Decoy alternatives in policy choices: asymmetric domination and compromise effects. Eur. J. Polit. Econ. 13, 575–589. doi: 10.1016/S0176-2680(97)00020-7
Hess, S., Daly, A., and Batley, R. (2018). Revisiting consistency with random utility maximisation: theory and implications for practical work. Theor. Decis. 84, 181–204. doi: 10.1007/s11238-017-9651-7
Hess, S., Hensher, D. A., and Daly, A. (2012). Not bored yet—revisiting respondent fatigue in stated choice experiments. Transp. Res. A Policy Pract. 46, 626–644. doi: 10.1016/j.tra.2011.11.008
Hess, S., and Rose, J. M. (2012). Can scale and coefficient heterogeneity be separated in random coefficients models? Transportation 39, 1225–1239. doi: 10.1007/s11116-012-9394-9
Hole, A. R., and Kolstad, J. R. (2012). Mixed logit estimation of willingness to pay distributions: a comparison of models in preference and WTP space using data from a health-related choice experiment. Empir. Econ. 42, 445–469. doi: 10.1007/s00181-011-0500-1
Hossain, I., Saqib, N. U., and Haq, M. M. (2018). Scale heterogeneity in discrete choice experiment: an application of generalized mixed logit model in air travel choice. Econ. Lett. 172, 85–88. doi: 10.1016/j.econlet.2018.08.037
Huang, F. L. (2016). Alternatives to multilevel modeling for the analysis of clustered data. J. Exp. Educ. 84, 175–196. doi: 10.1080/00220973.2014.952397
Ianovici, C., Purcărea, V. L., Gheorghe, I. R., and Blidaru, A. (2023). The complexity of physician-patient communication and its impact in non-medical fields. A surgical oncology approach. J. Med. Life 16, 631–634. doi: 10.25122/jml-2023-0154
Iyengar, S., and Hahn, K. S. (2009). Red media, blue media: evidence of ideological selectivity in media use. J. Commun. 59, 19–39. doi: 10.1111/j.1460-2466.2008.01402.x
Judd, C. M., Westfall, J., and Kenny, D. A. (2012). Treating stimuli as a random factor in social psychology: a new and comprehensive solution to a pervasive but largely ignored problem. J. Pers. Soc. Psychol. 103, 54–69. doi: 10.1037/a0028347
Keller, P. A., and Lehmann, D. R. (2008). Designing effective health communications: a meta-analysis. J. Public Policy Mark. 27, 117–130. doi: 10.1509/jppm.27.2.117
Kim, D., and Park, B. J. R. (2017). The moderating role of context in the effects of choice attributes on hotel choice: a discrete choice experiment. Tour. Manag. 63, 439–451. doi: 10.1016/j.tourman.2017.07.014
King, M. T., Hall, J., Lancsar, E., Fiebig, D., Hossain, I., Louviere, J., et al. (2007). Patient preferences for managing asthma: results from a discrete choice experiment. Health Econ. 16, 703–717. doi: 10.1002/hec.1193
Krucien, N., Sicsic, J., and Ryan, M. (2019). For better or worse? Investigating the validity of best–worst discrete choice experiments in health. Health Econ. 28, 572–586. doi: 10.1002/hec.3869
Lack, A., Hiligsmann, M., Bloem, P., Tünneßen, M., and Hutubessy, R. (2020). Parent, provider and vaccinee preferences for HPV vaccination: a systematic review of discrete choice experiments. Vaccine 38, 7226–7238. doi: 10.1016/j.vaccine.2020.08.078
Lagarde, M., and Blaauw, D. (2009). A review of the application and contribution of discrete choice experiments to inform human resources policy interventions. Hum. Resour. Health 7, 1–10. doi: 10.1186/1478-4491-7-62
Lancaster, K. J. (1966). A new approach to consumer theory. J. Polit. Econ. 74, 132–157. doi: 10.1086/259131
Lancsar, E., Fiebig, D. G., and Hole, A. R. (2017). Discrete choice experiments: a guide to model specification, estimation and software. PharmacoEconomics 35, 697–716. doi: 10.1007/s40273-017-0506-4
Lancsar, E., and Louviere, J. (2008). Conducting discrete choice experiments to inform healthcare decision making. PharmacoEconomics 26, 661–677. doi: 10.2165/00019053-200826080-00004
Lancsar, E., Louviere, J., and Flynn, T. (2007). Several methods to investigate relative attribute impact in stated preference experiments. Soc. Sci. Med. 64, 1738–1753. doi: 10.1016/j.socscimed.2006.12.007
Lang, A., and Yegiyan, N. S. (2008). Understanding the interactive effects of emotional appeal and claim strength in health messages. J. Broadcast. Electron. Media 52, 432–447. doi: 10.1080/08838150802205629
Lever, J., Krzywinski, M., and Altman, N. (2016). Points of significance: model selection and overfitting. Nat. Methods 13, 703–704. doi: 10.1038/nmeth.3968
Lewis, F., Butler, A., and Gilbert, L. (2011). A unified approach to model selection using the likelihood ratio test. Methods Ecol. Evol. 2, 155–162. doi: 10.1111/j.2041-210X.2010.00063.x
Liu, X. (2009). Ordinal regression analysis: fitting the proportional odds model using Stata, SAS and SPSS. J. Mod. Appl. Stat. Methods 8, 632–642. doi: 10.22237/jmasm/1257035340
Long, J. S., and Freese, J. (2006). Regression models for categorical dependent variables using Stata, vol. 7. College Station, TX: Stata Press.
Louviere, J. J. (2004). Random utility theory-based stated preference elicitation methods: applications in health economics with special reference to combining sources of preference data. Available at: https://www.semanticscholar.org/paper/Random-Utility-Theory-Based-Stated-Preference-In-To-Louviere/dd68fd6099f062d62fd7e448dcd6af1999e1418f
Louviere, J. J. (2013). “Modeling single individuals: the journey from psych lab to the app store” in Choice Modelling. eds. S. Hess and S. Daly (Surrey, UK: Edward Elgar Publishing), 1–47.
Louviere, J. J., Flynn, T. N., and Carson, R. T. (2010). Discrete choice experiments are not conjoint analysis. J. Choice Model. 3, 57–72. doi: 10.1016/S1755-5345(13)70014-9
Louviere, J. J., Flynn, T. N., and Marley, A. A. J. (2015). Best-worst scaling: theory, methods and applications. Cambridge, UK: Cambridge University Press.
Louviere, J. J., Hensher, D. A., Swait, J. D., and Adamowicz, W. (2000). Stated choice methods: Analysis and applications : Cambridge University Press.
Louviere, J. J., Street, D., Burgess, L., Wasi, N., Islam, T., and Marley, A. A. (2008). Modeling the choices of individual decision-makers by combining efficient choice experiment designs with extra preference information. J. Choice Model. 1, 128–164. doi: 10.1016/S1755-5345(13)70025-3
Louviere, J. J., and Woodworth, G. (1983). Design and analysis of simulated consumer choice or allocation experiments: an approach based on aggregate data. J. Mark. Res. 20, 350–367. doi: 10.1177/002224378302000403
Marley, A. A., and Louviere, J. J. (2005). Some probabilistic models of best, worst, and best–worst choices. J. Math. Psychol. 49, 464–480. doi: 10.1016/j.jmp.2005.05.003
Mas-Colell, A., Whinston, M. D., and Green, J. R. (1995). Microeconomic theory, vol. 1. New York, NY: Oxford University Press.
McFadden, D. L. (1974). “Conditional logit analysis of qualitative choice behavior” in Frontiers in econometrics. ed. P. Zarembka (New York, NY: Academic Press), 105–142.
McGrath, R. E., and Meyer, G. J. (2006). When effect sizes disagree: the case of r and d. Psychol. Methods 11, 386–401. doi: 10.1037/1082-989X.11.4.386
McNeish, D., and Kelley, K. (2019). Fixed effects models versus mixed effects models for clustered data: reviewing the approaches, disentangling the differences, and making recommendations. Psychol. Methods 24, 20–35. doi: 10.1037/met0000182
Memon, M. A., Cheah, J. H., Ramayah, T., Ting, H., Chuah, F., and Cham, T. H. (2019). Moderation analysis: issues and guidelines. J. Appl. Struct. Equat. Model. 3, i–xi. doi: 10.47263/JASEM.3(1)01
Messing, S., and Westwood, S. J. (2014). Selective exposure in the age of social media: endorsements trump partisan source affiliation when selecting news online. Commun. Res. 41, 1042–1063. doi: 10.1177/0093650212466406
Midjourney, (2024). Version 6 [generative artificial intelligence model]. Available at: https://www.midjourney.com
Moslehi, S., Tavan, A., Narimani, S., Ahmadi, F., Kazemzadeh, M., and Sedri, N. (2024). Predisposing factors of using cosmetics in Iranian female students: application of prototype willingness model. Front. Psychol. 15:1381747. doi: 10.3389/fpsyg.2024.1381747
Mühlbacher, A., and Johnson, F. R. (2016). Choice experiments to quantify preferences for health and healthcare: state of the practice. Appl. Health Econ. Health Policy 14, 253–266. doi: 10.1007/s40258-016-0232-7
Najafzadeh, M., Lynd, L. D., Davis, J. C., Bryan, S., Anis, A., Marra, M., et al. (2012). Barriers to integrating personalized medicine into clinical practice: a best–worst scaling choice experiment. Genet. Med. 14, 520–526. doi: 10.1038/gim.2011.26
Nisbett, R. E., and Wilson, T. D. (1977). Telling more than we can know: verbal reports on mental processes. Psychol. Rev. 84, 231–259. doi: 10.1037/0033-295X.84.3.231
Norris, C. M., Ghali, W. A., Saunders, L. D., Brant, R., Galbraith, D., Faris, P., et al. (2006). Ordinal regression model and the linear regression model were superior to the logistic regression models. J. Clin. Epidemiol. 59, 448–456. doi: 10.1016/j.jclinepi.2005.09.007
Ntansah, C. A., Popova, L., Hardin, J. W., Kim, M., Sterling, K. L., Reynolds, R. M., et al. (2025). Assessing the impact of messages about reduced nicotine cigar products among people who use little cigar and cigarillo: Insights from a discrete choice experiment. Nicotine and Tobacco Research, 12. doi: 10.1093/ntr/ntaf012
Poertner, M. (2020). The organizational voter: support for new parties in young democracies. Am. J. Polit. Sci. 65, 634–651. doi: 10.1111/ajps.12546
Quaife, M., Terris-Prestholt, F., Di Tanna, G. L., and Vickerman, P. (2018). How well do discrete choice experiments predict health choices? A systematic review and meta-analysis of external validity. Eur. J. Health Econ. 19, 1053–1066. doi: 10.1007/s10198-018-0954-6
Reeves, B., Yeykelis, L., and Cummings, J. J. (2016). The use of media in media psychology. Media Psychol. 19, 49–71. doi: 10.1080/15213269.2015.1030083
Regmi, K., Kaphle, D., Timilsina, S., and Tuha, N. A. A. (2018). Application of discrete-choice experiment methods in tobacco control: a systematic review. Pharmacoecon Open 2, 5–17. doi: 10.1007/s41669-017-0025-4
Reynolds, R. M. (2020). Factor analysis: Exploratory and confirmatory. Int. Encyclop. Media Psychol.. eds. J. V. D. Bulck, D. R. Ewoldsen, M. L. Mares, and E. Scharrer (Hoboken, NJ: John Wiley & Sons). 1–9.
Reynolds, R. M., Novotny, E., Lee, J., Roth, D., and Bente, G. (2019). Ambiguous bodies: the role of displayed arousal in emotion [mis] perception. J. Nonverbal Behav. 43, 529–548. doi: 10.1007/s10919-019-00312-3
Reynolds, R. M., Popova, L., Ashley, D. L., Henderson, K. C., Ntansah, C. A., Yang, B., et al. (2022). Messaging about very low nicotine cigarettes (VLNCs) to influence policy attitudes, harm perceptions and smoking motivations: A discrete choice experiment. Tob. Control. 33, 325–332. doi: 10.1136/tobaccocontrol-2022-057577
Rink, D. R. (1987). An improved preference data collection method: balanced incomplete block designs. J. Acad. Mark. Sci. 15, 54–61. doi: 10.1007/BF02721954
Rodgers, J., and Nicewander, W. A. (1988). Thirteen ways to look at the correlation coefficient. Am. Stat. 42, 59–66. doi: 10.2307/2685263
Rubin, G., Bate, A., George, A., Shackley, P., and Hall, N. (2006). Preferences for access to the GP: A discrete choice experiment. Br. J. Gen. Pract. 56, 743–748.
Sadique, M. Z., Devlin, N., Edmunds, W. J., and Parkin, D. (2013). The effect of perceived risks on the demand for vaccination: results from a discrete choice experiment. PLoS One 8:e54149. doi: 10.1371/journal.pone.0054149
Salampessy, B. H., Veldwijk, J., Schuit, A. J., Van Den Brekel-dijkstra, K., Neslo, R. E., De Wit, G. A., et al. (2015). The predictive value of discrete choice experiments in public health: an exploratory application. Patient Patient Cent. Outc. Res. 8, 521–529. doi: 10.1007/s40271-015-0115-2
Salloum, R. G., Louviere, J. J., Getz, K. R., Islam, F., Anshari, D., Cho, Y., et al. (2018). Evaluation of strategies to communicate harmful and potentially harmful constituent (HPHC) information through cigarette package inserts: a discrete choice experiment. Tob. Control. 27, 677–683. doi: 10.1136/tobaccocontrol-2016-053579
Sándor, Z., and Wedel, M. (2002). Profile construction in experimental choice designs for mixed logit models. Mark. Sci. 21, 455–475. doi: 10.1287/mksc.21.4.455.131
Savage, S. J., and Waldman, D. M. (2008). Learning and fatigue during choice experiments: a comparison of online and mail survey modes. J. Appl. Econ. 23, 351–371. doi: 10.1002/jae.984
Schechtman, E. (2002). Odds ratio, relative risk, absolute risk reduction, and the number needed to treat—which of these should we use? Value Health 5, 431–436. doi: 10.1046/J.1524-4733.2002.55150.x
Shafir, E. (1993). Choosing versus rejecting: why some options are both better and worse than others. Mem. Cogn. 21, 546–556. doi: 10.3758/BF03197186
Shang, C., Huang, J., Chaloupka, F. J., and Emery, S. L. (2018). The impact of flavour, device type and warning messages on youth preferences for electronic nicotine delivery systems: evidence from an online discrete choice experiment. Tob. Control, 27, e152–e159. doi: 10.1136/tobaccocontrol-2017-053754
Sherry, J. L. (2015). The complexity paradigm for studying human communication: a summary and integration of two fields. Rev. Commun. Res. 3, 22–65. doi: 10.12840/issn.2255-4165.2015.03.01.007
Soekhai, V., de Bekker-Grob, E. W., Ellis, A. R., and Vass, C. M. (2019). Discrete choice experiments in health economics: past, present and future. PharmacoEconomics 37, 201–226. doi: 10.1007/s40273-018-0734-2
Soekhai, V., Donkers, B., Levitan, B., and de Bekker-Grob, E. W. (2021). Case 2 best-worst scaling: for good or for bad but not for both. J. Choice Model. 41:100325. doi: 10.1016/j.jocm.2021.100325
Thrasher, J. F., Anshari, D., Lambert-Jessup, V., Islam, F., Mead, E., Popova, L., et al. (2018a). Assessing smoking cessation messages with a discrete choice experiment. Tob. Regul. Sci. 4, 73–87. doi: 10.18001/TRS.4.2.7
Thrasher, J. F., Islam, F., Davis, R. E., Popova, L., Lambert, V., Cho, Y. J., et al. (2018b). Testing cessation messages for cigarette package inserts: findings from a best/worst discrete choice experiment. Int. J. Environ. Res. Public Health 15:282. doi: 10.3390/ijerph15020282
Thurstone, L. L. (1927). The method of paired comparisons for social values. J. Abnorm. Soc. Psychol. 21, 384–400. doi: 10.1037/h0065439
Tünneßen, M., Hiligsmann, M., Stock, S., and Vennedey, V. (2020). Patients’ preferences for the treatment of anxiety and depressive disorders: a systematic review of discrete choice experiments. J. Med. Econ. 23, 546–556. doi: 10.1080/13696998.2020.1725022
Turk, D., Boeri, M., Abraham, L., Atkinson, J., Bushmakin, A., Cappelleri, J., et al. (2020). Patient preferences for osteoarthritis pain and chronic low back pain treatments in the United States: a discrete-choice experiment. Osteoarthr. Cartil. 28, 1202–1213. doi: 10.1016/j.joca.2020.06.006
Van der Linden, W. J., Veldkamp, B. P., and Carlson, J. E. (2004). Optimizing balanced incomplete block designs for educational assessments. Appl. Psychol. Meas. 28, 317–331. doi: 10.1177/0146621604264870
Visch, V. T., Goudbeek, M. B., and Mortillaro, M. (2014). Robust anger: Recognition of deteriorated dynamic bodily emotion expressions. Cogn. Emot. 28, 936–946. doi: 10.1080/02699931.2013.865595
Vittinghoff, E., and McCulloch, C. E. (2007). Relaxing the rule of ten events per variable in logistic and cox regression. Am. J. Epidemiol. 165, 710–718. doi: 10.1093/aje/kwk052
Walker, J. L., Wang, Y., Thorhauge, M., and Ben-Akiva, M. (2018). D-efficient or deficient? A robustness analysis of stated choice experimental designs. Theor. Decis. 84, 215–238. doi: 10.1007/s11238-017-9647-3
Webb, E. J., Meads, D., Lynch, Y., Judge, S., Randall, N., Goldbart, J., et al. (2021). Attribute selection for a discrete choice experiment incorporating a best-worst scaling survey. Value in Health, 24, 575–584. doi: 10.1016/j.jval.2020.10.025
Keywords: discrete choice experiments, balanced incomplete block designs, fractional factorial designs, message evaluation tasks, conjoint analysis (CA)
Citation: Reynolds RM, Popova L, Yang B, Louviere J and Thrasher JF (2025) Discrete choice experiments: a primer for the communication researcher. Front. Commun. 10:1385422. doi: 10.3389/fcomm.2025.1385422
Edited by:
Anne Foreman, Centers for Disease Control and Prevention (CDC), United StatesReviewed by:
Lucy Simmonds, Flinders University, AustraliaLutz Peschke, Bilkent University, Türkiye
Copyright © 2025 Reynolds, Popova, Yang, Louviere and Thrasher. This is an open-access article distributed under the terms of the Creative Commons Attribution License (CC BY). The use, distribution or reproduction in other forums is permitted, provided the original author(s) and the copyright owner(s) are credited and that the original publication in this journal is cited, in accordance with accepted academic practice. No use, distribution or reproduction is permitted which does not comply with these terms.
*Correspondence: Reed M. Reynolds, cmVlZC5yZXlub2xkc0B1bWIuZWR1