- School of Language, Culture and Society, University of Leeds, Leeds, United Kingdom
Communication assessment in interpreting has developed into an area with new models and continues to receive growing attention in recent years. The process refers to the assessment of messages composed of both “verbal” and “nonverbal” signals. A few relevant studies revolving around automatic scoring investigated the assessment of fluency based on objective temporal measures, and the correlation between the machine translation metrics and human scores. There is no research exploring machine-learning-based automatic scoring in-depth integrating parameters of delivery and information. What remains fundamentally challenging to demonstrate is which parameters, extracted through an automatic methodology, predict more reliable results. This study presents an original study with the aim to propose and test a machine learning approach to automatically assess communication in English/Chinese interpreting. It proposes to build predictive models using machine learning algorithms, extracting parameters for delivery, and applying a translation quality estimation model for information assessment to describe the final model. It employs the K-nearest neighbour algorithm and support vector machine for further analysis. It is found that the best machine-learning model built with all features by Support Vector Machine shows an accuracy of 62.96%, which is better than the K-nearest neighbour model with an accuracy of 55.56%. The assessment results of the pass level can be accurately predicted, which indicates that the machine learning models are able to screen the interpretations that pass the exam. The study is the first to build supervised machine learning models integrating both delivery and fidelity features to predict quality of interpreting. The machine learning models point to the great potential of automatic scoring with little human evaluation involved in the process. Automatic assessment of communication is expected to complete multi-tasks within a brief period by taking both holistic and analytical approaches to assess accuracy, fidelity and delivery. The proposed automatic scoring system might facilitate human-machine collaboration in the future. It can generate instant feedback for students by evaluating input renditions or abridge the workload for educators in interpreting education by screening performance for subsequent human scoring.
1. Introduction
When the phenomenon of interpreting is modeled in a broader sense of socio-institutional dimension, it can be viewed as a communicative activity and performed by human beings in a particular situation of interaction. Scholars have referred to interpreting activities in the process of communication as a signal process (Shannon, 1949). In this early communication model, the message “encoded” from the source speech is transmitted to interpreters as receivers for “decoding” in interpreting. However, as Stenzl (1989) pointed out, “We need a reorientation of perhaps more accurately a widening of our research framework so that rather than the predominantly psychological perspective we adopt a more functional approach that considers interpretation in the context of the entire communication process from speaker through the interpreter to the receiver”. We have been paying too little attention to those who have been proposing such an approach for years, Kirchhoff, for example (Stenzl, 1989, p. 24). The concept of interpreting as a language process of “encoding” and “decoding” was further developed by Kirchhoff (1976) in his dual system of communication, who perceived interpreting activities as a multi-channel phenomenon. In the system, both verbal and non-verbal information is included for transmitting in a given situation or socio-cultural background. Interpreters would decode the information encoded by a primary sender and transmit the decoded information to the primary receiver. While Kirchhoff's model is also situated within the field of social semiotics with verbal and non-verbal signals as two channels, a more sophisticated matrix model provided by Poyatos (2002) represents sign-conveying verbal and non-verbal systems with visual and/or acoustic copresence. According to Poyatos (2002), the matrix cross-tabulating systems cover simultaneous and consecutive interpreting with audible part that involves verbal language, paralanguage, qusiparalinguistic sounds emitted through audible kinesics and silence, and visible one comprises of stills, kinesics, and visual chemical and dermal systems such as tear (Poyatos, 2002).
Assessment of communication of interpreting is a complex and overarching theme that relates to many topics such as fidelity or source-target correspondence in interpreting quality, non-verbal information such as fluency and good pace, articulation and pronunciation, ability to engage with the audience, and kinesics, communicative effect and role performance, etc. In Bühler's (1986) of AIIC members using a list of sixteen criteria to assess the quality of interpreting and interpreters, sense consistency with the original message is the top-ranking criterion of quality. It is widely acknowledged that the actually rendered message should be faithful to the originally intended message. Scholars in interpreting studies often refer to fidelity (Gile, 1995) or sense consistency (Bühler, 1986) or information with a more concrete focus on information processing (Gile, 1992; Marrone, 1993). In the remainder of this article, we use the term “fidelity” to refer to the equivalence concept. Meanwhile, interpreters should “re-express the original speaker's ideas and the manner of expressing them as accurately as possible and without omission (Harris, 1990, p. 118).” The concept of accuracy is also evident in Moser (1996) and Seleskovitch (1978), who call for accuracy with the implication of completeness. Fluency of delivery has been rated one of the top-ranking criteria of quality in Bühler's (1986) survey. Other than fluency of delivery, articulation and pronunciation and ability to engage with the audience should be listed as the criterion to assess delivery in interpreting.
When it comes to the automatic assessment of communication of interpreting, what remains fundamentally difficult to operate is which parameters, extracted through an automated methodology, can be used to build a machine learning model to predict more reliable results. Based on the existing work, the coverage in this study is therefore limited to the measurement and judgement of communication in interpreting with parameters in fidelity and paraverbal information. Against this background, we conduct the current research to build a machine-learning model for the automatic assessment of communication in interpreting with fidelity and delivery parameters and investigate the predictive ability of such model.
2. Literature review
2.1. Computational features for delivery assessment
Computation features for delivery assessment require automatic extraction of features for fluency, articulation and pronunciation. Engagement with the audience must rely on manual annotation, but it should be able to be extracted with neuro networks in the near future for academic purposes. In terms of delivery, linguistic and paralinguistic elements such as truncated or mispronounced words, and filled and unfilled pauses have been transcribed to allow researchers to conduct research with disfluencies in European Parliament Interpretation Corpus or Directionality in Simultaneous Interpreting Corpus (DIRIS). However, the paralinguistic information is extracted semi-manually. For example, EPICG is compiled to the format of EXMARaLDA (Schmidt and Wörner, 2009) with its audios time-aligned with discourses and their interpretations.
Wang and Wang (2022b) have examined whether low confidence measures (CM) can indicate unintelligibility in interpretations by fitting manually labeled words as clear or unclear and confidence measures from forty-nine interpretations into a binary logistic regression model. They use the Receiver Operation Characteristic (ROC) curve of K-fold cross-validation to estimate the model's performance. CM is a score computed between zero and one assigned to each word and individual sentence to indicate how likely speeches are correctly recognized. They can be extracted from Jason format transcript files provided by Speech-to-text Service via API. The result shows that CM can be used to annotate articulation and pronunciation in interpreting, and the words whose CM is lower than the cut-off point of 0.321 are identified as unclear. Wang and Wang's (2022a) findings make it possible to automatically extract information about articulation and pronunciation and apply them to building a machine-learning model for the assessment of communication in interpreting.
In recent years several empirical studies have begun to identify temporal measures for automatic assessment of fluency by applying statistical models in testing the predictability of objective fluency in modeling judged fluency in interpreting. Yu and Van Heuven's (2017) study found strong correlations between judged fluency and objective fluency variables. They suggest that effective speech rate (number of syllables, excluding disfluencies, divided by the total duration of speech production and pauses) can be used as a predictor of judged fluency. Other important determinants of judged fluency are the number of filled pauses, articulation rate, and mean length of pause. Han et al. (2020) also modeled the relationship between utterance fluency and raters' perceived fluency of consecutive interpreting. The results show that mean length of unfilled pauses, phonation time ratio, mean length of run and speech rate had fairly strong correlations with perceived fluency ratings in both interpreting directions and across rater types. Yang (2018) adopts a temporal approach to measure fluency, which was divided into three dimensions: speed fluency, breakdown fluency and repair fluency. Speed fluency was investigated by using speaking rate and articulation rate. Breakdown fluency was measured by using phonation/time ratio, mean length of runs, mean length of silent pauses per minute, number of silent pauses per minute and number of filled pauses per minute. Repair fluency was measured using the mean length of repairs per minute. Based on the previous work, Wang and Wang (2022a) identify and vectorise objective utterance measures through descriptive statistical analysis of interpreting data. They also explore the best explanation for the variation of dependent variables with newly defined parameters. The results indicate that the median value should be selected as the threshold for unfilled pauses or articulation rate, and outliers can be extracted as the relatively long and particular unfilled pauses, as well as relatively slow articulation and particularly slow articulation. They suggest number of filled pauses, number of unfilled pauses, number of relatively slow articulation, mean length of unfilled pauses, mean length of filled pauses should be selected to build machine-learning models to predict interpreting fluency in future studies.
2.2. Computational features for fidelity assessment
Computational features for automatic fidelity and accuracy assessment should be extracted during a process wherein little human judgement is directly involved. As the past decades witnessed the rapid development of natural language processing, scholars conducted experiments to explore the automation of fidelity and accuracy assessment through automated machine translation quality estimation (MTQE). MTQE is used to improve machine translation systems and is labor-wise and cost-free to be applied to translation and interpreting quality assessment. According to the results in two strands of research, some of the indices can be applied in translation and interpreting quality assessment, which means they can be extracted as features for building the machine learning model. The two lines of research are (a) assessment based on algorithmic evaluation metrics for MTQE; and (b) assessment based on pre-trained models (i.e., feature-based models or neural networks) for MTQE.
The automatic algorithmic evaluation metrics are developed on the concept that machine translation should be close to human translation. This concept is similar to one of the approaches to assessing interpreting fidelity by checking target language renditions against the source text transcripts. Carroll (1978) is the first linguist to propose to assess fidelity between source and target texts for the evaluation of machine translation. In her study, raters assess the fidelity of the transcript of each original sentence compared to the target sentence to identify what information has not been conveyed rather than focusing on the interpreting product. Therefore, human resources should be available to generate multiple versions of reference to evaluate the output of interpreting using evaluation metrics.
Metrics developed to calculate the evaluation scores include Bilingual Evaluation Understudy (BLEU) (Papineni et al., 2002), National Institute of Standards and Technology (NIST) (Doddington, 2002), Metric for Evaluation of Translation with Explicit Ordering (Banerjee and Lavie, 2005), and Translation Edit Rate (Snover et al., 2006). In general, metrics such as BLEU are based on the modified n-gram precision, which counts how many n-grams of the candidate translation match with the n-grams of the reference translation. Where BLEU simply calculates n-gram precision adding equal weight to each one, NIST also calculates how informative a particular n-gram is, and METEOR uses and emphasizes recall in addition to precision. TER measures the number of actions required to edit a translated segment in line with one of the reference translations.
In recent empirical studies (Chung, 2020; Han and Lu, 2021; Lu and Han, 2022), a few researchers have investigated the utility of several metrics (i.e., BLEU, METEOR, NIST, and TER) in assessing translations or interpretations and correlate the metric scores with the human assigned scores. Chung (2020) computes two metrics (i.e., BLEU and METEOR) to assess 120 German-to-Korean translations produced by ten student translators on 12 German texts concerning a variety of topics. The results of Chung's (2020) study found that metrics scores computed by BLEU (r = 0.849) and METEOR (r = 0.862) are fairly highly correlated with human assessment overall. However, it is found that there is a low correlation between metric scores and human assessment at the individual text level with 28–40% of the correlation coefficients below 0.3. Therefore, Chung (2020) proposes that BLEU and METEOR can only be used to assess students' translation at an overall level.
Han and Lu's (2021) study examines the usefulness of four metrics, BLEU, NIST, METEOR and TER, to assess 33 English-to-Chinese interpretations produced by undergraduate and postgraduate by correlating automated metrics with human-assigned scores. It is found that METEOR scores (r = 0.882) computed at the sentence level correlate more closely with human-assigned scores than those at the text level. The metric-human correlation was moderately strong, averaging at r = 0.673 and 0.670 for NIST and BLEU, respectively. Han and Lu's (2021) study differs from Chung (2020) study as their experiment focuses on interpreting, and the best results are shown at the sentence level. Han and Lu's (2021) suggest that results provide preliminary evidence for using certain automated metrics to assess human interpretation.
Recently, Lu and Han (2022) in another study evaluate 56 bidirectional consecutive English–Chinese interpretations produced by 28 student interpreters of varying abilities by the same metrics and one more pre-trained model, Bidirectional Encoder Representations from Transformers (BERT) (Devlin et al., 2019). They correlate the automated metric scores with the scores assigned by different types of raters using different scoring methods (i.e., multiple assessment scenarios). The major finding corroborates their previous study that BLEU, NIST, and METEOR had moderate-to-strong correlations with the human-assigned scores across the assessment scenarios, especially for the English-to-Chinese direction. They provide an initial insight into comparing MT evaluation metrics and neural networks to assess interpreting automatically.
In Lu and Han's (2022) study, neural networks of computing systems are inspired by biological neural networks to perform different tasks with a huge amount of data involved. Different algorithms are used to understand the relationships in a given data set to produce the best results from the changing inputs. The network is trained to produce the desired outputs, and different models are used to predict future results with the data. The nodes are interconnected so that it works like a human brain. Different correlations and hidden patterns in raw data are used to cluster and classify the data. The exploration of neural networks for MTQE coincides with shared tasks from the Conference on Machine Translation. Unlike MT metrics, operationalizing neural networks to assess students' interpretation does not require multiple versions of references since it's an intra-lingua comparison between source and target texts.
Wang and Wang (2022c) report on an empirical study to compare the utility of MT evaluation metrics vis-à-vis neural networks for machine translation quality estimation (MTQE) as two approaches to automatic assessment of information fidelity in English-Chinese consecutive interpreting. The study operationalizes METEOR and BLEU as MT metrics to assess interpretation via inter-lingual comparisons between actual renditions and exemplar target texts based on multiple versions of references. It also uses reference-free neural network models, including Similarity, OpenKiwi and TransQuest, and three deep-learning models trained by the authors to assess the fidelity of English-Chinese consecutive interpreting by making the cross-lingual comparison. The study correlates the automated metric scores computed by two different approaches with human-assigned scores on the sentence level to examine the degree of machine-human parity. The analysis results suggest that the neural network outperforms MT evaluation metrics as a fairly strong metric-human correlation for Similarity (r = 0.54) and a moderate correlation with TransQuest (r = 0.49) have been observed. The study points to the possibility of recruiting pre-trained neural models to assess the information fidelity in interpreting.
As for assessment based on a feature-based pre-trained model, Stewart et al. (2018) predicts simultaneous interpreting performance by building on three models with QuEst++ (Specia et al., 2015). As QuEst++ includes seventeen features such as n-gram frequency, the number of tokens in source/target utterances, and average token length tec, Stewart et al. (2018) augments the model's baseline feature set with four additional types of features to handle interpreting-specific phenomena, including ratio of pauses/hesitations/incomplete words, the ratio of non-specific words, the ratio of “quasi-”cognates, and the ratio of number of words. Results show that the predicted scores of the augmented QuEst++ had statistically significant correlations with the METEOR scores, which perform the other two models in all language pairs.
2.3. Formulation for the assessment of interpreting quality
Although it is difficult to describe the various factors of interpreting quality assessment and their interrelationships theoretically, the evaluation using formulas should be intuitive. According to Cai (2007). Interpretation quality (user expectations or satisfaction) = fidelity × weight ratio + accuracy × weight ratio + delivery × weight ratio + validity of interpreting strategy use. In this formula, the weight ratio varies according to the specific interpretation settings or tasks. In addition, the “validity interpreting strategy use” in the formula does not need to be multiplied by the “weight ratio” because there is any interpretation task would require an effective strategy which accounts for ~20% (Cai, 2007). If renditions are graded by a hundred-mark system, the weight ratio for each parameter should be: Interpretation quality (user expectations or satisfaction) = 50% fidelity + 15% accuracy + 15% delivery + validity of strategy use 20% (Cai, 2007). Cai suggested that the evaluation of interpreting quality should establish corresponding weights and proportion reference values according to different communication backgrounds. However, in automated assessment communication of interpreting, all parameters must be extracted in an automated way that it is impossible to operationalize the validity of strategy use with human labor for annotation. As other parameters can be assessed independently to some extent, the validity of strategy use can only be assessed holistically. The use of strategies and their validity should be inferred based on assessing other parameters, with qualitative analysis required before quantitative statistics.
3. Research questions
Against this background, we conducted the current study to investigate further the automatic assessment of communication of interpreting by a machine-learning model. We designed an experiment in which both fidelity, accuracy and delivery are applied as the parameters and remove the validity of strategy use since it cannot be operationalized in an automated way. Based on the previous literature, the best model to predict the parameters of fidelity and accuracy are neural networks (i.e., similarity and TransQuest) and temporal measures for the delivery parameters. With parameters and scores as data ready, the actual machine learning process starts when we train your model. This training is a cyclic process with the cycles we run through the model, and the predictions can improve. The model's decisions will become more accurate with more training sessions. Once developed and prepared, machine learning algorithms help design and create systems that can automatically interpret data. Finally, we use the patterns in the training data to perform classifications and future predictions. During the process, we examined three questions:
RQ1: To what extent would the scores computed by pre-trained neural models correlate with human-assigned scores for fidelity?
RQ2: To what extent would the delivery parameters correlate with human-assigned scores for delivery?
RQ3: What is the predictive ability of a machine-learning model built with fidelity and delivery parameters?
4. Methodology
4.1. Interpreting recordings
This study selects three recordings English-Chinese consecutive interpreting performed by three interpreting trainees sourced from 48 renditions by 24 trainees in a professional training program. All renditions have been rated by two tutors who are professional interpreters based on a holistic scale form. The discrepancy in rating a trainee's performance between two raters is smaller than three points. In case where the discrepancy is bigger than three, a third-rater adjudication is employed. The choice of these three renditions is made for the normal distribution as one scored the highest, one the lowest and one scored the median. The English source speeches cover topics such as gender inequality in shopping and the gender pay gap, which are the topics trainees find familiar with and loaded with appropriate amount of data and figures.
4.2. Transcription and manual alignment
All video files are first converted into audio files and then transcribed automatically via a speech-recognition service provided IBM by means of Python script. IBM returns more accurate timestamps and reserves filled pauses in interpreted texts to extract prosodic information based on accurate timestamps. The initially transcribed texts are examined manually for more accurate results. To create a parallel dataset for fidelity and accuracy assessment, we use memoQ to manually align sentence pairs to ensure that source and target transcripts corresponded. There are one hundred and three pairs of sentences in total, and ninety-four are suitable for machine learning since nine source transcribed sentences have no correspondence. The most common way to define whether a data set is sufficient is to apply a 10 times rule. This rule means that the amount of input data should be ten times more than the number of parameters in the data set. Therefore, ninety-four sentence pairs is enough to build a machine learning model as there are seven parameters in the study.
4.3. Human raters and scoring
With each sentence aligned, the study recruited two raters to assess the information between each language pair from two aspects: accuracy and fidelity, and delivery. One of the raters has obtained postgraduate-level degrees in interpreting and taught consecutive interpreting full-time in a university in China. Another rater is now a PhD candidate and interpreter who used to be an interpreting tutor for more than 3 years working at a university in China. Their L1 language is Mandarin and L2 language is English. Given their experience in interpreting, teaching and assessing students' performances, they are considered qualified raters in the study. Cohen's Kappa for two raters for Manual sentence alignment is 0.87, for auto alignment is 0.88, indicating perfect agreement. The overall scores are calculated based on the formula proposed by Cai (2007), with fidelity and accuracy accounting for 65/85 and delivery representing 15/85, removing the validity of strategy application.
4.4. Parameters as results of automatic assessment of fidelity
According to Wang and Wang (2022c), neural network outperforms MT evaluation metrics as a fairly strong metric-human correlation for Similarity (Pearson's r = 0.54) and a moderate correlation with TransQuest (r = 0.49) have been observed. Therefore, this study uses the scores computed by Similarity and two models from TransQuest as the parameters for fidelity and delivery to build the machine learning model. Before calculating the evaluation metrics with neural networks, we clean data of language pairs by removing marks (i.e., hesitation marks generated automatically by speech recognition technology). We employed TransQuest (available at https://tharindu.co.uk/TransQuest/) to assess two groups of data by different alignment methods in three steps, respectively. To be more specific, we first Install TransQuest locally using pip. Then the pre-trained quality estimation models for English-Chinese pairs on sentence level are downloaded (available at: https://tharindu.co.uk/TransQuest/models/sentence_level_pretra ined/). The models include two predicting direct assessments (i.e., MonoTransQuest and SiameseTransQuest) and one predicting HTER (i.e., MonoTransQuest). Once the download is completed, we use the three models to compute the data's sentence-level scores of DA and HTER.
To compute similarity scores, we first set up the environment to access the Multilingual Universal Sentence Encoder Module, which is downloaded for sentence embedding (available at: https://tfhub.dev/google/universal-sentence-encoder-multilingual-large/3). We employ the module to precompute the embeddings of the parallel sentences in the dataset, which are used to compute Cosine Similarity between source text and renditions.
4.5. Parameter as delivery features
As the previous study (Wang and Wang, 2022a) identifies and vectorizes objective utterance measures through descriptive statistical analysis of interpreting data, the study uses number of pauses (NUP) number of filled pauses (NFP), number of relatively long unfilled pauses (NRLUP), number of relative slow articulation (NRSR), number of particularly long unfilled pauses (UPLUP) for fluency and average of confidence measure (ACM) and number of extremely unclear words (NEUW) and number of relatively unclear words (NRUW) for articulation and pronunciation.
Fluency parameters are calculated based on the timestamps in the transcripts by IBM Waston service. The number of unfilled pauses is defined as the number of unfilled pauses equal to and longer than 0.25 s, excluding the first pause at the very beginning of interpreting. The number of relatively long unfilled pauses refers to the number of unfilled pauses duration larger than Q3 +1.5 * IQR1 and smaller than and equal to Q3 + 3 * IQR. The number of relative slow articulation is the number of the duration per syllable larger than Q3 +1.5 * IQR and smaller than and equal to Q3 + 3 * IQR, the number of particularly long unfilled pauses is the number of unfilled pauses duration larger than Q3 + 3 * IQR. The number of extremely unclear words is the number of unclear words pronounced by the participants whose confidence measure smaller than Q3 + 3 * IQR. The number of relatively unclear words refers to the number of unclear words pronounced by the participants whose confidence measure larger than Q3 +1.5 * IQR and smaller than and equal to Q3 + 3 * IQR.
4.6. Experiment design
The final scores have been evenly distributed into five levels of performance (very good: 100–80, good: 79–60, pass: 59–40, poor: 39–20, very poor: 19–0) since machine learning aims at classification rather than to obtain the absolute score as human score. The five-group classification is also implemented to make up for the minor inconsistency among different raters or even within the same rater.
This study uses a support vector machine (SVM) in supervised machine learning to randomly select seventy per cent of the training data as the sample multiple times and the rest as prediction data to establish the machine-learning model. SVM, one of the best machine learning algorithms, is applied to many pattern classification problems. It is used in this study as it is suitable for machine learning with a small number of data and being able to optimize parameters during the experiment to achieve the best prediction. Among the many packages of SVM algorithms, the free libsvm toolkit developed by Taiwan Zhiren Lin implements simple and quick operations by providing kernels such as linear, polynomial, radial basis function and sigmoid. As the toolkit provides probability values for prediction, weights in classification patterns and cross-validation and a more accurate interface for SVM through visualization and parameter tuning, the study uses the E1071 package for dynamic random data training to perform SVM in R language. The study also uses KNN algorithm to store all the available data and classify a new data point based on the Similarity. With new scores appearing, it can be easily classified into a well-suited category using the K- NN algorithm. First, the data is randomized by applying the random seed in the R language. Next, seventy per cent of the data is selected as training data and thirty per cent as the test data after two thousand times of randomization. The model is then built with the delivery and information features.
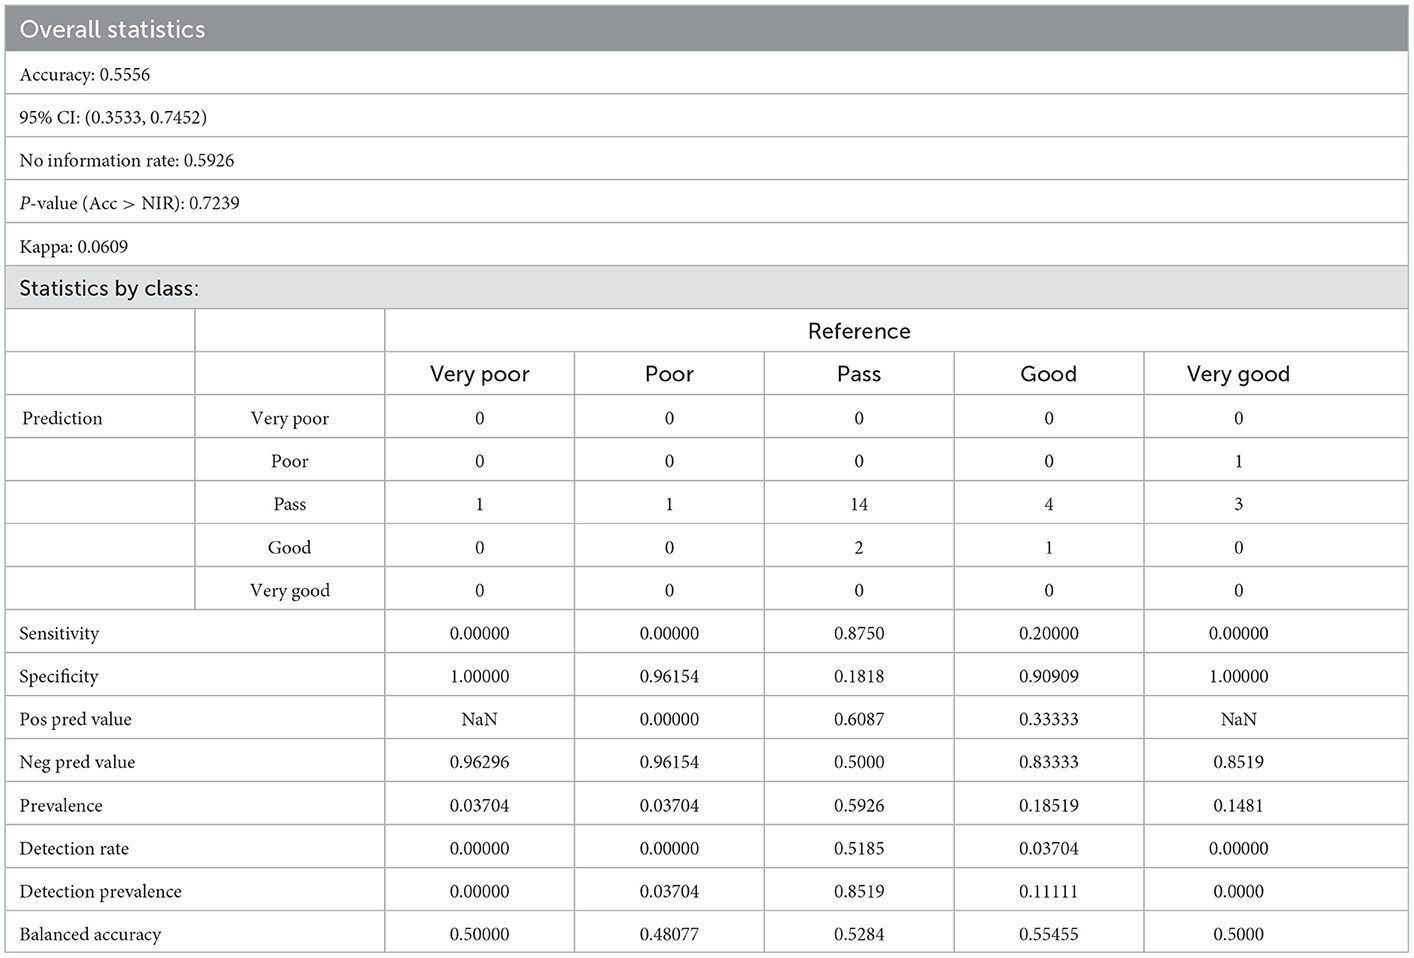
After building the machine-learning model and predicting scores on the test dataset, the study checks the accuracy of the prediction by a confusion matrix. The confusion matrix, also known as the error matrix, is used to check whether the prediction results of the system model are accurate as the prediction falls into the categories of True Positive, True Negative, False Positive, and False Negative. The indices to evaluate the quality of machine learning models by confusion matrix are accuracy, sensitivity, specificity and Kappa. Accuracy represents the ratio of correct prediction. Sensitivity measures the ratio of predicted positive classes, and specificity measures the rate of actual negatives identified correctly. Kappa (Cohen's Kappa) identifies how well the model is predicting by measuring the agreement between classification and truth values. A kappa value of 1 represents the perfect agreement, while a value of 0 represents no agreement.
5. Results
5.1. Data distribution
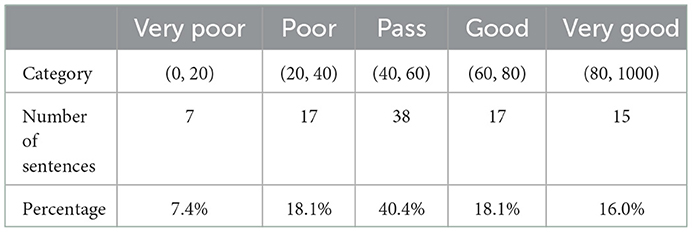
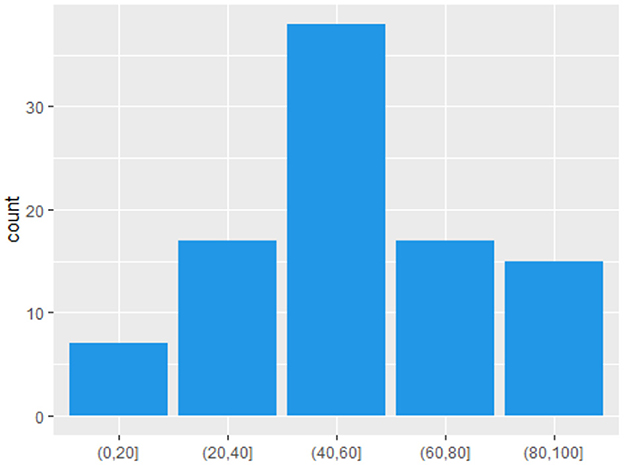
Table 1 gives an overview of the score distribution of fidelity over the five levels to assess interpreting performances. Sentences grades are mainly concentrated in the level of pass with a total count of thirty-eight, accounting for 40.4% of the total. It is followed by level poor and good with seventeen sentences that account for 18.1%. Seven sentences are clustered in level very poor and fifteen in level very good. Figure 1 shows the normal distribution of the score distribution of fidelity as an approximately bell curve indicating values are more likely around mean over extremes, which is beneficial for model building.
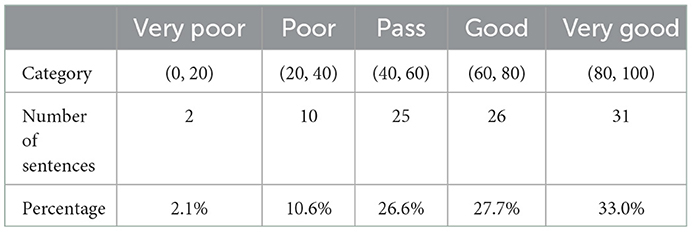
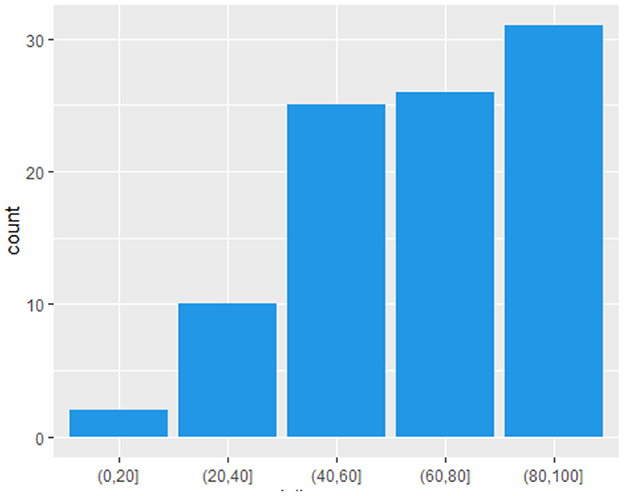
Table 2 shows the score distribution over the five levels to assess delivery in interpreting. Sentences grades are mainly concentrated in the level of very good with a total count of thirty-one, accounting for 33.0% of the total number. It is followed by level good and pass with each of twenty-six and twenty-five sentences that account for 27.7 and 26.6%, respectively. Ten sentences are clustered in level very poor and two in level very poor. Figure 2 illustrates that the score of delivery does not result in a skewed distribution with too many extreme values in the dataset.
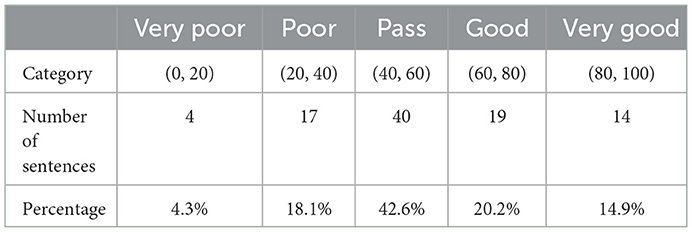
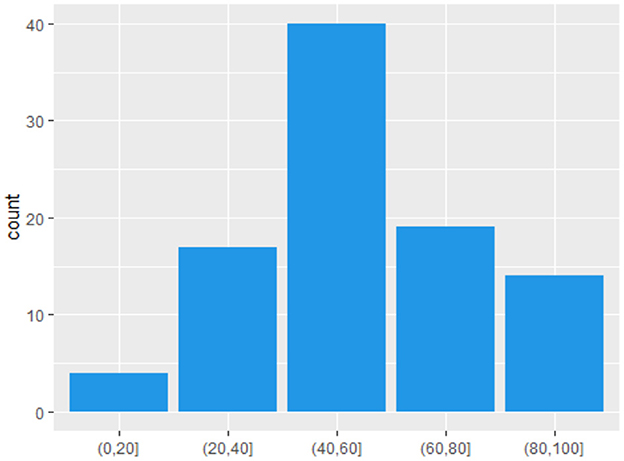
Table 3 shows the overall score distribution over the five levels. The overall scores are calculated for each sentence with fidelity and accuracy accounting for 65/80 and delivery 15/80 for the overall assessment. The result shows that sentence grades are mainly concentrated in the level of pass with a total count of 40, accounting for 42.6% of the total number. It is followed by level good and poor with each of nineteen and seventeen sentences that account for 20.2 and 18.1%, respectively. Fourteen sentences are clustered in level very good and four in level very poor. Figure 3 shows that the distribution of overall scores presents the shape of a bell curve with most scores near the middle but fewer scores in level very poor.
5.2. Correlation analysis among parameters and scores
The inter-correlation among the scores computed to assess fidelity and accuracy by neuro network has been summarized in Figure 4. Scores computed by Sent Siamese with DA from TrasQuest have a moderate negative correlation with scores by Sent Mono with HTER, another model from TransQuest (r = −0.61, p < 0.001). There is a moderate positive correlation between Scores computed by Sent Siamese with DA and scores computed by Similarity (r = 0.57, p < 0.001). The only model that is moderately correlated to human-assigned scores for fidelity and accuracy is Similarity (r = 0.53, p < 0.001).
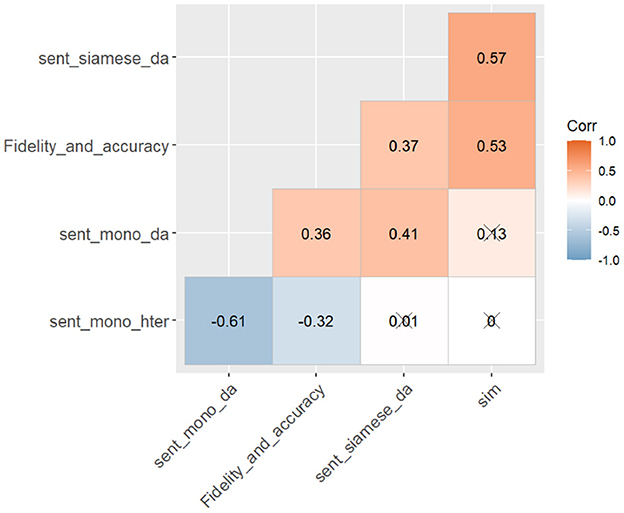
Figure 4. Correlation matrix chart among scores computed by neural networks and human assessment for fidelity.
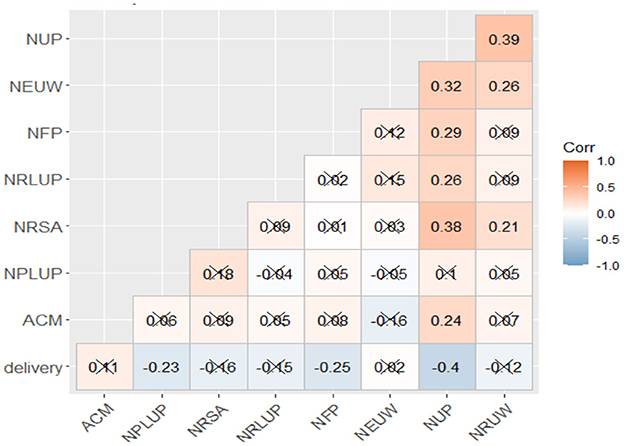
Figure 5 shows the inter-correlation among temporal measures and human assessment for delivery. The number of unfilled pauses have a negative moderate correlation with human-assigned scores for delivery (r = −0.4, p < 0.001). There is a moderate positive correlation between the number of relative unclear words and the number of unfilled pauses (r = 0.39, p < 0.001). Both number of extreme unclear words (r = 0.32, p < 0.001). and number of relatively slow articulation (r = 0.38, p < 0.001) are moderately correlated to number of unfilled pauses.
Figure 6 shows the inter-correlation among temporal measures and scores computed by neuro networks and overall human-assigned scores. The overall scores by human raters have positive moderate correlation with scores computed by Sent Mono with DA from TrasQuest (r = 0.43, p < 0.001) and Similarity (r = 0.52, p < 0.001).
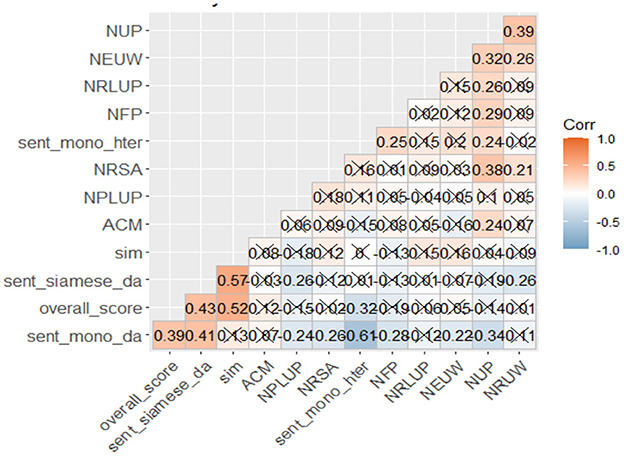
Figure 6. Correlation matrix chart among temporal measures and scores computed by neural networks and overall human-assigned scores.
The random seed selects training and test data with 67 sentences in the training set and 27 sentences with their overall scores in the test set. In the training set, there are three sentences (4.5%) in the level very poor, sixteen (23.9%) in poor, twenty-four (35.8%) in pass, fourteen (20.9%) in good and ten (14.9%) in very good. In the test dataset, there is one sentence (1.7%) in the level very poor, one (1.7%) in poor, sixteen (59.3%) in pass, five (18.5%) in good and four (14.8%) in very good. The distribution of the training dataset is close to the distribution of human-assigned overall scores.
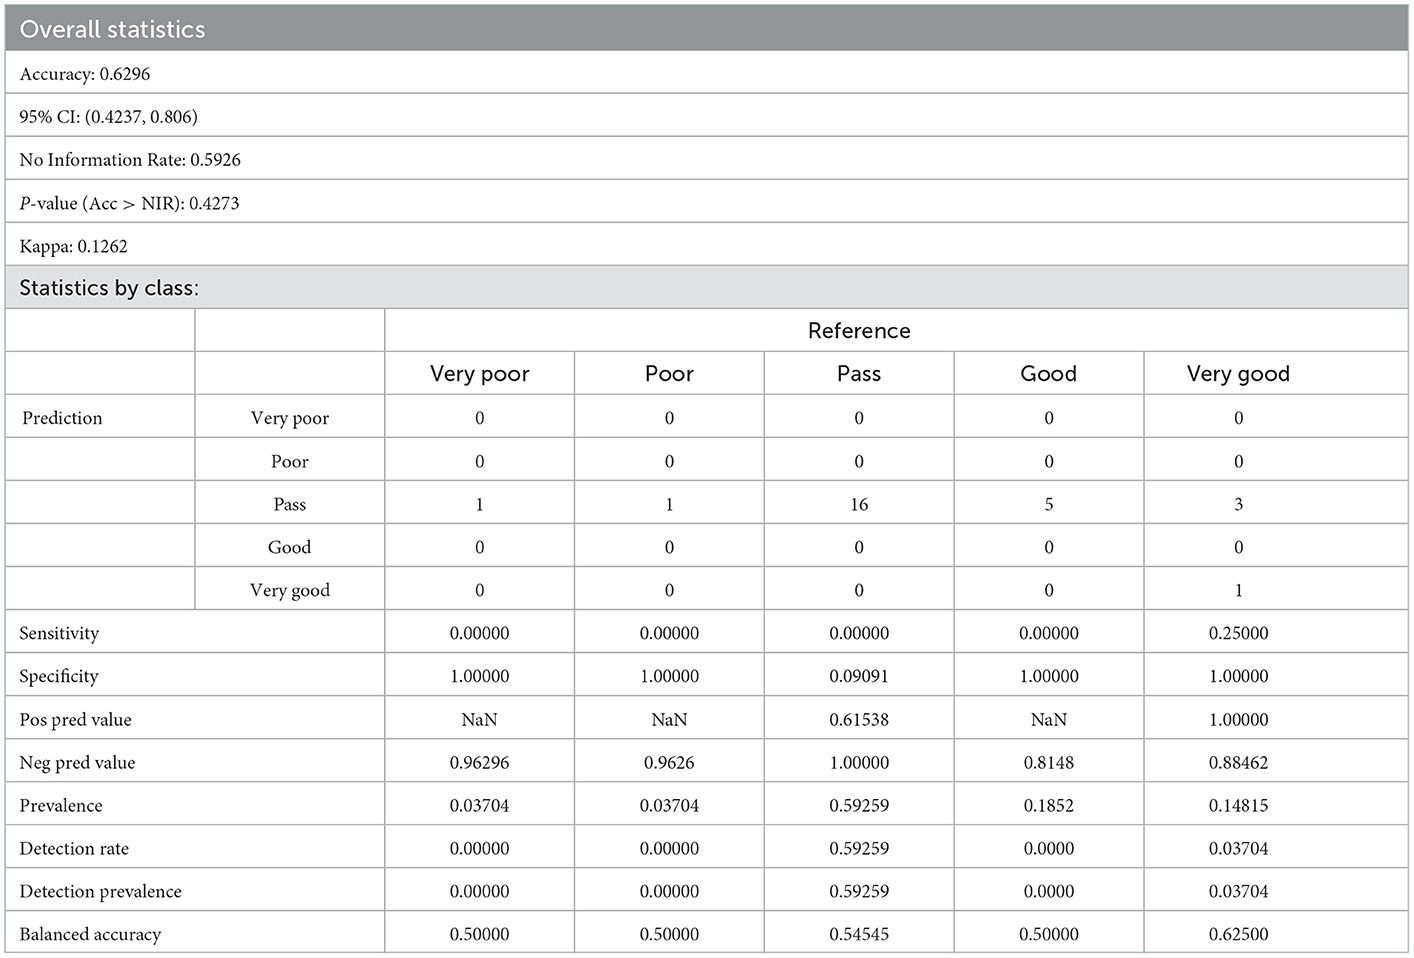
The accuracy of the best SVM machine learning model is tested by confusion matrix after more than two thousand times of dynamic random sampling (Table 4). The correct predictions for each level are 0, 0, 16, 0, and 1. The best SVM algorithm's accuracy rate for predicting the test data is 62.96%, and the 95% confidence interval is between 42.37 and 80.6%. Kappa value is 0.1263, and the P-value is 0.4273. In addition, Table 4 shows that specificity (the negative rate) for each level is high, with 1.0 for level very poor, poor, good, and very good, and 0.9 for level pass, indicating accurate predictions for the number of correct negative predictions. However, the sensitivity (recall) for the very poor, poor, pass and good level are zero and 0.25 for level very good. The numerical value shows that the probability of true positives of each available category is approximately none.
5.3. Confusion matrix for SVM and KNN models
The accuracy of the best KNN machine learning model is tested by confusion matrix after more than two thousand times of dynamic random sampling (Table 5). In the table with combinations of predictions and references, the correct predictions for each level are 0, 0, 14, 1, and 0. The accuracy rate to predict the test data by the best KNN algorithm is 55.56%, and the 95% confidence interval is between 35.33 and 74.52%. Kappa value is 0.0609, and the P-value is 0.7239. In addition, Table 5 shows that specificity (the negative rate) for each level is high except level pass, with 1.0 for level very poor and very good, 0.96 for level poor, 0.91 for level good, indicating accurate predictions for the number of correct negative predictions. However, the sensitivity (recall) for the level very poor, poor, and very good are zero but 0.86 for level pass and 0.2 for level good.
6. Discussion
The aim of this study is to predict the quality of interpretations for pedagogical purposes. It successfully creates two classifiers to predict one out of five classes: very poor, poor, pass, good, or very good with the most important variables that can quantified. In the table of confusion matrix with different combinations of predicted and actual values by SVM model, the assessment results of pass can be accurately predicted which indicates that the SVM machine learning model is able to screen the interpretations that pass the exam. Similar accurate results can also be found in the KNN model. Two machine learning models are not able to categorize the assessment results into more sets of “classes”, with very few correct predictions in terms of categories other than “pass”. Ideally, we want to maximize both Sensitivity & Specificity, which is not possible always as there is always a trade-off. Sensitivity is the proportion of observed positives that were predicted to be positive. Specificity refers to the proportion of observed negatives that were predicted to be negatives. Our SVM model compromises on sensitivity and CNN model compromises on specificity.
The reason behind inaccurate prediction is disproportionate data with little assessed as very poor, poor, good, or very good have been provided for machine learning. Therefore, the study suggests that machine learning models for the prediction of interpreting quality can be built with parameters of fidelity and delivery. With new, larger and proportionate dataset available for future pattern learning by the computers, the model which will possibly produce more accurate prediction results entertains the possibility of application in education or even certification.
The study is the first to build the supervised machine learning models integrating both delivery and fidelity features to predict quality of interpreting. The machine learning models point to great potential of automatic scoring with little human evaluation involved in the whole process. The prediction is based on a supervised learning algorithms trying to model relationships and dependencies between the assessment results and the input features of delivery and fidelity. It is cost-wise, and timesaving compared with manual assessment that requires great effort put into the process wherein assessors must compare, analyze, and evaluate. The machine learning models are also the first built in the computing science to assess interpreting quality. Recent years have witnessed rapid development of MTQE, an AI-powered feature that provides segment-level quality estimations for machine translation suggestions. Giant techs have also explored the possibility of AI-interpreting. However, with robots not being able to understand culture, or matching the human mind's versatility, human interpreters are not being able to be replaced now. The language industry should not be immune to AI-based technology but seek cooperation with AI so that better service can be provided not only for interpreting practice but also for education. It is expected that the exploration of model building based on machine learning for the prediction of interpreting quality contributes toward the advancement of Natural Language Processing by adding something new. The model building is an abstract mathematic representation of human assessment, systematic evaluation, and analysis. It simulates and studies the complex system of quality assessment in interpreting using mathematics and computer science.
7. Conclusion
This study examines the viability of using computational features for fidelity and accuracy, and delivery extracted automatically to build a machine learning model for automatic assessment of communication of interpreting. In this study, we computed three metrics, including Similarity, Sent Siamese with DA, Sent Mono with HTER from TransQuest, as the parameters for fidelity and accuracy. We also extract temporal measures for the feature extraction for delivery. All features have been used to build SVM and KNN machine-learning models. The major finding is the best SVM model can be used to predict interpreting performance with five levels. About Research Question 1, scores computed by all three neuro networks are moderately correlated to human-assigned scores for fidelity and accuracy, with Similarity showing higher correlations. Concerning Research Question 2, the number of unfilled pauses negatively correlates with human-assigned delivery scores. Regarding Research Question 3, the best machine-learning model built with all features by SVM shows an accuracy of 62.96%, which is better than the KNN model with an accuracy of 55.56%. The results suggest that machine learning models for predicting interpreting quality can be built with quantified parameters.
As the first exploration, the study proposes a paradigm that has the potential to assist human in the assessment of interpreting quality. It calls for more rigorous research with larger dataset and more automatic features fed into the learning process. The machine learning model for automatic assessment of communication in interpreting is expected to be applied in low-stake interpreting assessment and complementary to human scoring, which might have great potential in wider application large-scale assessment tasks as it is labor-wise and cost-effective.
Despite these findings, our study has at least two limitations. The first is that there is not enough data for machine learning at the level of very poor, with only three sentences in the training set and one sentence in the testing set at this level. The lack of data at this level also leads to the problem of the non-normal distribution of the data from machine learning. Future work may improve the predictability of machine-learning models at different levels with more data with low scores and normally distributed databases. The second limitation is that some temporal measures related to delivery rate have not been extracted in this study because the timestamps are lost during the process of manual alignment with memoQ. In future research, we may design an interface with a system to enable the post-editing for alignment with timestamps reserved in the sentence so that more delivery features can be used for machine learning.
Data availability statement
The raw data supporting the conclusions of this article will be made available by the authors, without undue reservation.
Ethics statement
The studies involving human participants were reviewed and approved by AHC Committee from University of Leeds. The patients/participants provided their written informed consent to participate in this study.
Author contributions
XW conceived, planned the experiments, and performed the analytic calculations. All authors contributed to the article and approved the submitted version.
Conflict of interest
The authors declare that the research was conducted in the absence of any commercial or financial relationships that could be construed as a potential conflict of interest.
Publisher's note
All claims expressed in this article are solely those of the authors and do not necessarily represent those of their affiliated organizations, or those of the publisher, the editors and the reviewers. Any product that may be evaluated in this article, or claim that may be made by its manufacturer, is not guaranteed or endorsed by the publisher.
Footnotes
1. ^Q3: Upper quartile or the 75th percentile. IQR: The difference between the 75th and 25th percentiles of the data.
References
Banerjee, S., and Lavie, A. (2005). “METEOR: An automatic metric for MT evaluation with improved correlation with human judgments,” in Proceedings of the Acl Workshop on Intrinsic and Extrinsic Evaluation Measures for Machine Translation and/or Summarization (Ann Arbor, MI), 65–72.
Bühler, H. (1986). Linguistic (semantic) and extra-linguistic (pragmatic) criteria for the evaluation of conference interpretation and interpreters. Multilingua 5, 231–235.
Cai, X. H. (2007). Interpretation and Evaluation, [kouyi pinggu]. Beijing: China Translation and Publishing Corporation.
Carroll, J. B. (1978). “Linguistic abilities in translators and interpreters,” in Language Interpretation and Communication, NATO Conference Series, eds D. Gerver, and H. W. Sinaiko (Boston, MA: Springer US), 119–129.
Chung, H. Y. (2020). Automatic evaluation of human translation: BLEU vs. METEOR. Leb. Sprachen 65, 181–205. doi: 10.1515/les-2020-0009
Devlin, J., Chang, M.-W., Lee, K., and Toutanova, K. (2019). BERT: Pre-training of Deep Bidirectional Transformers for Language Understanding. ArXiv181004805 Cs. doi: 10.48550/arXiv.1810.04805
Doddington, G. (2002). “Automatic evaluation of machine translation quality using n-gram co-occurrence statistics,” in Proceedings of the Second International Conference on Human Language Technology Research (San Diego, CA), 138–145.
Gile, D. (1992). “Basic theoretical components in interpreter and translator training,” in Teaching Translation and Interpreting, eds C. Dollerup and A. Loddegaard (Elsinore: John Benjamins), 185.
Gile, D. (1995). Fidelity assessment in consecutive interpretation: an experiment. Target Int. J. Transl. Stud. 7, 151–164. doi: 10.1075/target.7.1.12gil
Han, C., Chen, S., Fu, R., and Fan, Q. (2020). Modeling the relationship between utterance fluency and raters' perceived fluency of consecutive interpreting. Interpret. Int. J. Res. Pract. Interpret. 22, 211–237. doi: 10.1075/intp.00040.han
Han, C., and Lu, X. (2021). Can automated machine translation evaluation metrics be used to assess students' interpretation in the language learning classroom? Comput. Assist. Lang. Learn. 0, 1–24. doi: 10.1080/09588221.2021.1968915
Kirchhoff, H. (1976). Das dreigliedrige, zweisprachige Kommunikationssystem Dolmetschen. Lang. L'homme 31, 7.
Lu, X., and Han, C. (2022). Automatic assessment of spoken-language interpreting based on machine-translation evaluation metrics: a multi-scenario exploratory study. Interpreting. doi: 10.1075/intp.00076.lu
Moser, P. (1996). Expectations of users of conference interpretation. Interpreting 1, 145–178. doi: 10.1075/intp.1.2.01mos
Papineni, K., Roukos, S., Ward, T., and Zhu, W. -J. (2002). “Bleu: A method for automatic evaluation of machine translation,” in Proceedings of the 40th Annual Meeting of the Association for Computational Linguistics (Philadelphia, PA: Association for Computational Linguistics), 311–318.
Poyatos, F. (2002). Nonverbal Communication Across Disciplines: Volume 1: Culture, Sensory Interaction, Speech, Conversation. Amsterdam; Philadelphia, PA: John Benjamins Publishing.
Schmidt, T., and Wörner, K. (2009). EXMARaLDA-Creating, analysing and sharing spoken language corpora for pragmatic research. Pragmatics. 19, 565–582. doi: 10.1075/prag.19.4.06sch
Seleskovitch, D. (1978). Interpreting for International Conferences: Problems of Language and Communication. Washington, DC: Pen and Booth.
Shannon, C. E. (1949). The Mathematical Theory of Communication, by CE Shannon (and Recent Contributions to the Mathematical Theory of communication), W. Weaver. Champaign, IL: University of Illinois Press Champaign.
Snover, M., Dorr, B., Schwartz, R., Micciulla, L., and Makhoul, J. (2006). “A study of translation edit rate with targeted human annotation,” in Proceedings of the 7th Conference of the Association for Machine Translation in the Americas: Technical Papers (Cambridge, MA), 223–231.
Specia, L., Paetzold, G., and Scarton, C. (2015). “Multi-level translation quality prediction with quest++,” in Proceedings of ACL-IJCNLP 2015 System Demonstrations (Beijing), 115–120.
Stenzl, C. (1989). “From theory to practice and from practice to theory,” in The Theoretical and Practical Aspects of Teaching Conference Interpretation. Udine: Campanotto.
Stewart, C., Vogler, N., Hu, J., Boyd-Graber, J., and Neubig, G. (2018). Automatic estimation of simultaneous interpreter performance. ArXiv180504016 Cs. doi: 10.18653/v1/P18-2105
Wang, X., and Wang, B. (2022a). Identifying fluency parameters for a machine-learning-based automated interpreting assessment system. Perspectives 1–17. doi: 10.1080/0907676X.2022.2133618
Wang, X., and Wang, B. (2022b). How to Transcribe and Identify Both Linguistic and Paralinguistic Information? Exploring Automatic Methods for Construction of Multimodal Interpreting Corpora.
Wang, X., and Wang, B. (2022c). Neural Network Models vs. MT Evaluation Metrics: A Comparison Between Two Approaches to Automatic Assessment of Information Fidelity in Consecutive Interpreting.
Yang, L. (2018). Effects of three tasks on interpreting fluency. Interpret. Transl. Train. 12, 423–443. doi: 10.1080/1750399X.2018.1540211
Keywords: automatic assessment, communication in interpreting, machine learning, computational features for fidelity, computational metrics for delivery
Citation: Wang X and Yuan L (2023) Machine-learning based automatic assessment of communication in interpreting. Front. Commun. 8:1047753. doi: 10.3389/fcomm.2023.1047753
Received: 22 September 2022; Accepted: 09 January 2023;
Published: 24 January 2023.
Edited by:
Antonio Benítez-Burraco, University of Seville, SpainReviewed by:
M. Dolores Jiménez-López, University of Rovira i Virgili, SpainAdrià Torrens-Urrutia, University of Rovira i Virgili, Spain
Copyright © 2023 Wang and Yuan. This is an open-access article distributed under the terms of the Creative Commons Attribution License (CC BY). The use, distribution or reproduction in other forums is permitted, provided the original author(s) and the copyright owner(s) are credited and that the original publication in this journal is cited, in accordance with accepted academic practice. No use, distribution or reproduction is permitted which does not comply with these terms.
*Correspondence: Xiaoman Wang,  bWx4d2FuZ0BsZWVkcy5hYy51aw==
 Xiaoman Wang
 Lu Yuan