- Department of Geography and Environmental Studies, Arba Minch University, Arba Minch, Ethiopia
While urban heat islands (UHIs) have been thoroughly studied in cities worldwide, the specific risks and vulnerabilities related to urban heat in Ethiopia and Africa as a whole has given less attention. Urbanization often replaces green spaces with impervious surfaces, which diminishes natural cooling, precipitation, and water infiltration. This change can significantly affect land surface temperatures (LST) and contribute to UHI formation and its impacts. This study aimed to identify and assess the risk factors linked to UHIs, focusing on pinpointing the most vulnerable areas within cities using principal components explanatory factor analysis (HV-PC-EFA) and the urban heat vulnerability index (UHVI) model. The analysis utilized 19 composite indicators under well-established categories such as exposure, sensitivity, and adaptive capacity to assess potential risk zones. The results from the two models were compared, and their variations were examined. In the HV-PC-EFA model, indicators like urban density and roof type, along with adaptive factors such as vegetation cover, urban thermal field variances, and relative humidity, were not distinctly separated as individual components. This may cause discrepancies in the final outcomes, impacting the spatial distribution and extent of vulnerability. Despite observing some spatial variations in identifying risk areas, the study provides a broad perspective essential for developing evidence-based policies and strategies to enhance cities’ resilience to high temperatures and promote sustainable environments. Given the challenges in modifying existing infrastructure, it is practical to regularly implement adaptive measures, such as preserving and restoring urban water bodies, planting trees, creating green public spaces, and raising public awareness about these risks.
1 Introduction
The urban heat island (UHI) effect indicates the degree of difference in temperatures between metropolitan and nearby suburban/rural areas, which can be quite significant at times depending on local heat sources, anthropogenic moisture, urban thermo-physical, geomorphological, and meteorological conditions (Jalalzadeh Fard et al., 2021; Masson et al., 2020). The UHI is primarily caused by dense concentrations of heat-absorbing impervious surfaces and building materials, which trap more heat during the day and release it more slowly at night than natural ground cover (Hurduc et al., 2024; Deng et al., 2024; Zhang et al., 2024; Masson et al., 2020; Wilhelmi and Hayden, 2010; Harlan et al., 2006). Urban surface temperature is predominantly influenced by two key regional factors: land cover and land use patterns, which could pose a significant challenge as a result of urbanization and industrialization (Adulkongkaew et al., 2020). Urbanization replaces vegetative areas with impermeable surfaces that offer shading, evaporative cooling, precipitation interception, and infiltration (Ullah et al., 2023).
Given that the elevated temperatures associated with UHIs heighten the risks of thermal stress to human health (Zhang et al., 2024), climatologists have extensively studied UHIs (Ramakreshnan et al., 2018; Huang and Lu, 2018). Higher body temperatures have been linked to psychological issues such as anxiety, depression, emotional instability, and aggressive behavior (Ebi et al., 2021; Mücke and Litvinovitch, 2020). Cramer et al. (2022) describe heat stress as a condition where the body struggles to release heat during severe heat waves, resulting in increased body temperature. Heat stress and associated conditions such as heat cramps, heat syncope, heat edema, heat exhaustion, and heat stroke constitute the majority of UHI-related health impacts on hot days and are significant causes of heat-related illnesses (Ullah et al., 2023; Piracha and Chaudhary, 2022).
Due to the fact that UHIs’ warmer temperatures amplify the risks that thermal stress (Zhang et al., 2024) poses to human health, because of this, climatologists have focused significantly on the phenomenon of UHI (Ramakreshnan et al., 2018; Huang and Lu, 2018). Higher body temperatures have been linked to psychological disorders such as anxiety and despair, emotional instability, and aggressive behavior (Ebi et al., 2021; Mücke and Litvinovitch, 2020). Cramer et al. (2022), describe heat stress as a condition where the body struggles to release heat during severe heat waves, resulting in increased body temperature. Heat stress and associated conditions—such as heat cramps, heat syncope, heat edema, heat exhaustion, and heat stroke—constitute the majority of UHI related health impacts on hot days and are significant causes of heat-related illnesses (Ullah et al., 2023; Piracha and Chaudhary, 2022).
When considering weather-related illnesses and mortality in the context of global warming, extreme heat is thought to be the primary contributing factor (Ebi et al., 2021; Mücke and Litvinovitch, 2020; Singh et al., 2020; Petkova et al., 2014; Loughnan et al., 2012; Wilhelmi and Hayden, 2010; Raymond et al., 2019). The summer heat waves of 2003, for example, approximately 70,000 people died throughout Europe. In the first two weeks of the heat wave, 39,000 deaths were reported in 12 European countries, including France (96.5%), Portugal (+48.9%), Italy (+45.4%), Spain (+41.2%), and Luxemburg (+40.8%). The excess mortality rates in Germany, Switzerland, and Belgium were found to be 28.9, 26.7, and 21.6%, respectively (Robine et al., 2008). Research suggests that extended periods of high temperatures or warmer days are linked to an increased risk of mortality from heat-related causes. Studies from Shanghai, China (Tan et al., 2010), the United States (Harlan et al., 2006; Chen et al., 2023), Europeans (Harlan et al., 2006) provide evidence in favor of this.
UHI involves further impacts on accessibility to water and hygiene since it might boost the risk of contamination due to a source’s lower water level and warmer water temperature (Chaudhry, 2023). Water must be further treated before it can be consumed since rising temperatures would result in significantly less dissolved oxygen in the water. Warmer weather may cause consumers of water utilities to seek more water when there is a scarcity. Because urban expansion often involves paving over or extending concrete areas at the expense of green land, it can increase floods and runoff during a storm. Increasing runoff can introduce potentially hazardous substances into water supplies for consumption, such as chemicals, oil, and microorganisms (Agonafir et al., 2023; Mateo-Pérez et al., 2021; McGrane, 2016). Furthermore, due to high urban energy consumption especially for artificial cooling/heating systems, high economic costs and the reallocation of funding from development agendas to initiatives targeted at preventing and mitigating this threat are also present in cities with high incidence rates of UHI (Sidiqui et al., 2022; van Raalte et al., 2012).
The IPCC (2022) indicates that extreme heat events, including heat waves, have become more intense and frequent in many terrestrial regions. Additionally, numerous studies have explored the relationship between variations in land surface temperature (LST) and local climate zones (LCZs), as well as the effects of various physical and non-physical factors on the development of urban heat islands (UHIs) and the urban thermal environment (Zhang et al., 2024; Deng et al., 2024; Sidiqui et al., 2022). It is anticipated that occurrences like the ones described will occur more often and with more intensity, leading to higher levels of population exposure, if global warming continues at its current pace. Because of urban heat island effect, individuals residing in urban areas are at a great risk of experiencing higher temperatures compared to those living in non-urban areas, making them more susceptible to heat-related illnesses (Chen et al., 2023; Sidiqui et al., 2022; Leal Filho et al., 2018b). Moreover, research indicates that varying degrees of heat susceptibility may arise within the same town due to factors such as environmental exposure, demographic variations, and socio-economic disparities among various urban populations. These groups include the elderly and very young, people with disabilities and medical conditions, people from lower socioeconomic backgrounds, people who are socially isolated, and minorities (Melis et al., 2023; Piracha and Chaudhary, 2022). Future projections indicate that the heat gradient between metropolitan regions and their surroundings will increase, raising the relative health hazards for vulnerable urban populations (Zhang et al., 2024; Szagri et al., 2023; Raymond et al., 2019). Therefore policymakers could design integrated solutions that meet community needs and risk categories by analyzing possible dangers, vulnerability levels, and geographical variations in susceptibility.
Vulnerability is a measure of a system’s susceptibility to the adverse impacts of climate change, including its extremes and variability (Sidiqui et al., 2022). Though there are various approaches to vulnerability assessment, many of them are based on the IPCC working definition of vulnerability as a function of exposure, sensitivity, and adaptive capacity (Hahn et al., 2009). Researchers have evaluated the risks of heat-related disorders and came up with possible mitigation and adaptation measures in response to growing concerns about the health of current and future populations (Liou et al., 2021; Barron et al., 2018). However, the majority of research has been conducted in highly developed metropolises, including the South of Quebec (Vescovi et al., 2005), Phoenix and Arizona (Harlan et al., 2006), Delhi (Mallick et al., 2024), Georgia (Maier et al., 2014), Philadelphia (Li, 2021), Birmingham, Toronto (Li, 2021), and the Washington Metropolitan Area (Sheridan et al., 2021).
Over the years, numerous comprehensive researches on the impact of UHI and climate change have been carried out across Africa. These studies include those by Parkes et al. (2022) heat stress in Africa; Li et al. (2022) in the East African city; Jagarnath et al. (2020) in the Durban metropolitan region of South Africa; Gebreyesus et al. (2022) in Hawassa city; and Worku et al. (2021) in Addis Ababa. Our pervious study Tesfamariam et al. (2023) indicated that Mekelle has seen a substantial increase in UHI intensity compared to surrounding districts with different levels of urban development. The recorded UHI values for Mekelle during the driest seasons of 1990, 2000, 2010, and 2020 were 2.73°C, 2.53°C, 2.83°C, and 2.98°C, respectively, marking the highest UHI values ever recorded in the city compared to its neighbors. These findings provide us a foundation for the current study, which seeks to enhance our understanding of these risks and underscore the importance of prompt and environmentally responsible actions in addressing potential crises.
According to the WHO (2015) and the IFRC (2021), Ethiopia is classified as having a “high” risk of experiencing “extreme heat,” which is expected to occur at least once every five years. The increase in “hot” and “very hot” days is anticipated to lead to higher incidences of heat exhaustion, heat stroke, and heat stress, posing significant health risks for the elderly, individuals with pre-existing conditions such as cardiovascular disease, and young children (Leal Filho et al., 2018a). Additionally, it is projected that by 2080, the number of heat-related deaths among the elderly (65 and older) could rise to over 65 per 100,000 people annually, compared to a current estimate of less than 3 per 100,000 people (WHO, 2015; IFRC, 2021). Heat is also expected to negatively impact workers in low-altitude areas, such as farmers and laborers (USAID, 2016; Irish Aid, 2018; Ethiopian Academy of Science, 2015). It can make working conditions more difficult and uncomfortable, particularly at night, leading to increased stress on the body, reduced productivity, and decreased income, under a high emissions scenario, a significant decline in labor productivity is anticipated.
Unfortunately, the full extent of urban heat-related risks and vulnerabilities remains largely unknown in Ethiopia and much of Africa. Notwithstanding the fact that earlier studies have looked at the elements that lead to urban heat islands (UHIs), including how land cover affects them, they have also raised questions about the scientific validity of the metrics employed to compare the temperature of urban and non-urban areas. Conversely, the goal of this study is to identify the towns that are most vulnerable to the adverse impacts of urban heat island (UHI), as well as the factors that increase their likelihood and the most effective ways to measure them. Adopting a comparative analysis on the well-known vulnerability analysis models, such as the IPCC Urban Heat Vulnerability Index (UHVI) and Principal Component Exploratory Factor Analysis (HV-PC-EFA), the study aims to assess and identify high-risk zones to UHI scenarios, even though its scope is seems narrow than that of research on other cities outside of Ethiopia. Thus; this research seeks to answer the following questions: (1) which areas of the city are most vulnerable to UHI? (2) How are UHI risks and vulnerabilities assessed? (3) Under what conditions might the potential for UHI increase significantly?
2 Materials and methods
2.1 Description of the study area
The research was conducted in Mekelle, the capital of the Tigray Regional State, located between 13°26′40″ and 13°33′10”N latitude and 39°26′60″ and 39°35′5″E longitude in northern Ethiopia. Mekelle has experienced substantial growth in recent decades, with an average expansion rate exceeding 6%, as reported by Cities Alliance on December 8, 2023. The city’s population is approximately 559,000, and its built-up area has expanded nearly ninefold over the past forty years, increasing from 3,524 hectares in 1984 to about 32,000 hectares in 2023. Mekelle serves as the political, cultural, and economic hub of the Tigray region and is the second-largest city in Ethiopia. The city is currently divided into seven sub-cities: Ayder, Hadinet, Quiha, Hawelti, Adi Haqi, Kedamay Weyane, and Semien (Figure 1). The region features a tropical savanna climate, characterized by semi-arid and subtropical highland borders, with average annual temperatures of 23.8°C, ranging from lows of 17.6°C to highs of 26°C. The warmest months are May and June, averaging 27°C, while December sees the coolest temperatures, averaging 15°C.
2.2 Data type and pre-processing
When attempting to determine the level and extent of vulnerability emerging from the extreme urban heat wave, it is crucial to identify suitable ecological indicators. According to Perry et al. (2022), urban ecology studies aim to understand how people interact with their surroundings, examine the adverse impacts of cities on nearby natural habitats, and foster environmentally conscious urban policies that enhance urban quality of life while minimizing environmental damage. In addition to severe climates and rising temperatures, urban ecosystems also have to deal with air and water pollution, declining biodiversity, and other problems. These consequences of climate change have made urban areas less resilient to it; they also strain infrastructure, worsen air quality, and disturb the equilibrium of the urban environment (Yang, 2023; Theodorou, 2022; Singh et al., 2020; Hinkel, 2011).
2.2.1 Urban overheating exposure identification
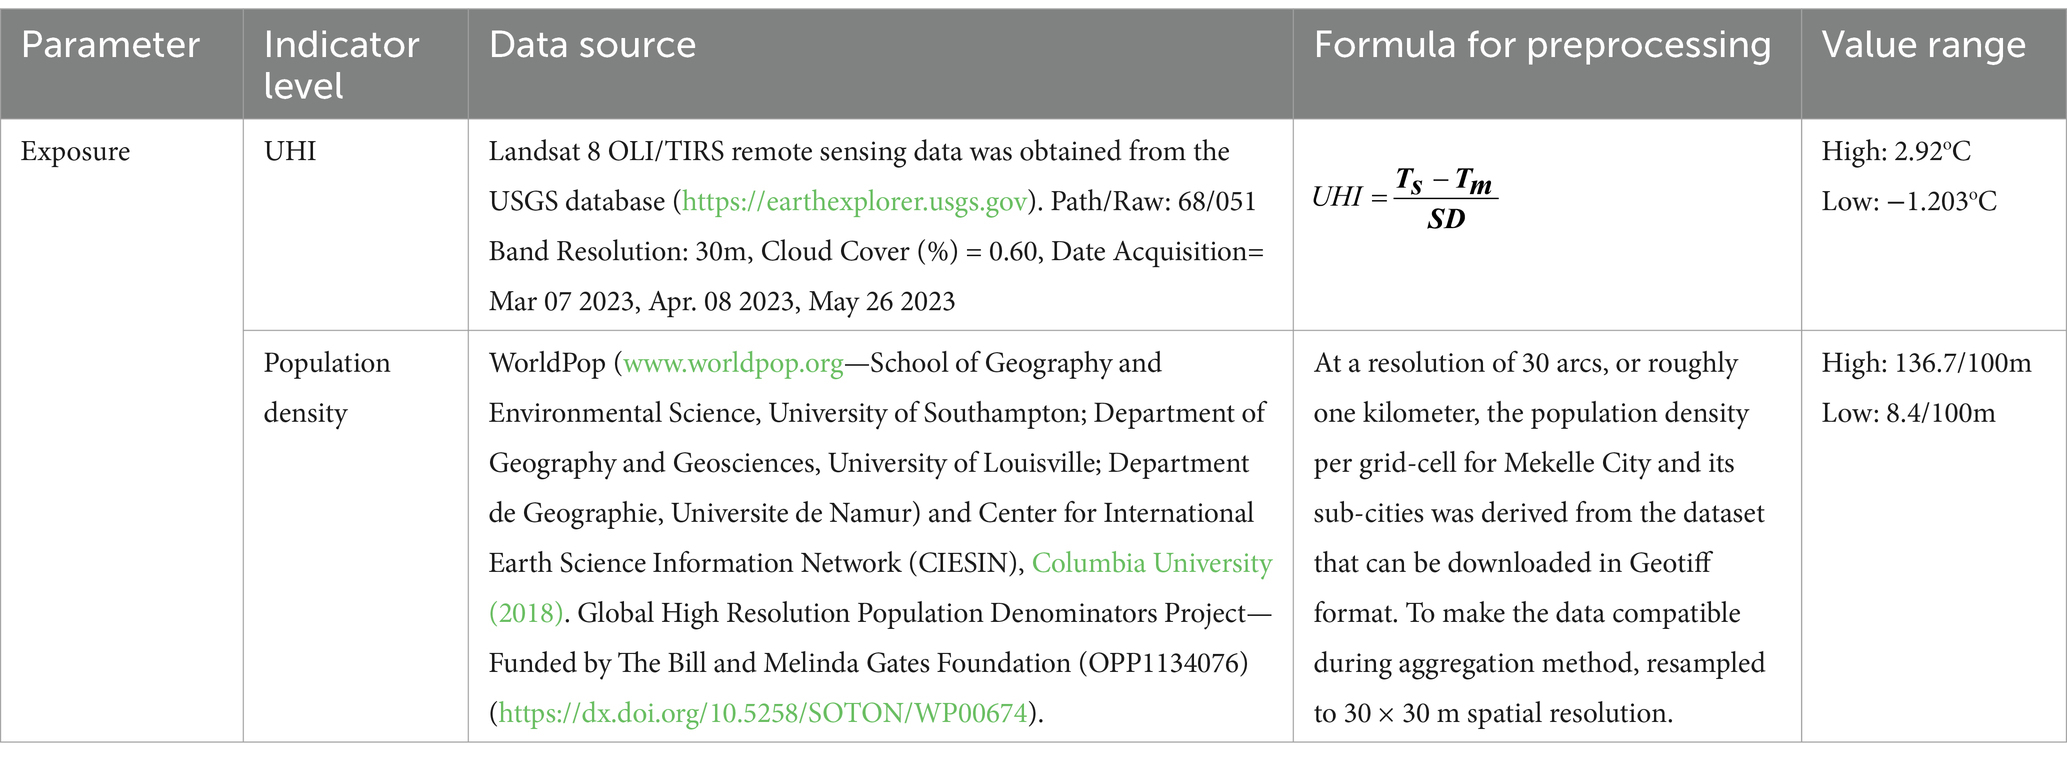
Exposure refers to the level of heat risk or the highest temperature that can be attained in a certain location. Heat exposure is largely caused by urban heat islands (UHIs), which can be measured directly or indirectly by taking into account UHI drivers such urban population density, land surface temperatures (LST), and urban land use dynamics. The satellite image from the Landsat-8 OLI/TIRS sensors was used to calculate the average LST for the months of March, April, and May of 2023 (Table 1). The appropriate dates and months for thermal LST estimate and spectral index analysis were chosen based on local weather conditions and the provision of suitable satellite images. An average LST was produced to solve the problem of comparing LST values from different days. Two thermal infrared (TIR) bands were processed for rectified brightness temperature, surface reflectance, and UHI (Ullah et al., 2023; Jalalzadeh Fard et al., 2021; Jagarnath et al., 2020; Leal Filho et al., 2018b).
2.2.2 Urban overheating sensitivity identification
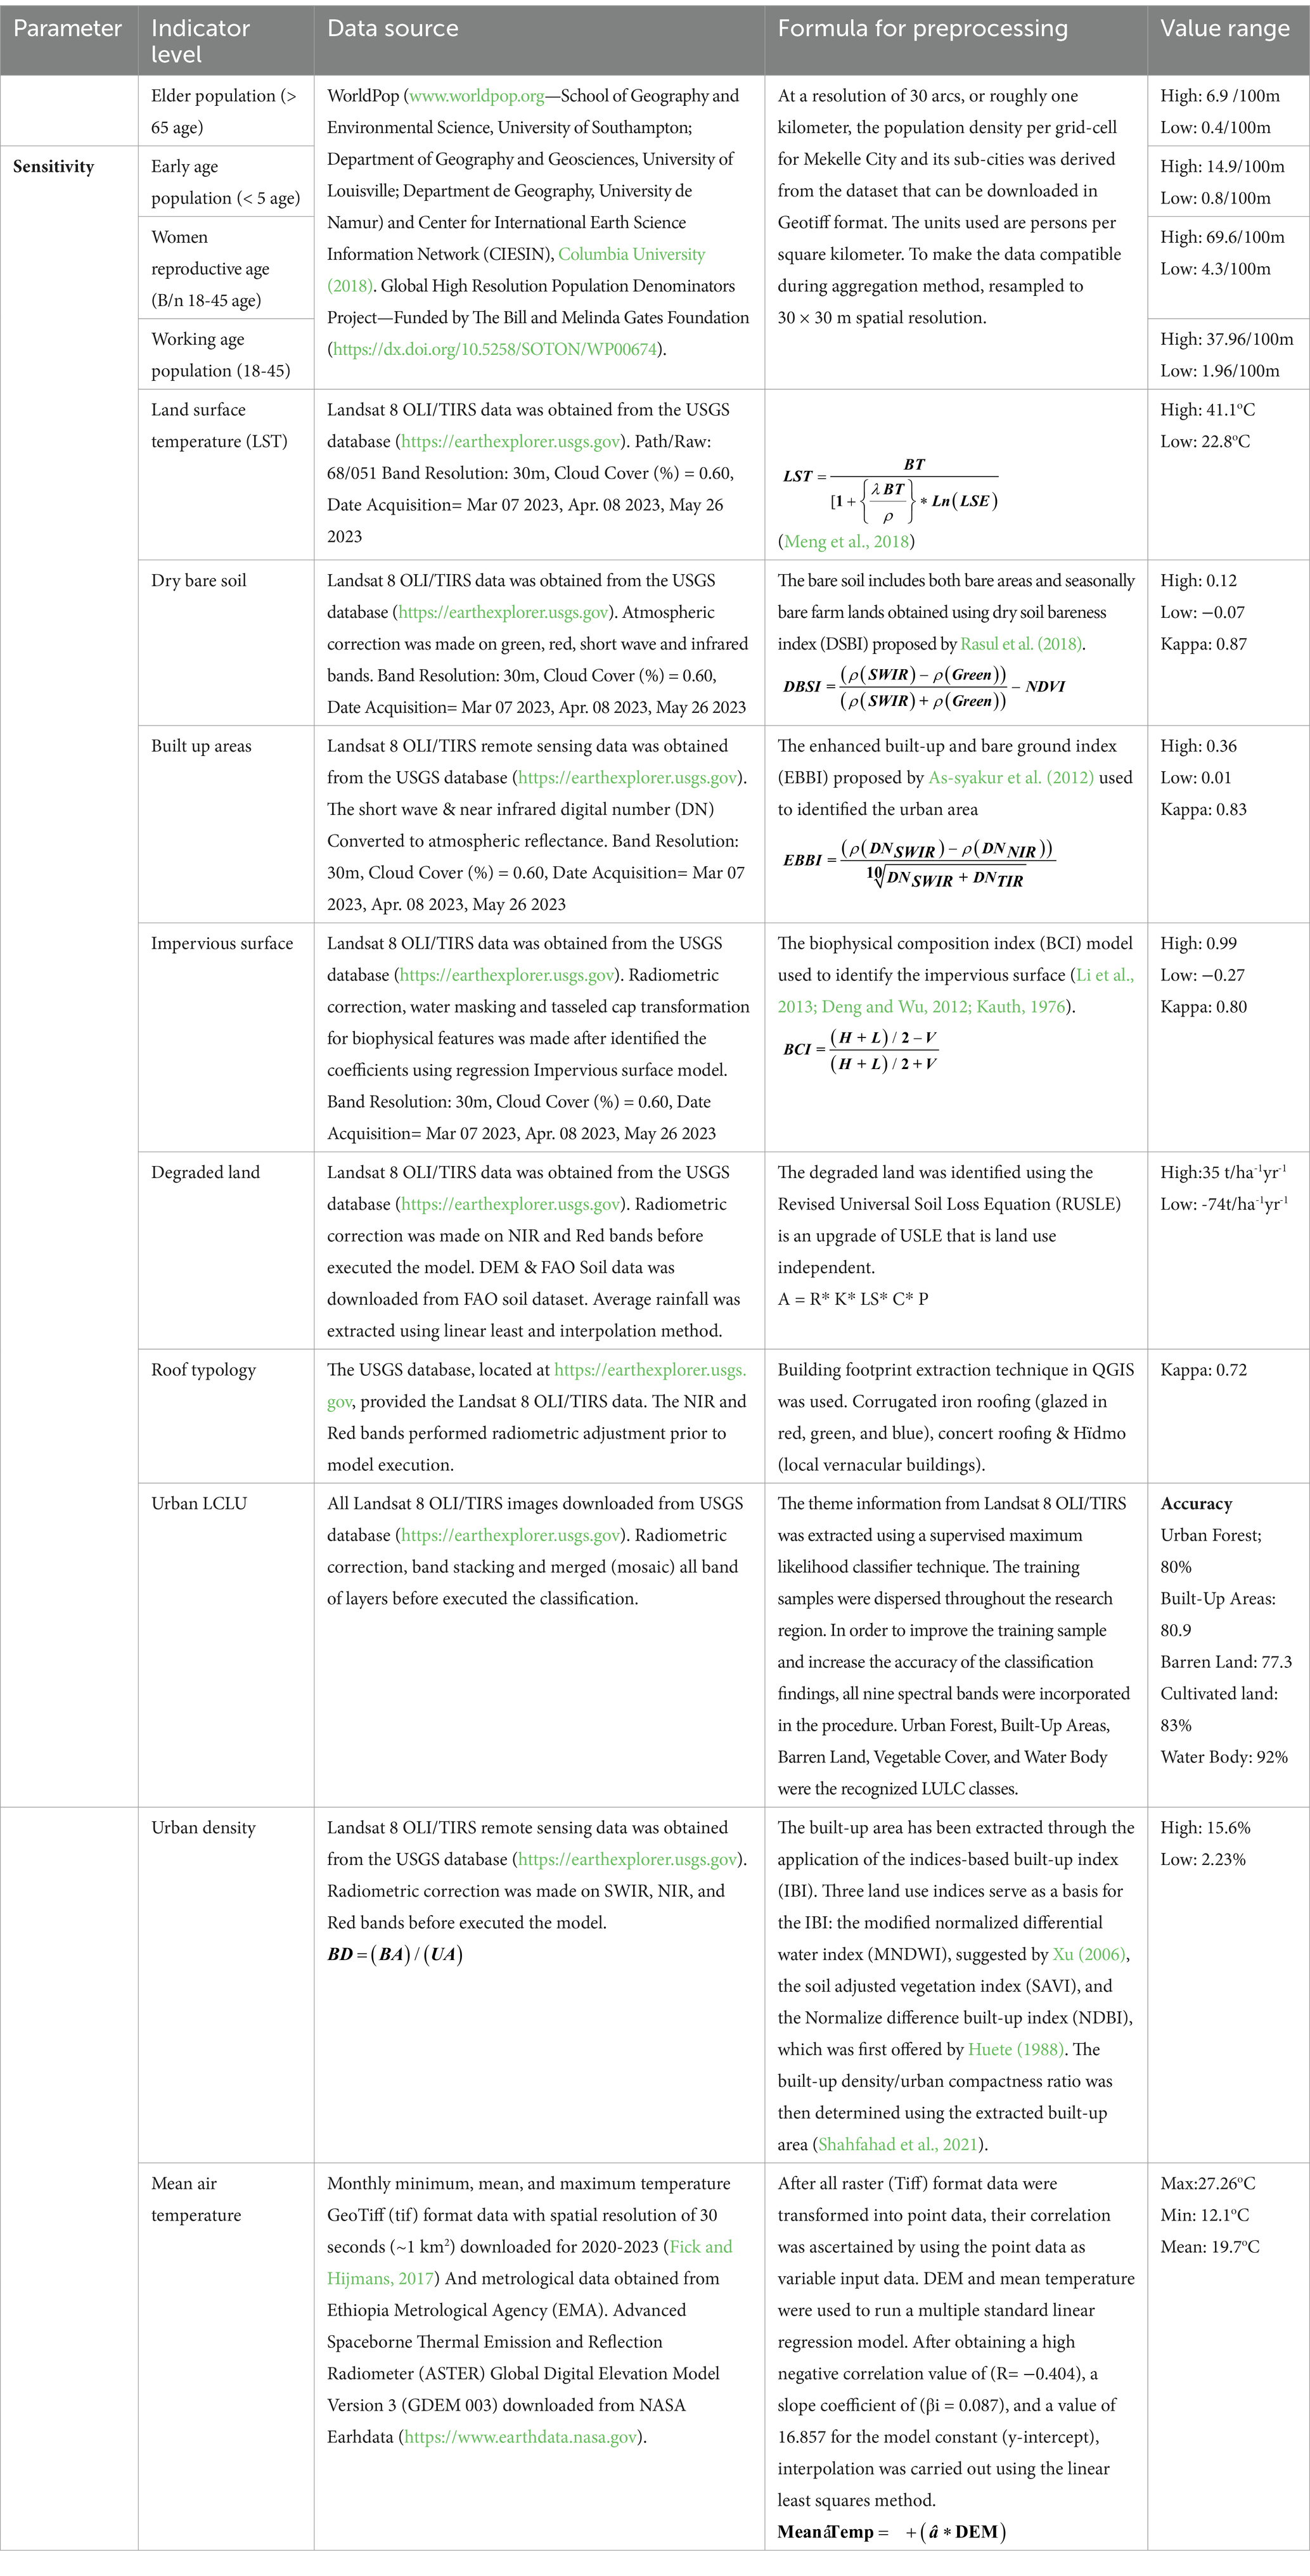
Sensitivity is the degree to which a person may be affected by exposure to heat in light of any underlying physiological conditions that may facilitate or obstruct these effects (Sidiqui et al., 2022; Jalalzadeh Fard et al., 2021; Liu et al., 2020; Loughnan et al., 2012). Certain populations are usually more vulnerable than others due to factors like age, disease, low income (Liu et al., 2020; Jagarnath et al., 2020; Tan et al., 2010). These characteristics are identifiable as critical indicators for mapping the urban population at risk for heat-related diseases like heatstroke and stress. The phenomena of urban heat islands (UHIs) and population expansion and density are intimately associated. One of the main causes of the UHI formation is the modification of the urban environment by human presence. More people lead to more greenhouse gas emissions, changes in the dynamics of urban land use, and the conversion of open, barren urban space into impermeable surface (Imran et al., 2021). They also cause dramatic rises in temperature due to increasing energy consumption and traffic congestion (Fall et al., 2023). Consequently, the demographic data used in this study were sourced from the www.worldpop.org dataset, which included variables such as population density for elderly residents (age 65+), women of reproductive age, children under five, and working-age adults. Typically, women, the elderly and young children are most affected because they are less adaptable to extreme weather conditions and tend to have higher rates of pre-existing health issues compared to other age groups (Table 2). To identify and develop indicators of urban overheating sensitivity for the HVI model, various spectral threshold values and post-supervised classification techniques were employed (Table 2). Factors influencing urban surface temperature include the built environment, building density (measured in dwelling units per km2), land-use and land-cover dynamics (LULC), dry bare soil index (DBSI), built-up area (BUI), and biophysical characteristics (BCI) of the city. Specifically, the conversion of green spaces into built environments exacerbates the UHI problem (Shih, 2017; Sun and Chen, 2017).
2.2.3 Urban overheating adaptive identification
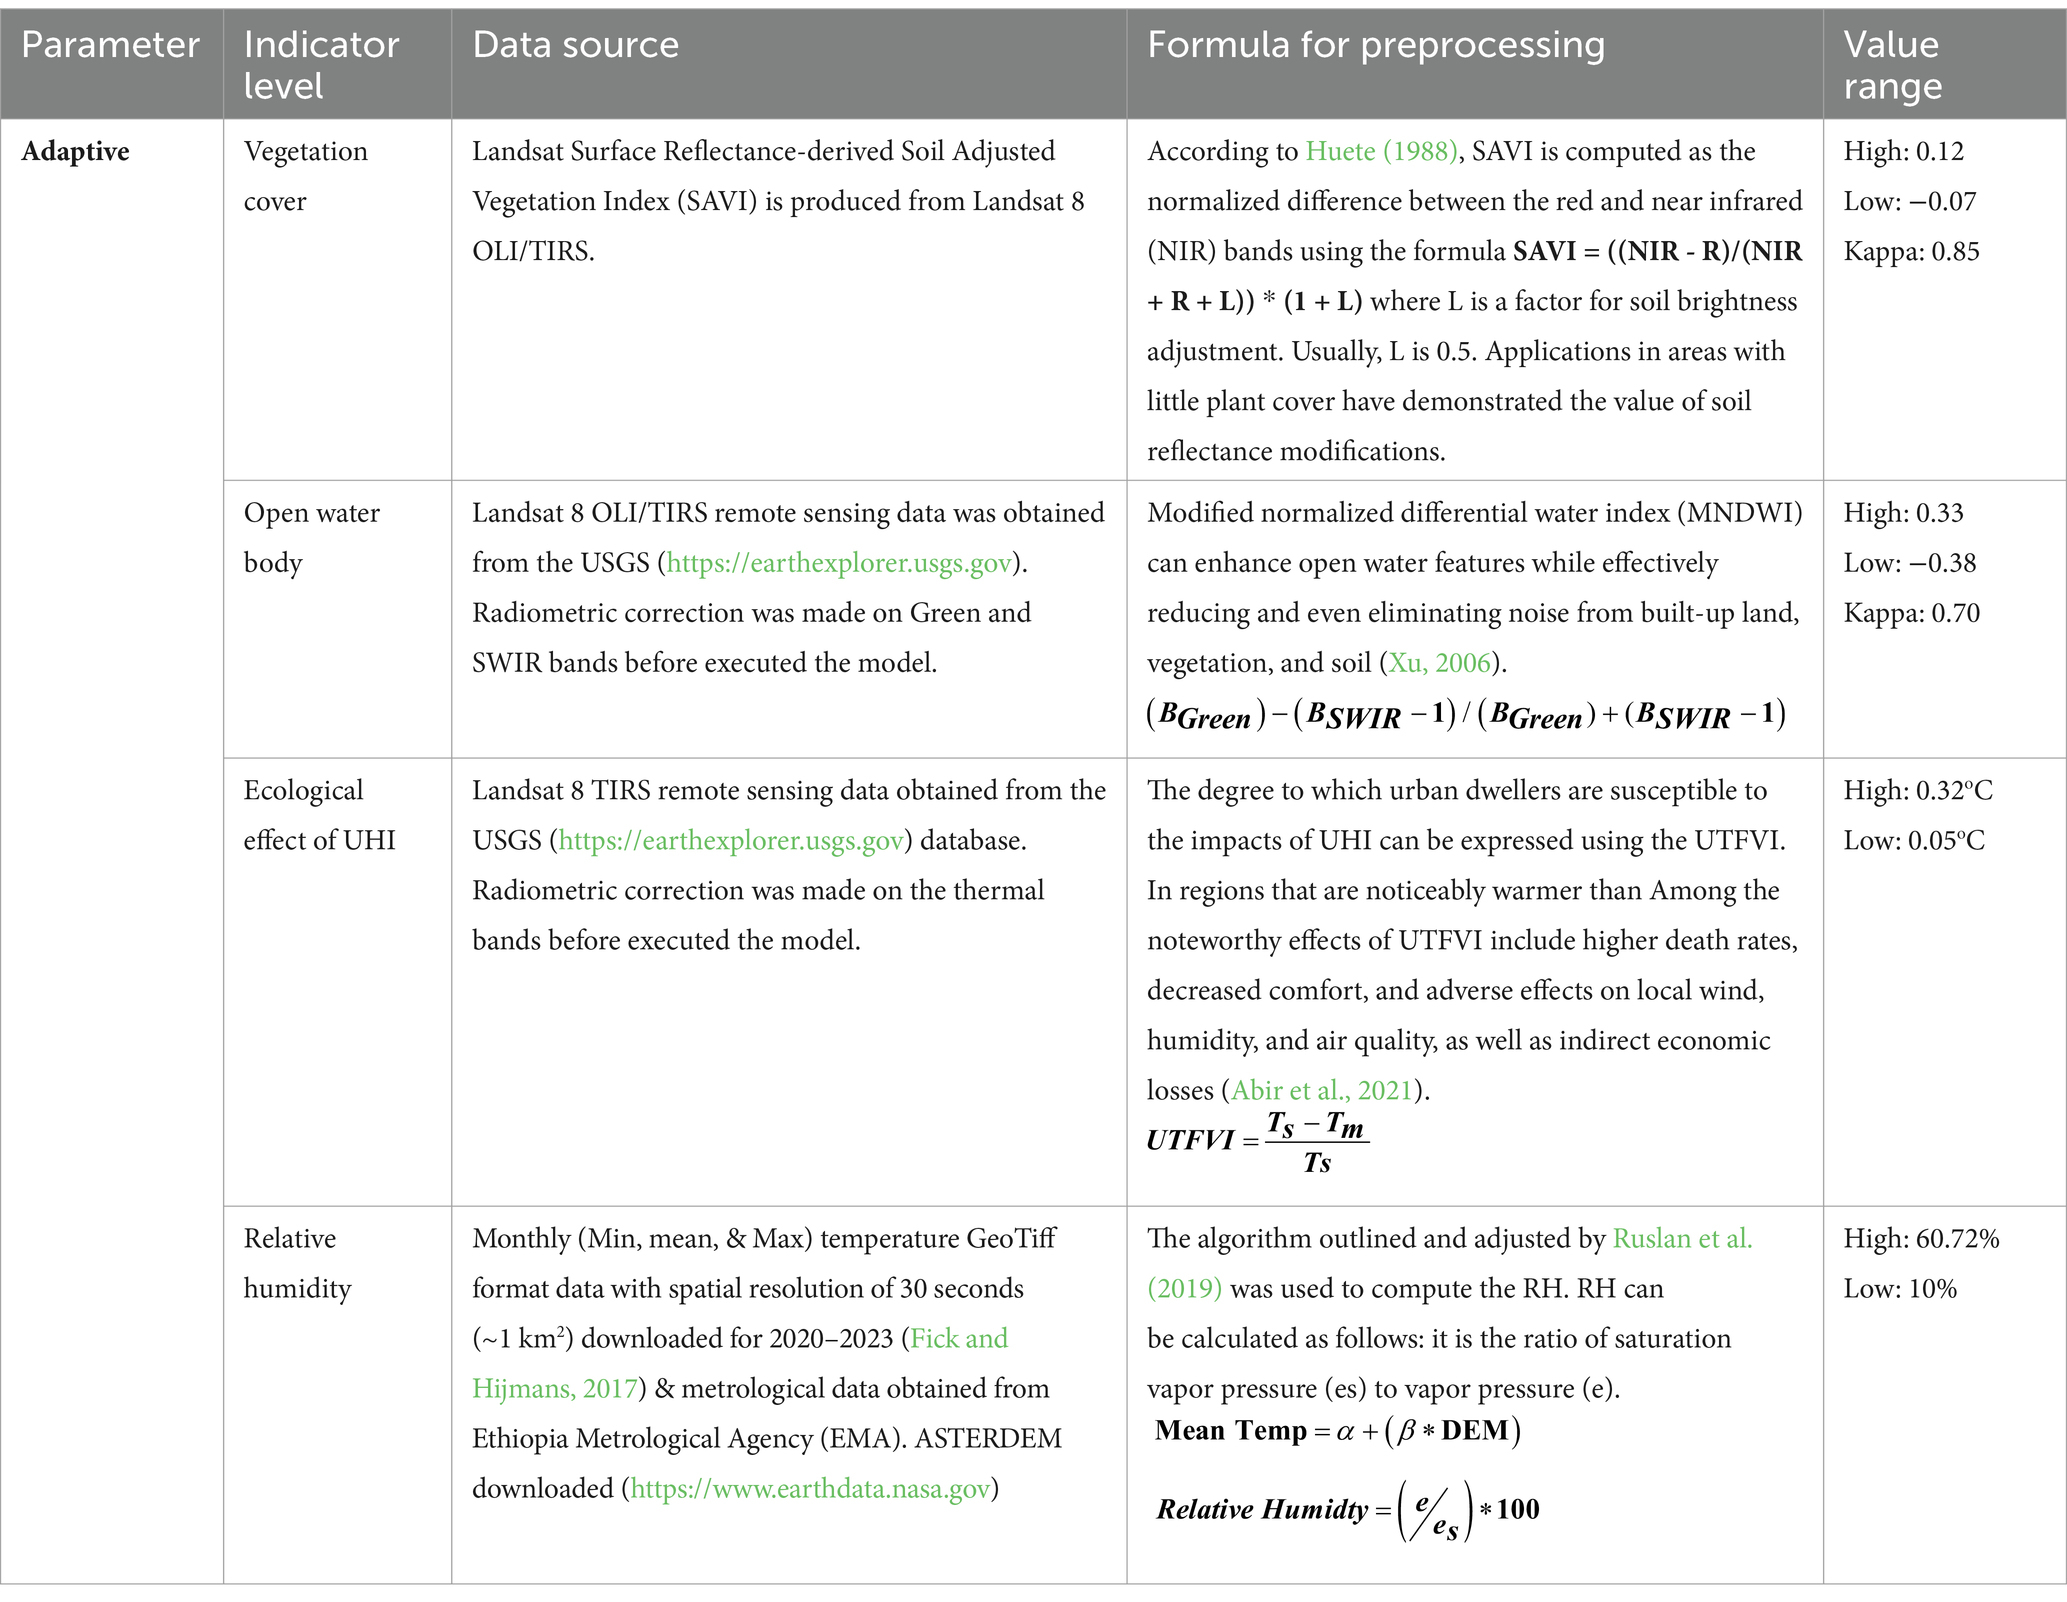
The ability of a person or a group to tolerate high temperatures is known as adaptive capacity. The adaptive indicators (Table 3) used in this study are generally associated with urban ecology factors, such as area covered with vegetation, open water surfaces, relative humidity, and the ecological effect of urban heat island, also known as the urban thermal filed variance index (UTFVI). In fact, surface temperatures are considerably lower in areas covered by vegetation and in/near water bodies than they are in places covered by the built-up environment (Zhang et al., 2024). A diverse range of open water bodies and enough green space within cities might enhance the ability to react to abrupt temperature rises caused by urban heat islands and regulate surrounding air temperatures. There is an inverse relationship between the UHI phenomena and the percentage of green space and water bodies in the built environment (Chaudhry, 2023; Fall et al., 2023; Gebreyesus et al., 2022; Liu et al., 2020).
2.3 Methodology
Communities that are at a higher risk of becoming the victims of extreme heat have been identified by the Heat Vulnerability Index (HVI), it is also the most popular urban HVI are being utilized by professionals progressively more for identifying high priority areas for intervention (Melis et al., 2023; Jalalzadeh Fard et al., 2021; Sidiqui et al., 2022; Liu et al., 2020). The model identifies vulnerable communities by evaluating a range of factors, including geo-climatic, geophysical, and socioeconomic elements (Table 1). Urban heat vulnerability involves multiple dimensions and is therefore assessed through the creation of composite indicators, which allow for the measurement of complex concepts that single indicators cannot fully capture (Ramli et al., 2023; Il Choi, 2019). To identify and evaluate potentially at-risk urban areas, two different methods are such as; Principal Component Exploratory Factor Analysis (PC-EFA) and the established Urban Heat Vulnerability Index (UHVI) model were employed.
Principal Component Analysis (PCA) and Exploratory Factor Analysis (EFA) are distinct methods but are sometimes used together in a two-phase process. Initially, PCA is employed to reduce the data’s dimensionality before interpreting the underlying variables with EFA. PCA is a statistical technique aimed at simplifying data by transforming a large set of correlated variables into a smaller set of uncorrelated principal components (Kyriazos, 2018). The goal is to distill the data into more manageable components that capture the essential patterns. EFA, on the other hand, aims to identify whether a group of observed variables can be explained by fewer underlying factors and to understand the relationships between these factors (Omura et al., 2022; Mathai et al., 2022). This combined approach helps in understanding variable correlations and identifying the main drivers of the data. In vulnerability assessments, three primary factors are considered: exposure, sensitivity, and adaptive capacity. An index of potential impact is created by combining exposure and sensitivity (Figure 2), which is then paired with adaptive capacity to form a comprehensive vulnerability index (Rathi et al., 2021).
Vulnerability refers to the degree, type, and rate at which a system is affected by environmental changes, as well as its susceptibility and capacity to adapt. The commonly used vulnerability equation assumes that sensitivity, exposure, and adaptive capacity all equally influence vulnerability, meaning that each factor contributes equally to the overall vulnerability score (IPCC, 2007). In this framework, adaptive capacity and potential impact are considered to have equal importance, as are exposure and sensitivity in determining potential impact. An overall index was created by rescaling the data and combining the composite indicators using non-linear unweight geometric aggregation method. This process identified potential risk areas for each category. The resulting index scores were then categorized into quintiles representing very high, high, moderate, and low urban heat vulnerability, and these were visually mapped (Figure 3).
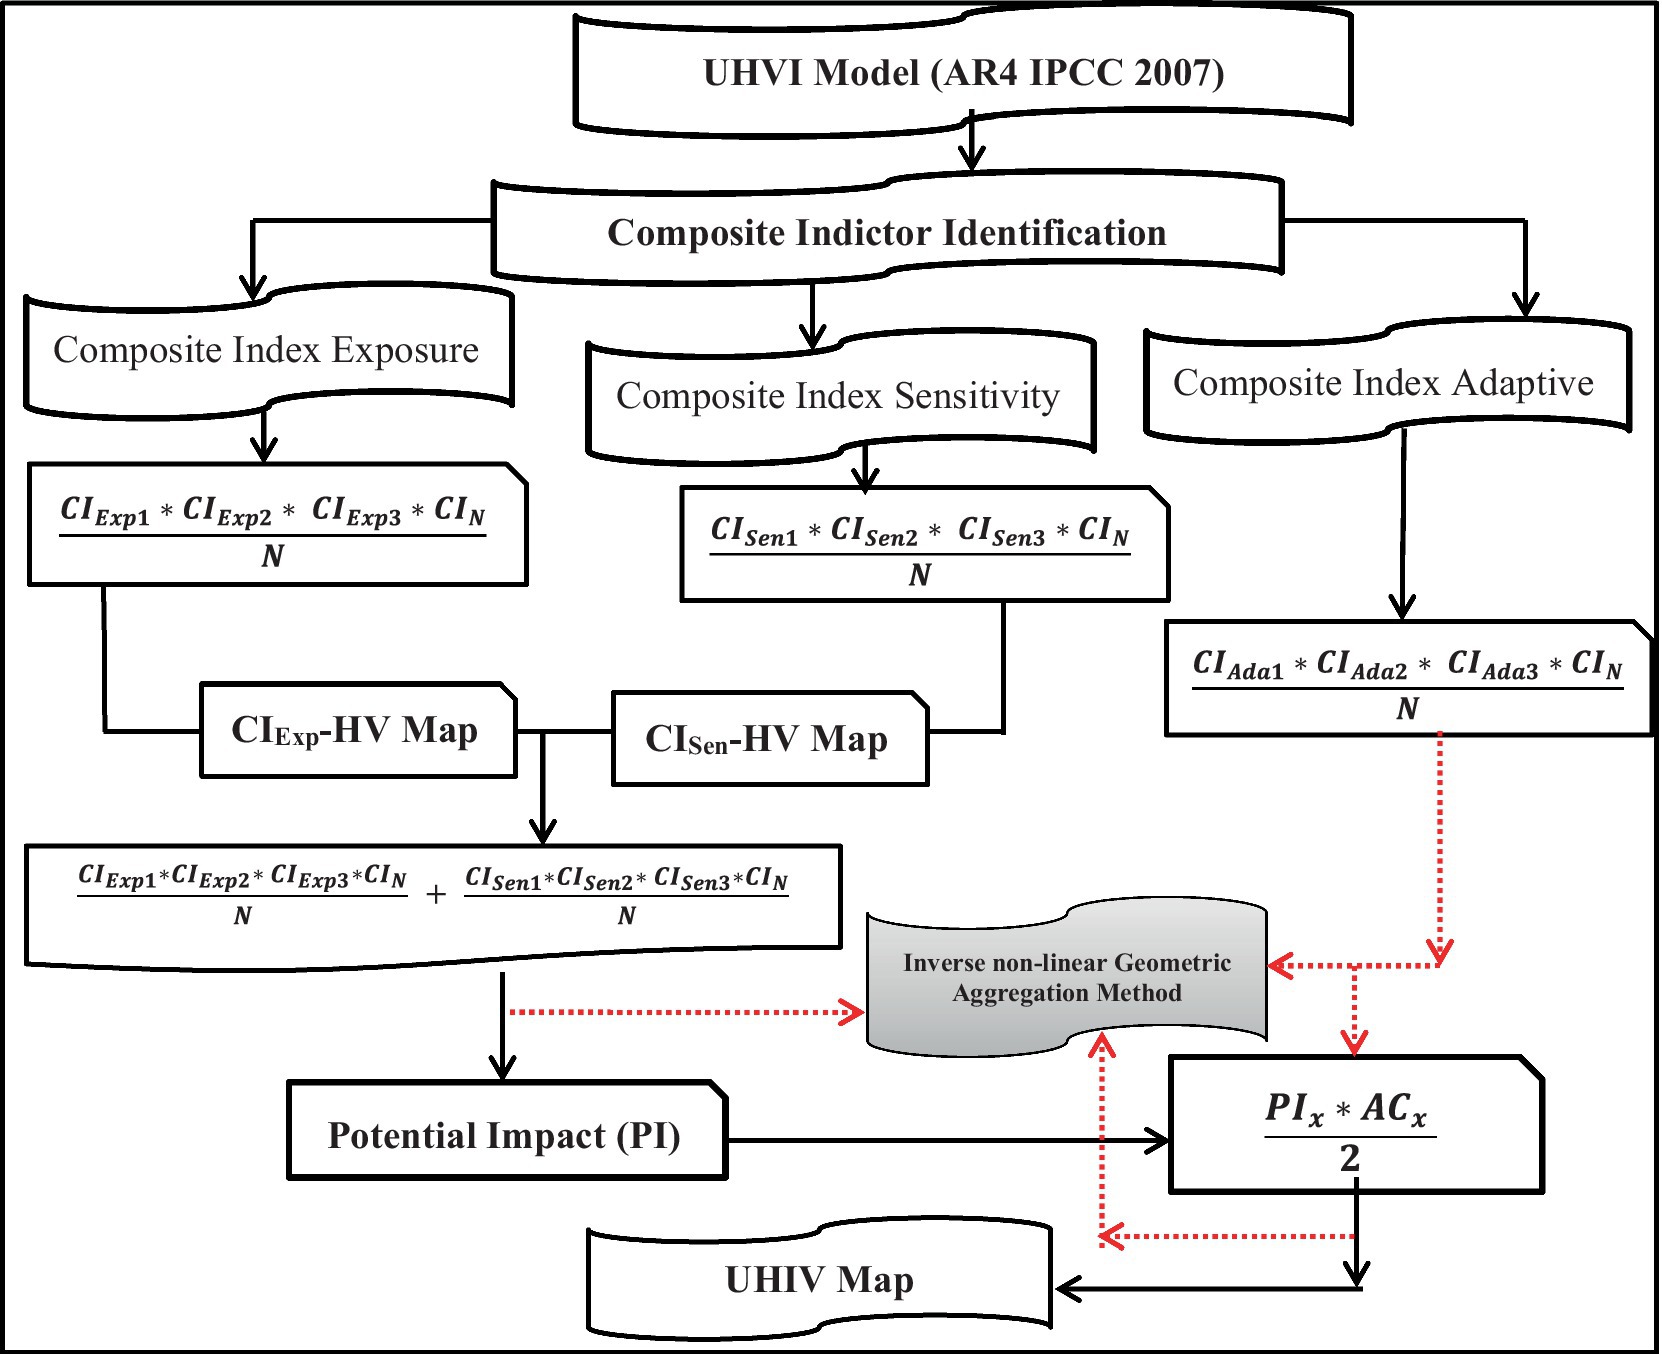
Figure 3. Schematics flow chart UHVI (IPCC, 2007) model.
3 Results and discussion
3.1 Ground truth validation and accuracy assessment
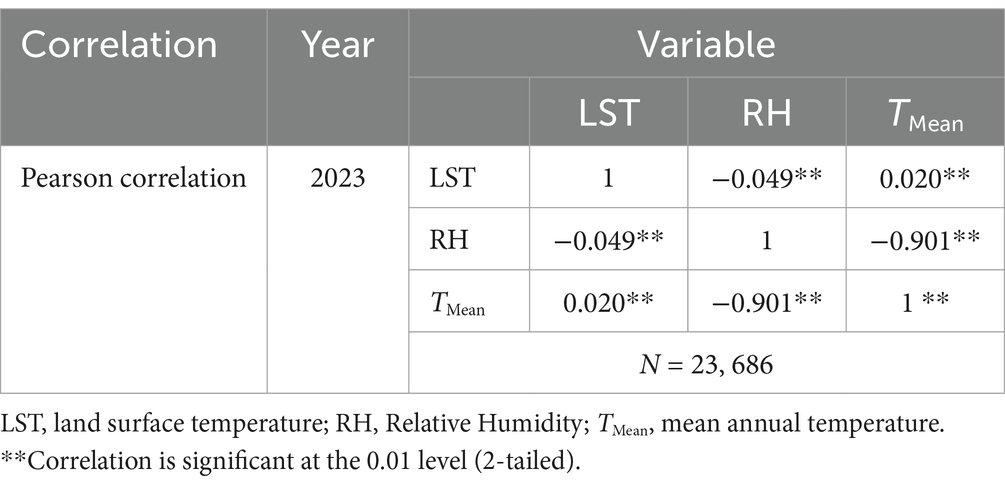
Various spectral-based mathematical methods were employed to map the spatial distribution of physical features within the city. Validation was conducted using GPS data to establish ground truth before proceeding with empirical analysis. Specifically, 460 ground control point (GCP) data were collected and verified through established accuracy assessment procedures: 20 GCPs for water bodies, 200 GCPs for roof types, and 240 GCPs for other land use classifications. The result was achieved the minimum requirement and consistent with proposed kappa status (Table 2). Since relative humidity (RH) and temperature are theoretically inversely related (Pathak et al., 2021); the accuracy of the Landsat temperature map, the RH map, and the mean annual temperature map, derived from the DEM’s linear regression model, was confirmed using Pearson’s pixel-based correlation coefficient. The study’s results, as detailed in Table 4, are consistent with the theoretical expectations.
3.2 Spatial distribution of composite indictor of exposure (CI-exposure)
Demographic, environmental, and climatological factors can also be generically classified under the three primary frameworks of vulnerability: exposure, sensitivity, and adoptive component. When creating each map, consideration was given to the main folds of the vulnerability index as well as variables that may influence the possibility of urban heat vulnerability. To determine the CI-Exposure based heat vulnerability class for the study area, factors such as population density and urban heat island (UHI) were analyzed.
Demographic data for Mekelle city reveal a high population density, with the greatest concentration in the southeast, particularly in Quiha sub-city. Despite Quiha sub-city does not have significantly more urban infrastructure compared to other sub-cities, its higher population density is attributed to factors such as lower residential plot costs, proximity to key government institutions, and available land for urban agriculture. In contrast, the northern part of the city has a lower population density due to the presence of a cement mill, associated pits, and steep, rocky terrain suited for cement production (Figures 4a,c). About 79% of the city has a population density ranging from 10.16/100 m2 to 136/100 m2 (Table 5).
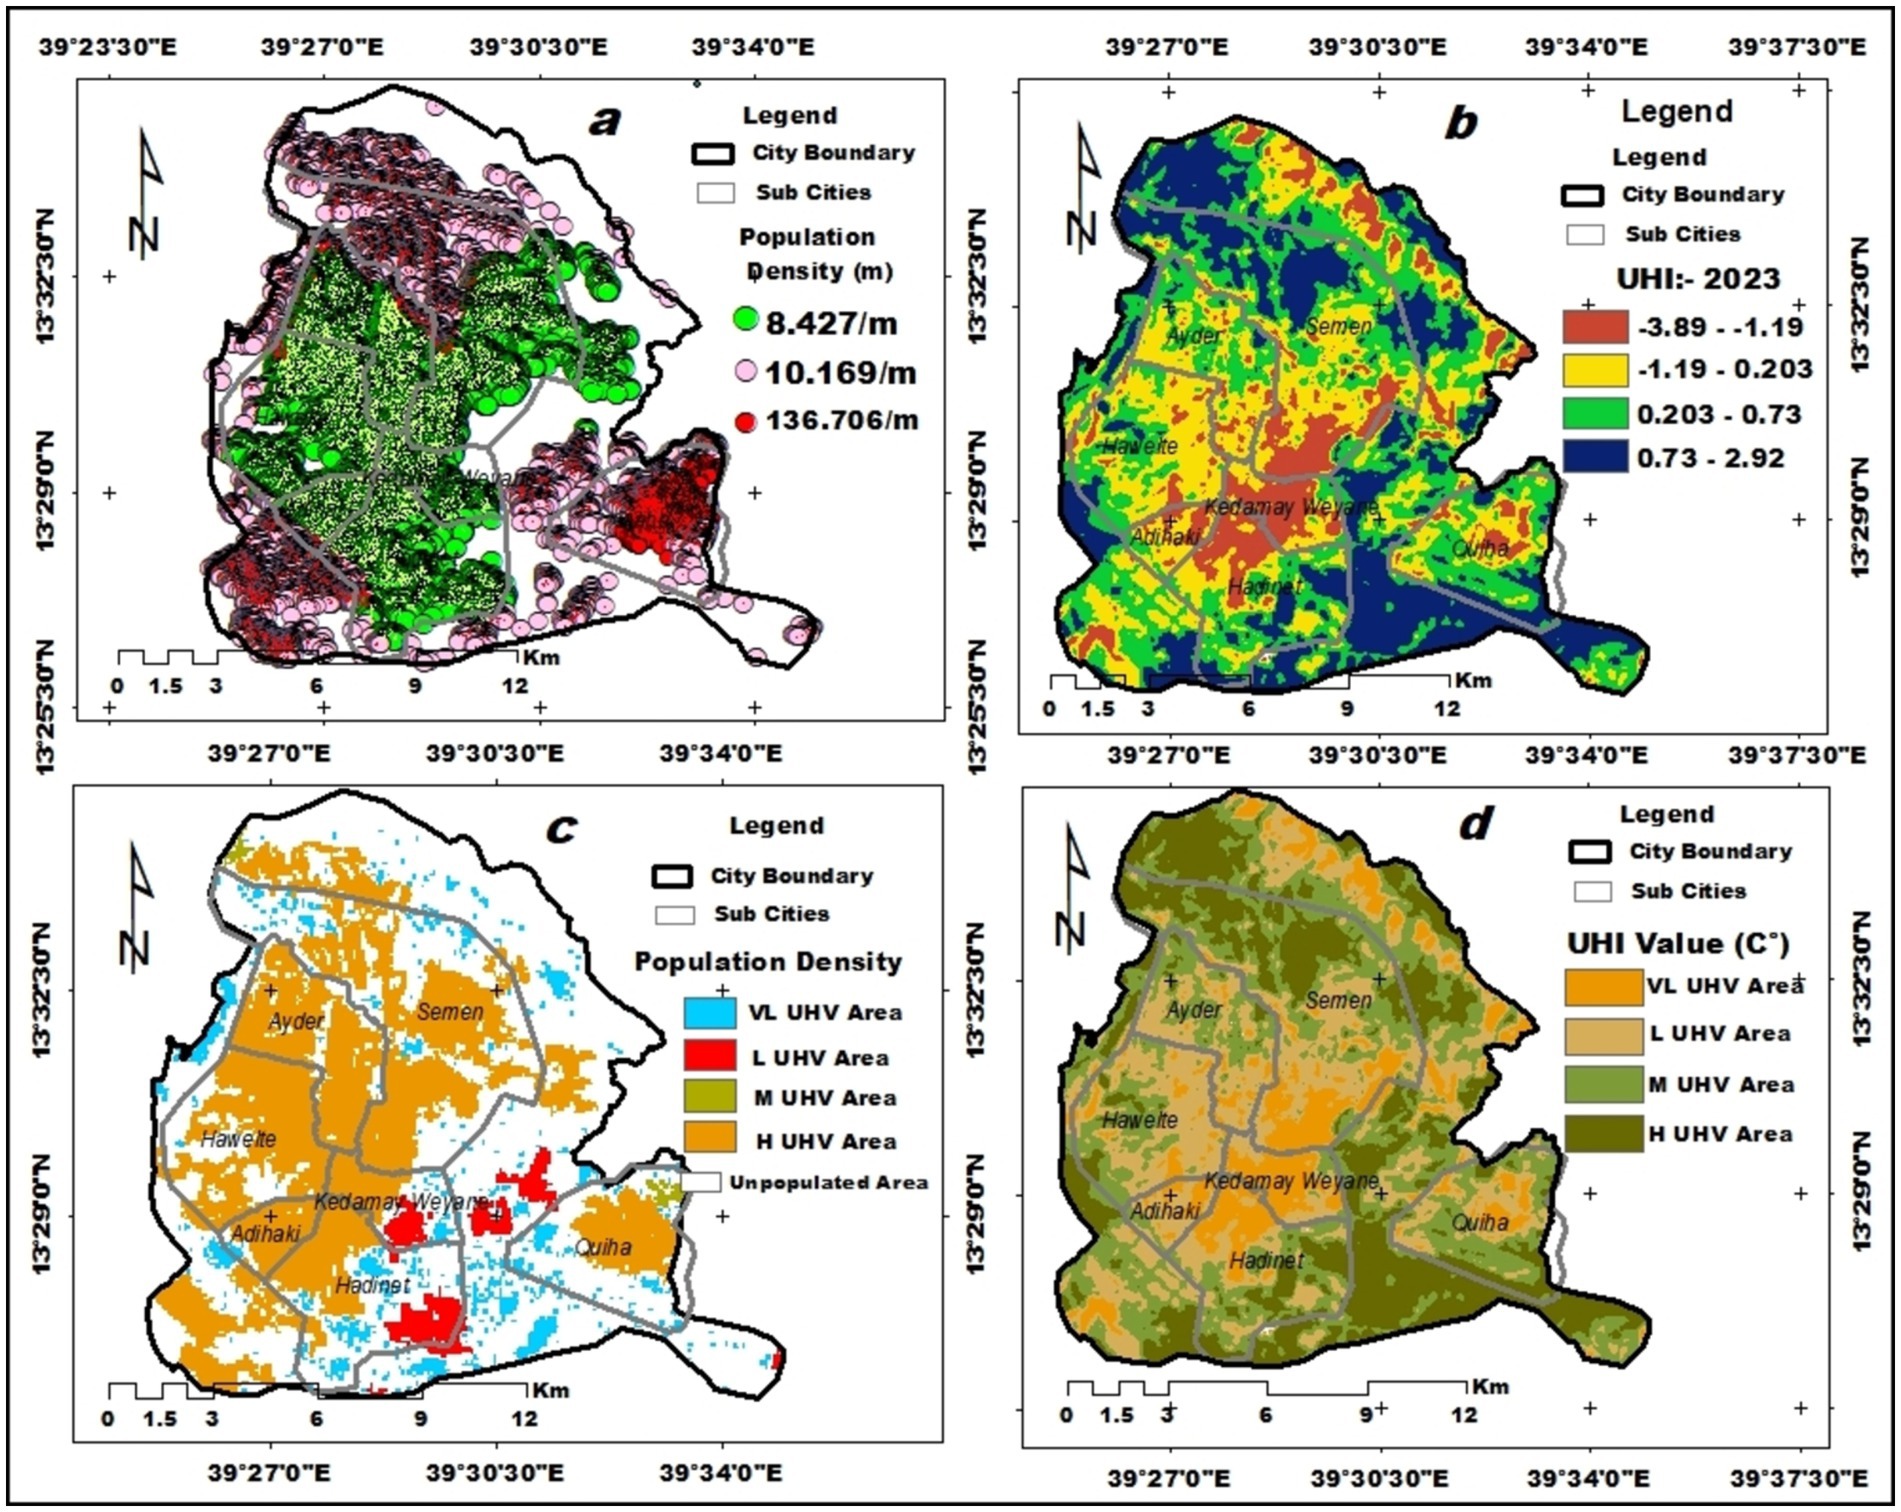
Figure 4. Spatial distribution of exposure indicator vulnerability class. (a) population density, (b) urban heat island (UHI), and (c) reclassified population density, d: reclassified UHI.
With a population of about 559,000, Mekelle has experienced rapid growth in recent years. In densely populated urban areas, urban heat islands (UHIs) can develop, potentially threatening the environment, economy, and society. Increasing population density leads to higher greenhouse gas emissions, significant land use changes, and the conversion of open spaces into impermeable surfaces, all of which can elevate mean temperatures and energy demands. Thus, areas with higher population densities are likely to experience more severe impacts from UHIs (Fall et al., 2023; Sidiqui et al., 2022; Arifwidodo and Chandrasiri, 2015).
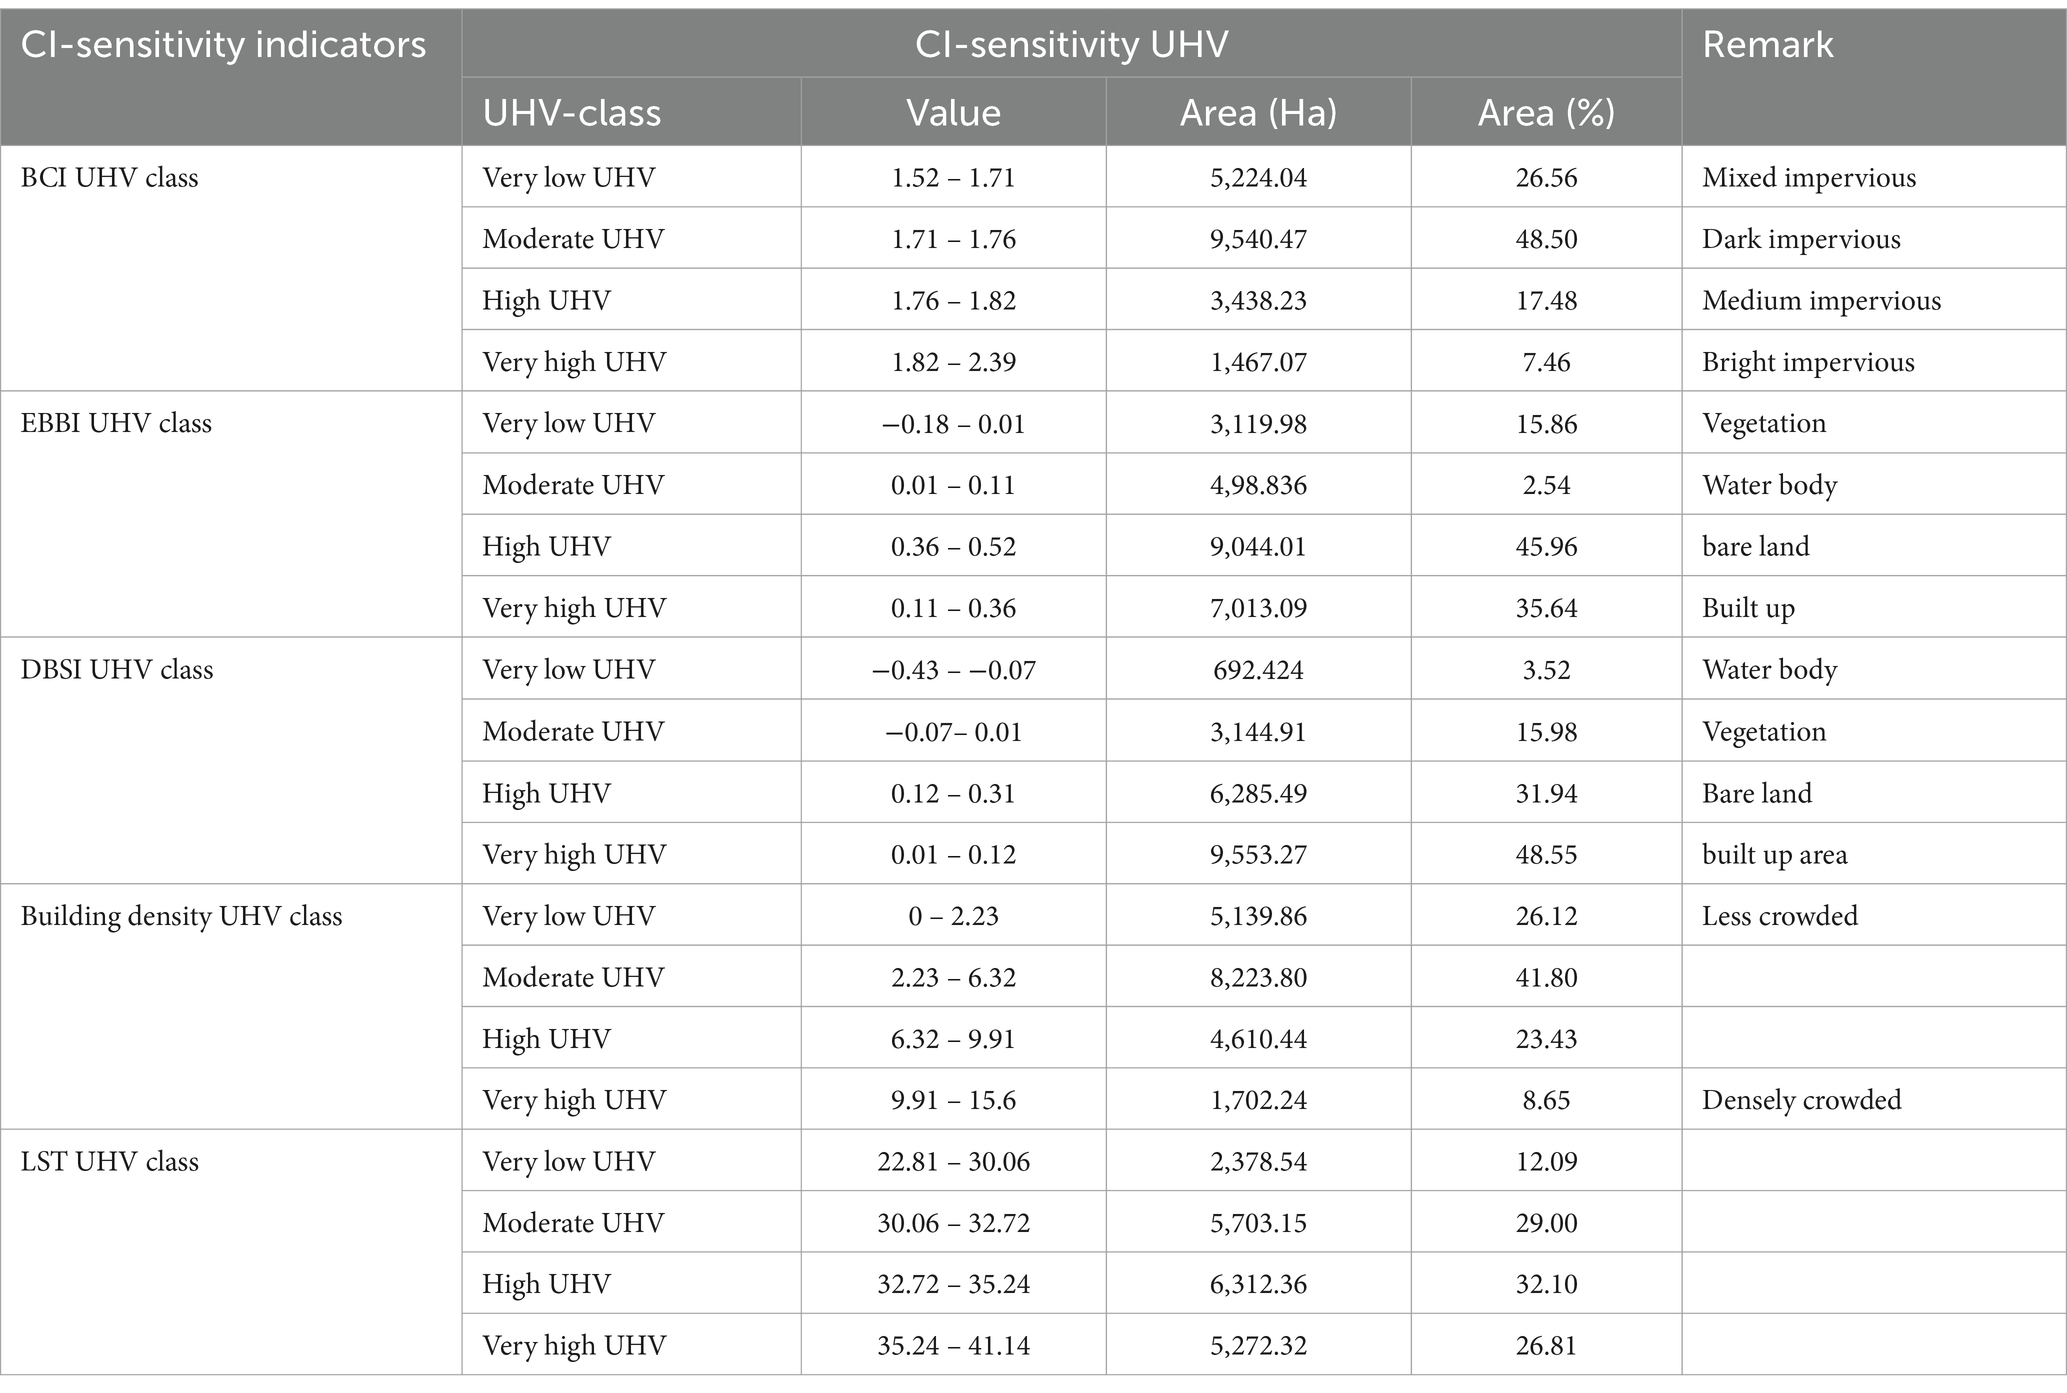
UHI distribution maps, generated using Landsat thermal bands, indicated that the most intense UHI effects were located in the northwest, center, and northeastern parts of the city (Figures 4b,d). The northeastern section, in particular, may experience higher UHI due to a dense concentration of built-up areas and impermeable surfaces. Table 5 reveals that 26% (5,272.32 ha) and 32.10% (6,312.36 ha) of the area fell within UHI temperature ranges of 0.218°C to 2.924°C, suggesting these regions are highly exposed to urban heat vulnerability conditions.
Built-up areas alter surface characteristics, reduce natural cooling mechanisms like vegetation cover, and increase heat retention and emissions, all of which significantly exacerbate the urban heat island effect (Fall et al., 2023; Gebreyesus et al., 2022; Adulkongkaew et al., 2020). In the context of this conceptual tie between population density and the emergence of UHI, four vulnerability class categories; low, moderate, high, and very high were established using population density data that was taken from the www.worldpop.org dataset. The northeast, northwest, southeast, and central areas of the city had the highest concentration of urban residents, according to the population density map. However, the population appears to be less distributed in the northern section of the city; this is probably because of the area’s distinctive geological and geomorphological features.
3.3 Spatial distribution of sensitivity composite indictor (CI-sensitivity)
The extent to which an individual may be impacted by excessive heat in relation to any underlying physiological variables that could either promote or impede these effects is known as their sensitivity (Pathak et al., 2021). They also broadly categorized in to demography (Figures 5a–f) indicators (women, elderly population density (+65 age), early age (<5 years age), women reproductive age, working age population, and total population), environmental indicators (Urban LULC, degraded land, impervious surfaces, built up area, dry bare soil area, building density, and roof typology), and climatological factors (LST, and mean air temperature).
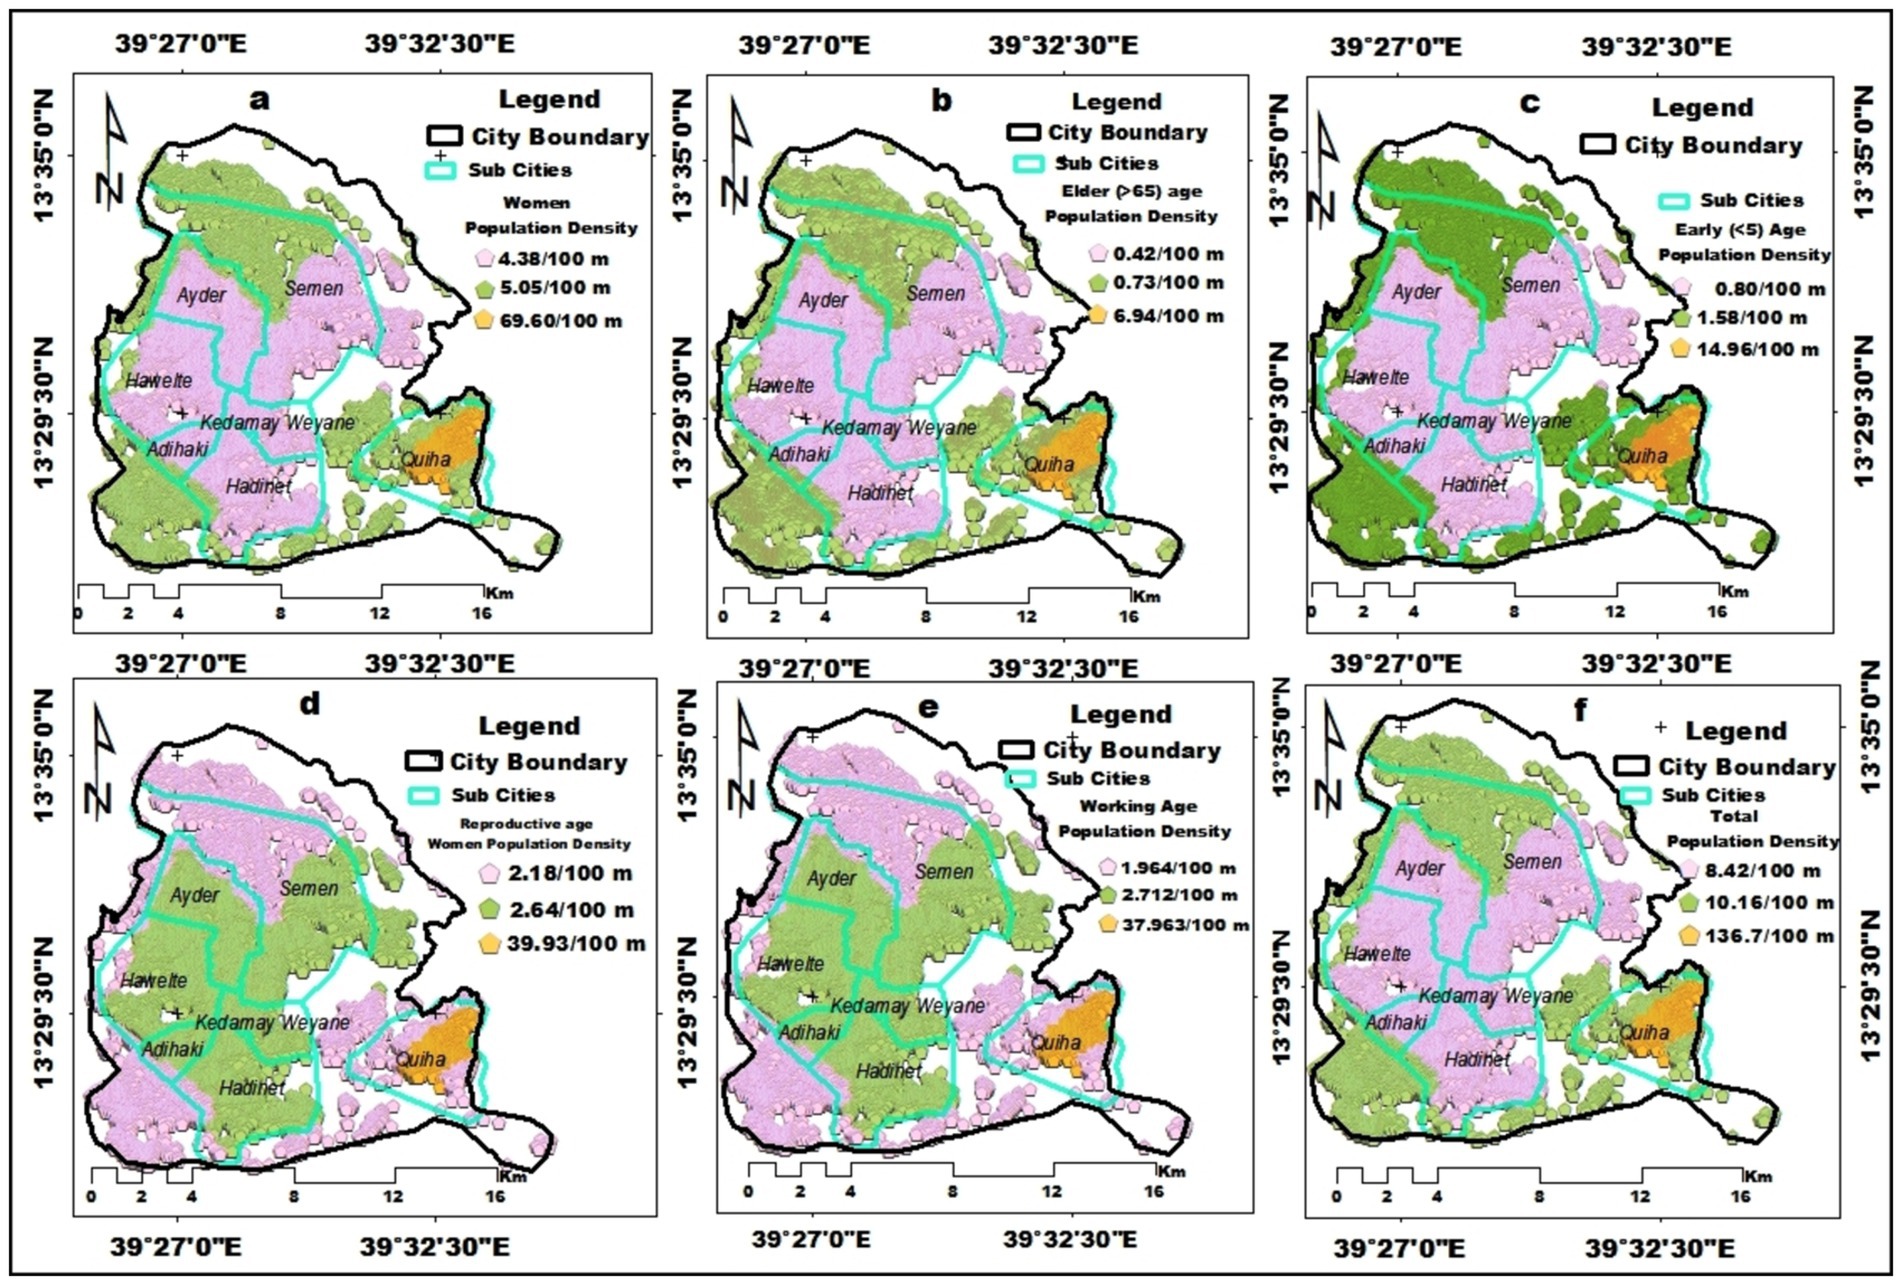
Figure 5. Spatial distribution of population density. (a) Women, (b) elderly age, (c) early age, (d) women reproductive, (e) working age, and (f) total population density.
Numerous studies have indicated that the populations most at risk from severe urban heat waves and rising temperatures include the elderly, pregnant women, children, and very young individuals. The elderly (over 65 years old) and pregnant women are particularly vulnerable due to their decreased ability to adapt to extreme weather, limited mobility, weakened immune systems, and higher prevalence of preexisting health conditions compared to other age groups. They are more susceptible to the adverse health effects of prolonged heat waves (Imran et al., 2021; Rathi et al., 2021; Jagarnath et al., 2020). Additionally, heat exposure can affect the productivity of working-age individuals, which has direct implications for economic output (Fall et al., 2023; Jagarnath et al., 2020; Wu et al., 2013; Tan et al., 2010).
The impervious (bright, medium, and dark impervious surface) which were determined using the BCI technique (Figures 6a and c), were used to establish four UHV classes (Table 6). Impervious surfaces such as asphalt, concrete, and buildings affect the surface energy balance by reducing cooling processes, altering air flow patterns, and impacting local climate conditions. These surfaces absorb solar radiation during the day and subsequently re-radiate and emit it as long-wave radiation (Mohajerani et al., 2017).
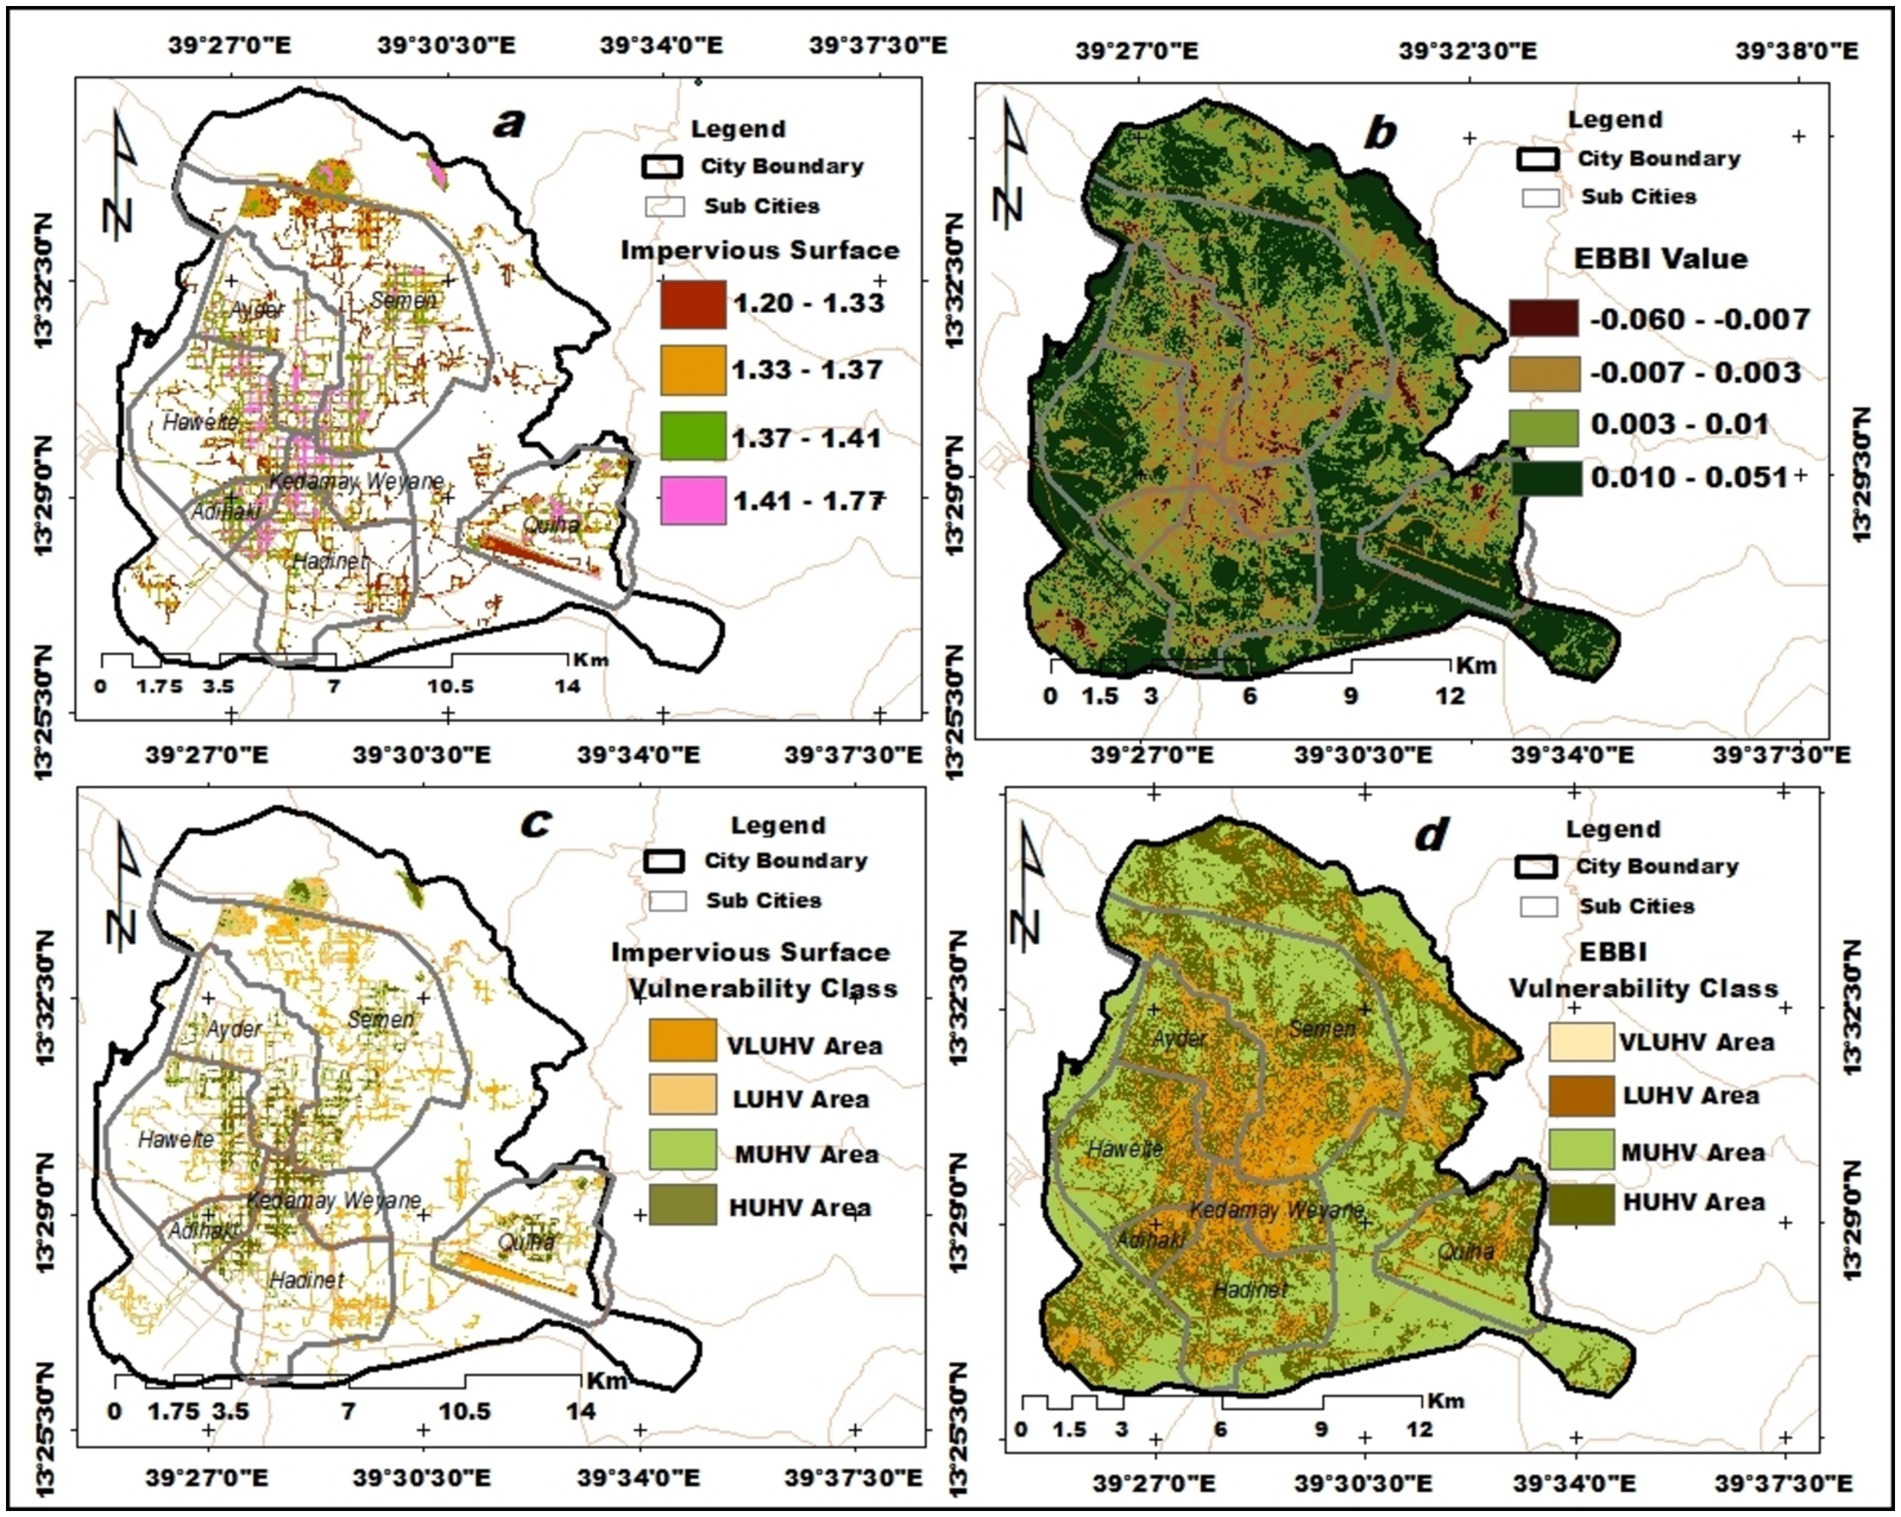
Figure 6. Spatial distribution of UHV. (a) BCI value, (b) EBBI value, (c) BCI vulnerability class, and (d) EBBI vulnerability class.
This is a significant contributor to higher temperatures and the formation of the urban heat island effect (Hurduc et al., 2024; Fadhil et al., 2023). The cooling impact of evapotranspiration is minimal because impervious pavements keep water from leaking through (McGrane, 2016). Replace the impermeable pavements with pervious pavements that allow water to permeate, and it is predicted that the temperature will be able to drop a little. Impervious Surface.
A key factor exacerbating the Urban Heat Island (UHI) effect is the presence of built-up areas, characterized by dense concentrations of roads, pavements, buildings, and other impermeable surfaces. These areas contribute to reduced vegetation and evapotranspiration, alter the surface energy balance, and increase heat absorption, retention, air flow changes, and heat trapping (Mohajerani et al., 2017; Ikechukwu, 2015). The formation of UHIs is closely associated with built-up areas. As demand for such areas rises, both vegetation and arid lands are being replaced, leading to an increased EBBI value in Mekelle city, which ranges from −0.18 to 0.52, with about 81.6% of the city’s surface covered by built-up areas (Table 6). This expansion has led to a densely packed city with high Urban Heat Vulnerability Index (HVI) scores (Figures 6b and d).
Although bare soil alone is not the only factor contributing to urban heat islands, its properties play a major role in the processes of heat absorption and retention that amplify the impacts of UHI in urban settings. When compared to vegetated surfaces, bare soil usually has a lower albedo, or reflectivity (Sultana and Satyanarayana, 2020). This indicates that higher surface temperatures result from bare soil absorbing more solar radiation. Increased heat absorption and higher local temperatures can occur in urban settings where there is a substantial quantity of bare soil as a result of infrastructure development. Hence the result obtained using the DBSI spectral induce value (Figures 7a,b) for Mekelle city reveled that, the spectral ranges extended from −0.43 to 0.31 and 31% the city area covered with the dry bare soil land (Table 6).
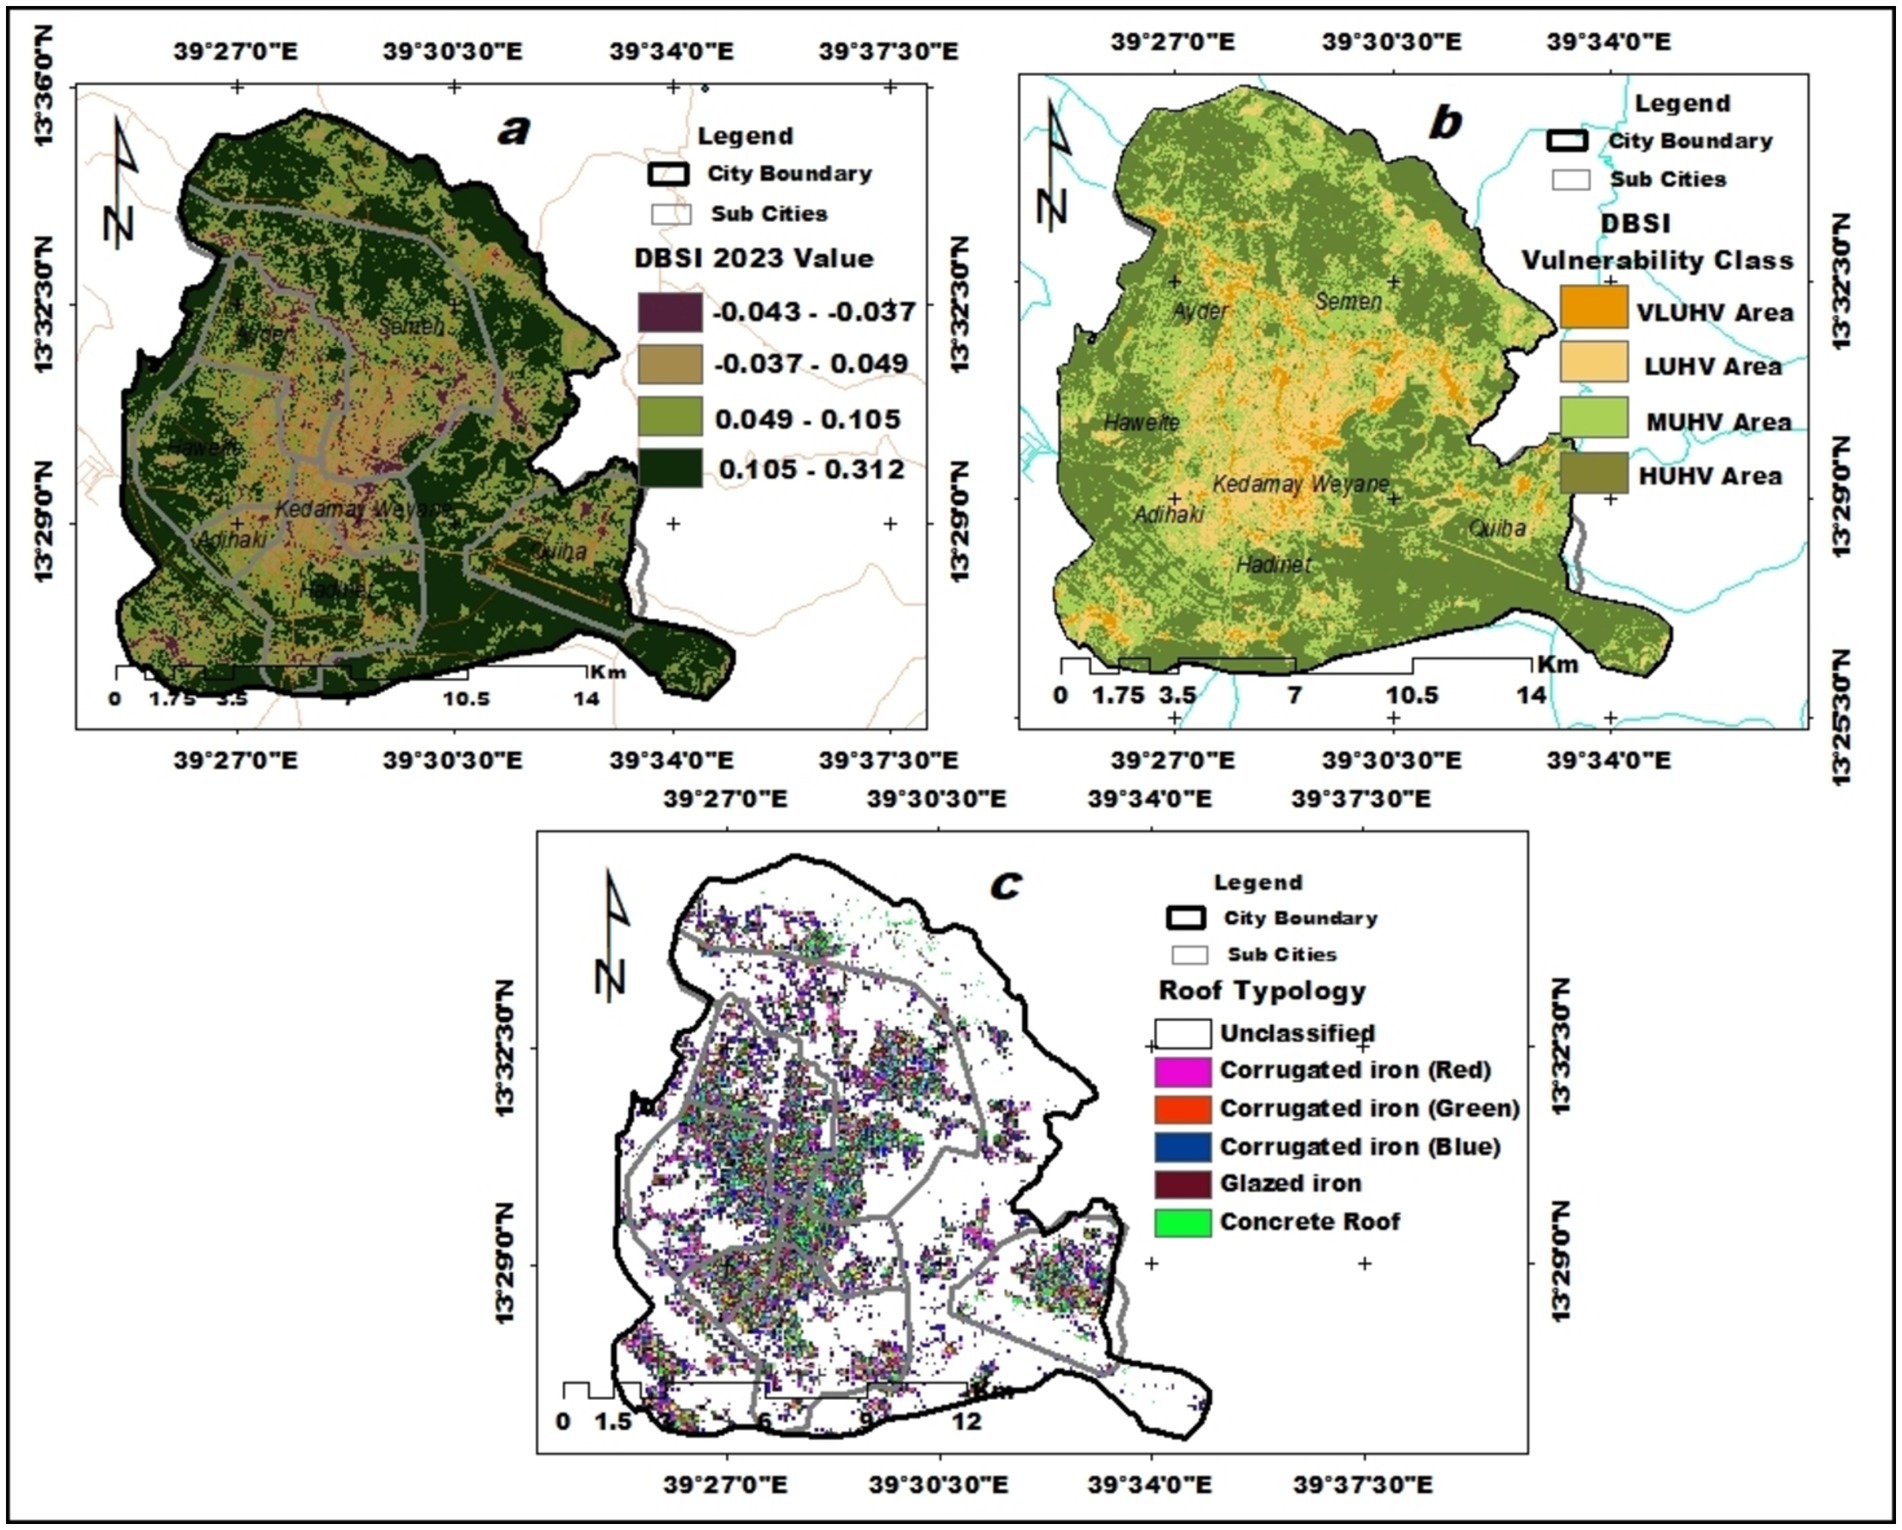
Figure 7. Spatial distribution of UHV. (a) Dry bare soil index (DBSI); (b) DBSI vulnerability class, and (c) roof typology.
Meanwhile, in order to ascertain their function in risk and susceptibility potential to heat exposures, this work has attempted to elucidate the spatial distribution and type of roof typology. The kind and variety of the city’s building roof typology were determined using the pixel based supervised classification methods. Most buildings in the city seem to have corrugated iron roofing (that is glazed in various shades of red, green, and blue) and concert roofing specifically appearing on high-rise structures.
In Quiha sub-city, especially in the southeastern area, very few buildings are identified as vernacular structures known locally as Hïdmo. These buildings typically feature wooden ceilings, masonry walls, and soil roofs. Due to the low resolution of satellite images, it is challenging to differentiate the reflectance values of soil-roofed buildings from the surrounding dry bare soil. This limitation hinders the study’s ability to accurately assess the potential impact and influence of these structures. As a result, the effects of these types of buildings are not included in this research (Figure 7c).
As per Wong (2005), roofs account for 26% of the total metropolitan area and play a crucial role in mitigating the urban heat island effect. It also says that by absorbing heat and cleaning the air, green roofs contribute to maintain low temperatures, because they can absorb water, they help to postpone the duration of runoff, which keeps cities colder for longer and consequently lowers the temperature because the roof itself stays colder (Getter and Rowe, 2006). Nevertheless, because green roofing uses less energy, the building’s energy balance will remain (Sharma et al., 2018; Getter and Rowe, 2006; Carter and Fowler, 2008). Building energy balance, urban heat island development, and sustainable urban expansion are significantly impacted by the urban compactness ratio (UCR), which by Shahfahad et al. (2021) defines as the quantity of built-up area per square meter. To assess the potential vulnerability of different roof types to UHI risks, the study cross-referenced land surface temperature (LST) data with the various roof types present in the city. It was found that 48% of corrugated iron roofs, whether uncoated or coated in red or green, were associated with higher LST, while 35% of concrete-roofed structures showed lower average LST. These findings contrast with results from other studies conducted in the USA, such as those by Getter and Rowe (2006) and Carter and Fowler (2008) in Chicago, which reported different patterns.
The results from the building density analysis indicate that substantial concentrations of buildings are found in the southwest, southeast, and central parts of Mekelle city (Figure 8a). In general, a higher concentration of built-up areas is likely to increase UHI vulnerability (Table 6). Urban areas with high population densities, dense built-up regions, impermeable surfaces, and elevated land surface temperatures (LST) are usually expected to have a higher heat vulnerability index.
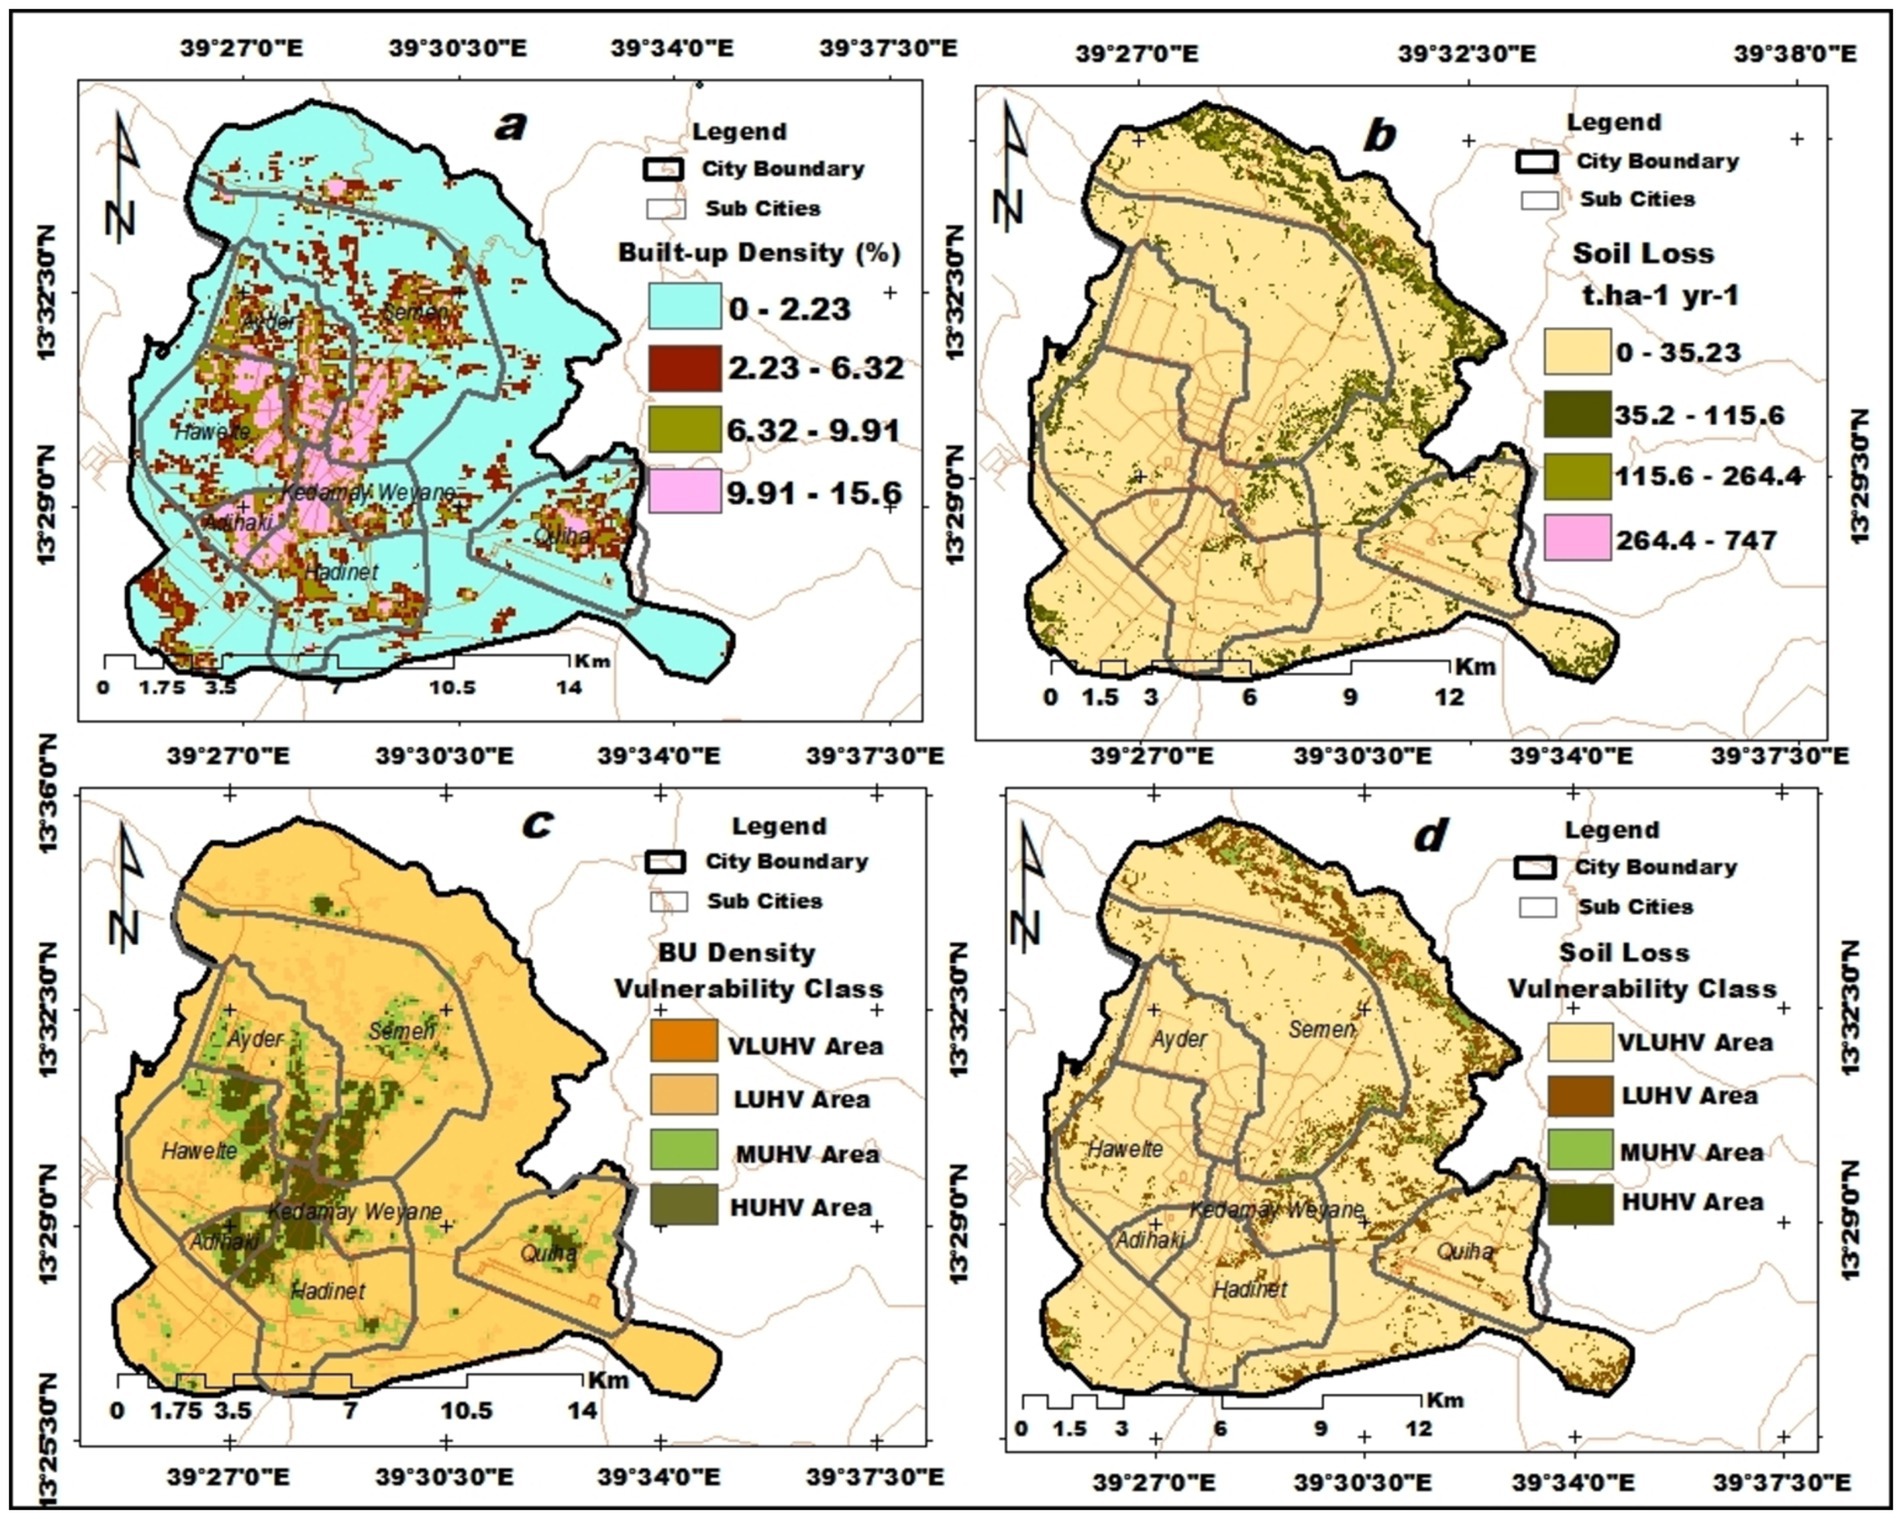
Figure 8. Spatial distribution of UHV. (a) Urban Built-up density (UBD), (b) degraded land, (c) UBD vulnerability class, and (d) degraded land vulnerability class.
However, this does not guarantee that these areas will consistently experience severe urban heat vulnerability. The UHI effect, driven by greater heat absorption and retention by buildings, roads, and other infrastructure, typically results in higher LST in urban areas compared to surrounding rural regions (Fuladlu et al., 2018). Human activities primarily drive this UHI impact by altering heat exchange systems and changing land surfaces. Buildings and roads, which absorb and re-radiate solar energy more effectively than natural surfaces, play a significant role in this process (Fadhil et al., 2023; Vujovic et al., 2021).
At a specific height above the ground, air temperature is defined as the temperature of the air that surrounds the Earth’s surface. LST has an impact on it, but other variables like humidity, atmospheric circulation, and regional weather patterns can also cause variations (Naserikia et al., 2023). LST directly affects local air temperatures in cities; higher air temperatures can also lead to higher LST since they decrease evaporative cooling and increase heat retention in urban structures (Fadhil et al., 2023). The LST distribution map produced by identifying hotspots in urban areas using Landsat thermal bands is displayed in Figure 9.
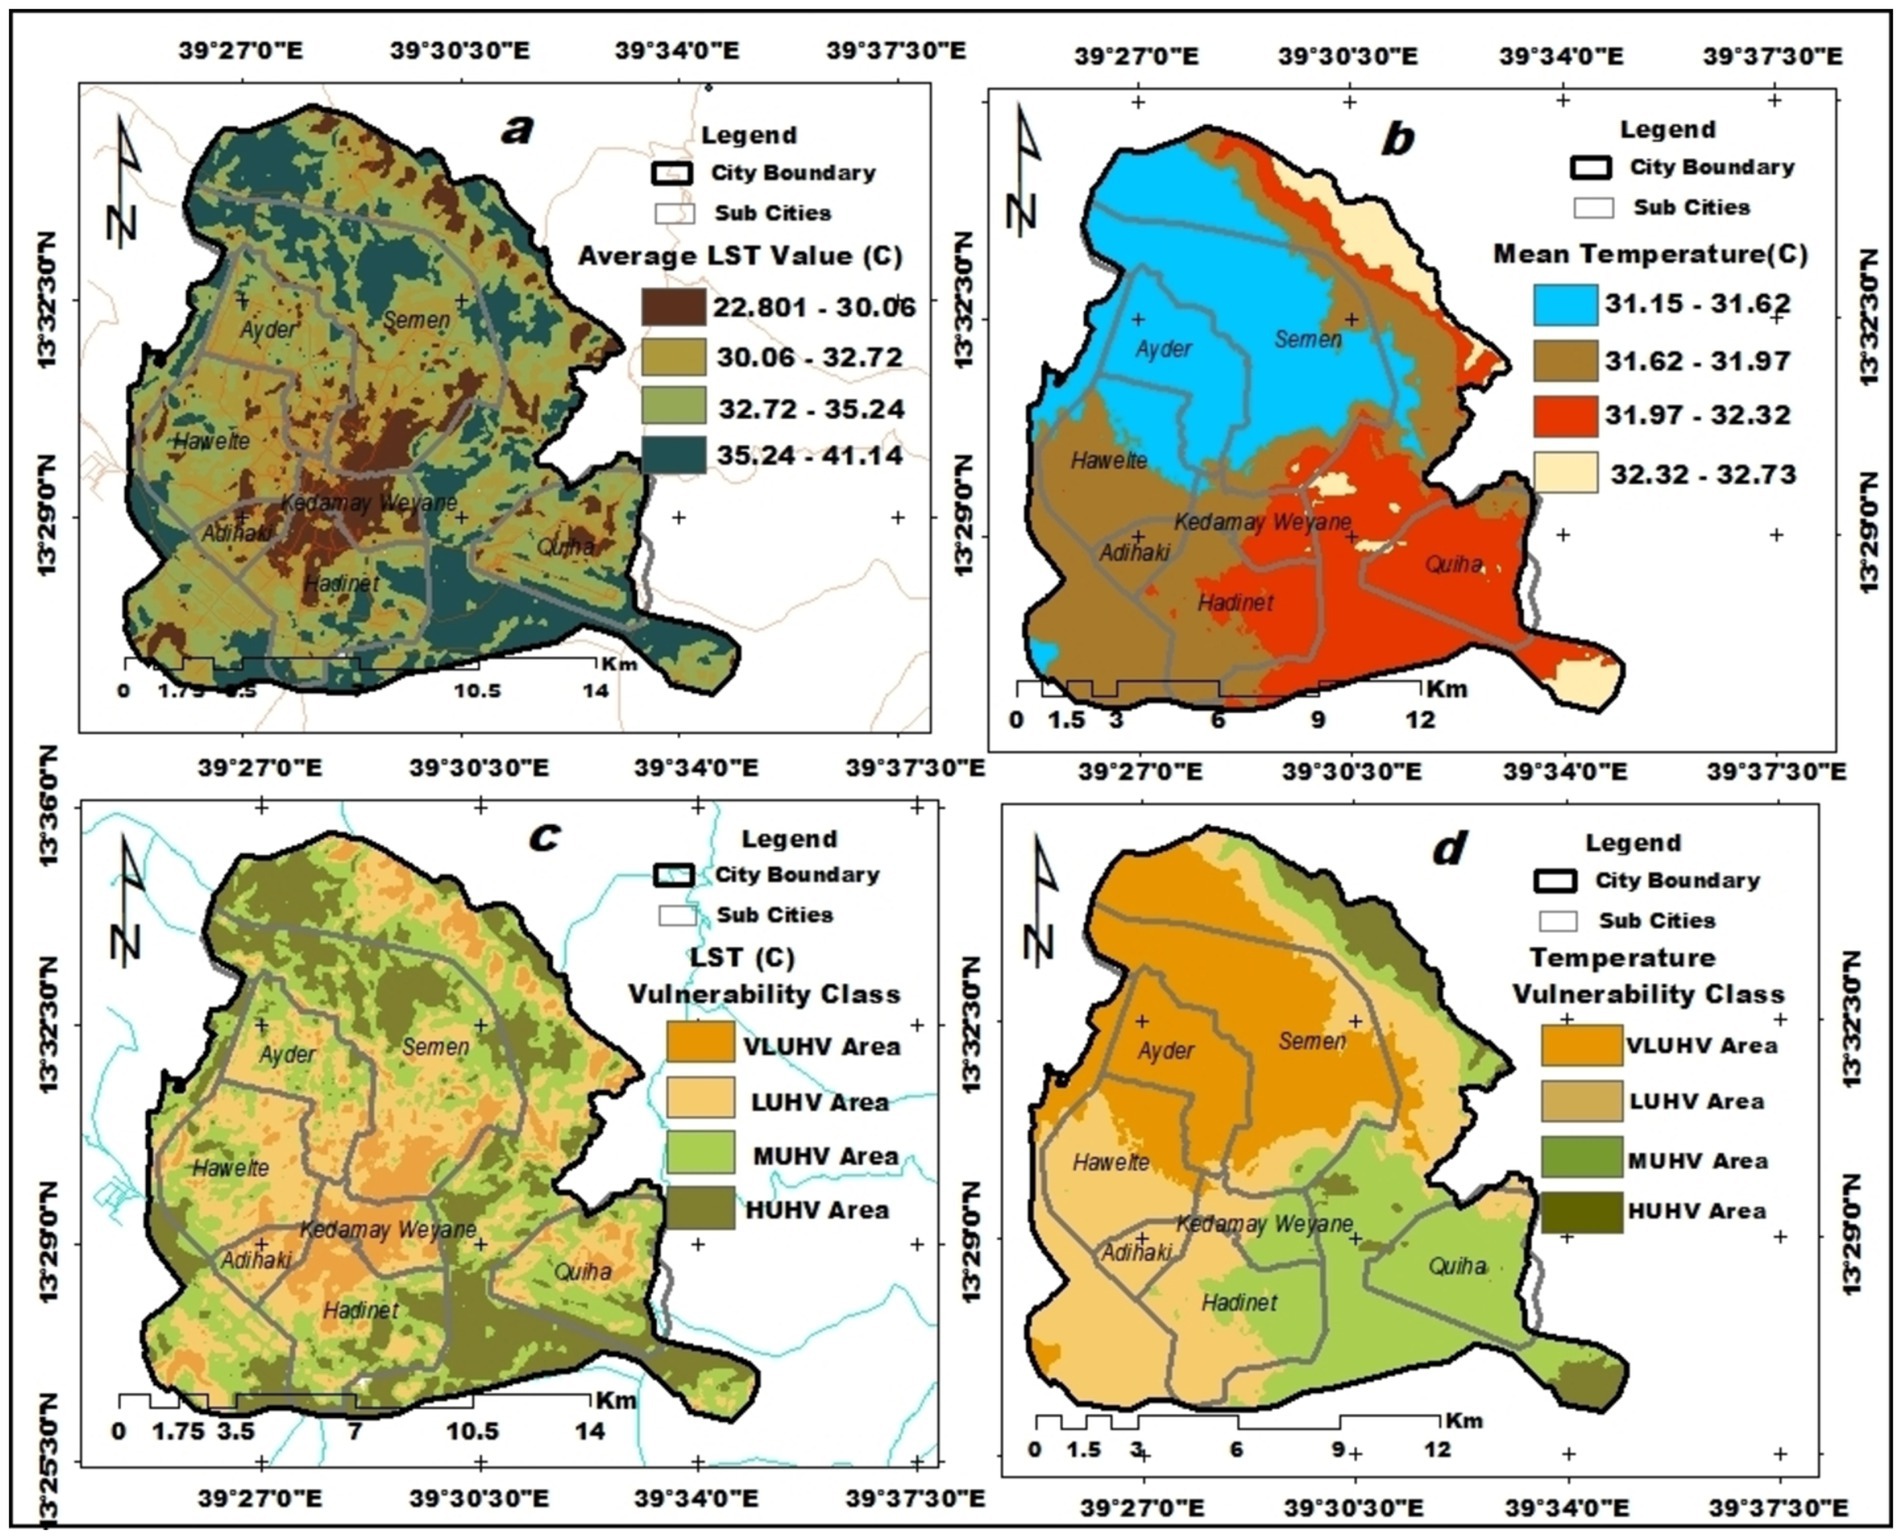
Figure 9. Spatial distribution of UHV. (a) Land surface temperature (LST), (b) mean air temperature, (c) LST vulnerability class, and (d) temperature vulnerability class.
The UHI impact is intensified by higher LST and air temperatures, which increases the susceptibility of urban residents and infrastructure to heat stress. The highest LST and hotspot area was found in the northeastern and central parts of the city; these areas were also characterized by greater densities of roads and buildings, high proportion of impermeable surfaces, poor vegetation coverage, and more barren lands.
3.4 Spatial distribution of adaptive composite indictor (CI-adaptive)
Adaptive indicators can explain the biophysical characteristic that allows one to withstand excessive heat in metropolitan areas. The adaptive composite indicator, which includes the SAVI, relative humidity, MNDWI, and UTFVI, was employed to ascertain the area’s vulnerability to excessive UHV.
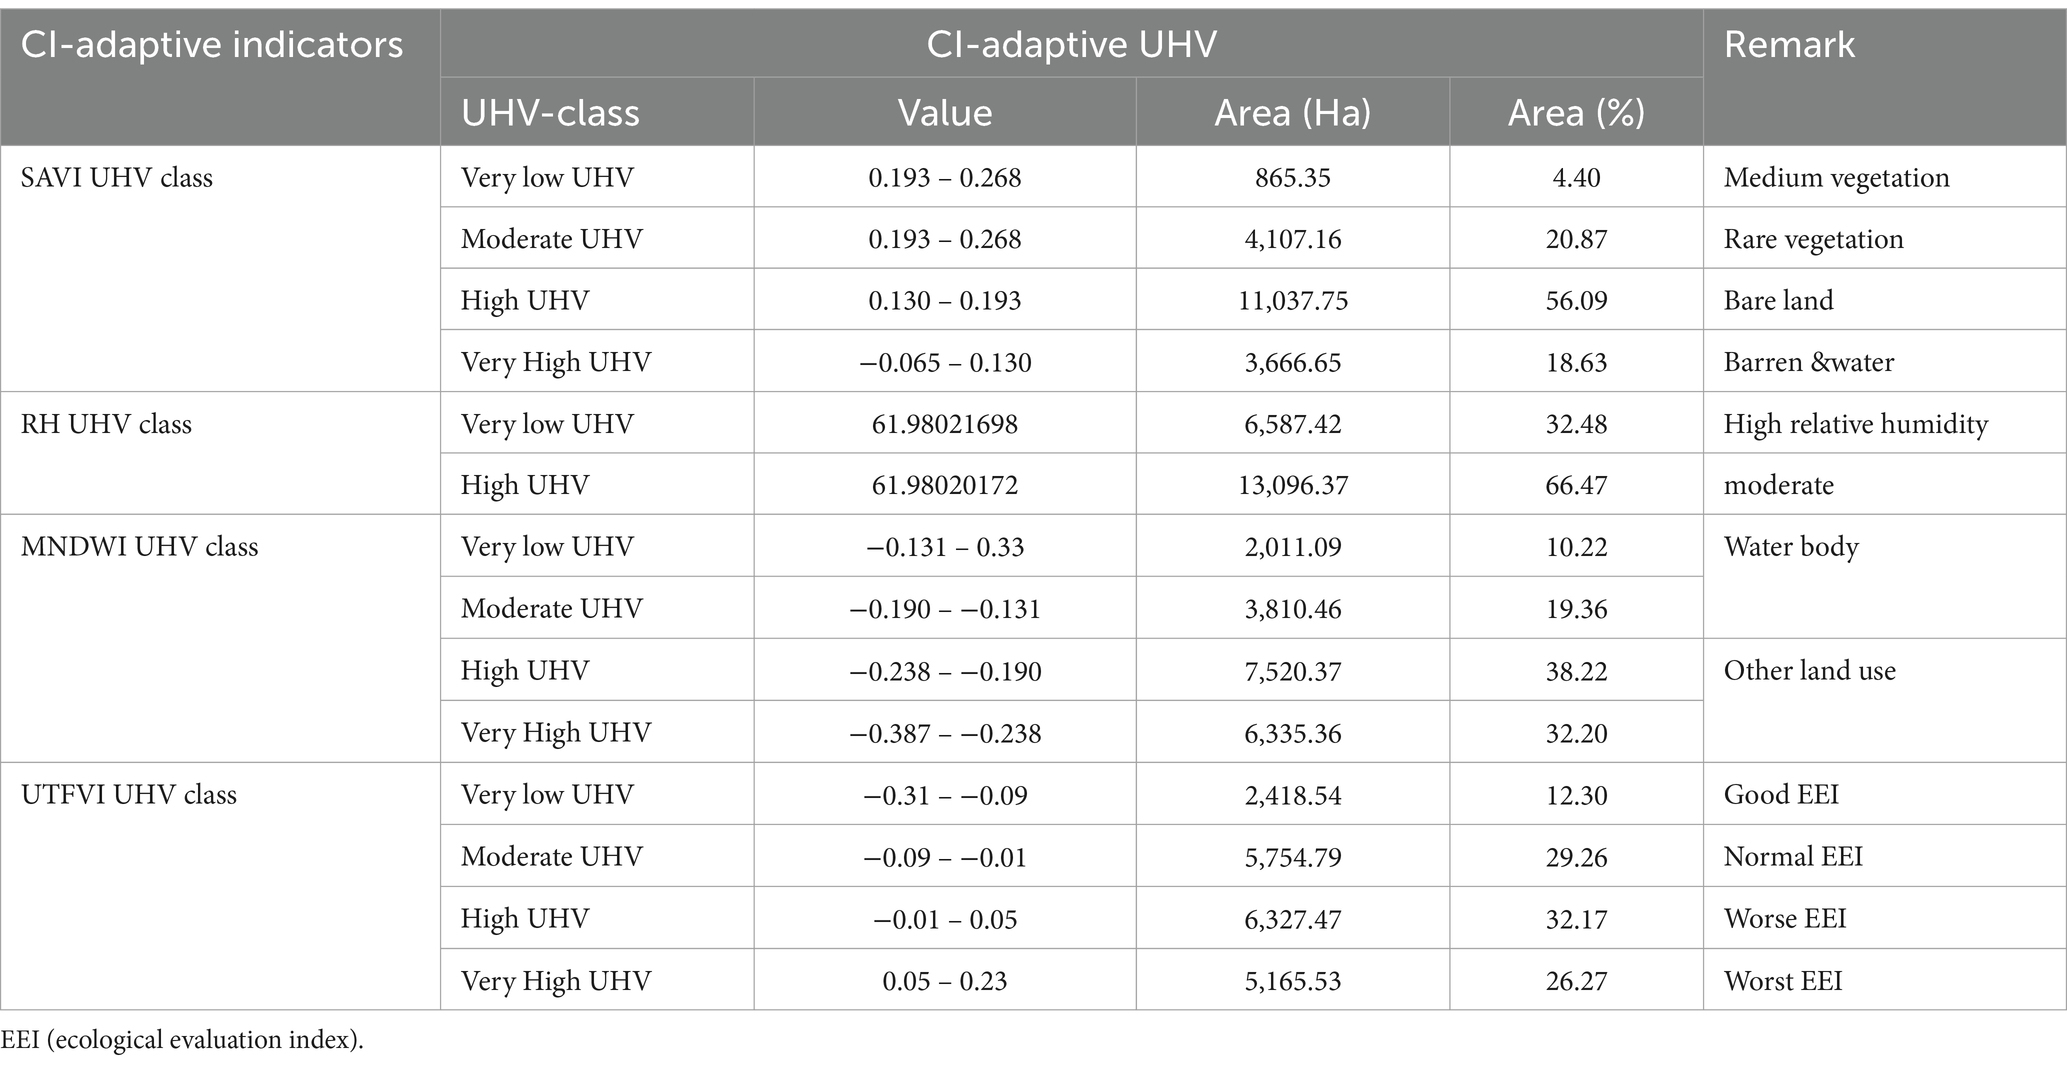
SAVI spectral analysis indicates that the city generally has a moderate amount of urban forest cover, with significant areas of dense vegetation found along the riverbanks and atop Mount Inda Yesus. This vegetation helps to lower land surface temperatures, which in turn reduces the HVI index score. The SAVI values were found to range from −0.162 to 0.518 (Table 7). According to a previous study by Tesfamariam et al. (2023), there has been a 0.86% (9.93 hectares) reduction in urban forest cover since 2000, primarily due to urban infrastructure expansion. The study also highlighted changes over the past 40 years, including increased development of residential areas and roads, decreased open soil-covered spaces, and an increase in subsurface water levels. Vegetation typically possesses a higher albedo, or reflectivity, than built-up surfaces like asphalt and concrete. This allows it to reduce the absorption of solar radiation, hence lowering surface temperatures. Lower air temperatures and consequently lower land surface temperatures (LST) are typically correlated with higher amounts of vegetation. This decreases the intensity of the UHI effect (Deng et al., 2024; Worku et al., 2021).
The SAVI images were classified into five vegetation classes dense vegetation, medium vegetation (shrubs), rare vegetation (cropland and grassland), and barren land (rocky, and built-up areas) and water bodies (Figures 10a,c) and reclassified in to four heat vulnerability class. It suggests that higher amounts of vegetation cover tend to lower UHI intensities due to the cooling effects of shading, evaporative cooling, and less heat absorption (Table 7).
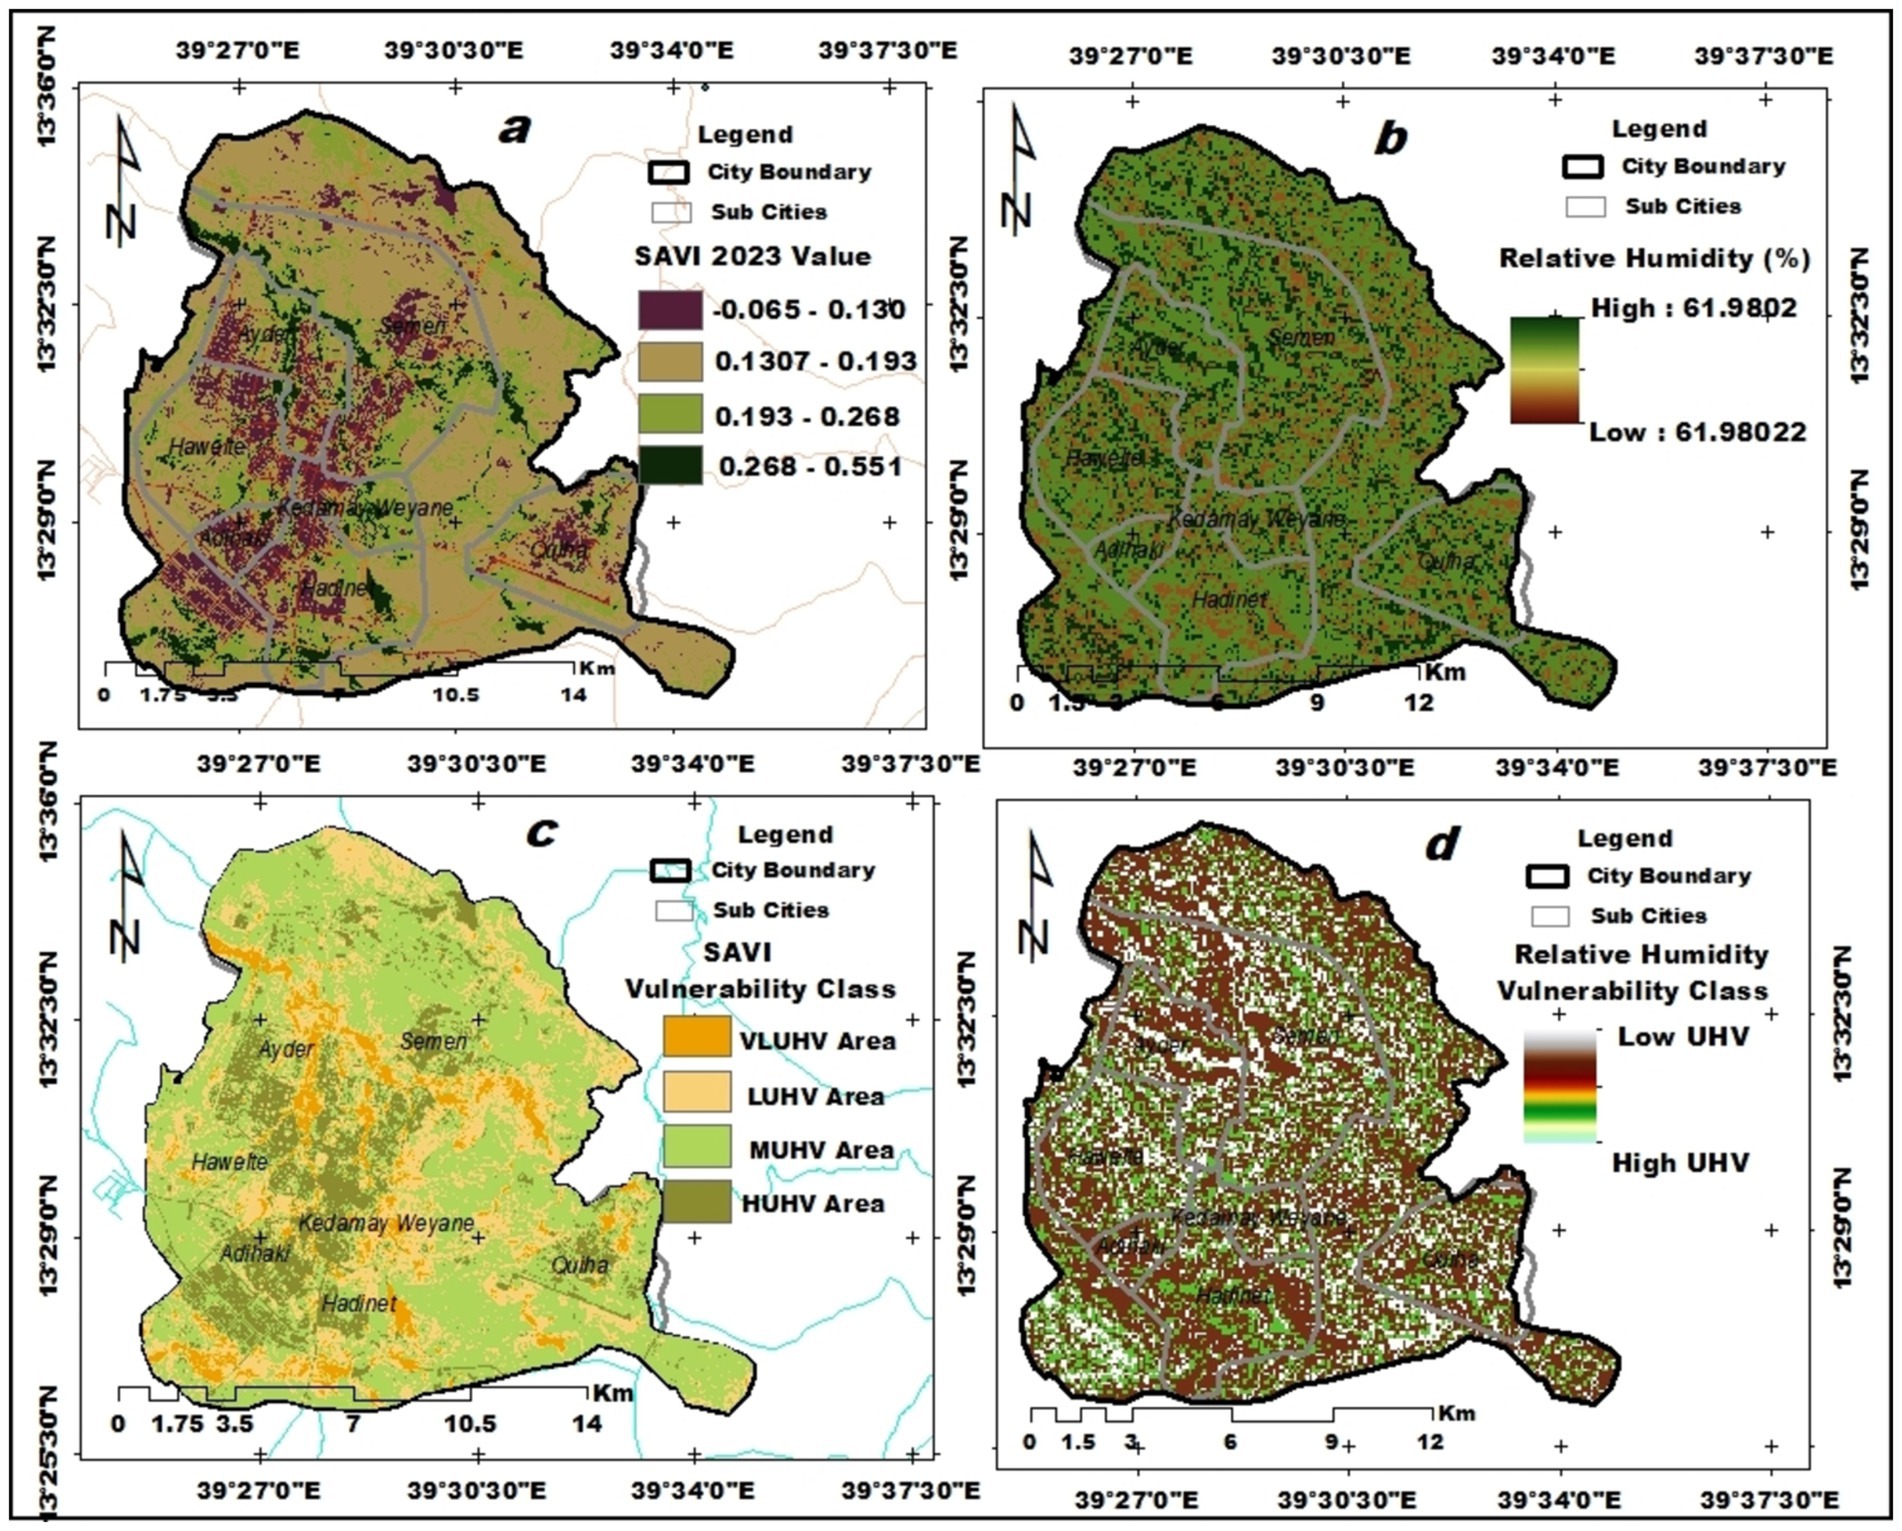
Figure 10. Spatial distribution of UHV. (a) Vegetation cover, (b) relative humidity, (c) SAVI vulnerability class, and (d) relative humidity vulnerability class.
Although urban heat island (UHI) predominantly affects temperature, depending on the local environment, it can also indirectly affect relative humidity levels. The relationship between the Urban Heat Island (UHI) effect and relative humidity (RH) is complicated and depends on a number of variables, such as local climate features, weather patterns, and urban morphology (Hass et al., 2016). In urban areas, particularly those impacted by UHI and having high thermal mass (such as concrete and asphalt), the local temperature might be greater than in rural areas, particularly at night (Mohajerani et al., 2017).
Warmer air has the capacity to hold more moisture, which can lead to a decrease in relative humidity if the absolute humidity remains constant or increases more slowly than the temperature (Ruslan et al., 2019). Higher temperatures combined with lower relative humidity (common in urban areas due to UHI) can affect human comfort and health (Hass et al., 2016). Low relative humidity levels can contribute to increased evaporation rates and potential dehydration, while high temperatures exacerbate the discomfort (Table 7; Figures 10b,d).
Water bodies are crucial in mitigating the effects of urban heat island effects due to their inherent cooling and heat-sink properties. Water can help lessen the intensity of the UHI effect by using evaporative cooling and reducing the amount of heat absorbed by nearby surfaces. Moreover, it possesses qualities of thermal inertia, or a greater specific heat capacity than land. Due to its slower absorption and release of heat than land, water bodies are able to maintain more constant temperatures across time (Wallace and Hobbs, 2006). Thus, the open water spatial distribution of the city was mapped using the well-known MNDWI spectral induce mathematical index proposed by Xu (2006). The MNDWI map was categorized into classes linked to water and non-water (Figures 11a and c) using the suggested threshold (Xu, 2006). It is also further categorized and evaluated in relation to vulnerability class (Table 7).
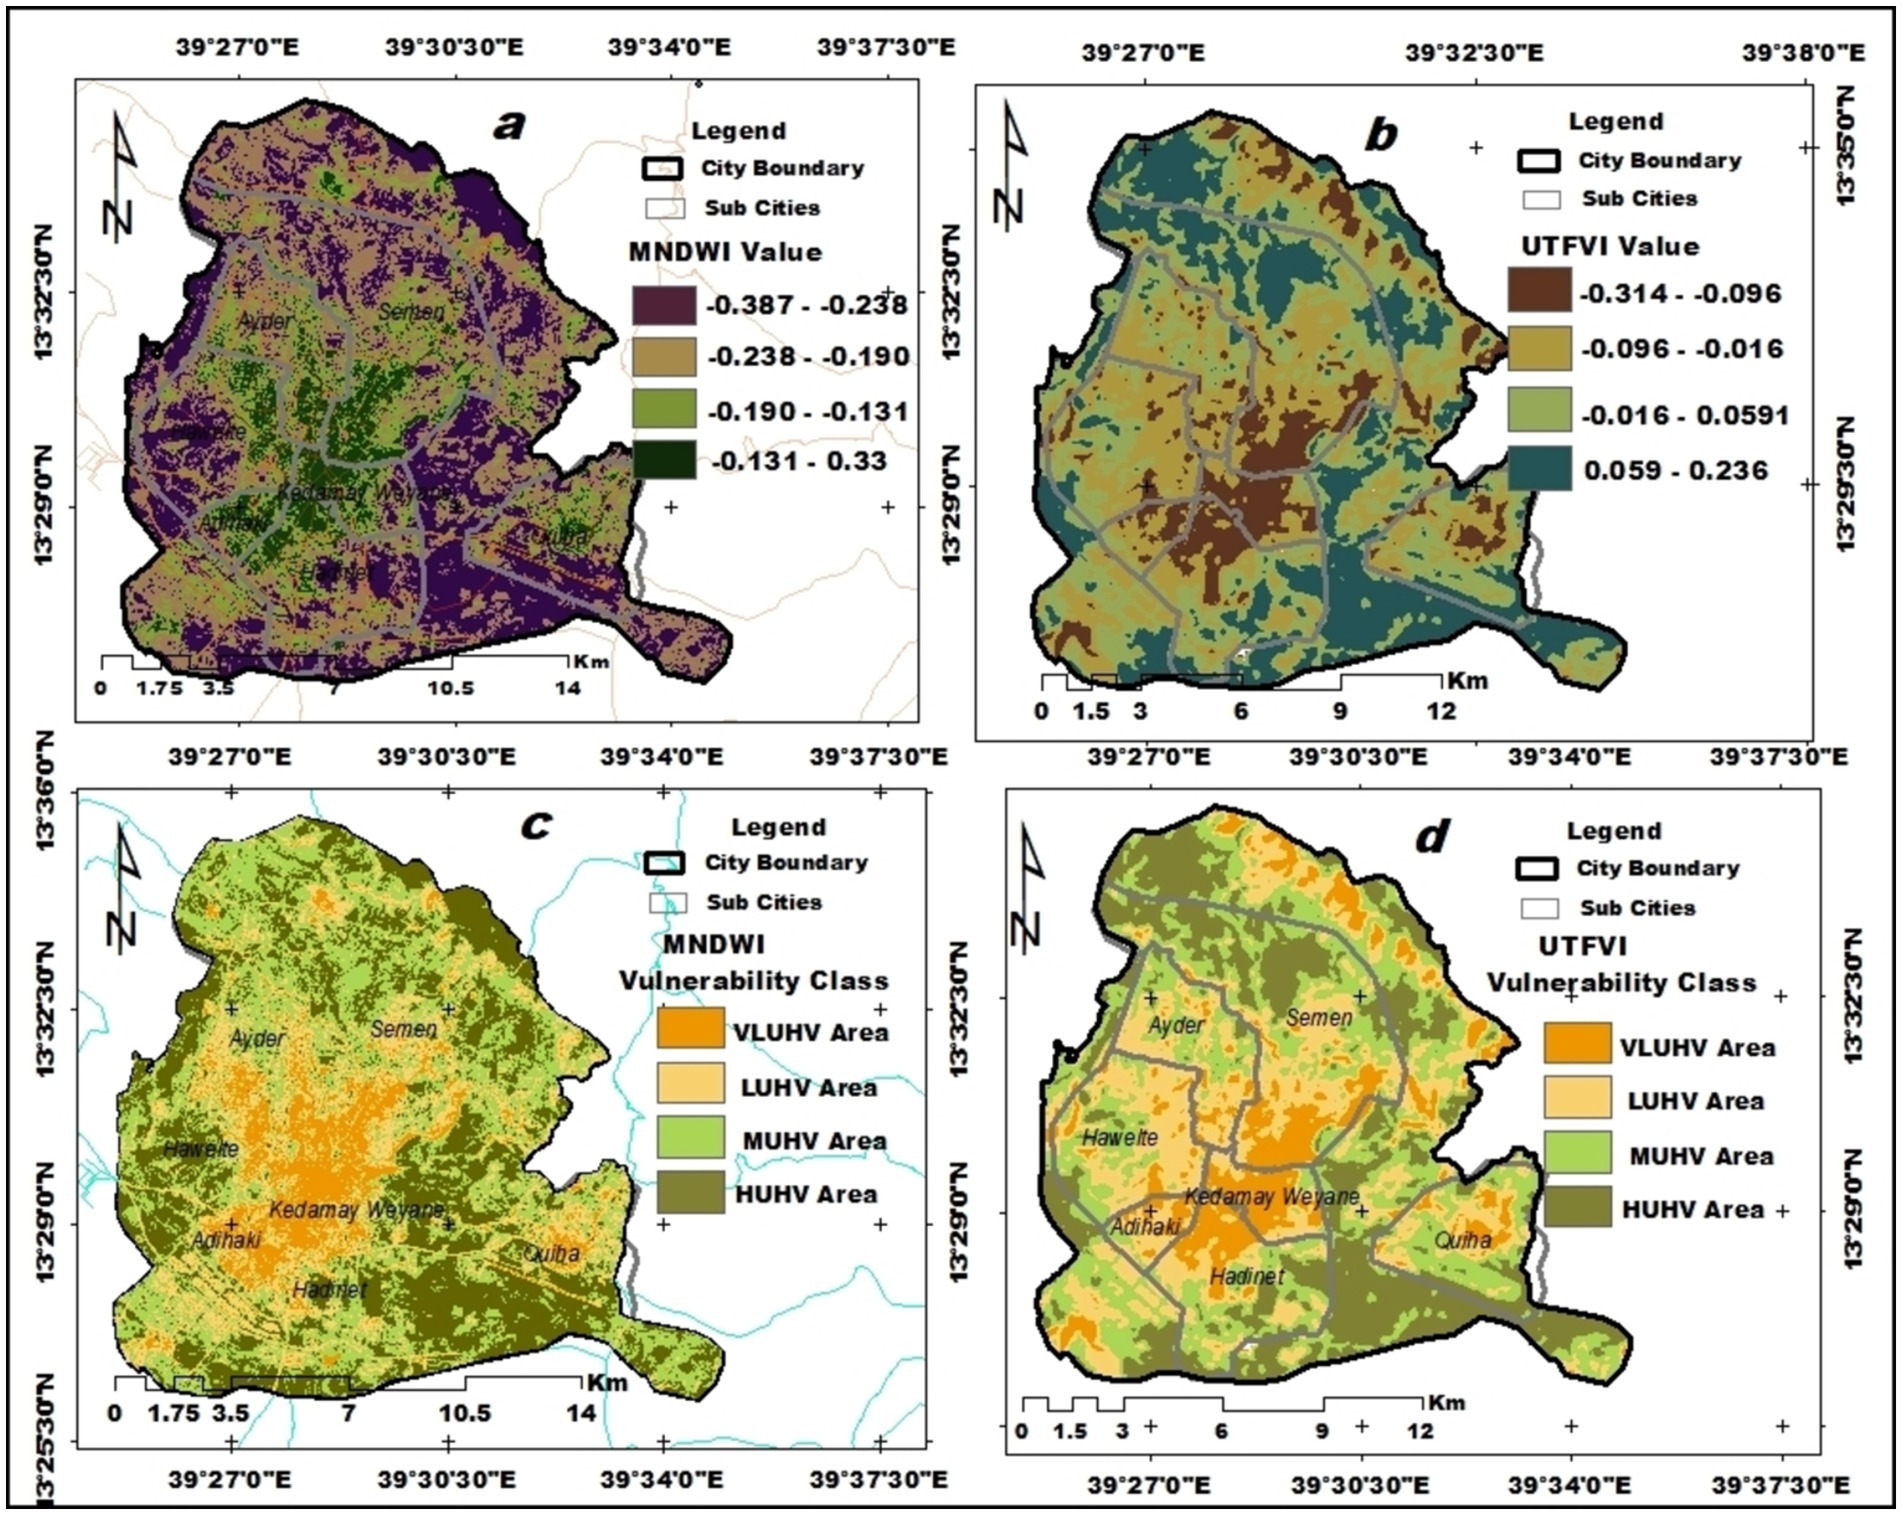
Figure 11. Spatial distribution of UHV. (a) Modified normalized difference water index (MNDWI), (b) urban thermal field variance index (UTFVI), (c) MNDWI vulnerability class, and (d) UTFVI vulnerability class.
The UTFVI can assess how vulnerable urban residents are to the effects of UHI (Figures 11b,d). This index, widely used for evaluating surface UHI effects with high precision, was applied in this case (Al Kafy et al., 2021). The prevalence of impermeable surfaces, such as concrete roads and city buildings, has replaced natural areas like forests and rivers. This significant decrease in surface transpiration intensifies UHI impacts by increasing the proportion of sensible surfaces and decreasing latent surfaces (Zhang et al., 2024). UTFVI concentration is higher when the area is significantly warmer than surrounding areas (Table 7). The notable impacts of UTFVI include negative effects on local wind, humidity, air quality, reduction in comfort and increased mortality rate, indirect economic losses (Nuruzzaman, 2015).
3.5 Urban heat vulnerability assessment using principal component exploratory factor analysis (HV-PC-EFA)
3.5.1 Factor analysis using principal component analysis
To identify potentially vulnerable areas in the city, approximately 19 indicators were selected based on attributes recommended in the literature (Tables 1–3). In the initial phase of the Principal Component Analysis (PCA), a correlation matrix is created to assess data suitability. The Bartlett’s Test of Sphericity and the Kaiser-Meyer-Olkin (KMO) measure are used for this purpose. The Bartlett’s Test, with a KMO value of 0.582, produced a significant result of 0.00, indicating suitability (p < 0.05). The correlation matrix showed a coefficients at 0.3 or higher (Pallant, 2005). The variance in the raw vulnerability indicators is explained by three independent components, accounting for 64.41% of the total variance. The first component explains 27.59%, while the second and third components account for 25.21 and 11.61%, respectively. The first component includes indicators such as population density (0.996), density of elderly population (0.996), density of early age population (0.995), density of women of reproductive age (0.994), and working age population density (0.996). The second component, according to the rotating component matrix, includes DBSI (0.920), EBBI (0.895), LST (0.816), UHI (0.816), and BU density (0.814). The third component comprises mean temperature (0.558), MNDWI (0.704), and BCI (0.685).
3.5.2 Spatial distribution of HV-PC-EFA
After conducting a three-component PCA on the raw vulnerability indicators, the components related to adaptive capacity, sensitivity, and exposure potential were reorganized and combined using the inverse geometric aggregation method. Table 8 illustrates the results for the exposure component, revealing that a substantial portion of the city is classified as very low vulnerability. Specifically, 22.5% of the area (4,426.3 hectares) is deemed extremely sensitive, while 25.8% (5,064.36 hectares) is identified as highly susceptible.
By combining sensitivity indicators such as DBSI, EBBI, LST, BU density, BCI, and Mean Temperature using PCEFA methods, a sensitivity map showing the spatial distribution of the composite indicator was created. This map reveals a distinct pattern: higher HVI values are concentrated in the southeast, while lower HVI values are found in the central area of the city near the riverside (Figure 12b). The results of this analysis showed that 73% of the urban area was affected by HIV, with rates ranging from moderate to very high. The portions of the urban area that are least susceptible to HIV account for 11.8% (2,332.2 ha) of the total area (Table 8).
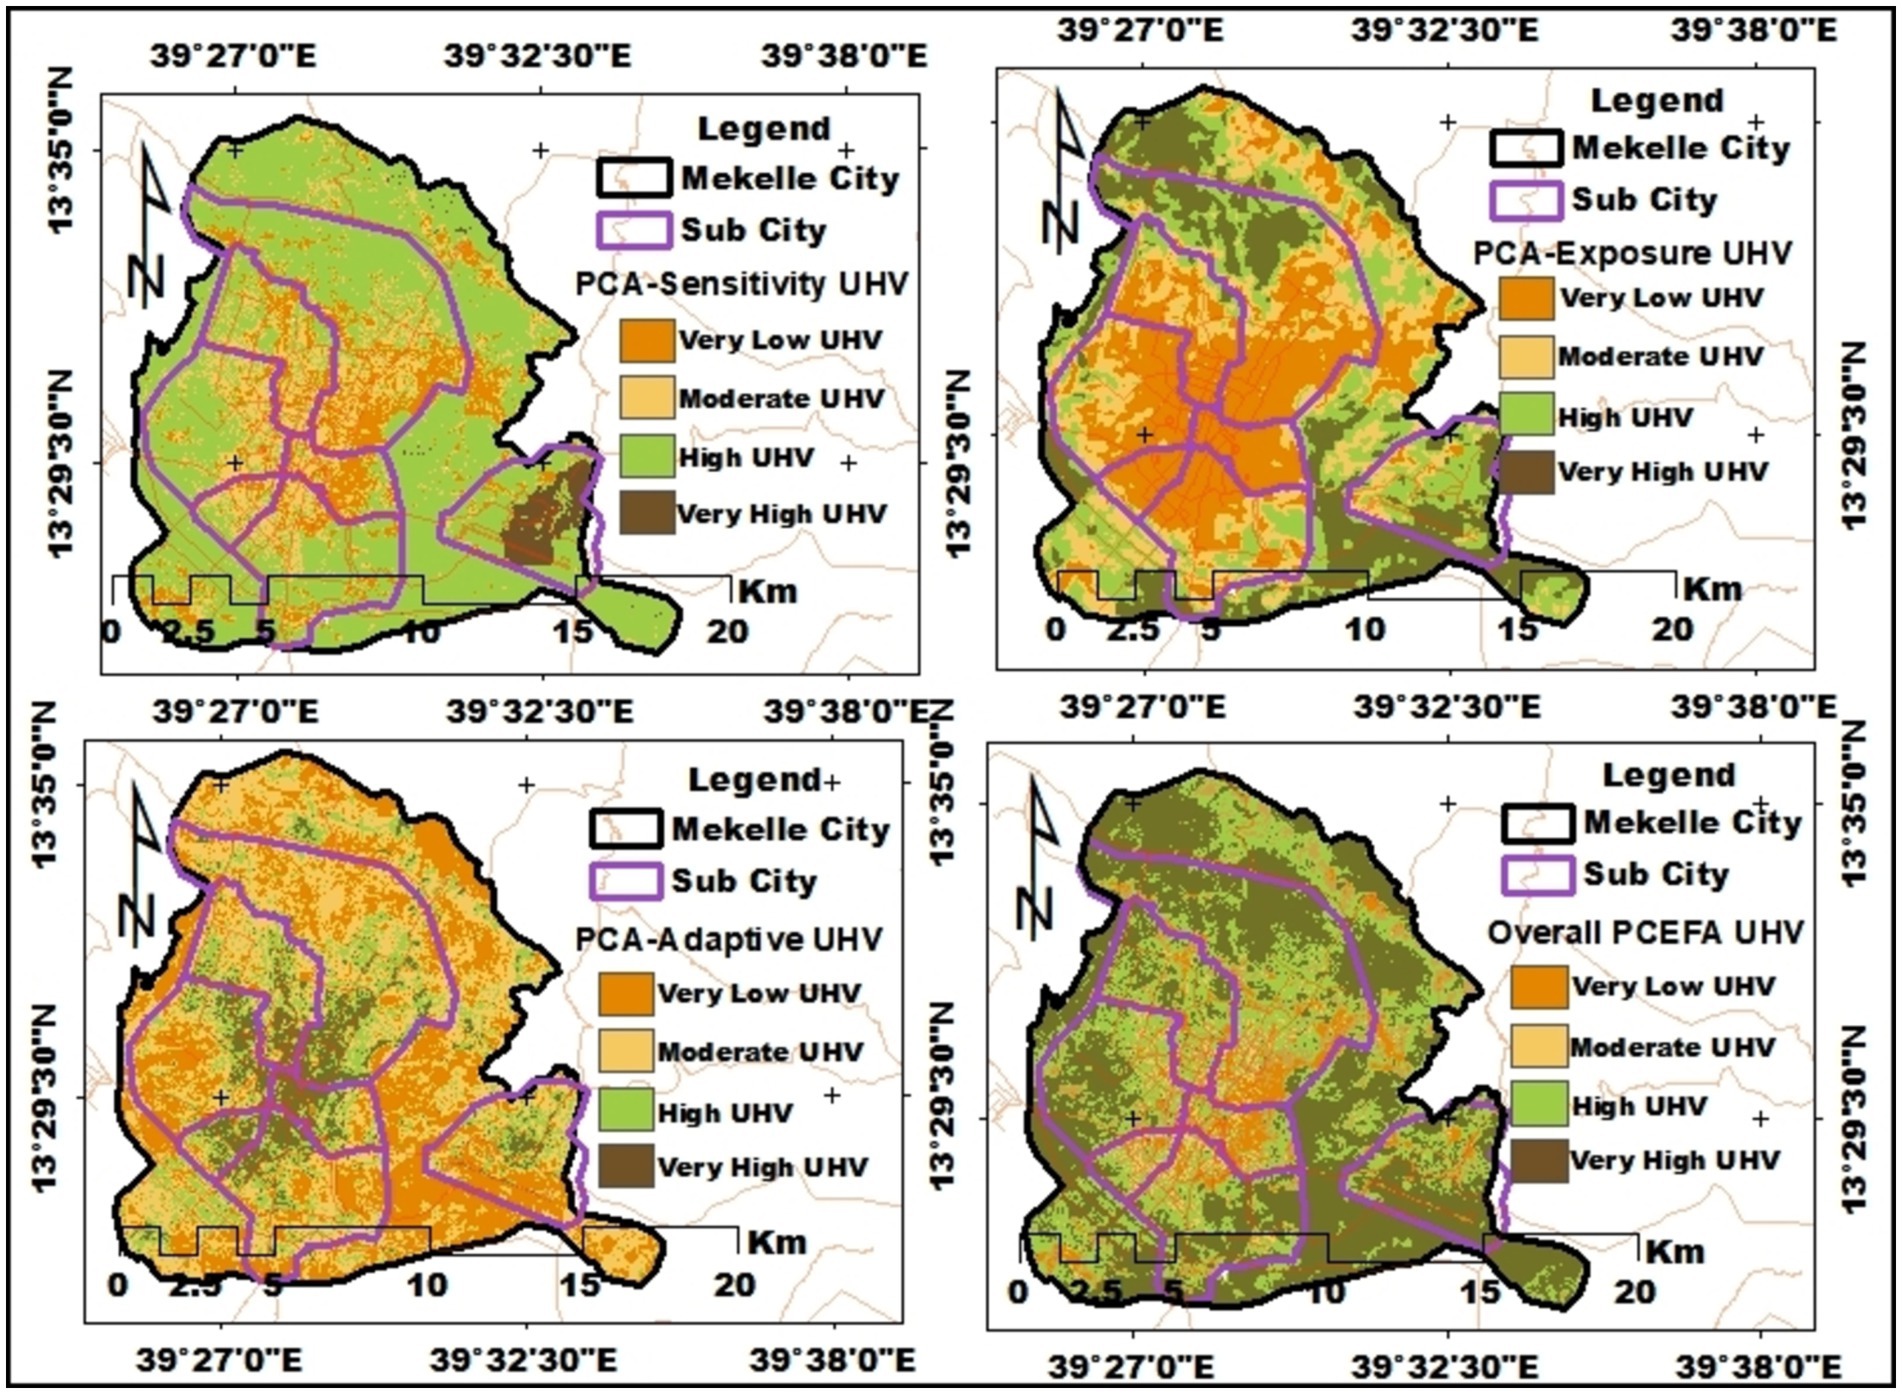
Figure 12. Spatial distribution of heat vulnerability using HV-PC-EFA. (a) PCA-exposure, (b) PCA-sensitivity, (c) PCA-adaptive, and (d) overall HV-PCEFA.
The MNDWI indicator is the sole adaptive component that the PC factor analysis method can explain. The HVI-PCA pattern adaptive component indicates that 70% of the city is frequently concentrated under the high and very high UHIV classes (Table 8). Using the un-weighted inverse geometric aggregation method, the exposure (Figure 12a), sensitivity (Figure 12b), and adaptive capacity (Figure 12c) features were combined to create the final HVI (Figure 12d).
It was observed that the sub-cities with the highest exposure HVI values are mainly located in the southeastern part of the city, which also has a relatively high population density. Areas most susceptible to UHI and exhibiting extremely high HVI values are concentrated in the northeast, northwest, and southeast regions of the city. According to the HVI-PCA pattern (Table 8), 24.3% (4,756.2 hectares) of the area has the highest HVI, 35.4% (6,928.13 hectares) has a high HVI, 26.5% (5,199.6 hectares) has a moderate HVI, and 13.6% (2,673.4 hectares) has the lowest HVI.
Quiha sub-city has been shown to have the highest level of risk (75%) due to its high sensitivity and high exposure (population density) then followed by Hadinet (46.9%), Hawellte (40.84%), and Semen (49.9%) according to the final HVI-PCA-EFA result. Because of its adaptability to Martiyar City Park, which has a widely dispersed tree cover, Kedamy Weyane sub-city is the least vulnerable (58%) despite having a considerable sensitivity level (Figure 12d).
3.6 Urban heat vulnerability assessment using IPCC UHIV index
In order to quantify multidimensional concepts, vulnerability is defined in terms of many composite indicator dimensions as opposed to being captured by a single indicator (Sidiqui et al., 2022). Adaptive potential component impact index (AI), sensitivity potential impact component (SI), and exposure potential impact component (EI) were computed using equally weighted inverse geometric aggregation, which has the virtue of partial compensability. According to Sidiqui et al. (2022), vulnerability is characterized using many composite indicator dimensions rather of being captured by a single indicator, in order to quantify multidimensional notions.
To calculate the exposure layers, all important exposure factors such as population density and the UHI layer were integrated using the inverse geometric aggregation tool (Figure 13a). The output of this analysis revealed that, 28.68 and 22.92% of UHVs are considered to have very high and high vulnerability, respectively (Table 9). In line with Sidiqui et al. (2022), vulnerability is defined by various composite indicators to capture its multifaceted nature. For calculating exposure layers, key factors such as population density and UHI were integrated using the inverse geometric aggregation method (Figure 13b). The analysis revealed that 28.68% of UHVs are classified as having very high vulnerability, while 22.92% are categorized as having high vulnerability (Table 9).
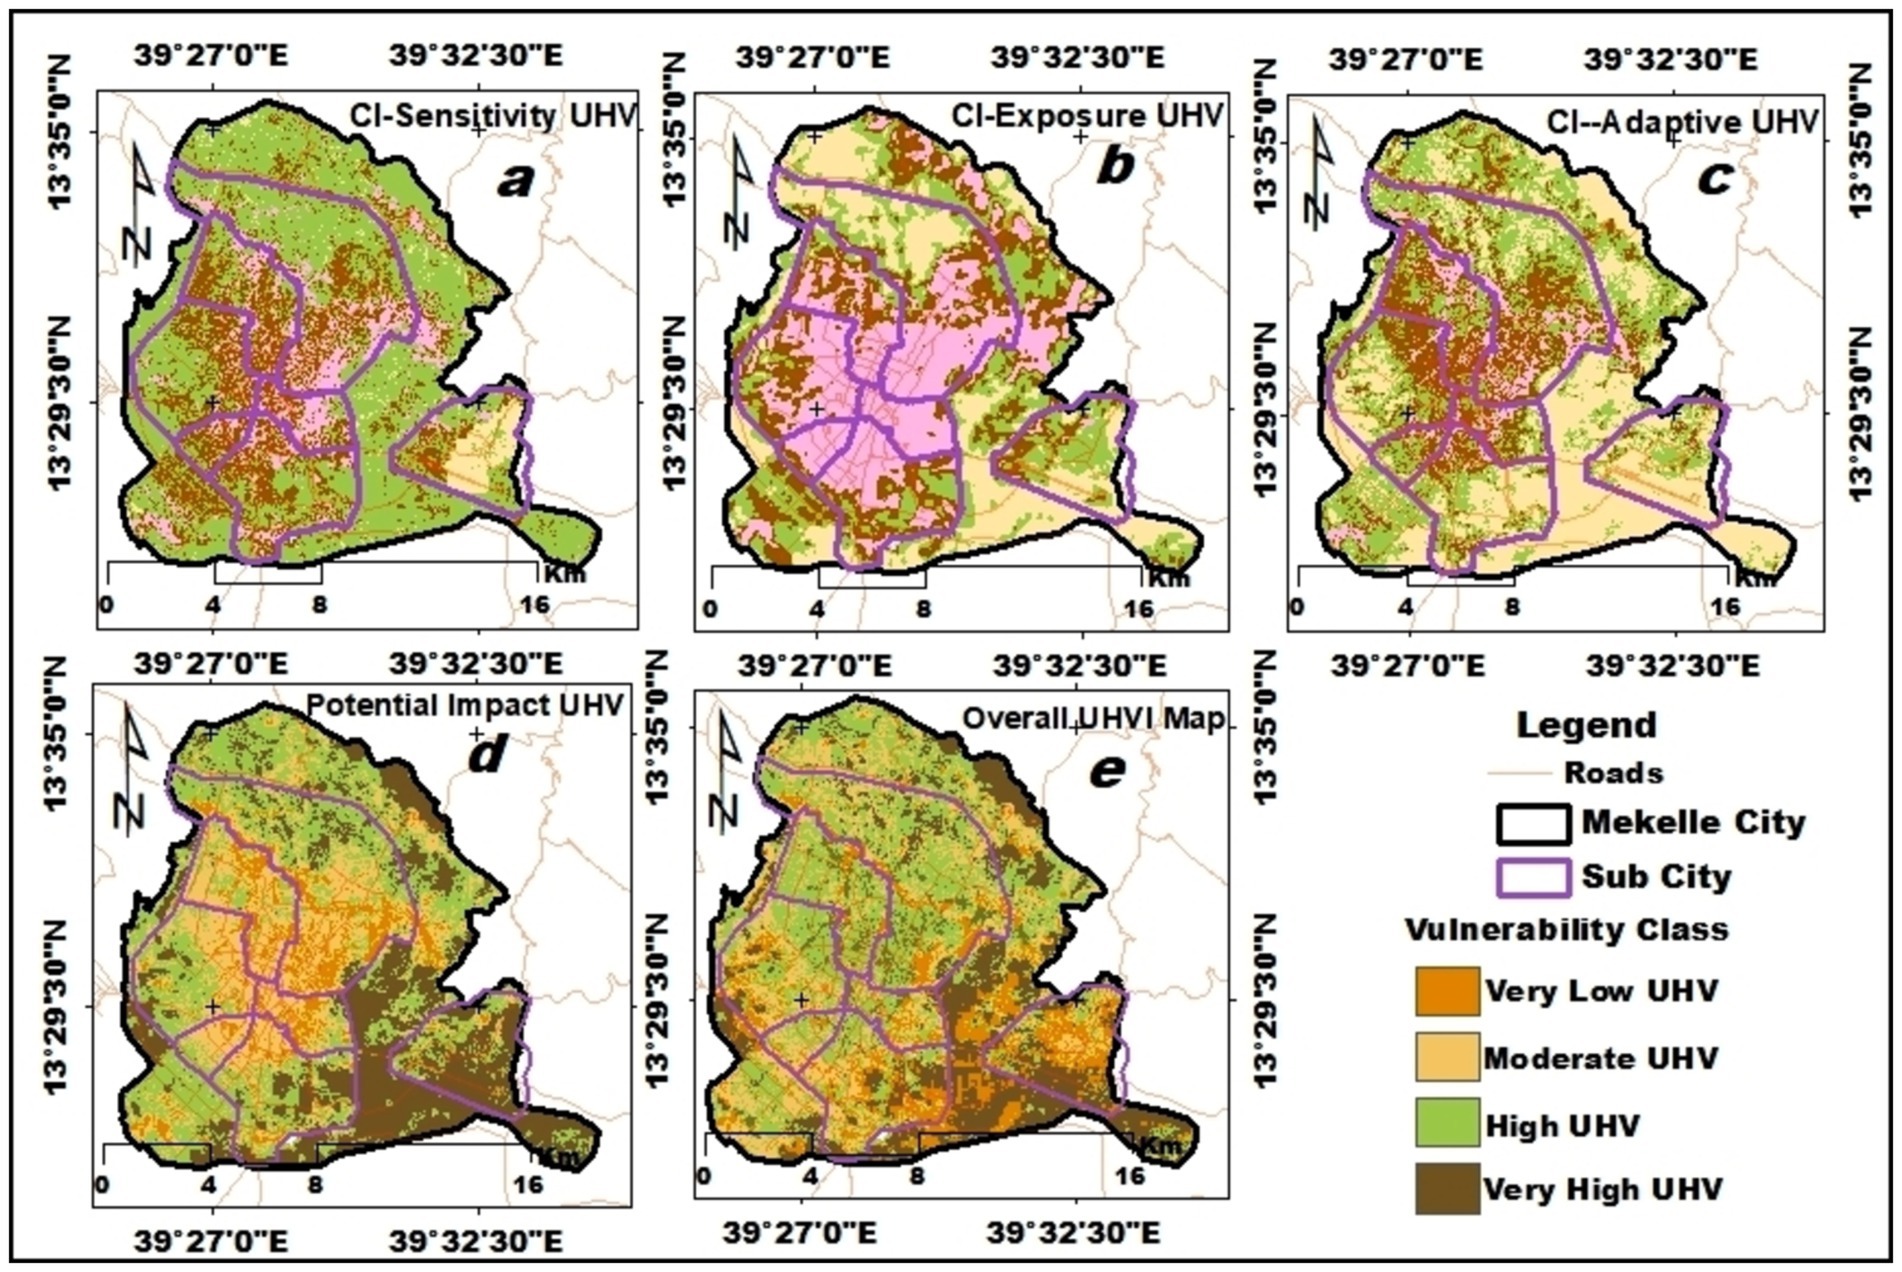
Figure 13. Spatial distribution map of UHI vulnerability. (a) CI-sensitivity, (b) CI-exposure, (c) CI-adaptive, (d) potential impact, and (e) overall UHVI IPPC.
The CI-Sensitivity map was initially developed by integrating various biophysical components (such as NDVI, LULC, roof type, DBSI, BUI, BCI, and EBBI), climatological factors (LST and mean air temperature), and demographic data (density of elderly, young, female, and women of reproductive age) using an inverse geometric aggregation method. Developing on this approach, the CI-Sensitivity UHV map for the study area was generated by combining these indicators with the inverse geometric aggregation method (Figure 13a). The results showed that 12.8 and 24.3% of UHVs fall into the very high and high vulnerability categories, respectively (Table 9). While only a small portion (7.25%) of the study area is classified as very highly vulnerable, open water and riverbanks (Figure 13c) significantly mitigate UHV risk (Table 9).
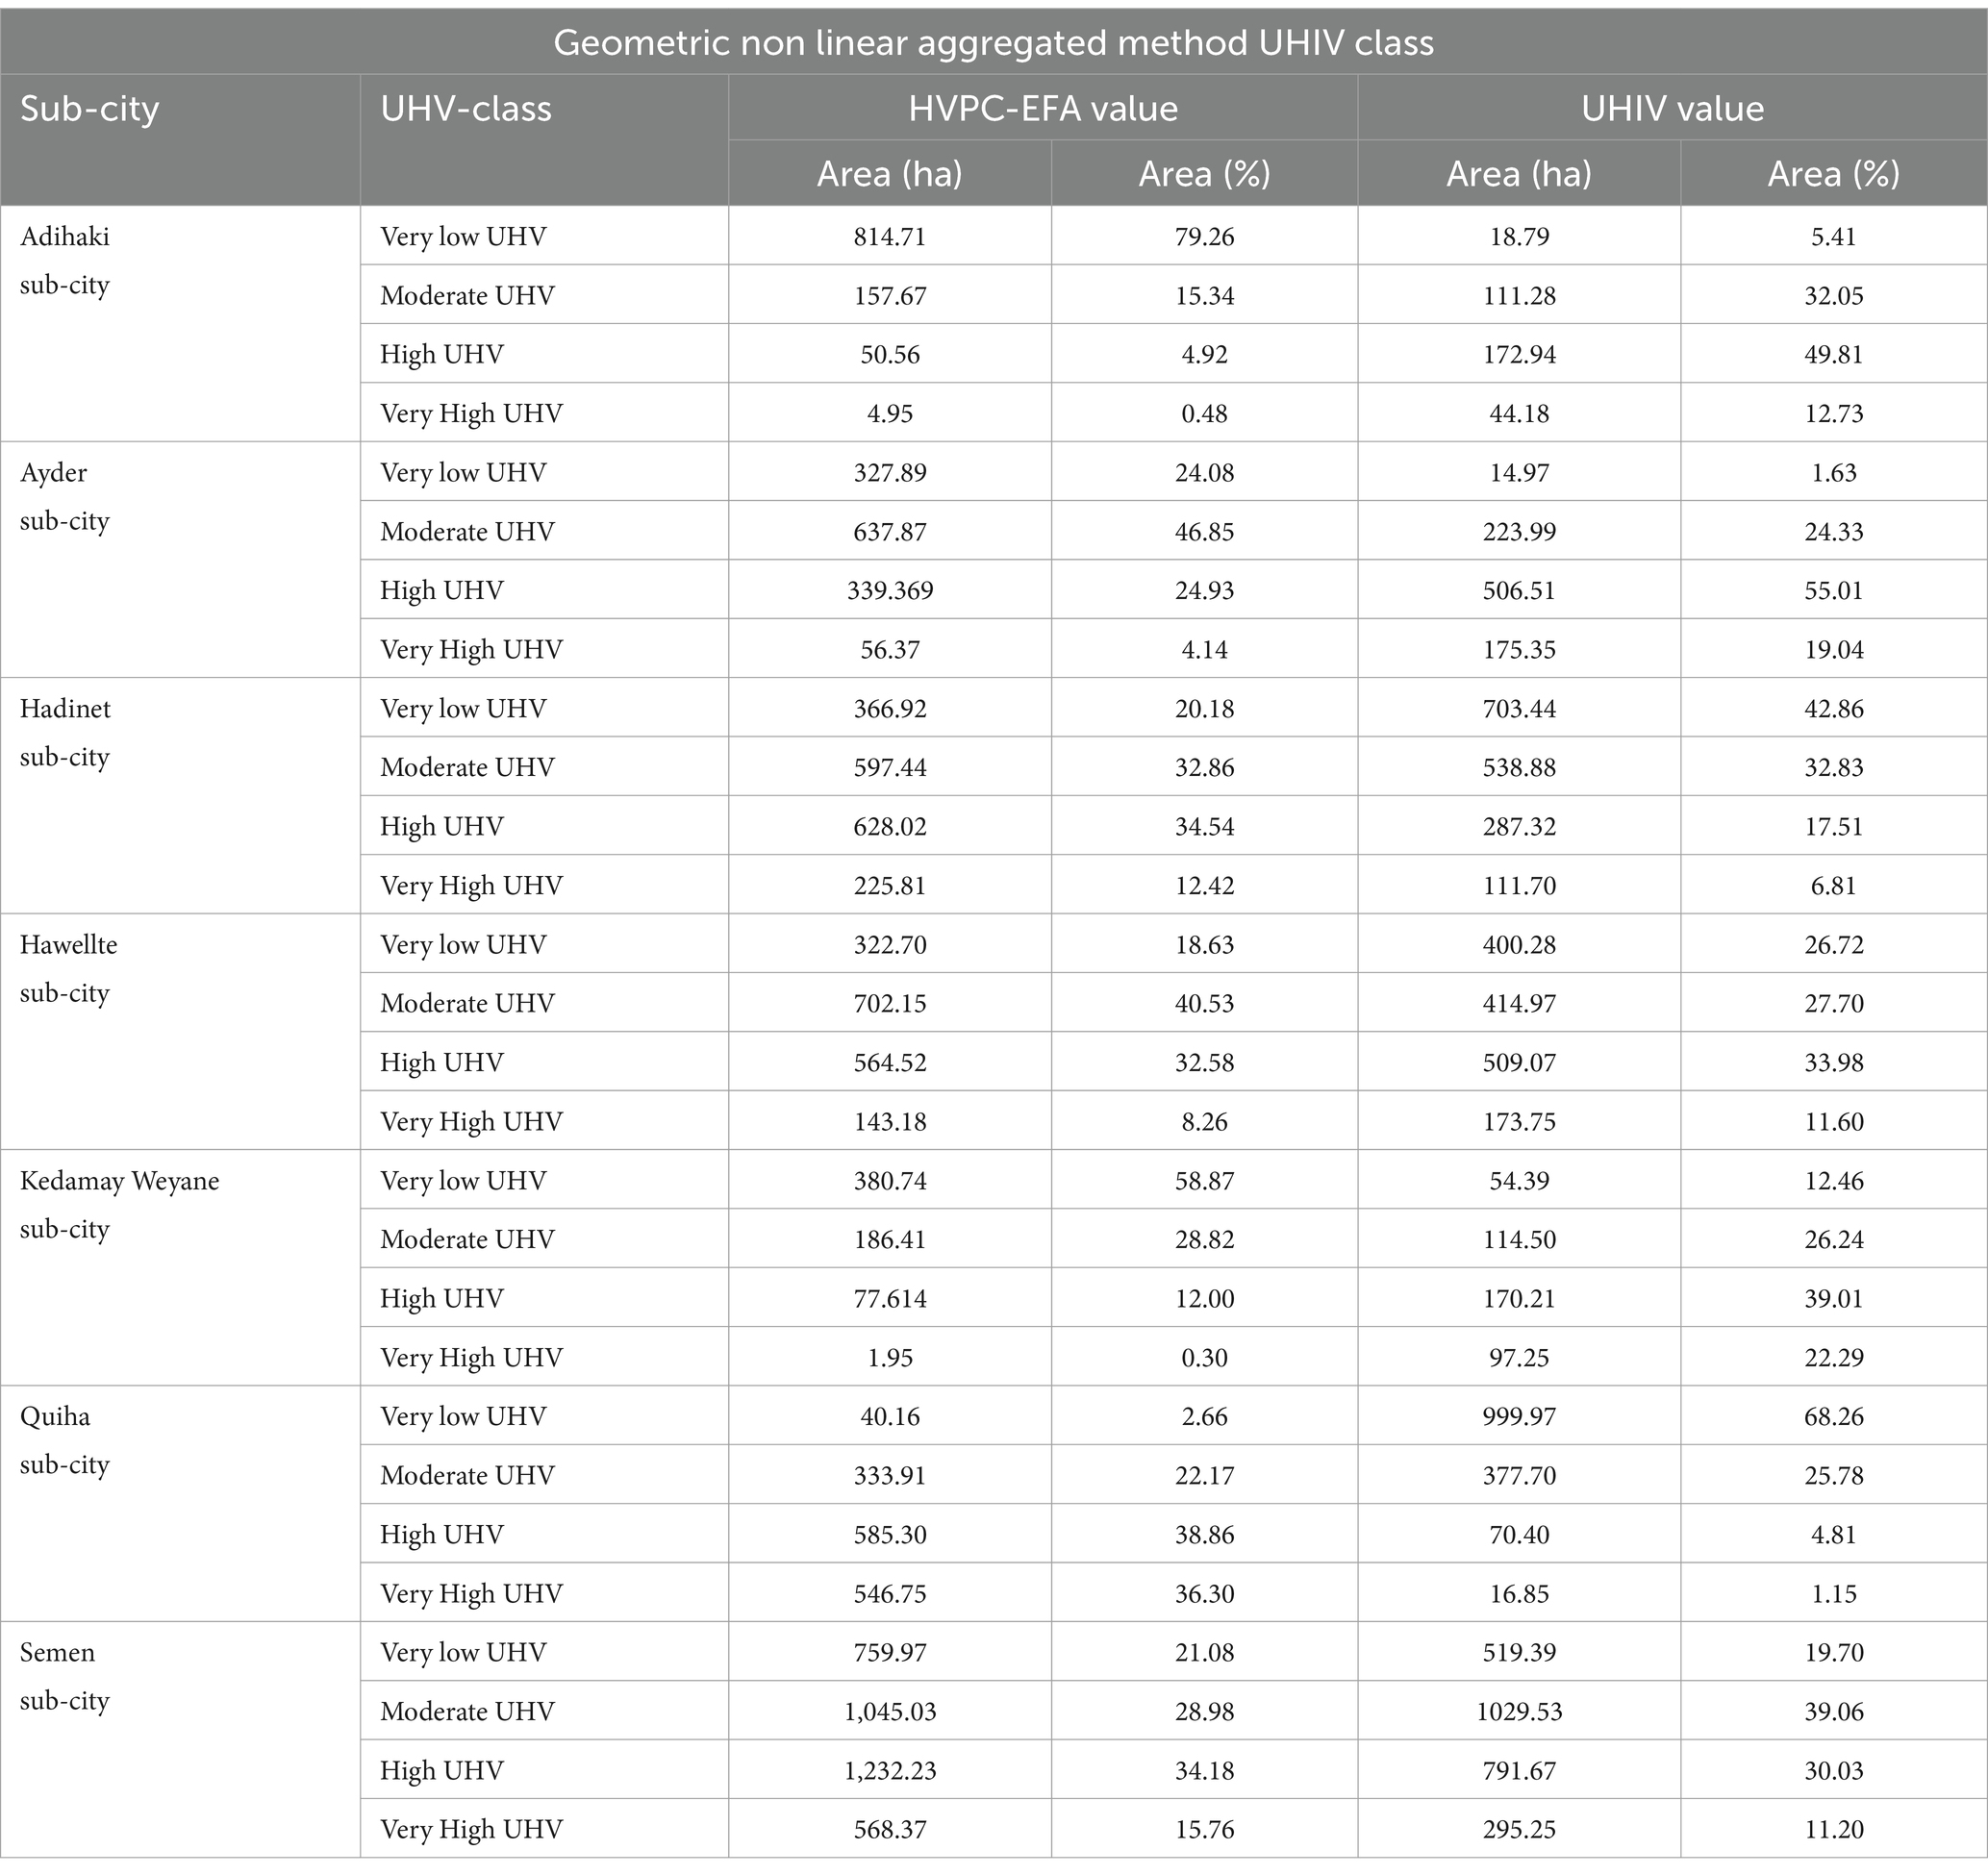
Overall, the UHI vulnerability pattern (Figure 13e) reveals that a large portion of the city is categorized under the highest (41.6%), moderate (31.9%), and high (19.87%) UHV classes (Table 9). The southeastern and western parts of the city have lower HVI values compared to the metropolitan core, which has higher HVI values. An integrated UHV map, intersected at the sub-city level, identifies the most vulnerable sub-cities as Adihaki (62.5%), Ayder (74.04%), Hawellte (49.5%), Kedamay Weyane (61.28%), Hawiltee (45.57%), and Semen (41.2%). Conversely, Quiha sub-city, with a highly concentrated population, has a high proportion (68.2%) of members in the lowest UHV category.
3.7 Comparison between HVI-PCA-EFA and IPCC UHVI model
A post-classification comparison was conducted to identify changes between the final urban heat vulnerability maps in raster format (Figure 14a). To enhance understanding, changes were identified, quantified, and illustrated separately for each vulnerability class using HV-PC-EFA and UHIV techniques. Areas shaded green and light brown in both methods show different vulnerability values and are categorized into different vulnerability classes by each method. In contrast, the blue-shaded area (Figure 14b) indicates regions where vulnerability classes remained unchanged with the two methods. These unchanged areas account for 15% (2,567 hectares) of the total study area and exhibit consistent vulnerability classifications.
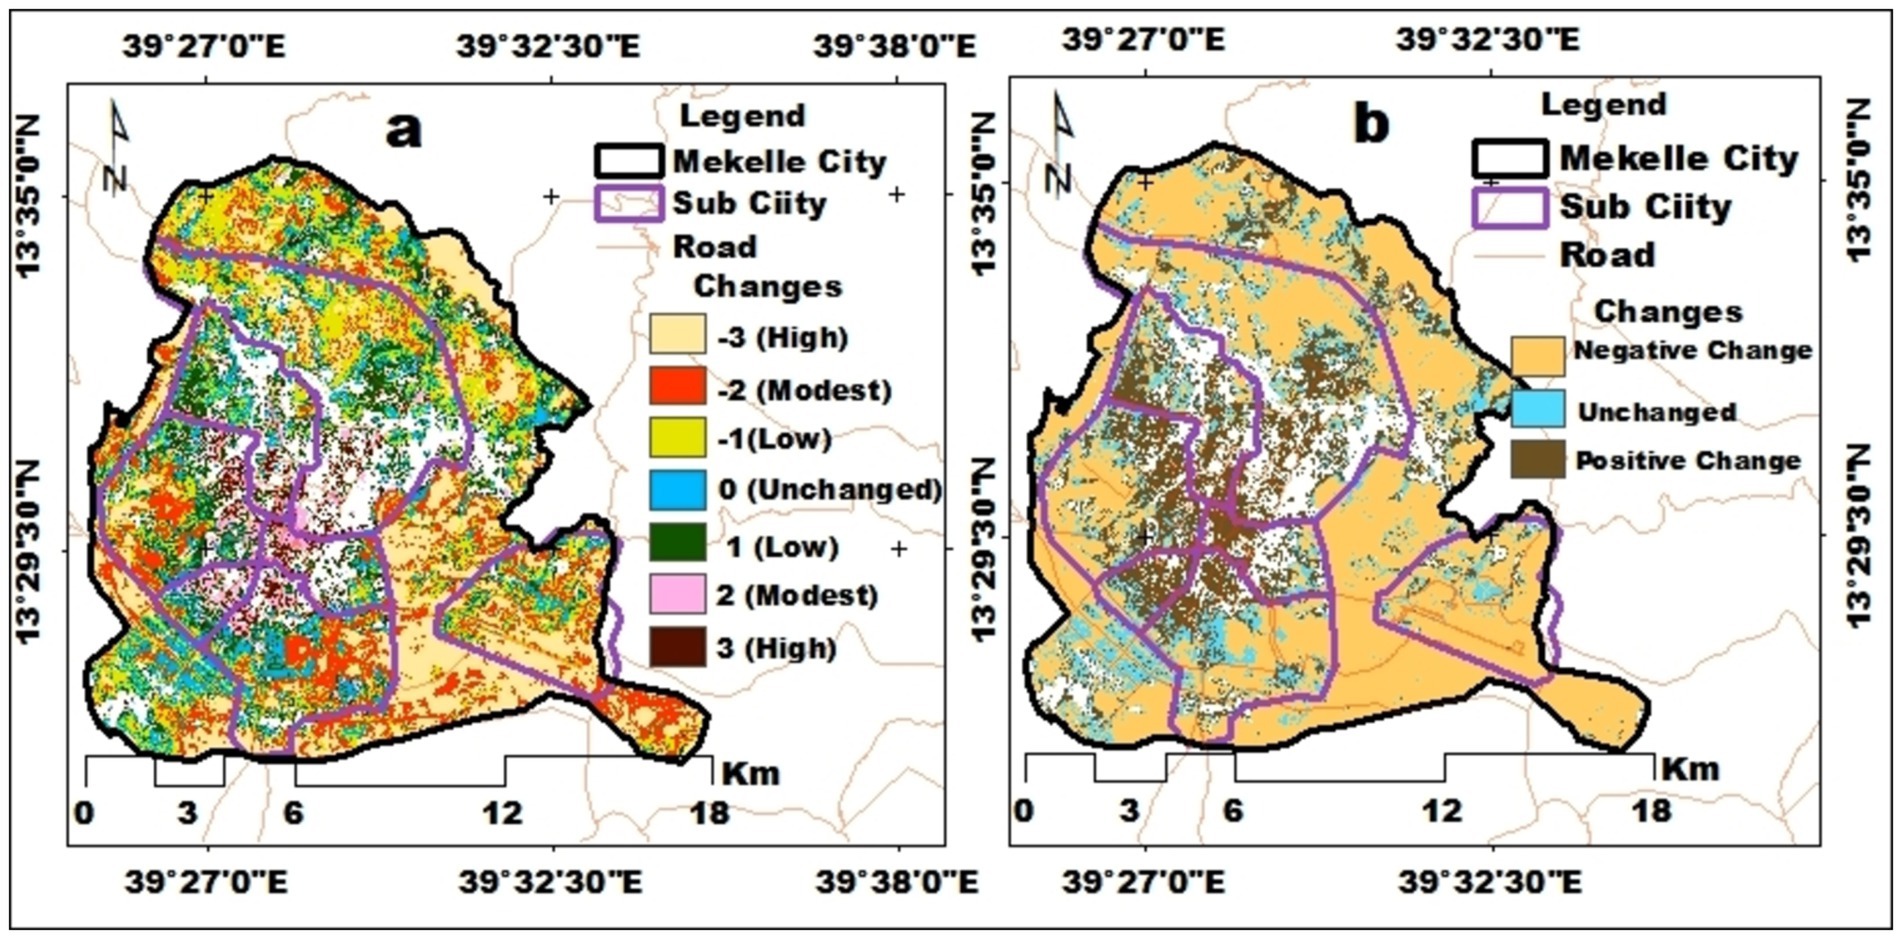
Figure 14. Change spatial distribution of overall UHV. (a) Overall changes, (b) Reclassified changes.
However, the regions shaded green and light brown, making up 84% of the study area, demonstrated varying vulnerability values and were classified into different vulnerability classes by both methods. The vulnerability classes derived from the two approaches were compared using a pairwise comparison matrix tool. The post-classification differencing between HV-PC-EFA and UHIV revealed a matrix showing changes in vulnerability levels, as detailed in Table 10.
Notably, the area classified as low urban heat vulnerability increased significantly, shifting by 33.6% from 1,358.57 hectares (HV-PC-EFA) to 7,067.19 hectares (UHIV) (Table 10). This transition to a low UHIV class was primarily driven by shifts from very high UHIV (4,038.84 hectares) and high UHIV (2,758.84 hectares). The region most exposed to HIV has also shown a significant decline, decreasing from 4,719.98 ha (HV-PC-EFA) to 1,113.26 ha (UHIV).
The primary shift in the highest class of HIV identified by the use of the HV-PC-EFA technique is in the low and moderate UHIV classes. The difference between these two approaches is most likely due to uneven composite indicator assignment. The vulnerability class’s spatial coverage has also shown some notable differences between the two approaches. Such a spatial coverage variation has been observed, for example, in the vulnerability class of the Hadinet, Adihaki, Quiha, and Kedamay Weyan sub-cities (Table 11).
The study’s findings can help pinpoint which areas of a city are most susceptible to severe urban heat waves. Urban planners can use this information to focus on cooling strategies such as expanding green spaces, planting trees, installing cool roofs, and enhancing urban design to improve natural ventilation and shading. Policymakers can leverage these insights to develop and refine mitigation strategies, enhance early warning systems, and improve heat emergency response plans. Although urban heat islands may not yet pose a significant public health threat in this context, the data can still provide valuable guidance for local public health officials in crafting strategies to prevent heat-related illnesses and foster collaborations with healthcare providers for effective monitoring and response. Overall, assessing urban heat vulnerability is crucial for making informed decisions regarding community health, policy formulation, and urban planning. Urban stakeholders should identify the most vulnerable areas and populations, and proactively implement measures to boost resilience to extreme temperatures, thereby making urban environments healthier and more sustainable for everyone.
4 Conclusion
Previous research has examined vulnerability to various factors, such as temperature, population, education, income, and access to cooling facilities, in major global cities (McMichael, 2000; Cheng et al., 2014; Nuruzzaman, 2015; Chen et al., 2023). However, there has been no study specifically addressing Ethiopia or Mekelle City. This research utilized HV-PC-EFA and UHVI techniques to assess heat vulnerability at the sub-city level within Mekelle. To evaluate urban susceptibility to urban heat island (UHI) effects, the study focused on 15 urban ecological characteristics and six demographic factors, including population density, elderly population, young population, women of reproductive age, and working-age individuals. The city’s heat vulnerability was analyzed using unweight geometric non-linear aggregation method, based on UHVI and HV-PC-EFA models. Theoretically, there is an inverse relationship between Land Surface Temperature (LST) and vulnerability to extreme urban heat (Liu et al., 2020). Pearson correlation matrix data show that UHV has a stronger negative correlation with LST (−0.116) compared to HV-PC-EFA (−0.029). The HV-PC-EFA and UHVI models significantly affect the spatial distribution and coverage of heat vulnerability. The HV-PC-EFA approach’s critical indicators for CI-Adaptive (such as vegetation cover, UTFVI, and relative humidity) and CI-Sensitive (urban density and roof type) may not be distinctly captured, potentially limiting the depth of data when applying geometric aggregation methods.
As a result, the HV-PC-EFA approach may overlook important aspects of heat vulnerability by simplifying multiple indicators into fewer components, potentially distorting the outcomes. The study identifies significant land surface temperature (LST) and urban heat island (UHI) issues in five sub-cities: Adi Haki, Ayder, Kedamay Weyane, Quiha, and Semen. Rise in the Urban Heat vulnerability (UHV) is associated with a reduction in plant cover and an increase in impermeable surfaces. Although altering existing built-up locations is difficult, implementing adaptive measures such as planting trees, establishing green public spaces, and maintaining water bodies can be effective. It is also essential to raise public awareness of heat concerns. Furthermore, the government might advocate the use of concrete or tile roofing rather than glazed corrugated roofing in residential areas.
4.1 Limitation
This study focuses exclusively only on key physical attributes of cities, such as their environmental zones, population demographics, and climatic indices. The study does not evaluate the socio-economic status of the community under this study. The recent extended conflict in Tigray (including Mekelle City) and the absence of systematically recorded public health data directly related to these cases at health institutions have made it challenging to access and collect relevant information for this study.
Data availability statement
The datasets presented in this study can be found in online repositories. The names of the repository/repositories and accession number(s) can be found in the article/supplementary material.
Author contributions
ST: Conceptualization, Formal analysis, Investigation, Methodology, Software, Validation, Writing – original draft, Data curation, Resources, Writing – review & editing. VG: Investigation, Methodology, Validation, Writing – review & editing, Data curation, Formal analysis. AU: Methodology, Supervision, Validation, Writing – review & editing, Data curation, Formal analysis.
Funding
The author(s) declare that no financial support was received for the research, authorship, and/or publication of this article.
Acknowledgments
We would like to take this opportunity to thank Arba Minch University, Mekelle University, Mr. Teshale Atsebha, Mr. Mesfine Degaga, Mr. Demelash Legesse, Mr. Zelalem Bekele, and Mr. Kumulachew Siferaw, and Dawit Regassa for their continued and unreserved supports. We would also like to thank Editor-in-Chief and reviewers of this article for their critical observations and contribution.
Conflict of interest
The authors declare that the research was conducted in the absence of any commercial or financial relationships that could be construed as a potential conflict of interest.
Publisher’s note
All claims expressed in this article are solely those of the authors and do not necessarily represent those of their affiliated organizations, or those of the publisher, the editors and the reviewers. Any product that may be evaluated in this article, or claim that may be made by its manufacturer, is not guaranteed or endorsed by the publisher.
References
Abir, F. A., Ahmmed, S., Sarker, S. H., and Fahim, A. U. (2021). Thermal and ecological assessment based on land surface temperature and quantifying multivariate controlling factors in Bogura, Bangladesh. Heliyon 7:e08012. doi: 10.1016/j.heliyon.2021.e08012
Adulkongkaew, T., Satapanajaru, T., Charoenhirunyingyos, S., and Singhirunnusorn, W. (2020). Effect of land cover composition and building configuration on land surface temperature in an urban-sprawl city, case study in Bangkok metropolitan area, Thailand. Heliyon 6:e04485. doi: 10.1016/j.heliyon.2020.e04485
Agonafir, C., Lakhankar, T., Khanbilvardi, R., Krakauer, N., Radell, D., and Devineni, N. (2023). A review of recent advances in urban flood research. Water Secur. 19:100141. doi: 10.1016/j.wasec.2023.100141
Ahmed, I., Van Esch, M., and Van Der Hoeven, F. (2023). Heatwave vulnerability across different spatial scales: Insights from the Dutch built environment. Urban Climate 51:101614. doi: 10.1016/j.uclim.2023.101614
Al Kafy, A., Al Faisal, A., Rahman, M. S., Islam, M., Al Rakib, A., Islam, M. A., et al. (2021). Prediction of seasonal urban thermal field variance index using machine learning algorithms in Cumilla, Bangladesh. Sustain. Cities Soc. 64:102542. doi: 10.1016/j.scs.2020.102542
Arifwidodo, S., and Chandrasiri, O. (2015). Urban Heat Island and household energy consumption in Bangkok, Thailand. Energy Procedia 79, 189–194. doi: 10.1016/j.egypro.2015.11.461
As-syakur, A. R., Adnyana, I. W. S., Arthana, I. W., and Nuarsa, I. W. (2012). Enhanced built-UP and bareness index (EBBI) for mapping built-UP and bare land in an urban area. Remote Sens. 4, 2957–2970. doi: 10.3390/rs4102957
Barron, L., Ruggieri, D., and Branas, C. (2018). Assessing vulnerability to heat: a geospatial analysis for the City of Philadelphia. Urban Sci. 2:38. doi: 10.3390/urbansci2020038
Carter, T., and Fowler, L. (2008). Establishing green roof infrastructure through environmental policy instruments. Environ. Manag. 42, 151–164. doi: 10.1007/s00267-008-9095-5
Chaudhry, D. (2023). Climate change and health of the urban poor: the role of environmental justice. J. Clim. Change Health 15:100277. doi: 10.1016/j.joclim.2023.100277
Chen, B., Wu, C., Song, X., Zheng, Y., Lu, M., Yang, H., et al. (2023). Anthropogenic heat release due to energy consumption exacerbates European summer extreme high temperature. Clim. Dyn. 61, 3831–3843. doi: 10.1007/s00382-023-06775-x
Cheng, J., Xu, Z., Zhu, R., Wang, X., Jin, L., Song, J., et al. (2014). Impact of diurnal temperature range on human health: a systematic review. Int. J. Biometeorol. 58, 2011–2024. doi: 10.1007/s00484-014-0797-5
Columbia University. (2018). WorldPop (www.worldpop.org - School of Geography and Environmental Science, University of Southampton; Department of Geography and Geosciences, University of Louisville; Departement de Geographie, Universite de Namur) and Center for International Earth Science Information Network.
Cramer, M. N., Gagnon, D., Laitano, O., and Crandall, C. G. (2022). Human temperature regulation under heat stress in health, disease, and injury. Physiol. Rev. 102, 1907–1989. doi: 10.1152/physrev.00047.2021
Deng, C., and Wu, C. (2012). BCI: a biophysical composition index for remote sensing of urban environments. Remote Sens. Environ. 127, 247–259. doi: 10.1016/j.rse.2012.09.009
Deng, X., Yu, W., Shi, J., Huang, Y., Li, D., He, X., et al. (2024). Characteristics of surface urban heat islands in global cities of different scales: trends and drivers. Sustain. Cities Soc. 107:105483. doi: 10.1016/j.scs.2024.105483
Ebi, K. L., Capon, A., Berry, P., Broderick, C., De Dear, R., Havenith, G., et al. (2021). Hot weather and heat extremes: health risks. Lancet 398, 698–708. doi: 10.1016/S0140-6736(21)01208-3
EPCC (Ethiopian Panel on Climate Change). (2015). First Assessment Report, Working Group II Agriculture and Food Security. Addis Ababa: Ethiopian Academy of Sciences.
Fadhil, M., Hamoodi, M. N., and Ziboon, A. R. T. (2023). Mitigating urban heat island effects in urban environments: strategies and tools. IOP Conf. Series 1129:012025. doi: 10.1088/1755-1315/1129/1/012025
Fall, S., Coulibaly, K., Quansah, J., and El Afandi, G. (2023). Differential urban heat vulnerability: the tale of three Alabama cities. Urban Sci. 7:121. doi: 10.3390/urbansci7040121
Fick, S. E., and Hijmans, R. J. (2017). WorldClim 2: new 1-km spatial resolution climate surfaces for global land areas. Int. J. Climatol. 37:4302–4315. doi: 10.1002/joc.5086
Fuladlu, K., Ri̇za, M., and Ilkan, M. (2018). The effect of rapid urbanization on the physical modification of URBAN area. Proceeding of the 5th International Conference S.ARCH-2018, Venice, Italy.
Gebreyesus, T., Yeshitela, K., Fetene, A., and Jauregui, C. H. (2022). Study on the land surface cover dynamics of built-up areas and its implication for sustainable urban planning in Hawassa city, Ethiopia. GeoJournal 88, 2287–2305. doi: 10.1007/s10708-022-10729-x
Getter, K. L., and Rowe, D. B. (2006). The role of extensive green roofs in sustainable development. HortScience 41, 1276–1285. doi: 10.21273/HORTSCI.41.5.1276
Global High Resolution Population Denominators Project - Funded by The Bill and Melinda Gates Foundation (OPP1134076) doi: 10.5258/SOTON/WP00674
Hahn, M. B., Riederer, A. M., and Foster, S. O. (2009). The livelihood vulnerability index: a pragmatic approach to assessing risks from climate variability and change—a case study in Mozambique. Glob. Environ. Chang. 19, 74–88. doi: 10.1016/j.gloenvcha.2008.11.002
Harlan, S. L., Brazel, A. J., Prashad, L., Stefanov, W. L., and Larsen, L. (2006). Neighborhood microclimates and vulnerability to heat stress. Soc. Sci. Med. 63, 2847–2863. doi: 10.1016/j.socscimed.2006.07.030
Hass, A., Ellis, K., Reyes Mason, L., Hathaway, J., and Howe, D. (2016). Heat and humidity in the City: neighborhood heat index variability in a mid-Sized City in the southeastern United States. Int. J. Environ. Res. Public Health 13:117. doi: 10.3390/ijerph13010117
Hinkel, J. (2011). “Indicators of vulnerability and adaptive capacity”: towards a clarification of the science–policy interface. Glob. Environ. Chang. 21, 198–208. doi: 10.1016/j.gloenvcha.2010.08.002
Huang, Q., and Lu, Y. (2018). Urban heat island research from 1991 to 2015: a bibliometric analysis. Theor. Appl. Climatol. 131, 1055–1067. doi: 10.1007/s00704-016-2025-1
Huete, A. R. (1988). A soil-adjusted vegetation index (SAVI). Remote Sens. Environ. 25, 295–309. doi: 10.1016/0034-4257(88)90106-X
Hurduc, A., Ermida, S. L., Trigo, I. F., and DaCamara, C. C. (2024). Importance of temporal dimension and rural land cover when computing surface urban Heat Island intensity. Urban Clim. 56:102013. doi: 10.1016/j.uclim.2024.102013
IFRC, (2021). CLIMATE CHANGE IMPACTS ON HEALTH: ETHIOPIA ASSESSMEN. Available at: https://www.climatecentre.org/wp-content/uploads/RCRC_IFRC-Country-assessments-Ethiopia-Final3.pdf
Ikechukwu, E. E. (2015). The effects of road and other pavement materials on urban Heat Island (a case study of Port Harcourt City). J. Environ. Prot. 6, 328–340. doi: 10.4236/jep.2015.64033
Il Choi, H. (2019). Assessment of aggregation frameworks for composite indicators in measuring flood vulnerability to climate change. Sci. Rep. 9:19371. doi: 10.1038/s41598-019-55994-y
Imran, H. M., Shammas, M. I., Rahman, A., Jacobs, S. J., Ng, A. W. M., and Muthukumaran, S. (2021). Causes, modeling and mitigation of urban Heat Island: a review. Earth Sci. 10:244. doi: 10.11648/j.earth.20211006.11
IPCC (2007) in Climate Change 2007: The Physical Science Basis. Contribution of Working Group I to the Fourth Assessment Report of the Intergovernmental Panel on Climate Change. eds. S. Solomon, D. Qin, M. Manning, Z. Chen, M. Marquis, K. B. Averyt, M. Tignor, and H. L. Miller (Cambridge, United Kingdom and New York, NY, USA: Cambridge University Press). 996
IPCC, (2022). Climate Change 2022: Mitigation of Climate Change. Contribution of Working Group III to the Sixth Assessment Report of the Intergovernmental Panel on Climate Change. Available at: https://creativecommons.org/licenses/by-nc/4.0/
Irish Aid (2018). Resilience and Economic Inclusion Team Irish Aid| Available at: https://www.irishaid.ie/media/irishaid/climatechange/Ethiopia-Country-Climate-Action-Reports-2016.pdf
Jagarnath, M., Thambiran, T., and Gebreslasie, M. (2020). Heat stress risk and vulnerability under climate change in Durban metropolitan, South Africa—identifying urban planning priorities for adaptation. Clim. Chang. 163, 807–829. doi: 10.1007/s10584-020-02908-x
Jalalzadeh Fard, B., Mahmood, R., Hayes, M., Rowe, C., Abadi, A. M., Shulski, M., et al. (2021). Mapping heat vulnerability index based on different urbanization levels in Nebraska, USA. GeoHealth 5:e2021GH000478. doi: 10.1029/2021GH000478
Kauth, R. J., and Thomas, G. S. (1976). “The Tasseled Cap-a graphic description of the spectral-temporal development of agricultural crops as seen by Landsat” in Proceedings of the Symposium on Machine Processing of Remotely (West Lafiyette, Indiana, Sensed Data, Purdue University), 4B41–4B51.
Kyriazos, T. A. (2018). Applied psychometrics: sample size and sample power considerations in factor analysis (EFA, CFA) and SEM in general. Psychology 9, 2207–2230. doi: 10.4236/psych.2018.98126
Leal Filho, W., Al-Amin, A., Nagy, G., Azeiteiro, U., Wiesböck, L., Ayal, D., et al. (2018a). A comparative analysis of climate-risk and extreme event-related impacts on well-being and health: policy implications. Int. J. Environ. Res. Public Health 15:331. doi: 10.3390/ijerph15020331
Leal Filho, W., Echevarria Icaza, L., Neht, A., Klavins, M., and Morgan, E. A. (2018b). Coping with the impacts of urban heat islands. A literature based study on understanding urban heat vulnerability and the need for resilience in cities in a global climate change context. J. Clean. Prod. 171, 1140–1149. doi: 10.1016/j.jclepro.2017.10.086
Li, X. (2021). Investigating the spatial distribution of resident’s outdoor heat exposure across neighborhoods of Philadelphia, Pennsylvania using urban microclimate modeling. Sustain. Cities Soc. 72:103066. doi: 10.1016/j.scs.2021.103066
Li, G., Lu, D., Moran, E., and Hetrick, S. (2013). Mapping impervious surface area in the Brazilian Amazon using Landsat imagery. GIScience Remote Sens. 50, 172–183. doi: 10.1080/15481603.2013.780452
Li, X., Stringer, L. C., and Dallimer, M. (2022). The role of blue green infrastructure in the urban thermal environment across seasons and local climate zones in East Africa. Sustain. Cities Soc. 80:103798. doi: 10.1016/j.scs.2022.103798
Liou, Y.-A., Nguyen, K.-A., and Ho, L.-T. (2021). Altering urban greenspace patterns and heat stress risk in Hanoi city during master plan 2030 implementation. Land Use Policy 105:105405. doi: 10.1016/j.landusepol.2021.105405
Liu, X., Yue, W., Yang, X., Hu, K., Zhang, W., and Huang, M. (2020). Mapping urban heat vulnerability of extreme heat in Hangzhou via comparing two approaches. Complexity 2020, 1–16. doi: 10.1155/2020/9717658
Loughnan, M., Nicholls, N., and Tapper, N. J. (2012). Mapping heat health risks in urban areas. Int. J. Popul. Res. 2012, 1–12. doi: 10.1155/2012/518687
Maier, G., Grundstein, A., Jang, W., Li, C., Naeher, L. P., and Shepherd, M. (2014). Assessing the performance of a vulnerability index during oppressive heat across Georgia, United States. Weather Clim. Soc. 6, 253–263. doi: 10.1175/WCAS-D-13-00037.1
Mallick, S. K., Sahu, N., Das, P., Maity, B., Varun, A., Kumar, A., et al. (2024). Impact of urban growth in Delhi and It’s Peri-urban environment on urban heat exposure. Urban Clim. 56:102010. doi: 10.1016/j.uclim.2024.102010
Masson, V., Lemonsu, A., Hidalgo, J., and Voogt, J. (2020). Urban climates and climate change. Annu. Rev. Environ. Resour. 45, 411–444. doi: 10.1146/annurev-environ-012320-083623
Mateo-Pérez, V., Corral-Bobadilla, M., Ortega-Fernández, F., and Rodríguez-Montequín, V. (2021). Determination of water depth in ports using satellite data based on machine learning algorithms. Energies 14:2486. doi: 10.3390/en14092486
Mathai, A. M., Provost, S. B., and Haubold, H. J. (2022). Multivariate statistical analysis in the real and complex domains : Springer International Publishing. doi: 10.1007/978-3-030-95864-0
McGrane, S. J. (2016). Impacts of urbanisation on hydrological and water quality dynamics, and urban water management: a review. Hydrol. Sci. J. 61, 2295–2311. doi: 10.1080/02626667.2015.1128084
McMichael, A. J. (2000). The urban environment and health in a world of increasing globalization: issues for developing countries. Bull. World Health Organ. 78, 1117–1126
Melis, G., Di Gangi, E., Ellena, M., Zengarini, N., Ricciardi, G., Mercogliano, P., et al. (2023). Urban Heat Island effect and social vulnerability in Turin: prioritizing climate change mitigation action with an equity perspective. Science Talks 8:100258. doi: 10.1016/j.sctalk.2023.100258
Meng, Q., Zhang, L., Sun, Z., Meng, F., Wang, L., and Sun, Y. (2018). Characterizing spatial and temporal trends of surface urban heat island effect in an urban main built-up area: a 12-year case study in Beijing, China. Remote Sens. Environ. 204, 826–837. doi: 10.1016/j.rse.2017.09.019
Mohajerani, A., Bakaric, J., and Jeffrey-Bailey, T. (2017). The urban heat island effect, its causes, and mitigation, with reference to the thermal properties of asphalt concrete. J. Environ. Manag. 197, 522–538. doi: 10.1016/j.jenvman.2017.03.095
Mücke, H.-G., and Litvinovitch, J. M. (2020). Heat extremes, public health impacts, and adaptation policy in Germany. Int. J. Environ. Res. Public Health 17:7862. doi: 10.3390/ijerph17217862
Naserikia, M., Hart, M. A., Nazarian, N., Bechtel, B., Lipson, M., and Nice, K. A. (2023). Land surface and air temperature dynamics: the role of urban form and seasonality. Sci. Total Environ. 905:167306. doi: 10.1016/j.scitotenv.2023.167306
Nuruzzaman, M. (2015). Urban Heat Island: causes, effects and mitigation measures—a review. Int J Environ Monit Anal 3:67. doi: 10.11648/j.ijema.20150302.15
Omura, S., Shimizu, K., Kuwahara, M., Morikawa-Urase, M., Kusunoki, S., and Tsunoda, I. (2022). Exploratory factor analysis determines latent factors in Guillain–Barré syndrome. Sci. Rep. 12:21837. doi: 10.1038/s41598-022-26422-5
Pallant, J. (2005). SPSS survival manual: A step by step guide to data analysis using SPSS for windows (version 12). 2nd Edn. Australia: Allen & Unwin.
Parkes, B., Buzan, J. R., and Huber, M. (2022). Heat stress in Africa under high intensity climate change. Int. J. Biometeorol. 66, 1531–1545. doi: 10.1007/s00484-022-02295-1
Pathak, C., Chandra, S., Maurya, G., Rathore, A., Sarif, M. O., and Gupta, R. D. (2021). The effects of land indices on thermal state in surface urban Heat Island formation: a case study on Agra City in India using remote sensing data (1992–2019). Earth Syst. Environ. 5, 135–154. doi: 10.1007/s41748-020-00172-8
Perry, G., Gebresenbet, F., DaPra, M., Branco, P., Whibesilassie, W., Jelacic, M., et al. (2022). Why urban ecology matters in Ethiopia. Front. Ecol. Evol. 10:843698. doi: 10.3389/fevo.2022.843698
Petkova, E. P., Morita, H., and Kinney, P. L. (2014). Health impacts of heat in a changing climate: how can emerging science inform urban adaptation planning? Curr. Epidemiol. Rep. 1, 67–74. doi: 10.1007/s40471-014-0009-1
Piracha, A., and Chaudhary, M. T. (2022). Urban air pollution, urban Heat Island and human health: a review of the literature. Sustain. For. 14:9234. doi: 10.3390/su14159234
Ramakreshnan, L., Aghamohammadi, N., Fong, C. S., Ghaffarianhoseini, A., Ghaffarianhoseini, A., Wong, L. P., et al. (2018). A critical review of urban Heat Island phenomenon in the context of greater Kuala Lumpur, Malaysia. Sustain. Cities Soc. 39, 99–113. doi: 10.1016/j.scs.2018.02.005
Ramli, M. W. A., Alias, N. E., Yusof, H. M., Yusop, Z., Taib, S. M., Wahab, Y. F. A., et al. (2023). Spatial multidimensional vulnerability assessment index in urban area- a case study Selangor, Malaysia. Prog. Dis. Sci. 20:100296. doi: 10.1016/j.pdisas.2023.100296
Rasul, A., Balzter, H., Faqe Ibrahim, G. R., Hameed, H. M., Wheeler, J., Adamu, B., et al. (2018). Applying built-up and bare-soil indices from Landsat 8 to cities in dry climates. Land 7:81. doi: 10.3390/land7030081
Rathi, S. K., Chakraborty, S., Mishra, S. K., Dutta, A., and Nanda, L. (2021). A heat vulnerability index: spatial patterns of exposure, sensitivity and adaptive capacity for urbanites of four cities of India. Int. J. Environ. Res. Public Health 19:283. doi: 10.3390/ijerph19010283
Raymond, C., Coumou, D., Foreman, T., King, A., Kornhuber, K., Lesk, C., et al. (2019). “Projections and hazards of future extreme heat” in The Oxford handbook of planning for climate change hazards. eds. W. T. Pfeffer, J. B. Smith, and K. L. Ebi. 1st ed (Oxford University Press).
Robine, J.-M., Cheung, S. L. K., Le Roy, S., Van Oyen, H., Griffiths, C., Michel, J.-P., et al. (2008). Death toll exceeded 70,000 in Europe during the summer of 2003. C. R. Biol. 331, 171–178. doi: 10.1016/j.crvi.2007.12.001
Ruslan, S. A., Muharam, F. M., Zulkafli, Z., Omar, D., and Zambri, M. P. (2019). Using satellite-measured relative humidity for prediction of Metisa plana’s population in oil palm plantations: a comparative assessment of regression and artificial neural network models. PLoS One 14:e0223968. doi: 10.1371/journal.pone.0223968
Shahfahad, S., Mourya, M., Kumari, B., Tayyab, M., Paarcha, A., and Rahman, A. (2021). Indices based assessment of built-up density and urban expansion of fast growing Surat city using multi-temporal Landsat data sets. GeoJournal 86, 1607–1623. doi: 10.1007/s10708-020-10148-w
Sharma, A., Woodruff, S., Budhathoki, M., Hamlet, A. F., Chen, F., and Fernando, H. J. S. (2018). Role of green roofs in reducing heat stress in vulnerable urban communities—a multidisciplinary approach. Environ. Res. Lett. 13:094011. doi: 10.1088/1748-9326/aad93c
Sheridan, S. C., Dixon, P. G., Kalkstein, A. J., and Allen, M. J. (2021). Recent trends in heat-related mortality in the United States: an update through 2018. Weather Clim. Soc. 13, 95–106. doi: 10.1175/WCAS-D-20-0083.1
Shih, W. (2017). Greenspace patterns and the mitigation of land surface temperature in Taipei metropolis. Habitat Int. 60, 69–80. doi: 10.1016/j.habitatint.2016.12.006
Sidiqui, P., Roös, P. B., Herron, M., Jones, D. S., Duncan, E., Jalali, A., et al. (2022). Urban Heat Island vulnerability mapping using advanced GIS data and tools. J. Earth Syst. Sci. 131:266. doi: 10.1007/s12040-022-02005-w
Singh, N., Singh, S., and Mall, R. K. (2020) in Chapter 17 - Urban ecology and human health: implications of urban heat island, air pollution and climate change nexus. eds. P. Verma, P. Singh, R. Singh, and A. S. Raghubanshi (Elsevier: Urban Ecology), 317–334. doi: 10.1016/B978-0-12-820730-7.00017-3
Sultana, S., and Satyanarayana, A. N. V. (2020). Assessment of urbanisation and urban heat island intensities using landsat imageries during 2000 – 2018 over a sub-tropical Indian City. Sustain. Cities Soc. 52:101846. doi: 10.1016/j.scs.2019.101846
Sun, R., and Chen, L. (2017). Effects of green space dynamics on urban heat islands: mitigation and diversification. Ecosyst. Serv. 23, 38–46. doi: 10.1016/j.ecoser.2016.11.011
Szagri, D., Nagy, B., and Szalay, Z. (2023). How can we predict where heatwaves will have an impact? – a literature review on heat vulnerability indexes. Urban Clim. 52:101711. doi: 10.1016/j.uclim.2023.101711
Tan, J., Zheng, Y., Tang, X., Guo, C., Li, L., Song, G., et al. (2010). The urban heat island and its impact on heat waves and human health in Shanghai. Int. J. Biometeorol. 54, 75–84. doi: 10.1007/s00484-009-0256-x
Tesfamariam, S., Govindu, V., and Uncha, A. (2023). Spatio-temporal analysis of urban heat island (UHI) and its effect on urban ecology: the case of Mekelle city, Northern Ethiopia. Heliyon 9:e13098. doi: 10.1016/j.heliyon.2023.e13098
Theodorou, P. (2022). The effects of urbanisation on ecological interactions. Curr. Opin. Insect Sci. 52:100922. doi: 10.1016/j.cois.2022.100922
Ullah, N., Siddique, M. A., Ding, M., Grigoryan, S., Khan, I. A., Kang, Z., et al. (2023). The impact of urbanization on urban Heat Island: predictive approach using Google earth engine and CA-Markov modelling (2005–2050) of Tianjin City, China. Int. J. Environ. Res. Public Health 20:2642. doi: 10.3390/ijerph20032642
van Raalte, L., Nolan, M., Thakur, P., Xue, S., and Parker, N. (2012). Economic assessment of the urban Heat Island effect.
Vescovi, L., Rebetez, M., and Rong, F. (2005). Assessing public health risk due to extremely high temperature events: climate and social parameters. Clim. Res. 30, 71–78. doi: 10.3354/cr030071
Vujovic, S., Haddad, B., Karaky, H., Sebaibi, N., and Boutouil, M. (2021). Urban Heat Island: causes, consequences, and mitigation measures with emphasis on reflective and permeable pavements. CivilEng 2, 459–484. doi: 10.3390/civileng2020026
Wallace, J. M., and Hobbs, P. V. (2006). Atmospheric science: An introductory survey. 2nd Edn: Elsevier Academic Press. Available at: https://www.sciencedirect.com/science/article/pii/B9780127329512500016
WHO, (2015). CLIMATE AND HEALTH COUNTRY PROFILES – 2015 Ethiopia. Available at: http://www.who.int/globalchange/en/
Wilhelmi, O. V., and Hayden, M. H. (2010). Connecting people and place: a new framework for reducing urban vulnerability to extreme heat. Environ. Res. Lett. 5:014021. doi: 10.1088/1748-9326/5/1/014021
Wong, E. (2005). Green roofs and the U.S Environmental Protection Agency’s heat island reduction initiative. In: Proceedings of 3rd North American Green Roof Conference: greening rooftops for sustainable communities, Washington, DC. TRN: CA0700772. Available at: https://www.osti.gov/etdeweb/biblio/20861891
Worku, G., Teferi, E., and Bantider, A. (2021). Assessing the effects of vegetation change on urban land surface temperature using remote sensing data: the case of Addis Ababa city, Ethiopia. Remote Sens. Appl. 22:100520. doi: 10.1016/j.rsase.2021.100520
Wu, W., Xiao, Y., Li, G., Zeng, W., Lin, H., Rutherford, S., et al. (2013). Temperature–mortality relationship in four subtropical Chinese cities: a time-series study using a distributed lag non-linear model. Sci. Total Environ. 449, 355–362. doi: 10.1016/j.scitotenv.2013.01.090
Xu, H. (2006). Modification of normalised difference water index (NDWI) to enhance open water features in remotely sensed imagery. Int. J. Remote Sens. 27, 3025–3033. doi: 10.1080/01431160600589179
Yang, X. (2023). Analysis of urban ecological vulnerability and prospects under the impact of urban expansion. SHS Web Conf. 155:1012. doi: 10.1051/shsconf/202315501012
Keywords: impervious surface, surface temperature, urban heat isand, vulnerability, thermal field
Citation: Tesfamariam S, Govindu V and Uncha A (2024) Urban ecology in the context of urban heat island vulnerability potential zone mapping: the case of Mekelle city, Ethiopia. Front. Clim. 6:1446048. doi: 10.3389/fclim.2024.1446048
Edited by:
Jose Antonio Rodriguez Martin, Instituto Nacional de Investigación y Tecnología Agroalimentaria (INIA), SpainReviewed by:
Manob Das, Ramananda College, IndiaAbdullah Nidal Addas, King Abdulaziz University, Saudi Arabia
Copyright © 2024 Tesfamariam, Govindu and Uncha. This is an open-access article distributed under the terms of the Creative Commons Attribution License (CC BY). The use, distribution or reproduction in other forums is permitted, provided the original author(s) and the copyright owner(s) are credited and that the original publication in this journal is cited, in accordance with accepted academic practice. No use, distribution or reproduction is permitted which does not comply with these terms.
*Correspondence: Solomon Tesfamariam, c29sb21vbi50ZXNmYW1hcmlhbUBtdS5lZHUuZXQ=
 Solomon Tesfamariam
 Vanum Govindu
