 Xiaofan Li1,2Zhiping Yao3Xiaojuan Wang4Changwen Yu1,2Shaojing Che1,2Zhiqiang Gong4,5*Guolin Feng5Tianyu Li6
- 1Key Laboratory of Meteorology and Ecological Environment of Hebei Province, Shijiazhuang, China
- 2Hebei Climate Center, Shijiazhuang, China
- 3Meteorological Early Warning Center of Jilin Province, Changchun, China
- 4Department of Physics and Electronic Engineering, Changshu Institute of Technology, Suzhou, China
- 5Laboratory for Climate Studies, National Climate Research Center China Meteorological Administration, Beijing, China
- 6Jilin Climate Center, Changchun, China
The abnormal characteristics of extremely warm early summer (EWES) in North China under different decadal backgrounds were contrastively analyzed. Their relationships with upper- and lower-level atmospheric circulation and global sea surface temperature anomalies (SSTAs) are also discussed. Results show that temperature anomalies of EWES in North China are overall higher than normal in both cold (1961–1993) and warm (1994–2019) periods, but the anomalies of the latter are much higher than that of the former. EWES in North China is directly related to the circulation lying between 40° and 50°N in the middle troposphere, which leads to positive temperature anomalies occurring from the bottom to the upper level of the troposphere together with a high anomaly trend tilting northward. The persistent and strong Eurasian continental high (ECH) and weak Northeast China cold vortex (NECV) activity, together with the strong western Pacific subtropical high (WPSH) are major factors that directly lead to EWES in North China. ECH and WPSH are stronger and larger, and NECV are weaker and more northward in the warm period than in the cold period. In addition, the positive SSTAs in the tropical Indian Ocean and the Kuroshio area are favorable for the stronger and larger ECH and WPSH as well as the weaker and more northward NECV, causing strong anticyclonic and downward circulation system controlling North China, resulting in the extremely warm temperatures there. The joint impact of the positive tropical Indian Ocean SSTAs and the Kuroshio region SSTAs is more significant during warm than cold periods, resulting in much stronger EWES in North China during warm periods.
Introduction
Climate has changed significantly all over the world during the past century. Against the background of global warming, as one of the worldwide major meteorological disasters, extreme high temperature and drought events occur with increasing frequency in summers. The Fifth Assessment Report of the Intergovernmental Panel on Climate Change indicates that the extremely warm temperatures on most land areas worldwide has increased significantly (IPCC, 2013). Zhai and Pan (2003) point out that China is also prone to frequently occurring extremely high temperatures, such as the high temperature that occurred abruptly over the middle and lower reaches of the Yangtze River right after the end of Meiyu season in 2016 (Ding et al., 2018), which aroused nationwide attention. Qin (2015) conclude that the risk of future extremely high temperatures is high all over China. As a densely populated, economically developed area, North China's summer extreme high temperature events will result in extremely warm summers, which may have a major influence on industry, agriculture, health, and economic development. Therefore, it is of great significance to analyze the characteristics of extreme warm summer in North China and study its possible causes to better predict severe seasonal temperature anomalies and improve the ability to prevent extreme high temperature–related losses.
There is a series of studies that discuss the temperature/drought in North China. For example, abnormal high temperatures in summer are often caused by a lack of precipitation, long maintenance of abnormal circulation, prevailing abnormal radiation, and descending motions jointly (Hu et al., 2011). Plenty of studies reveal that the most direct impact factor for high temperatures in southern China is the western Pacific subtropical high (WPSH). Over WPSH controlling areas, prevailing descending motions lead to long duration of high temperatures and lack of precipitation. Besides this, the eastward extension of the South Asian high at the upper level also influences the duration of the extreme warm temperature in southern China, together with the westward stretch of the WPSH, owing to the reversed zonal oscillation of these two circulation systems (Li et al., 2015). In addition, the persistent activity of the Northeast China cold vortex (NECV) can also significantly affect China's summertime temperature. During summers with high occurrences of the NECV, known as the cooler summer, the central and southern parts of the northeast and most areas of North China tend to have below-normal temperatures (Hu et al., 2011). Apart from this, the Bay of Bengal together with the Somali cross-equatorial flows, being the upstream synoptic systems of the East Asian summer monsoon, may also impact the intensity and maintenance of southern China's extremely warm temperatures (Ding et al., 2018). Consequently, studies on the temperature itself and the influences of circulation systems are of great impact (Ding et al., 2019). Currently, studies about extremely warm temperature in North China are mainly focused on high temperatures and heat waves in summer; however, due to global or regional warming, it is also necessary to further address the differences of its forming mechanism between relative cold and warm periods.
A variety of external forcing factors can affect the atmospheric circulation systems influencing summertime high temperatures in China, among which different oceanic areas' sea surface temperature anomalies (SSTAs) play a vital role (Wang and Chen, 2014; Li et al., 2019). Some studies indicate that offshore SSTAs impact abnormal summer temperatures. For instance, the equatorial western Pacific warm pool is a critical region affecting Northeast China's summer temperature, and the Kuroshio region also shows good correlation with the summertime temperatures in this area (Ding et al., 2019). When the Kuroshio area's summer and early autumn SSTAs are significantly warm, the 500-hPa geopotential height from northern China to the east coast of Japan is correspondingly higher than normal, weakening the East Asian trough (EAH), and giving a rise to extremely warm temperatures in northern China. Meanwhile, the Indian Ocean Basin mode (IOBM) positive SSTAs can provoke the “Matsuno-Gill pattern” in the troposphere, where the Kelvin wave propagates to the Western Pacific, inducing Ekman divergent airflows developing into an anticyclonic circulation at the lower level so as to suppress convection, thereby affecting the circulation system of the entire Eurasian region (Matsuno, 1966; Gill, 1980; Yang and Liu, 2008). The distribution of sea surface temperature (SST) of the Indian Ocean (IO) influences the interaction of planetary-scale Asian monsoon systems between high and low latitudes (Yan and Xiao, 2000; Li et al., 2011). It is indicated that the IOBM positive SSTAs can result in an abnormal cyclone at the lower level in Northeast China, accompanied by ascending motion (Hu et al., 2011, 2012). Also, the relay action of the tropical IO SST impacts the intensity of the subsequent WPSH (Ding et al., 2010; Huang et al., 2010, 2011; Ding and Li, 2012; Yuan et al., 2017).
Previous studies conclude that the interannual variation of temperature in North China has good spatial consistency, and extreme high temperature events occur mostly in early summer, i.e., from June to July (You, 2019). However, the different characteristics of extremely warm early summer (EWES) in North China under different decadal backgrounds and the variation of internal atmospheric causes as well as external forcing factors require further study. Yet the physical mechanism of the possible causes of extreme high temperature events occurring in early summer in North China under different decadal backgrounds needs to be explored. In view of the abovementioned considerations, EWES in North China during cold and warm periods were analyzed to reveal the changes of atmospheric systems along with the external forcing factors. It will be of great help to understand the mechanism lying behind the extremely warm temperatures in North China and provide useful information to improve the short-term climate prediction.
The article is organized as follows: The data sets and methods applied in the study are described in section Data and Method. The abnormal characteristics of EWES in North China during cold and warm periods are analyzed contrastively in section The Ewes in Cold and Warm Periods. Section Atmospheric Circulation and External Forcing Factors contains characteristics of the corresponding atmospheric circulation and the possible SSTA causes. The conclusions together with some discussions are presented in section Conclusions and Discussion.
Data and Method
Daily mean temperature data of 2,400 stations over the period 1961–2019 provided by the National Meteorological Information Center of China are used for the present study; 290 stations in North China (35–44°N, 110–120°E) are extracted to analyze the variation characteristics of the early summer (June to July) temperature in the area. The atmospheric circulation data used in the present analysis are derived from the National Centers for Environmental Prediction–National Center for Atmospheric Research (NCEP–NCAR) reanalysis data, covering geopotential height and air temperature at different levels together with the wind fields at 850 hPa and 500 hPa on global 2.5° × 2.5° grids over the period 1961–2019 (Kalnay et al., 1996; Kistler et al., 2001). The Hadley Center monthly mean SST data set is also used with horizontal resolution of 1° × 1° over 1961–2019 (Rayner et al., 2003). Running t-test and T-test methods are applied to give the significance tests of variables and the correlation. The present study focuses on early summer temperatures in North China, which means the averaged mean temperatures on daily bases during June–July. The abovementioned variables are used to analyze the mean early summer temperature.
The EWES in Cold and Warm Periods
To visually present the variation feature of temperatures in early summer in North China, the time series of early summer mean temperature anomalies during 1961–2019 are displayed in Figure 1A. It is evident that a distinct interdecadal change occurred in the 1990s. The average early summer mean temperatures are below climatological values during 1961–1993. Hence, this period is defined as the cold period. However, the early summer mean temperatures show a significant increasing trend since the 1990s, when mean temperatures are above climatological values so that 1994–2019 is defined as the warm period contrastively. To better understand the possible causes of the EWES in North China during the cold and warm periods, the hottest 3 years in the cold period (1961, 1968, 1972) and the hottest 3 years in the warm period (2000, 2018, 2019) are selected as the typical extremely warm years (hereinafter referred to as extremely warm years) to analyze abnormal temperature characteristics, corresponding internal atmospheric causes, and external forcing factors.
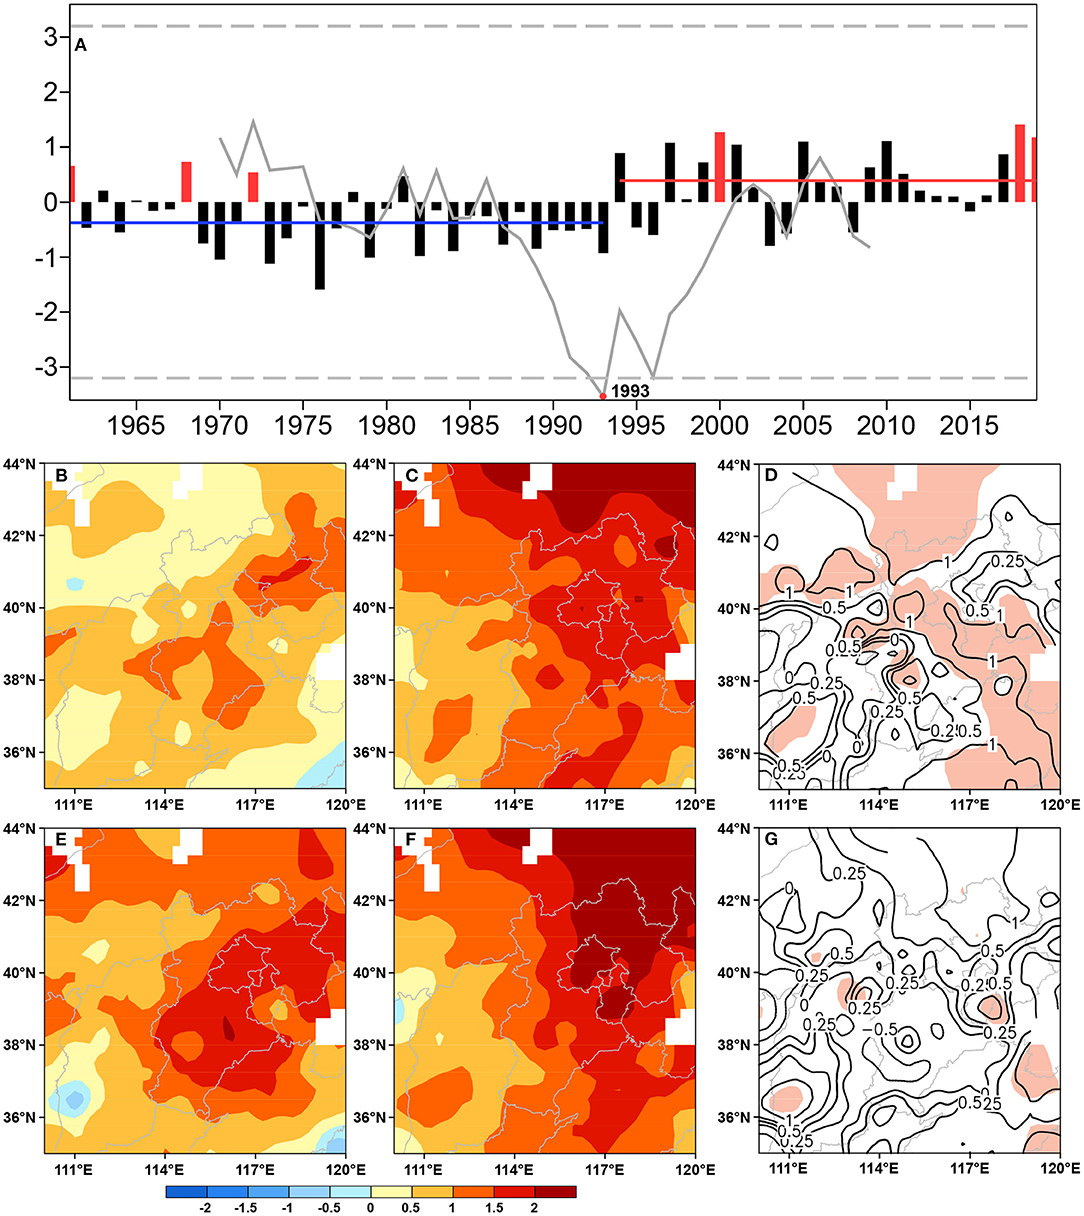
Figure 1. The 1961–2019 time series of (A) the early summer mean temperature anomalies averaged over North China (black bars, units: °C; blue line is the mean temperature anomalies averaged in the cold period; red line, warm period; red bars represent the selected extremely warm years) and running t-test (gray dashed lines indicate the 95% significance level; red dot represents the abrupt change year 1993). The mean (the second line) and maximum (the last line) temperature anomalies distribution (units: °C) of EWES in North China during (B,E) the cold period, (C,F) the warm period, and (D,G) the difference between the warm period minus the cold period (contour: mean temperature anomalies; shading areas indicate the 95% significance level).
The distribution of early summer temperatures in North China is overall higher than normal in extremely warm years during both warm and cold periods (Figures 1B,C,E,F). In cold periods, mean temperature positive anomalies are above 0.5°C in most areas of North China, where the temperature anomalies are higher than 1°C in the northeastern and central region of Hebei. In the warm period, temperature anomalies are overall higher than 1°C with the temperature anomaly higher than 2°C occurring in the Midwest of Inner Mongolia. As shown in Figures 1E,F, the distribution of the maximum temperature anomalies is consistent with the mean temperature anomalies but more strengthened. Figure 1D displays the difference of early summer temperatures between warm and cold periods in extremely warm years. The temperatures in the warm period are significantly higher than those in the cold period with the most significant area located in the Midwest of Inner Mongolia, central region of Hebei, and northern part of Shandong. The difference of the maximum temperature anomalies between the warm minus the cold periods is also similar to the mean temperature, but the significantly different area is smaller (Figure 1G).
Figure 2 displays normalized temperature anomaly latitude–height cross section averaged over 110–120°E. Apparently, positive temperature anomalies exist from the bottom to the top of the troposphere in extremely warm years during both cold and warm periods with a weak northward tilt trend. The center of the positive temperature anomaly in cold period extremely warm years is located in the area of 40–50°N, 400–200 hPa, in which the anomaly is >one and a quarter standard deviations. In contrast, the center of the positive temperature anomaly in the warm period is located in the area of 40–55°N, 600–300 hPa with the anomaly exceeding one and a quarter standard deviations. It is evident that the center is larger and stronger in the warm period than that in the cold period with a more distinct vertical distribution feature. As for North China, positive surface air temperature anomalies occurring from the bottom to the top of the troposphere with the center lying in the middle level of the troposphere, indicates that they are directly connected to circulation anomalies in the middle troposphere along with the lower troposphere. In Figure 2C, extremely warm year temperature anomalies from the surface to the upper level troposphere in the warm period is much higher than that in the cold period, yet tropopause is on the contrary with the most significant area located in 1,000–800 hPa.
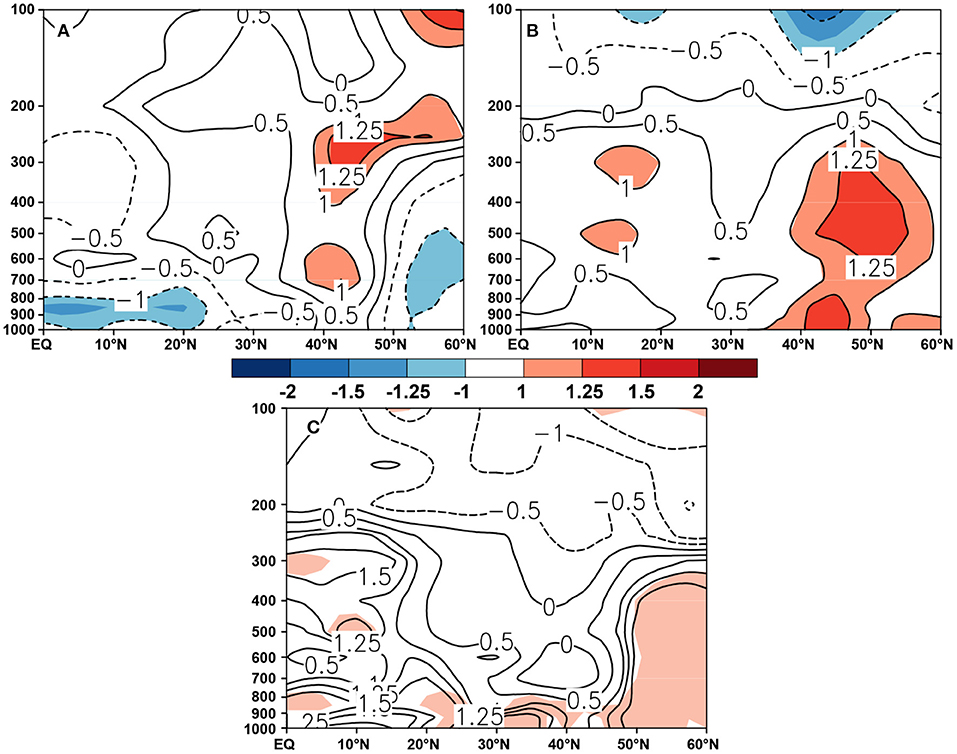
Figure 2. Latitude–height profile of normalized temperature average of extremely warm years over 110–120°E in (A) the cold period and (B) the warm period, and (C) the difference of the warm period minus the cold period (contour: mean temperature anomalies; shading areas indicate the 90% significance level).
Atmospheric Circulation and External Forcing Factors
According to previous research, the NECV, Eurasian continental high (ECH), and WPSH have great impact on the early summer temperature anomalies in eastern China (Hu et al., 2011; Zhang, 2011). Figure 3 shows that the intensity of the ECH in warm periods is obviously stronger than that in cold periods. The area of the WPSH is equivalent to normal, and its west-extended ridge point is slightly more westward than normal in warm period extremely warm years, whereas the area of the WPSH in cold period extremely warm years is smaller than normal. Meanwhile, the climate average of the zero vorticity contour lies near the position of 35°N, whereas it is located near the position of 40°N in the cold period and 45°N in the warm period, indicating the NECV center at the level of 500 hPa is apparently north of its climate-averaged position, and the cold vortex activities are weaker than normal for EWES in North China, especially during the warm period.
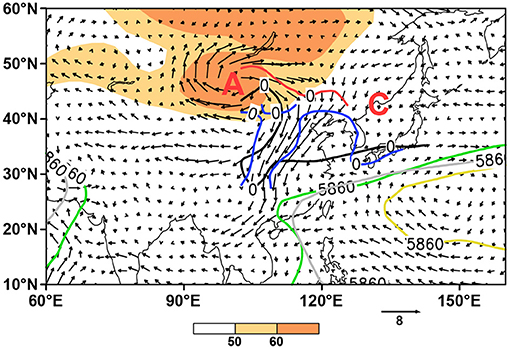
Figure 3. Distribution of the ECH difference of extremely warm years between the warm and cold periods (shaded; units: gpm), 5,880-gpm contours (gray thick line indicates climate mean, green and yellow thick line for extremely warm years of warm period and cold period, respectively) and the 850-hPa wind anomalies difference of extremely warm years between warm and cold periods (vector; units: m s −1; Letters A and C represent low-level anticyclone and cyclone anomalies, respectively.) Thick red line, blue thick line, and black thick lines mean the NECV southern boundaries (the zero-vorticity line) for extremely warm years of the warm period, cold period, and climate mean, respectively.
That is, the NECV has a more significant influence on EWES in North China during the warm period than the cold period. Besides this, the 850-hPa cyclone of wind anomalies lies in the Mongolia region and the anticyclonic circulation is located over the Sea of Japan and north of the Korean Peninsula. North China, controlled by anticyclonic circulation, is prone to descending motions, which leads to high temperatures in this area.
Figures 4A,B display the temporal variability of geopotential height at the level of 500 hPa of early summer averaged across 100–120°E, where 5,760-gpm contours and shadings denote the ridge line of ECH. It is found that the averaged ridge line of warm period early summer ECH shifted further northward than the normal and cold period ridge line of ECH, which is slightly more southward than normal (Figure 4A). In addition, the ridge line of ECH in warm period extremely warm years is much further northward than normal, only shifting further southward than normal briefly in early June and late June, whereas the ridge line of ECH in cold period extremely warm years is overall much further northward than normal, shifting further southward than normal briefly in early June and early July (Figure 4B). Figures 4C,D show temporal variability of geopotential height at the level of 500 hPa in early summer averaged over 110–130°E, where 5,860-gpm contours and shadings denote the ridge line of WPSH. The ridge line of the warm period averaged WPSH is slightly more northward than normal and the cold period in June yet equivalent to normal and the cold period in early July (Figure 4C). Besides this, the ridge line of WPSH of extremely warm years with intensity stronger than normal, reaches the most northward in late July (Figure 4D). Furthermore, daily evolution of vorticity averaged over 110–130°E at the level of 500 hPa is presented in Figures 4E,F, which denotes the inter-seasonal NECV variability. It is shown that the NECV during the warm period also exhibits weaker features and shifts further northward than during the cold period. The vorticity is negative over 30–45°N in middle and late July, indicating that the NECV activity is weak in this period (Figure 4F), which is basically coincident with the ECH and WPSH ridge line reaching the most northward (Figures 4B,D). Notably, the negative vorticity center locates more northward, meaning that the NECV is weaker in the warm period than in the cold period. Therefore, the long duration of strong and northward shifted ECH and weakened NECV together with strong WPSH are the major atmospheric reasons that directly result in the EWES in North China. These atmospheric circulation anomalies have greater impact on the warm period than the cold period, resulting in the anomalies of high temperatures of EWES being much more significant in the warm period than the cold period.
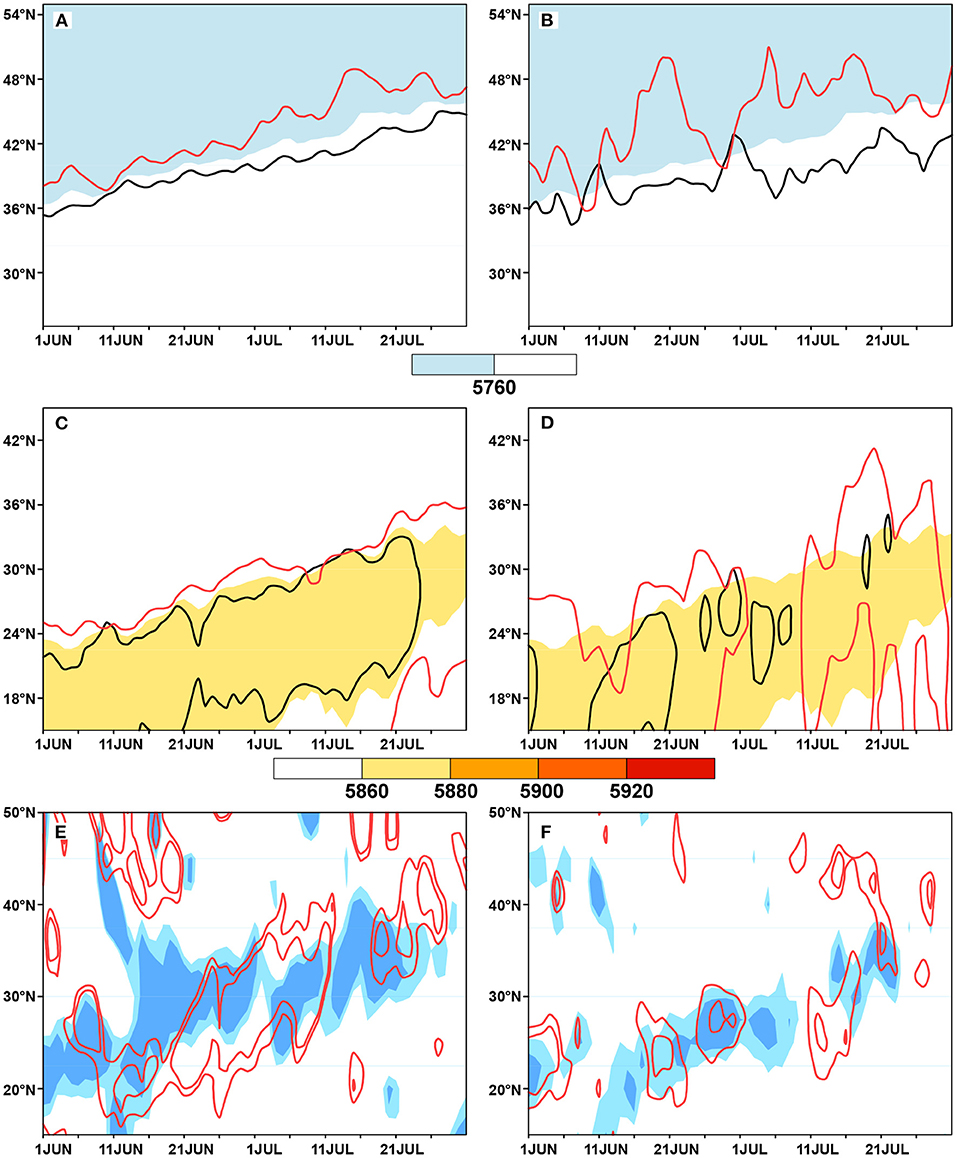
Figure 4. Time–latitude profiles of (A,B) geopotential height at 500 hPa averaged over 100–120°E (units: gmp; shading for geopotential height lower than 5,760 gpm, red and black lines for warm and cold period, respectively) and (C,D) geopotential height at 500 hPa averaged over 110–130°E (units: m s −1; shading for geopotential height higher than 5,860 gpm, red and black lines for extreme years of warm and cold periods, respectively) and (E,F) vorticity averaged over 110–130°E (units: 10−6 s−2; shading for vorticity > 10−5 s−2 for the cold period, red contour for the warm period). The left panel shows annual mean variables, and the right panel shows extremely warm years averaged variables [(A,C,E) are average for warm and cold periods; (B,D,F) are average for extremely warm years of warm and cold period].
Wallace and Horel (1981) and Wallace and Shukla (1983) concludes that energy is transferred from tropical SSTA to temperate regions mainly through the two-dimensional Rossby wave train, evoking a significant response of the atmospheric circulation. In that case, finding out whether possible external forcing factors that affect EWES in North China is of great importance. Distributions of the early summer SSTA average of the tropical IO and Kuroshio area in the cold and warm periods and in extremely warm years during two periods are presented, respectively (Figure 5). It can be found that SSTAs of tropical IO switches from negative anomalies to positive ones, showing an IO basin-wide (IOBW)-like mode shifting from a negative phase to a positive one (Figures 5A,B). SSTAs in the Kuroshio area show similar variation features as those of tropical IO (Figures 5C,D). The studies referenced above point out that the action of the tropical IO SSTAs have an impact on atmospheric circulation by stimulating the Kelvin wave, giving rise to climate change in East Asia (Xie et al., 2009; Ding et al., 2010; Huang et al., 2010, 2011; Ding and Li, 2012; Yuan et al., 2017). In addition, SSTAs of the Kuroshio area can lead to abnormal EAH, affecting the East Asia climate (Sun and Wang, 2006; Yang et al., 2013; Shi et al., 2015). Hence, SSTAs of IOBW and the Kuroshio area might have major influence on EWES in the North China.
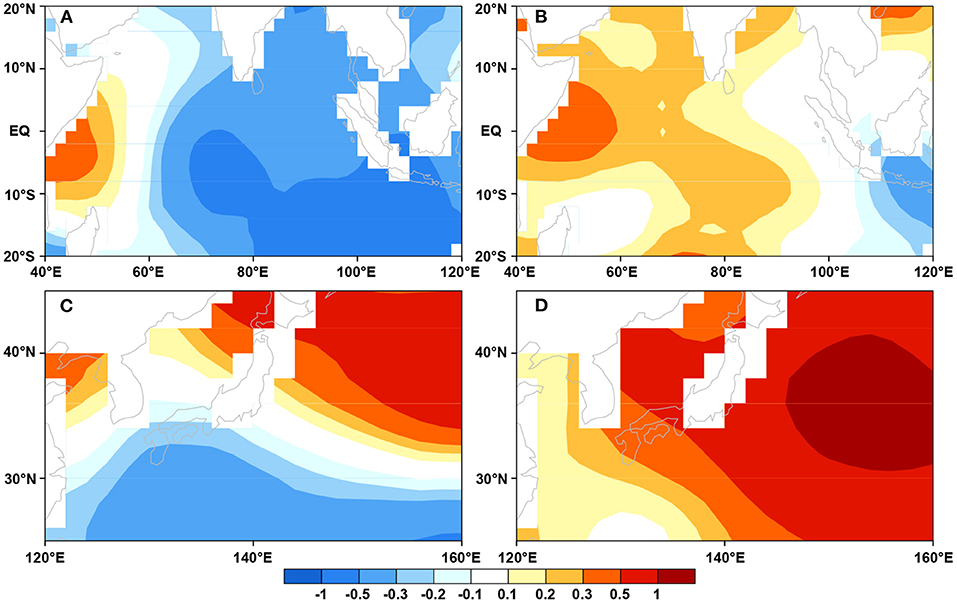
Figure 5. Distributions of early summer SSTA average (units: °C) of extreme years over (A,B) tropical IO and (C,D) the Kuroshio area in the cold period (A,C) and the warm period (B,D).
To potentially reveal the underlying impact mechanism of the abovementioned key area SSTAs on EWES in North China, the IOBW index in terms of the SSTA averaged over 20°S−20°N, 40–110°E, and Kuroshio SST index (KCS index) in terms of the SSTA averaged over 35°N, 140–150°E and 25–30°N, 125–150°E are extracted from the 130 climate signal indices data set (http://cmdp.ncc-cma.net/Monitoring/cn_index_130.php). Time series of normalized IOBW and KCS indexes in early summer during 1961–2019 are given in Figure 6. It can be seen that the IOBW and KCS indexes both demonstrate significant decadal variability with a pronounced shift from negative to positive in the early 1990s. That is, the average indexes are negative before the 1990s, meaning that SSTs are overall below normal, whereas the average indices are positive after the 1990s, indicating that SSTAs are overall above normal. The correlation coefficient between North China early summer temperature and IOBW and KCS indexes are 0.26 and 0.51, respectively, passing the 95% significance level. The correlation coefficient between the detrended North China early summer temperature and detrended IOBW and KCS indexes were calculated. The detrended result between North China early summer temperatures and the KCS index (0.40) is consistent with the not detrended one (0.51), passing the 95% significance level. Hence, SSTAs of IOBW and the Kuroshio area may have great impacts on EWES in North China.
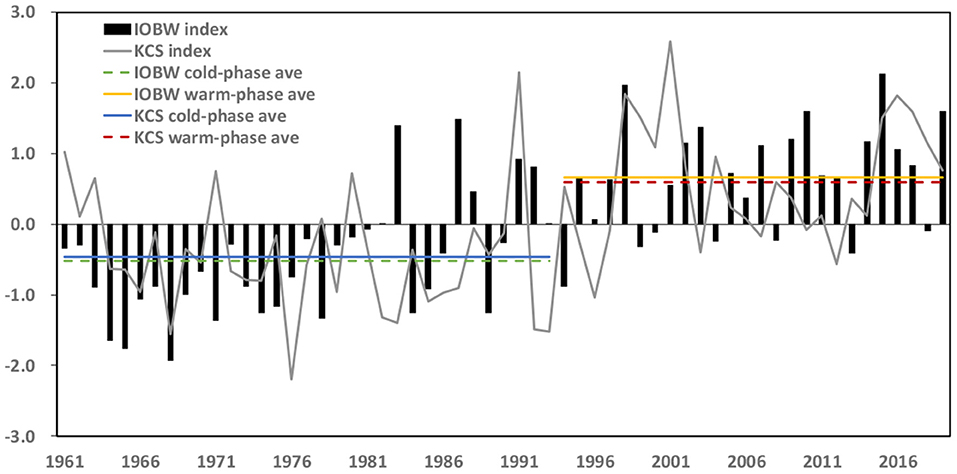
Figure 6. Time series of normalized IOBW and KCS indexes of early summer during 1961–2019.
Based on the above analysis, persistent strong and northward shifted ECH and weak NECV, together with strong WPSH, are major reasons responsible for EWES in North China. The impact of these factors is much stronger in warm periods than in cold ones. The mechanism of how the positive SSTAs of IOBW and the Kuroshio area affect vital circulation systems and EWES in North China, especially the differences between warm and cold period are further analyzed in the following content.
Figures 7A,B demonstrate the regression of geopotential height at the level of 500 hPa on the IOBW index in early summer. There is a positive center located over the middle and high latitudes of Eurasia (90–120°E, 40–60°N) during the warm period, indicating that the positive IOBW contributes to a stronger ECH (Figure 7B), whereas the positive center is weaker in the cold period, which suggests that the impact of IOBW on the ECH is also much weaker than the warm period (Figure 7A). The tropical western Pacific is controlled by positive anomalies in Figures 7A,B, implying positive IOBW is in favor of intensified WPSH, and the influence of IOBW in the warm period is much stronger than in the cold period. Previous studies conclude that the IO SST warming trend mainly leads to strong and large WPSH, and the correlation between the IO SST and geopotential height over the eastern region of Siberia is positive (Nitta, 1987; Huang and Lu, 1989; Huang and Yan, 1999; Yan and Xiao, 2000; Ding et al., 2019), which is consistent with the conclusions obtained in the present study. The difference of 500 hPa geopotential height between the warm and cold periods is further calculated using regression coefficients demonstrated in Figures 7A,B. The geopotential height difference (Figure 7C) shows significantly positive values over almost all areas from Eurasia east of Siberia to Northeast China, even to North China, which means the geopotential height at the level of 500 hPa over Northeast China and North China during the warm period is prone to be higher and the NECV is less active than in the cold period, when tropical IO SSTAs are above normal. In other words, the IOBW index is positive, which leads to more significant EWES in North China. Above all, the overall warmer than normal SSTs in tropical IO are conducive to a stronger ECH and WPSH and a weaker NECV, causing North China EWES with much stronger intensity during warm than cold periods.
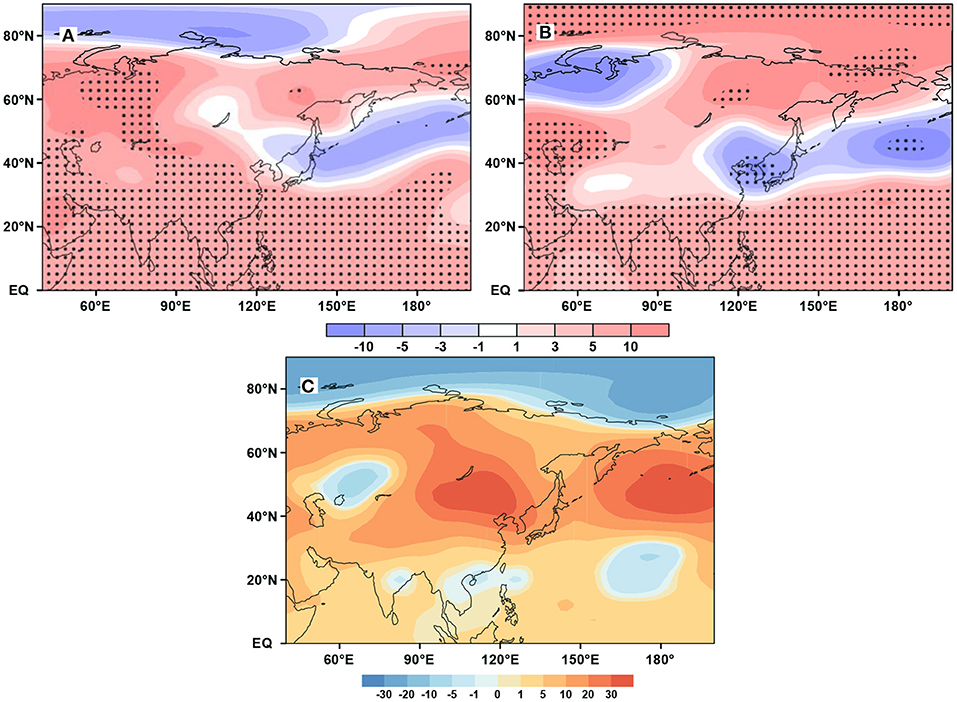
Figure 7. Regression of 500 the hPa geopotential height against the IOBW index in early summer during (A) the cold period and (B) the warm period (dotted areas indicate the 95% significance level), and (C) difference of 500-hPa geopotential height (unit: gpm) between warm and cold periods calculated by linear regression.
Figure 8 demonstrates the regression of 500-hPa geopotential height against the KCS index in early summer. During the cold period, North China is controlled by positive anomalies, indicating that, when the KCS index is positive, i.e., warming SSTs in the Kuroshio area, the geopotential height over North China is higher than normal, which can lead to higher temperatures in North China (Figure 8A). During the warm period, the positive anomalies controlling area extends, covering most regions of the middle and high latitudes of Eurasia (90–120°E, 40–60°N), and negative anomalies controlling the Sea of Japan (Figure 8B). This pattern is in favor of higher than normal climate early summer temperatures in North China. Geopotential height anomalies are much higher during the warm period than the cold period. Previous studies point out that the warming trend of the Kuroshio area SST mainly leads to positive geopotential height anomalies over most regions of the middle and high latitudes of Eurasia and significant heating in the lower troposphere, stimulating upward and northward wave activity flux, resulting in the abnormally intensified WPSH over the East Asia coast (Wang, 2004). The difference of 500-hPa geopotential height between the warm and cold periods is also calculated using regression coefficients demonstrated in Figures 8A,B. The geopotential height difference pattern shown in Figure 8C indicates stronger ECH and WPSH, less active and more northward NECV during the warm period than the cold period when the Kuroshio area SSTAs are above normal. That is to say, the positive KCS index can lead to more significant EWES in North China.
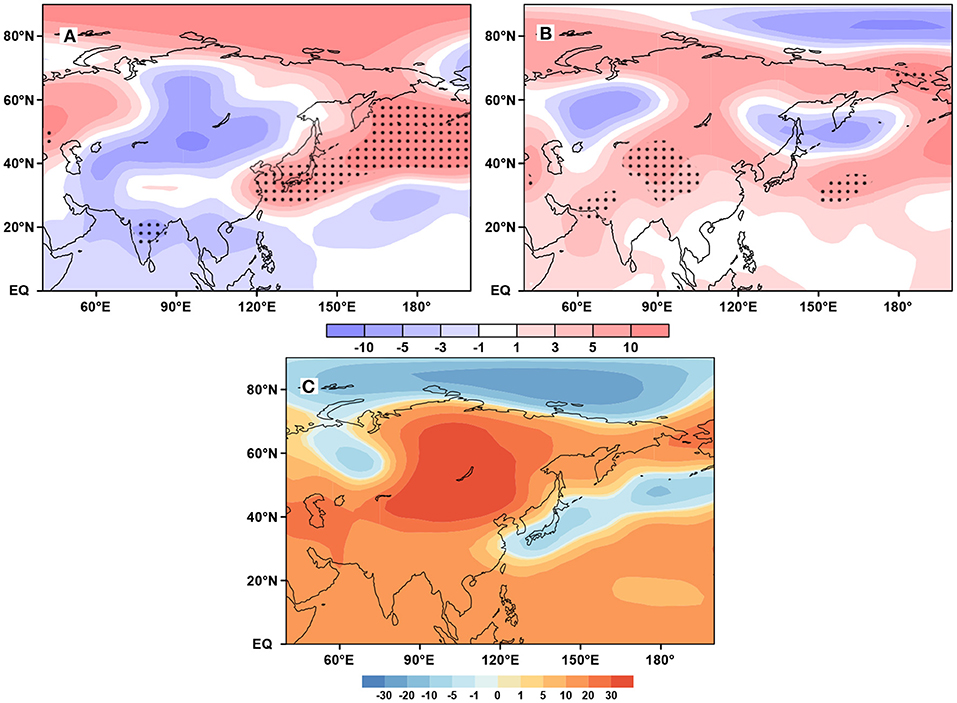
Figure 8. As in Figure 7 except for the results of KCS index.
Additionally, the detrended regressions of 500-hPa geopotential height against the KCS index were calculated (Figure 9). As shown in Figure 9, the distribution of detrended regressions is basically consistent with the not detrended regressions (Figure 8) with an increasing significant area of the detrended correlation coefficient during the cold period (Figure 10A). The difference of 500-hPa geopotential height between the warm and cold periods calculated by detrended linear regression (Figure 10C) is similar to the not detrended result (Figure 8C) but with a slightly weakening. The detrended regressions of 500-hPa geopotential height against the IOBW index were also calculated (not shown here) with similar distribution to the not detrended result during the warm period but a different pattern during the cold period.
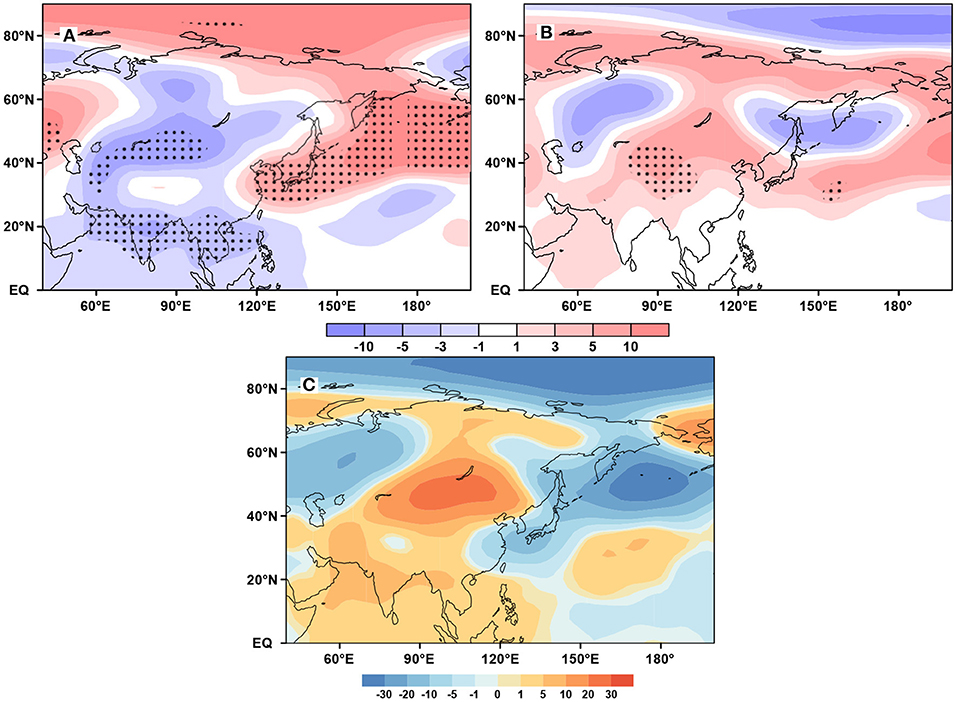
Figure 9. Detrended regression of 500-hPa geopotential height against the KCS index in early summer during (A) the cold period and (B) the warm period (dotted areas indicate the 95% significance level), and (C) difference of 500-hPa geopotential height (unit: gpm) between warm and cold periods calculated by detrended linear regression.
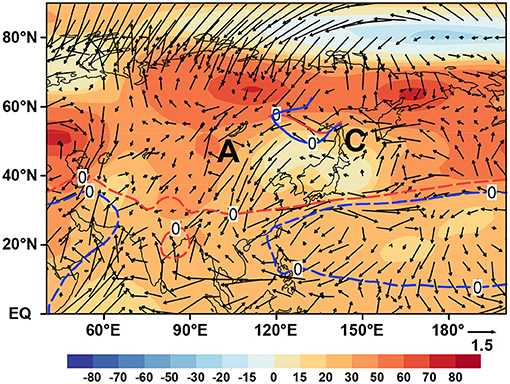
Figure 10. Composite of atmospheric circulation of high- and low-index years (the difference of 500-hPa eddy geopotential height (shading, units: gpm) and the 850-hPa wind (vector, units: m s −1) between high- and low-index years). Letters A and C represent anomalous low-level anticyclone and cyclone, respectively. The thick solid lines marked as 0 indicate the southern boundaries of NECV with the red line for high-index years and blue line for low-index years. Thick dashed lines are the same as solid lines except for denoting the WPSH position.
Based on the results obtained, warming SSTs over IOBW and the Kuroshio area can both lead to a warm early summer in North China. To further investigate the common influence of them on the warm early summer in North China, we selected the top 5 years with the highest IOBW and KCS indexes at the same time are chosen (1998, 2015, 1991, 2016, and 2019, hereinafter referred to as high-index years) and the 5 years with the lowest IOBW and KCS indexes (1968, 1965, 1976, 1974, and 1985, hereinafter referred as low-index years). Composite analysis is conducted to investigate the atmospheric circulation difference in early summer between high and low index years (Figure 9). With warming in tropical IO and the Kuroshio area SSTs, the eddy geopotential height denoted WPSH is larger than the original geopotential height denoted WPSH (not shown here) in both high and low, which reflects the basic circulation feature corresponding to the extreme hot summer events. However, as shown in Figure 9, the WPSH of the high-index year denoted by the distribution of the 500-hPa eddy geopotential height is much larger than that of the low-index year, which implies the probable influence of global warming. The zero vorticity line in high-index years, located near 60°N, is more northward than it in the low-index years (50°N), meaning weaker activity and more northward location of NECV in high index years. In addition, North China is controlled by anticyclone anomalies at 850-hPa wind anomalies. Therefore, early summer temperatures in North China are much higher in high-index years than low ones. According to previous studies, positive SSTAs in tropical IO can stimulate a wave train similar to the Pacific–North American and the East Asia–Pacific teleconnection patterns over middle and high latitudes of the Northern Hemisphere and give rise to more intensified ECH and WPSH (Yan and Xiao, 2000). Moreover, abnormally high SSTs in the Kuroshio area can weaken the activity of NECV and intensify ECH and WPSH by ocean-atmosphere interaction (Wang, 2004; Ding et al., 2019). These results are consistent with the conclusions obtained in the present study.
Conclusions and Discussion
The present study analyzes the characteristics of EWES in North China and explores the possible mechanisms behind it to further understand the mechanism of EWES in North China and provide useful information to improve the short-term climate prediction. Major conclusions are as follows.
A distinct decadal change of early summer temperature average in North China occurred in 1993. The distribution of early summer temperatures in North China is overall higher than normal in extremely warm years in both cold (1961–1993) and warm (1994–2019) periods. In the cold period, positive temperature anomalies of extremely warm years are above 0.5°C in most areas of North China, where the temperature anomalies are above 1°C in the northeast and central region of Hebei. In the warm period, temperature anomalies are overall higher than 1°C in North China with the temperature anomalies higher than 2°C occurring in the Midwest of Inner Mongolia. The EWES occurring in the warm period are significantly stronger than those in the cold period with the most significant areas located in the Midwest of Inner Mongolia, the central region of Hebei province, and the north part of Shandong province. Temperatures in North China are directly related to the circulation in the middle troposphere, causing the positive anomalies of extremely warm years occurring from the bottom to the top of the troposphere in both cold and warm periods and with a weak northward tilt trend and more distinct vertical distribution in the warm period.
The intensity of the ECH in warm period extremely warm years is obviously stronger than that in the cold period. Notably, the area of the WPSH is equivalent to normal, and its west ridge point is slightly more westward than normal in extremely warm years, whereas the area of the WPSH in cold period extremely warm years is smaller than normal. The NECV center at the level of 500 hPa lies significantly north of its climate-averaged position, and the cold vortex activities are weaker than normal during extremely warm years in North China, especially during the warm period. The vorticity of extremely warm years is negative over 30°-45°N in middle and late July, indicating that the NECV activity is weak in this period, which basically matches the feature of ECH and WPSH. Compared with extremely warm years in the cold period, the negative vorticity center locates more northward; NECV is much weaker in the warm period. Therefore, the long duration of the strong and northward shifted ECH and weakened NECV together with strong WPSH are the major atmospheric reasons that directly lead to the EWES in North China. These three atmospheric factors' impact on the warm period is much stronger than the cold period, causing the EWES occurring in the warm period to be significantly stronger than those in the cold period.
Based on the 2013 hottest summer on record in Eastern China, Sun et al. (2014) reveal that anthropogenic influence has caused a more than 60-fold increase in the likelihood of the extreme warm 2013 summer since the early 1950s, project that similarly hot summers will become even more frequent in the future, and estimate that a rapid increase in the risk of extreme summer heat in Eastern China. Besides this, geopotential height (gph) is used to measure the western Pacific high and other high/low pressure systems in this study. Under a global warming background, the gph increases almost everywhere as predicted by the hypsometric equation, and it may cause a discrepancy between changes in gph and changes in atmospheric circulation (Yang and Sun, 2003; He et al., 2018; He and Zhou, 2020; Jia et al., 2021). For example, as seen in Figure 10, the decadal difference (difference between the high-index years concentrated in the latter period and the low-index years concentrated in the early period, almost equivalent to decadal difference) in the gph is positive almost everywhere, and the cyclone over northeastern China is associated with a weak positive gph anomaly. To solve this apparent discrepancy, He et al. (2018) and He and Zhou (2020) suggest using eddy geopotential height (obtained by removing regional averaged gph within 0–40°N for each year) instead of gph.
Positive SSTA in the tropical IO and the Kuroshio area are favorable for the stronger and larger ECH and WPSH as well as the weaker and more northward NECV, leading to stronger anticyclonic circulation over Northern China, giving rise to downward air motion controlling this area, resulting in a rise of temperature in North China. The joint effect of warming SSTAs over tropical IO and the Kuroshio area provides favorable conditions for the occurrence of EWES in North China. The impact of the positive tropical IO and the Kuroshio area SSTA of the warm period is more significant than the cold period, resulting in much stronger EWES in North China during the warm period (Figure 11).
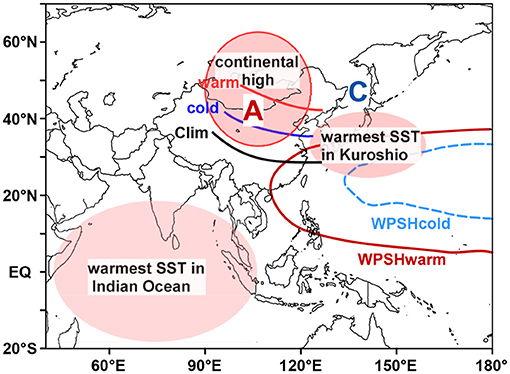
Figure 11. Sketch map of North China's possible EWES causes. The dashed blue line (WPSH cold) and solid red line (WPSH warm) represent WPSH position during extremely warm years in the warm and cold periods, respectively. The thick lines (marked as warm, cold, and clim) mean the southern boundaries (the zero-vorticity line) of NECV with the red (blue) line extremely warm years for warm (cold) period and black line for climatological state. Letters A and C correspondingly mean the low-level anomalies of the anticyclone and cyclone.
It should be stressed that external forcing factors other than the signals studied in the present study, such as upstream sea ice and snow cover, can also affect the East Asian atmospheric circulation system significantly, which closely results in the extremely warm temperature (Yasunari et al., 1991; Wu et al., 2009, 2013; He et al., 2020; Labe et al., 2020; Li et al., 2020). An interesting research topic, therefore—one that cannot be ignored and that we intend to investigate ourselves in the future—is to examine the effects of other factors on the EWES in North China.
Data Availability Statement
The original contributions presented in the study are included in the article/supplementary material, further inquiries can be directed to the corresponding author.
Author Contributions
XL and ZG drafted the manuscript. ZY and XW analyzed the atmospheric circulation factors. CY and SC analyzed the external forcing factors. GF designed the strategy. TL collected and extracted the datasets. All authors contributed to the article and approved the submitted version.
Funding
This work was supported by the National Key Research and Development Program of China (2018YFC1507702), the National Natural Science Foundation of China Project (41875100 and 42075057), the Innovation and development project of CMA (CXFZ2021Z034), the Research and development project of Hebei Meteorological Service (19ky34), and the National Key Research and Development Program of China (2018YFC1505604).
Conflict of Interest
The authors declare that the research was conducted in the absence of any commercial or financial relationships that could be construed as a potential conflict of interest.
Publisher's Note
All claims expressed in this article are solely those of the authors and do not necessarily represent those of their affiliated organizations, or those of the publisher, the editors and the reviewers. Any product that may be evaluated in this article, or claim that may be made by its manufacturer, is not guaranteed or endorsed by the publisher.
References
Ding, R. Q., Ha, K., and Li, J. P. (2010). Interdecadal shift in the relationship between the East Asian summer monsoon and the tropical Indian Ocean. Clim. Dyn. 34, 1059–1107. doi: 10.1007/s00382-009-0555-2
Ding, R. Q., and Li, J. P. (2012). Influences of ENSO teleconnection on the persistence of sea surface temperature in the tropical Indian Ocean. J. Clim. 15, 8177–8195. doi: 10.1175/JCLI-D-11-00739.1
Ding, T., Gao, H., and Li, W. J. (2018). Extreme high-temperature event in southern China in 2016 and the possible role of cross-equatorial flows. Int. J. Climatol., 38, 3579–3594. doi: 10.1002/joc.5518
Ding, T., Yuan, Y., Zhang, J. M., and Gao, H. (2019). 2018: The hottest summer in China and possible causes. J. Meteor. Res. 33, 577–592. doi: 10.1007/s13351-019-8178-y
Gill, A. E. (1980). Some simple solutions for heat-induced tropical circulation. Q. J. Roy. Meteor. Soc. 106, 447–462. doi: 10.1002/qj.49710644905
He, C., Lin, A., Gu, D., Li, C., Zheng, B., and Wu, B. (2018). Using eddy geopotential height to measure the western North Pacific subtropical high in a warming climate. Theor. Appl. Climatol. 131, 681–691. doi: 10.1007/s00704-016-2001-9
He, C., and Zhou, W. (2020). Different enhancement of the East Asian summer monsoon under global warming and interglacial epochs simulated by CMIP6 models: role of the subtropical high. J. Clim. 33, 9721–9733. doi: 10.1175/JCLI-D-20-0304.1
He, S., Xu, X., Furevik, T., and Gao, Y. (2020). Eurasian cooling linked to the vertical distribution of Arctic warming. Geophys. Res. Lett. 47:e2020GL087212. doi: 10.1029/2020GL087212
Hu, K. M., Huang, G., Qu, X., and Huang, R. H. (2012). The impact of Indian Ocean variability on high temperature extremes across the southern Yangtze River Valley in late summer. Adv. Atmos. Sci., 29, 91–100. doi: 10.1007/s00376-011-0209-2
Hu, K. X., Lu, R. Y., and Wang, D. H. (2011). Cold vortex over Northeast China and its climate effect. Chinese J. Atmos. Sci. 35, 179–191. (in Chinese).
Huang, G., Hu, K. M., and Xie, S. P. (2010). Strengthening of tropical Indian Ocean teleconnection to the Northeast Pacific since the Mid-1970s: an atmospheric GCM study. J. Clim. 23, 5294–5304. doi: 10.1175/2010JCLI3577.1
Huang, G., Qu, X., and Hu, K. M. (2011). The impact of tropical Indian Ocean on South Asian high in boreal summer. Adv. Atmos. Sci. 28, 421–432. doi: 10.1007/s00376-010-9224-y
Huang, G., and Yan, Z. (1999). The East Asian summer monsoon circulation anomaly index and its interannual variations. Chin. Sci. Bull., 44, 1325–1329. doi: 10.1007/BF02885855
Huang, R., and Lu, L. (1989). Numerical simulation of the relationship between the anomaly of subtropical high over East Asia and the convective activities in the western tropical Pacific. Adv. Atmos. Sci. 6, 202–214. doi: 10.1007/BF02658016
IPCC (2013). Climate Change 2013: The Physical Science Basis. Contribution of Working Group I to the Fifth Assessment Report of the Intergovernmental Panel on Climate Change. Cambridge; New York, NY: Cambridge University Press.
Jia, B., Peng, J., Hu, S., and Feng, G. (2021). Novel dynamical indices for the variations of the western Pacific subtropical high based on three-pattern decomposition of global atmospheric circulation in a warming climate. Clim Dynam. 56, 3473–3487. doi: 10.1007/s00382-021-05650-x
Kalnay, E., Kanamitsu, M., Kistler, R., Collins, W., Deaven, D., and Gandin, L. (1996). The NCEP/NCAR 40-year reanalysis project. Bull. Amer. Meteor. Soc. 77, 437–472. doi: 10.1175/1520-0477(1996)077<0437:TNYRP>2.0.CO;2
Kistler, R., Kalnay, E., Collins, W., Saha, S., White, G., and Woollen, J. (2001). The NCEP-NCAR 50-year reanalysis: monthly means CD-ROM and documentation. Bull. Amer. Meteor. Soc. 82, 247–268. doi: 10.1175/1520-0477(2001)082<0247:TNNYRM>2.3.CO;2
Labe, Z., Peings, Y., and Magnusdottir, G. (2020). Warm Arctic, cold Siberia pattern: role of full Arctic amplification versus sea ice loss alone. Geophys. Res. Lett. 47:e2020GL088583. doi: 10.1029/2020GL088583
Li, F., Wan, X., Wang, H., Orsolini, Y. J., Cong, Z., and Gao, Y. (2020). Arctic sea-ice loss intensifies aerosol transport to the Tibetan Plateau. Nat. Clim. Change 10, 1037–1044. doi: 10.1038/s41558-020-0881-2
Li, J., Ding, T., Jia, X. L., and Zhao, X. C. (2015). Analysis on the extreme heat wave over China around Yangtze River region in the summer of 2013 and its main contributing factors. Adv. Atmos. Sci., 2015, 1–15. doi: 10.1155/2015/706713
Li, J. P., Wu, G. X., and Hu, D. X. (2011). Ocean-Atmosphere Interaction over the Joining Area of Asia and Indian-Pacific Ocean and Its Impact on the Short-Term Climate Variation in China (Volume I). Beijing: China Meteorological Press. 1–516. (in Chinese).
Li, J. P., Zheng, F., Sun, C., Feng, J., and Wang, J. (2019). Pathways of influence of the Northern Hemisphere mid–high latitudes on East Asian climate: a review. Adv. Atmos. Sci., 36, 902–921. doi: 10.1007/s00376-019-8236-5
Matsuno, T. (1966). Quasi-geostrophic motions in the equatorial area. J. Meteor. Soc. Japan 44, 25–43. doi: 10.2151/jmsj1965.44.1_25
Nitta, T. (1987). Convective activities in the tropical western Pacific and their impact on the Northern Hemisphere summer circulation. J. Meteor. Soc. Japan 65, 373–390. doi: 10.1175/1520-0469(1987)044<1554:TAOPVT>2.0.CO;2
Qin, D. H. (2015). China National Assessment Report on Risk Management and Adaptation of Climate Extremes and Disasters. Beijing: Science Press.
Rayner, N. A., Parker, D. E., Horton, E. B., Folland, C. K., Alexander, L. V., Rowell, D. P., et al. (2003). Global analyses of sea surface temperature, sea ice, and night marine air temperature since the late nineteenth century. J. Geophys. Res. 108:4407. doi: 10.1029/2002JD002670
Shi, X. M., Sun, J. L., Wu, D. X., Yi, L., and Wei, D. N. (2015). Impact of Autumn SST in the Japan Sea on winter rainfall and air temperature in Northeast China. J. Ocean Univ. China 14, 604–611. doi: 10.1007/s11802-015-2477-4
Sun, J. Q., and Wang, H. J. (2006). Regional difference of summer air temperature anomalies in Northeast China and its relationship to atmospheric general circulation and sea surface temperature. Chin J. Geophys. 49, 588–598. doi: 10.1002/cjg2.872
Sun, Y., Zhang, X., Zwiers, F. W., Song, L., Wan, H., and Hu, T. (2014). Rapid increase in the risk of extreme summer heat in Eastern China. Nat. Clim. Change 4, 1082–1085. doi: 10.1038/nclimate2410
Wallace, J. M., and Horel, J. D. (1981). Planetary-scale atmospheric phenomena associated with the southern oscillation. Mon. Weather Rev. 109, 813–829. doi: 10.1175/1520-0493(1981)109<0813:PSAPAW>2.0.CO;2
Wallace, J. M., and Shukla, J. (1983). Numerical simulation of the atmosphere response to equatorial pacific sea surface temperature anomaly. J. Atmos. Sci. 40, 1613–1630. doi: 10.1175/1520-0469(1983)040<1613:NSOTAR>2.0.CO;2
Wang, L., and Chen, W. (2014). A CMIP5 multimodel projection of future temperature, precipitation, and climatological drought in China. Int J Climatol 34, 2059–2078. doi: 10.1002/joc.3822
Wang, X. L. (2004). A Correlation Study between SSTA over the Winter Kuroshio Area and East Asian Circulation and the Climate of China in Summer. Nanjing: Nanjing University of Information Science and Technology. (in Chinese).
Wu, B. Y., Yang, K., and Zhang, R. H. (2009). Eurasian snow cover variability and its association with summer rainfall in China. Adv. Atmos. Sci. 26, 31–44. doi: 10.1007/s00376-009-0031-2
Wu, B. Y., Zhang, R. H., D.' Arrigo, R, and Su, J. Z. (2013). On the relationship between winter sea ice and summer atmospheric circulation over Eurasia. J. Clim. 26, 5523–5536. doi: 10.1175/JCLI-D-12-00524.1
Xie, S. P., Hu, K., Hafner, J., Tokinaga, H., Du, Y., and Huang, G. (2009). Indian Ocean capacitor effect on Indo–western Pacific climate during the summer following El Nino. J. Clim. 22, 730–747. doi: 10.1175/2008JCLI2544.1
Yan, H. M., and Xiao, Z. N. (2000). The numerical simulation of the Indian Ocean SSTA influence on climatic variations over Asian monsoon region. J. Trop. Meteor., 16, 18–27. (in Chinese).
Yang, H., and Sun, S. Q. (2003). Longitudinal displacement of the subtropical high in the Western Pacific in summer and its influence. Adv. Atmos. Sci., 20, 921–933. doi: 10.1007/BF02915515
Yang, J. L., and Liu, Q. Y. (2008). The “charge/discharge” roles of the basin-wide mode of the Indian Ocean SST anomaly. Acta. Oceanologica. Sinica., 30, 12–19. (in Chinese).
Yang, M. Z., Chen, L. J., and Song, W. L. (2013). Impact of Kuroshio SST on first frost dates in Northern China. Meteor. Mon. 39, 1125–1132. (in Chinese).
Yasunari, T., Kitoh, A., and Tokioka, T. (1991). Local and remote responses to excessive snow mass over Eurasia appearing in the northern spring and summer climate, a study with the MRI-GCM. J. Meteor. Soc. Japan 69, 473–487. doi: 10.2151/jmsj1965.69.4_473
You, Q. (2019). Analysis and Diagnosis of Extreme High Events on Intraseasonal Scale in Summer in Eastern China. Nanjing: Nanjing University of Information Science and Technology. (in Chinese).
Yuan, Y., Gao, H., Li, W. J., Liu, Y. J., Chen, L. J., and Zhou, B. (2017). The 2016 summer floods in China and associated physical mechanisms: a comparison with 1998. J. Meteor. Res. 31, 261–277. doi: 10.1007/s13351-017-6192-5
Keywords: the North China, extremely warm early summer, decadal backgrounds, atmospheric circulation, sea surface temperature
Citation: Li X, Yao Z, Wang X, Yu C, Che S, Gong Z, Feng G and Li T (2021) Possible Causes of Extremely Warm Early Summer in North China During Cold and Warm Periods. Front. Clim. 3:762997. doi: 10.3389/fclim.2021.762997
Received: 23 August 2021; Accepted: 08 October 2021;
Published: 15 November 2021.
Edited by:
Bo Wu, Institute of Atmospheric Physics, Chinese Academy of Sciences (CAS), ChinaCopyright © 2021 Li, Yao, Wang, Yu, Che, Gong, Feng and Li. This is an open-access article distributed under the terms of the Creative Commons Attribution License (CC BY). The use, distribution or reproduction in other forums is permitted, provided the original author(s) and the copyright owner(s) are credited and that the original publication in this journal is cited, in accordance with accepted academic practice. No use, distribution or reproduction is permitted which does not comply with these terms.
*Correspondence: Zhiqiang Gong, gzq0929@126.com