
95% of researchers rate our articles as excellent or good
Learn more about the work of our research integrity team to safeguard the quality of each article we publish.
Find out more
ORIGINAL RESEARCH article
Front. Clim. , 13 June 2023
Sec. Climate Services
Volume 5 - 2023 | https://doi.org/10.3389/fclim.2023.1107804
 Muthusamy Murugan1*Anil Kuruvila2
 Aavudai Anandhi3A. Pooja2
 Kaliyaperumal Ashokkumar1*M. K. Dhanya1A. Subbiah4M. Alagupalamuthirsolai5N. Sritharan6
The rainfall pattern seen in the Indian Cardamom Hills (ICH) has been extremely variable and complicated, with El Niño-Southern Oscillation (ENSO) playing a crucial role in shaping this pattern. In light of this, more investigation is required through improved statistical analysis. During the study period, there was greater variability in rainfall and the frequency of rainy days. About 2,730 mm of rainfall was reported in 2018, while the lowest amount (1168.3 mm) was registered for 2016. The largest decrease in decadal rainfall (>65 mm) was given by the decade 1960–1969, followed by 1980–1989 (>40 mm) and 2010–2019 (>10 mm). In the last 60 years of study, there has been a reduction of rainy days by 5 days in the last decade (2000–2009), but in the following decade (2010–2019), it registered an increasing trend, which is only slightly <2 days. The highest increase in decadal rainy days was observed for the 1970–1979 period. The smallest decadal increase was reported for the last decade (2010–2019). Total sunshine hours were the highest (1527.47) for the lowest rainfall year of 2016, while the lowest value (1,279) was recorded for the highest rainfall year (2021). The rainfall characteristics of ICH are highly influenced by the global ENSO phenomenon, both positively and negatively, depending on the global El Nino and La Nina conditions. Correspondingly, below and above-average rainfall was recorded consecutively for 1963–1973, 2003–2016, and 1970–2002. Higher bright forenoon sun hours occurred only during SWM months, which also reported maximum disease intensity on cardamom. The year 2016 was regarded as a poorly distributed year, with the lowest rainfall and the highest bright afternoon sun hours during the winter and summer months (January-May). Over the last three decades, the production and productivity of cardamom have shown a steady increase along with the ongoing local climatic change. Many of our statistical tests resulted in important information in support of temporal climatic change and variability. Maintaining shade levels is essential to address the adverse effects of increasing surface air temperature coupled with the downward trend of the number of rainy days and elevated soil temperature levels.
Tropical rainforest precipitation in the Indian Western Ghats' seems more variable than its other counterparts in Central and South America (Malhi and Wright, 2004). Variability and changes in precipitation patterns within the Indian Cardamom Hills (ICH) are even more significant depending on the monsoon types and its side effects (wind or Lee side) (Murugan et al., 2012a, 2022), along with altitude levels. The altitude of the ICH plays a primary role by providing clement weather and climate, particularly to high-value spices and plantation crops such as small cardamom, pepper, clove, nutmeg, tea, coffee, and cocoa. Cardamom is a typical rainforest floor species (like cocoa that loves the rainforest climate), used to enjoy only the forest-induced microclimatic environments, including diffused sunlight under the high upland rainforest. Like cardamom, other micro-fauna that forage specifically on cardamom plants (the floor species) also enjoyed the forest microclimate until the regular shade regulation was adopted and widespread now. Across all crop farming systems in the world, degradation of agro-ecosystems has been happening at a greater pace which affects the productivity (Praveen et al., 2022). Other major crops in the ICH, like coffee, pepper, and clove, are more closely related to fog or mist forests; therefore, they are called fog or mist forest crops. The yield of crops in the ICH, especially cardamom, is profoundly influenced by precipitation characteristics like distribution and amounts during a season (Murugan et al., 2000, 2012a, 2017). Globally, the asymmetric change in the climate parameters affects key agroecosystems including rice production systems (Murugan et al., 2012a; Baig et al., 2022; Islam et al., 2022). The perennial cardamom agro-forestry system in the world has been experiencing tremendous forest degradation causing cardamom productivity to swift downward (Reyes et al., 2009; Murugan et al., 2012b). The ICH enjoys copious rainfall during the Indian summer monsoon, followed by the winter monsoon and summer rainfall. The westerly and easterly winds are responsible for the monsoon rain that brings life to more than 80% of the land area (Ghosh et al., 2009; Wu, 2017) in Asia and Oceania. The Indian monsoons contribute nearly 70–80% of the rainfall received by ICH, and the ENSO (El Niño-Southern Oscillation) influence them leading to insufficient rainfall for cardamom production and productivity. ENSO has three phases, El Nino, La Nino, and Neutral. Variations in rainfall amounts can occur on decadal, annual, and seasonal scales due to its coupled phenomenon, even in the rainy tropics. Therefore, understanding rainfall behavior or the influence of ENSO events is important and meaningful because cardamom is a tropical floor species. Reliable production and growth of cardamom are highly dependent on rainfall and its distribution in a season. Studies pertaining to ENSO years affecting cardamom production are scanty. Understanding the ENSO state about rainfall receipt in the ICH may be more useful for future water management strategies. The rain bringing the first monsoon wind originates from the west Pacific Ocean around April 14 every year, which lasts exactly 6 months. Long-term and decadal-scale changes in observed precipitation patterns and trends are critical for providing insights into current and future research and development, including investigating climate resilient and drought adaptive strategies. Cardamom being one of the high value spice crops yield loss due to the negative impact of climatic change has to be compensated either by subsidies to safeguard livelihoods of cardamom farmers as well as rainforest sustainability (Baig et al., 2023).
Statistical analysis of the long-term observed climate data can give factual information on past and current trends and rates of change in the climatic elements. Critical analysis of long-term observed precipitation data will also give us the existence of any cyclic precipitation patterns. Studies on short and medium scales are available for the ICH region (Murugan et al., 2008, 2012b). The amount of sunlight varies greatly even within a small area in a tropical mountain forest system compared with a plain area of the same latitude of solar radiation and heat distribution in tropical mountain forest systems also depends on the duration of bright sun hours received by that place (Okonkwo et al., 2014). Therefore, variability in the sun's hour duration can affect crop plants' growth, development, and yield in the tropical mountain forest system. But the availability of published information like rainfall characteristics on longer timescales for the ICH needs to be improved so that it needs in-depth analysis and study by statistical means. Cardamom being considered as a typical rainforest crop any change in the rainfall characteristic might affect the production and productivity of the cardamom.
The observed climate and crop yield data were obtained from the Cardamom Research Station (CRS), Kerala Agricultural University, Pampadumpara, from 1957 to 2021. Data from the 1960–2019 time periods were used for decadal analysis. The yield data for cardamom was obtained from the website of the Spices Board, Ministry of Commerce, Government of India. The data included annual precipitation, number of rainy days, as well as average relative humidity besides bright sun hours and soil temperatures at different depths (5, 10, and 15 cm) during the lowest and highest rainfall years reported during the study period. Soil temperature data were collected from soil thermometers placed at 5, 10, and 15 cm soil depths. Observations were made twice a day (7 am and 2 pm) and the averages were calculated for the respective years. The total annual rainfall was obtained by summing up the monthly rainfall in that year. Since 2000, the lowest and highest amount of annual was received, respectively, in the year 2016 and 2021. It is meaningful if two contrasting rainfall event years are compared for productivity response. Highest rainfall year (2021) reported a maximum productivity close to 660 kg/ha which is clearly much higher than the productivity (close to 530 kg/ha) recorded for 2016. The registered value apparently explains the influence of rainfall on the yield of cardamom.
Inter Quartile Range (IQR), standard deviation (SD), variance, standard error, and sleekness were computed for annual climate data to describe it appropriately. Box plots have been structured and used to visually detail the variations and temporal changes in the variables. Statistics like temporal trends were evaluated at a decadal scale using the Mann-Kendall method. Significance trends were identified at a decadal scale by the two-tailed Z test. The temporal trends of decadal scales were obtained using the non-parametric Mann-Kendall method. Sen's non-parametric estimator was adopted to quantify the slope of the trends. The test significance was evaluated using a two-tailed Z-test, and the statistical significance was indicated as a p-value of <0.05.
Mann-Kendall's non-parametric tests were performed to find temporal trends because meteorological time series data are non-normally distributed and censored (Sheng et al., 2002). These tests can consistently indicate monotonic linear and non-linear trends with outliers (Helsel and Hirsch, 1992). The slope of the trends was identified and calculated by Sen's non-parametric estimator of slope (Theil, 1950; Sen, 1968). This method quantified the slope of each trend that was identified by Sen's slope method as a median of all pairwise slopes. A two-tailed Z- test was used to test the significance level ranging from 1 to 10.
Furthermore, to reduce the noise inherent in the climate data, the LOESS (Locally weighted scatter plot smooth) procedure was used, which allowed qualitative visual examinations of temporal changes in the data (Cleveland and Devlin, 1988). Statistical significance was indicated by a p-value of <0.05 using the two-tailed Z test. The trend was identified by p-value < 0.05 (at a 5% significance level). The test statistic z was used to determine whether the following monotonic trend was upward or downward. The strength and direction of Tau values identified the correlation between the variables.
Box and whisker plots were prepared to indicate the data's degree of dispersion and skewness and identify outliers. Whisker's plot is a convenient way of graphically depicting groups of numerical data through their five number summaries, which are the smallest observations, lower quartile (Q1, 5%), median (Q2), upper quartile (Q3, 95%), and the largest observations. The span of the box represents the interquartile range of the observed climate variable. The whiskers extend from the box to 5 and 95% quantiles on the lower and upper sides of the box correspondingly. The box's width indicates the inter-quartile range (IQR), which measures the variability and is about three. The outliers in the box plot represent extreme values and conditions, which are points lying above Q3 + 1.5 IQR and below Q1−1.5 IQR. It could be observed that the box plot was even with no outliers. The presence of outliers on the right side of the whisker can identify the extreme rainfall conditions for the study area. The capsule set percentage was worked out for all 12 months from a fixed plant sample. The data and results were interpreted accordingly for each parameter, and statistics was worked out by R statistical program for interpretations of the parameters.
The 65 years of observed annual precipitation data showed a declining trend, but it was insignificant. The number of rainy days yearly did not increase much, although positive (Figure 1). The percentage variation in rainfall and rainy days over the study period is minimal, indicating the rainforest rainfall characteristics are less variable. More significant variability in rainfall and rainy days occurred during the study period (1957–2021). The highest rainfall (2,730 mm) was reported in 2018, while the lowest amount (1168.3 mm) was registered in 2016. The total number of rainy days was highest (184 days) in 1984, but the lowest frequency (91 days) was recorded in 2012, and these respective years received a total rainfall of 2499.2 mm and 1248.2 mm. The average number of rainy days for the study period was 136, while its mean annual rainfall was 1860.8 mm. A declining trend was observed for annual rainfall from 1957 to 2021. The annual rainfall distribution from 1957 to 2021 was slightly positively skewed, with an average amount of 1860.8 mm.
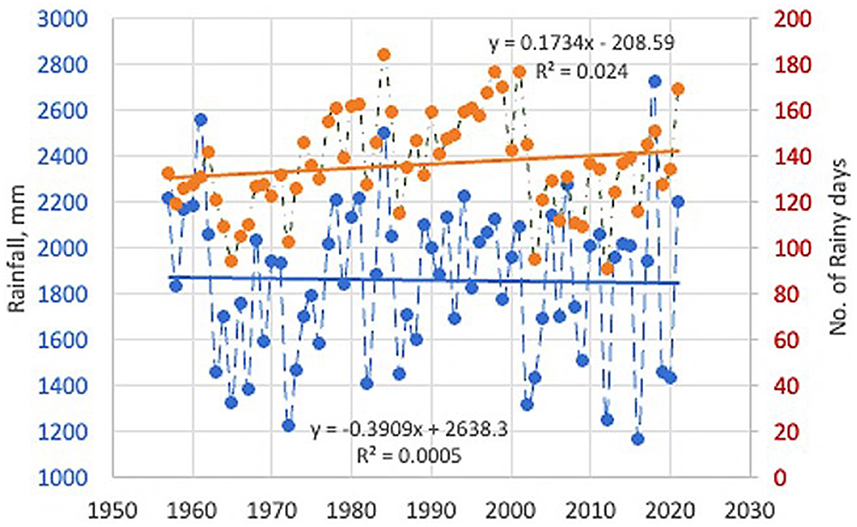
Figure 1. Regression and scattered plot of rainfall and rainy days for the study period 1956–2021.
All the ENSO phases affected ICH's rainfall characteristics all through January-December. Of the 66 observed years, 45 years were influenced by ENSO conditions (Figure 2). There have been more El Nino years reported (23 years) than La Nina years (22 years) and neutral years (21). ENSO's weak phase dominated El Nino (9 years) and La Nina (10 years). The number of years under strong ENSO conditions was more for La Nina (7 years) than for the El Nino phase (5 years). From 1963 to 1973 and 2003–2016, consecutive below-average rainy days were recorded for more than 10 years, and from 1963 to 1976 below-average rainfall was recorded for more than 10 years. In between, above-average rainfall was received continuously over 10 years (1970–2002). Hence, a trend of seesawing has been noticed both in the case of rainfall and rainy days. The El Nino and La Nino phases resulted in lower rainfall amounts than the long-term average of the study period. Only 5 years have registered above-average rainfall during ENSO years. One of the El Nino weak phase years (2018) recorded the highest rainfall amount (2,730 mm), in contrast to 2016, reported as a La Nina weak phase year that received the lowest rainfall amount (1168.3 mm). Both increasing and decreasing trends were observed for all ENSO phases. A 47.5% increase in rainfall was noticed for the weak phase compared to the moderate phase, which could boost only 29% of rainfall. In the case of rainfall, the highest percentage reduction was noticed for the strong phase (34%), followed by very strong (24%) and moderate (22%) phases (Table 1). The weak phase contributed to a reduction of 14%.
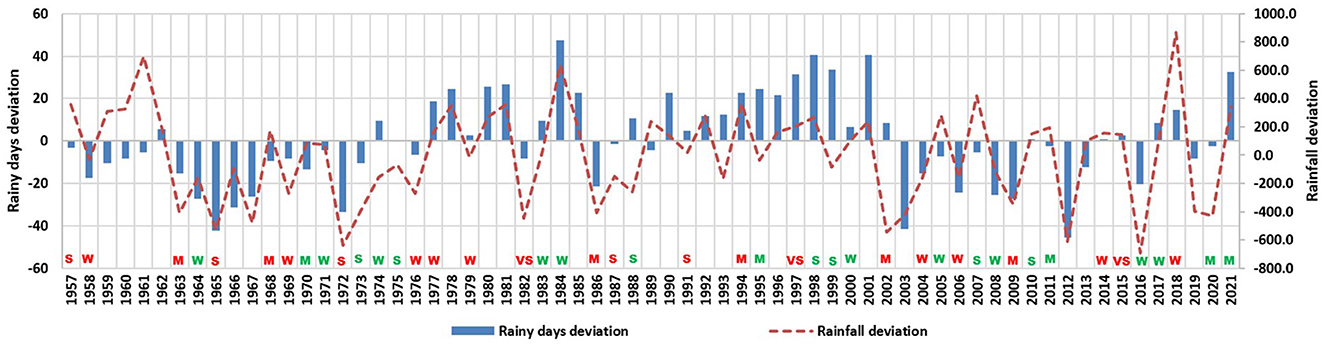
Figure 2. Observed rainfall anomaly during 1957–2021 for Indian cardamom hills. Letters in red denote El Nino years and green denote La Nino years. VS, very strong; S, strong; M, medium; W, weak.
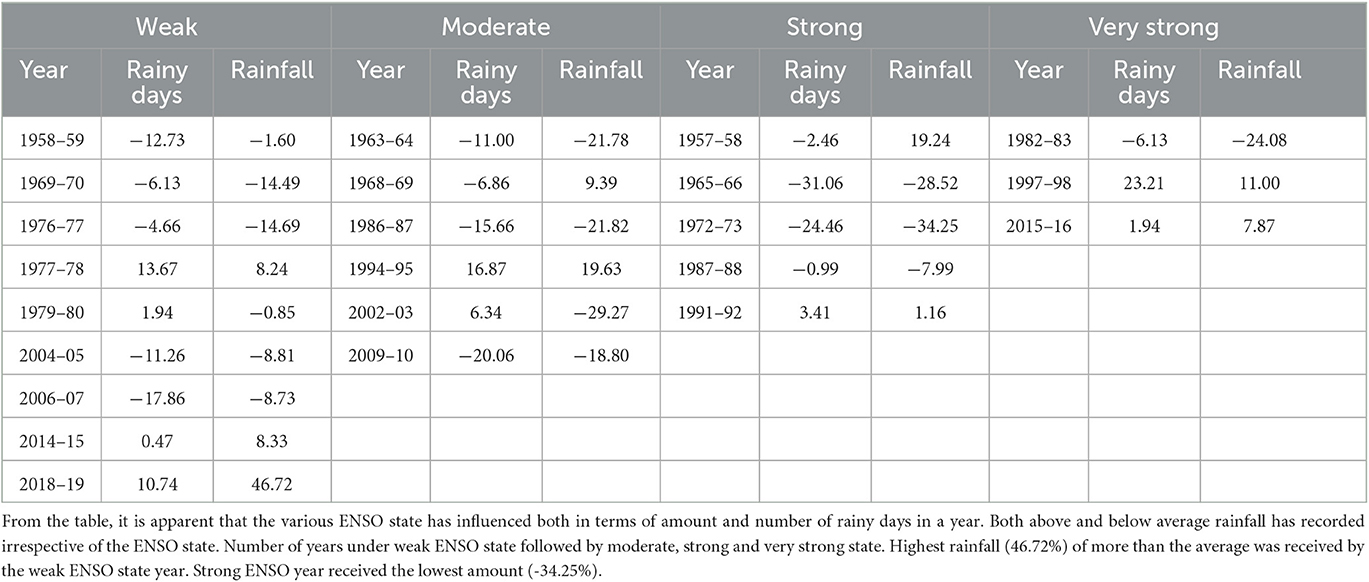
Table 1. Percentage deviation of rainfall characters from long term average due to the influence of ENSO condition.
Regarding rainy days, the strong phase brought out a maximum of 24% reduction, closely followed by the moderate phase (20%). The rainfall characteristics of ICH are highly influenced or affected by the global ENSO phenomenon, both positively and negatively, depending on the state and intensity of the global El Nino and La Nina conditions. During the study period, the ENSO neutral phase year (2016) enjoyed the lowest number of rainy days (91) as well as lower rainfall (1248.2 mm). On the contrary, the La Nina weak phase year (1984) experienced the maximum number of rainy days (184) along with a higher amount of rainfall (2,500 mm). Earlier studies have shown a different result for contrasting mountain environments (Murugan et al., 2008).
Across the decades from 1960–69 to 2010–19, there has been a variation in the decadal scale rainfall. The lowest decadal variation was obtained for 1990–1999, followed by 2000–09. The maximum disparity was recorded in the decades 2010–2019, 1960–1969, and 1980–1989. During 2010–19, an extreme variability occurred during which 2012 reported the lowest (91) number of rainy days. The highest and lowest extremities were seen during the last decade (2010–2019). Increasing trends for decadal average rainfall were observed for the first three decades (1960–1989). Decadal levels were also shown to have increased for three decades from 1970–1999. The decadal minimum was diminishing while an increasing trend was noticed for the decadal rainfall maximum during 1990–2019. The decadal rainfall variability was highest for the last decade (2010–2019) during the period with the second highest average rainfall decrease in decadal rainfall (>65 mm) given by the decade 1960–1969, followed by 1980–1989 (>40 mm) and 2010–2019 (>10 mm). Decadal average rainfall showed an uptrend for three decades (1970–1979, 2000–2009, and 1990–1999). A non-significant decreasing trend (p < 0.05) in rainfall was observed for the study period (Table 2). Of the six decades studied, three decades (1970–1979, 1990–1999, and 2000–2009) were given positive values, and the rest (1960–1969, 1980–1989, and 2010–2019) were shown negative values (Table 3). Although the trend was positive, it was insignificant in all three decades. Decadal rainfall appeared maximum for the 1990's, followed by the 1980's, and the second decade of this century (2010–2019). The first (1960–1969) and penultimate decade (2000–2009) under study have registered more years with <100 rainy days. For thirty years (1980–2009), the distribution of rainy days was positively skewed. Over the decades from 1960–1969 to 2010–2019, there was an increase in the average rainfall till 1990–1999. After that, it decreased and then increased drastically in the last decade of 2010–2019. The lowest average decadal rainfall was during 2000–09. Men-Kendall and Sen's slope statistics indicated a clear alternating trend of decreased and increased rainy day frequency (Table 4). Interestingly, the rate of the declining trend increased as the decade passed, whereas the opposite happened in the case of the increasing trend, meaning that the increase in frequency decreased as the decade passed. The Z and tau values were negative and positive for the respective decades (Table 4). The highest increase in decadal rainy days was observed for the 1970–1979, and the slightest decadal increase was reported for the last decade (2010–2019).

Table 2. Sen's slope trend and Mann-Kendall statistics for rainfall and rainy days.
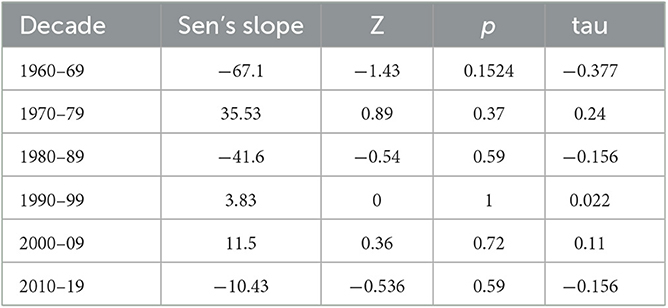
Table 3. Mann-Kendall trend values and Sen's slope estimates for decadal rainfall.

Table 4. Mann-Kendall trend values for decadal frequency of rainy days.
During the study period (1957–2021), the distribution of rainy days was nearly symmetrical. Considering the entire period, the average number of rainy days was 134. More significant variation in the number of rainy days' frequency occurred between years of the study period (Figure 1). The Box and Whisker plot showed that the frequency of rainy days was positively skewed. An increasing trend in the frequency of rainy days was observed from 1957 to 2021. Positive values were obtained for both Sen's slope and Mann-Kendall statistics (Table 2).
Throughout the decades, there was an increase in the average number of rainy days till 1990–1999, then decreased. The lowest average decadal rainy-day frequency was recorded during 2000-2009. From 2010 to 2019, the lowest number of rainy days occurred in 2012 (91 days). A significant increasing trend (p < 0.05) in the frequency of rainy days was observed during 1970–1979 and 1990–1999. The number of rainy days was higher in the 1990s, followed by the 1980s and the second decade of this century (2010–2019). The first (1960–1969) and the penultimate decade (2000–2009) of the study period have registered more years with <100 rainy days. For thirty years (1980–2009), the distribution of rainy days was positively skewed. Over the decades from 1960–1969 to 2010–2019, there was an increase in the average rainfall till 1990–1999. After that, it decreased and then increased drastically in the next decade, 2010–2019. The lowest average decadal rainfall was measured during 2000–2009. Men-Kendall and Sen's slope statistics indicated a precise alternating pattern of decreasing and increasing rainy days' frequency (Table 4). The Z and tau values were both negative and positive for the respective decades (Table 4). The highest increase in decadal rainy days was observed for the 1970–1979 period, and the least decadal increase was reported for the last decade (2010–2019). The number of rainy days was related to both productivity and the frequency of cardamom harvesting.
Total sunshine hours were the highest (1527.47 h) for the lowest rainfall year of 2016, and the lowest value (1,279 h) was recorded for one of the high rainfall years (2021). Similarly, 2016 had more sunshine hours in the morning (709.4 h) and afternoon (818 h) than 2021, which had 661.5 and 617.5 h, respectively. The monthly bright sun hours varied from 106.5 to 127.2 h. However, the maximum sunshine hours were reported during the lowest rainfall year (2016), and the lowest was recorded during the rainiest year (2021). Respectively, the years 2016 and 2021 were the sunniest and cloudiest under study. August was the cloudiest (13 h) month in the heaviest rainfall year (2021), while March (233 h) was the sunniest month in the poorest rainfall year (2016). The duration of sunshine hours varied considerably between the lowest (2016) and highest (2021) rainfall years. However, more variability in sunshine hours for the morning, as well as afternoon hours, was observed for the rainiest year (2021) than the lowest rainfall year (2016). The rainiest year's afternoon sunshine hours were skewed positively regardless of the time period (Figures 3A–C). Afternoon and total sunshine hours for the lowest rainfall year (2016) skewed negatively. Both minimum and maximum values for the year 2016 were higher than those of the rainiest year, 2021. The larger variation in bright sun hours between years with contrasting rainfall patterns has been attributed to more cloudiness during the rainiest year. The combined effect of the lowest sun hours (1,279 h) in 2021 and a 30% increase in annual rainfall (2,300 mm) spread over 180 rainy days resulted in a 40% increase in capsule yield across cardamom hills. Planters and farmers have never stopped cardamom harvesting, which went up to 8–9 rounds in 2021. This proved that cardamom is not a sun-loving crop. Higher cloudiness, cool and humid conditions prevailing in cardamom ecosystem led to increased pests and diseases on cardamom (Prashant et al., 2014). During 2021 summer rainfall, higher mean minimum temperatures, and higher relative humidity had significant positive effects on continuous flowering and yield; these favored planters to use of pesticides to avoid harvesting of poor-quality cardamom capsules (itched capsules by thrips). For instance, the number of pesticide rounds has gone up to 22, which includes eight rounds of fungicides in 2021. The duration of bright afternoon sunlight hours is greater for both the cloudiest and sunniest years. Climatically, the duration of noon and evening hours' sunshine can play a critical role in ecosystem biology. Figure 4 showed the level of shade removal under intensive cardamom farming in ICH. Intact forest trees help cardamom by regulating micro and macroclimate of the CHR system. The shade removal as reported here would have considerably altered both the micro and macroclimatic conditions of the plantations. Intensive shade removal along with altered weather conditions favored occurrence of insect pest and diseases at higher frequency levels which necessitate higher consumption of pesticides in the CHR farming system (Murugan et al., 2022).
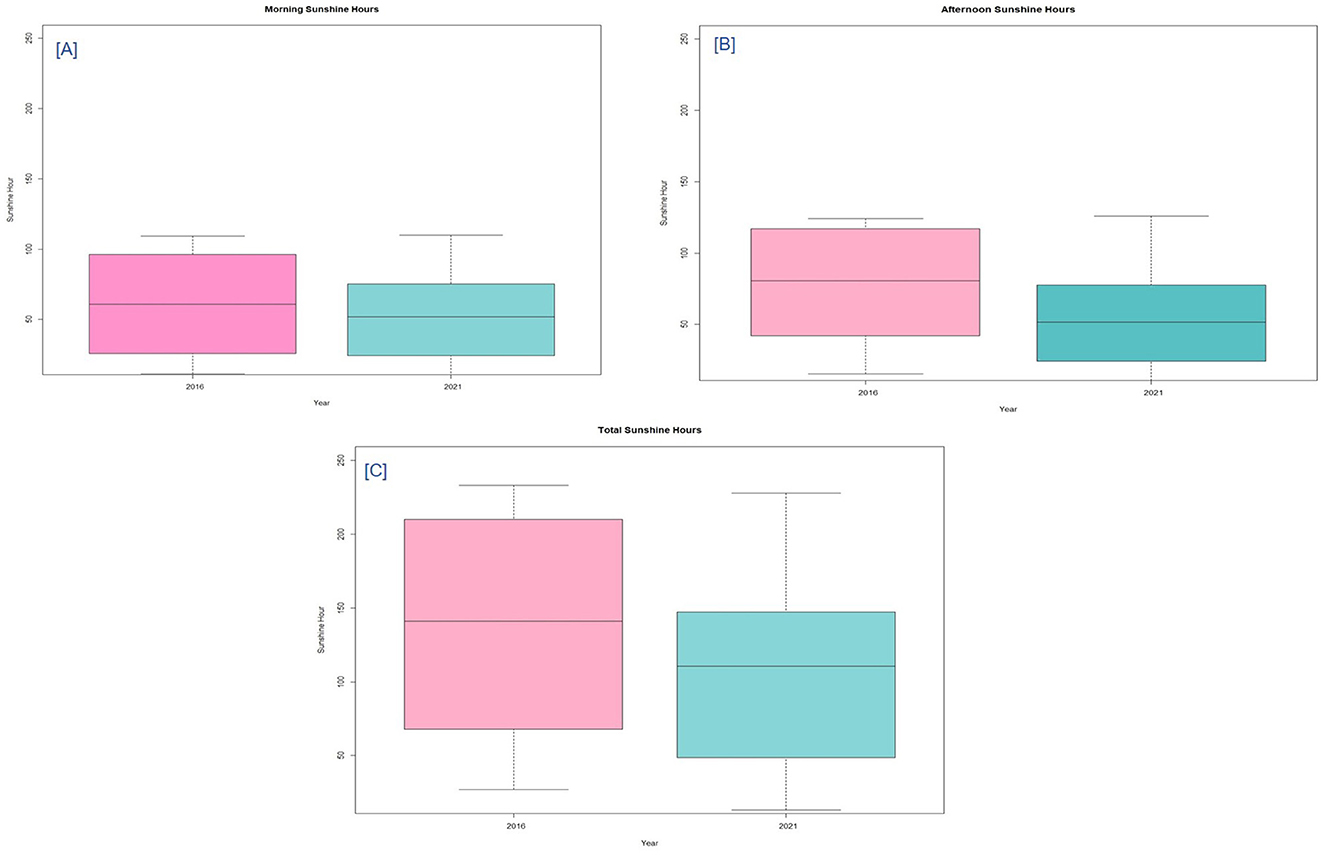
Figure 3. Box and Whisker plots of sun hours for the lowest (sunniest) and high rainfall (cloudiest) years (2016 and 2021). (A) Morning sunshine hours; (B) Afternoon sunshine hours; (C) Total morning and afternoon sunshine hours. The Box and whisker plots indicate change factors calculated for bright forenoon sunshine hours. These plots are interpreted as follows: middle line shows the median value; top and bottom of box show the upper and lower quartiles (i.e., 75th and 25th percentile values); and whiskers show the 95th and 5th percentiles.
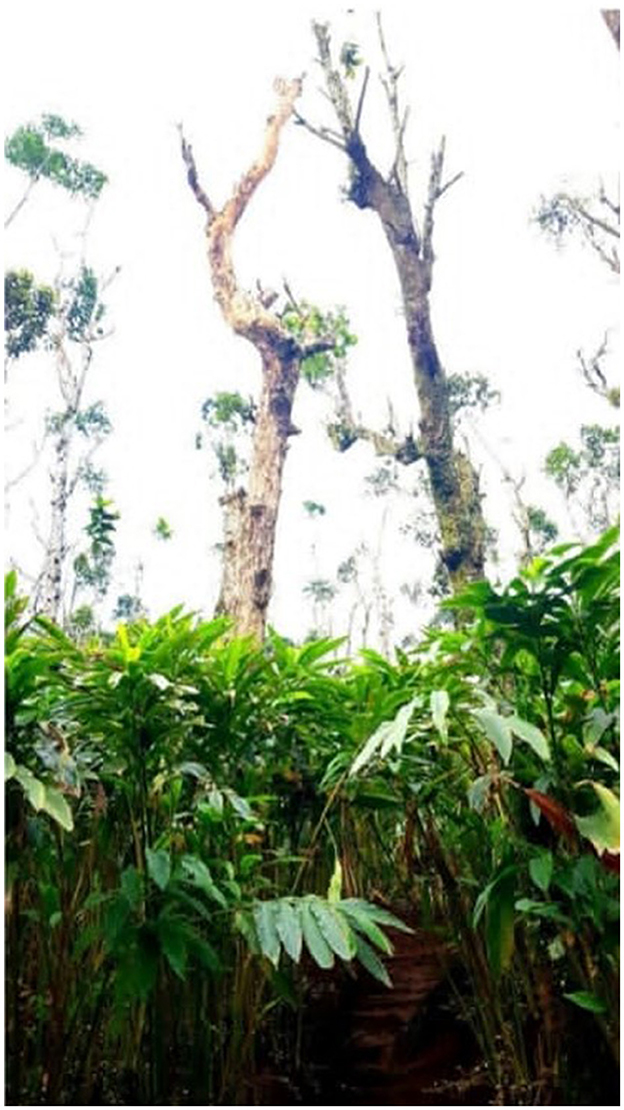
Figure 4. Level of shade maintained in cardamom plantations in the CHR.
During the entire study period, 2016 recorded the highest average sunshine hours compared with 2021. Maximum monthly sunshine hour values during Southwest monsoon (SWM: June to September) and Northeast monsoon (NEM: October to December) were reported in 2021 (Figure 5A). On a sub-seasonal scale, the data revealed a dramatic variation in the duration of forenoon sunshine hours. Longer duration and greater variations have occurred regardless of the year for the winter (January to February) and summer months (March to May) and the monsoon months (SWM and NEM). In the SWM period, the bright sun hours of 2021 exceeded the cloudiest year's (2016) values.
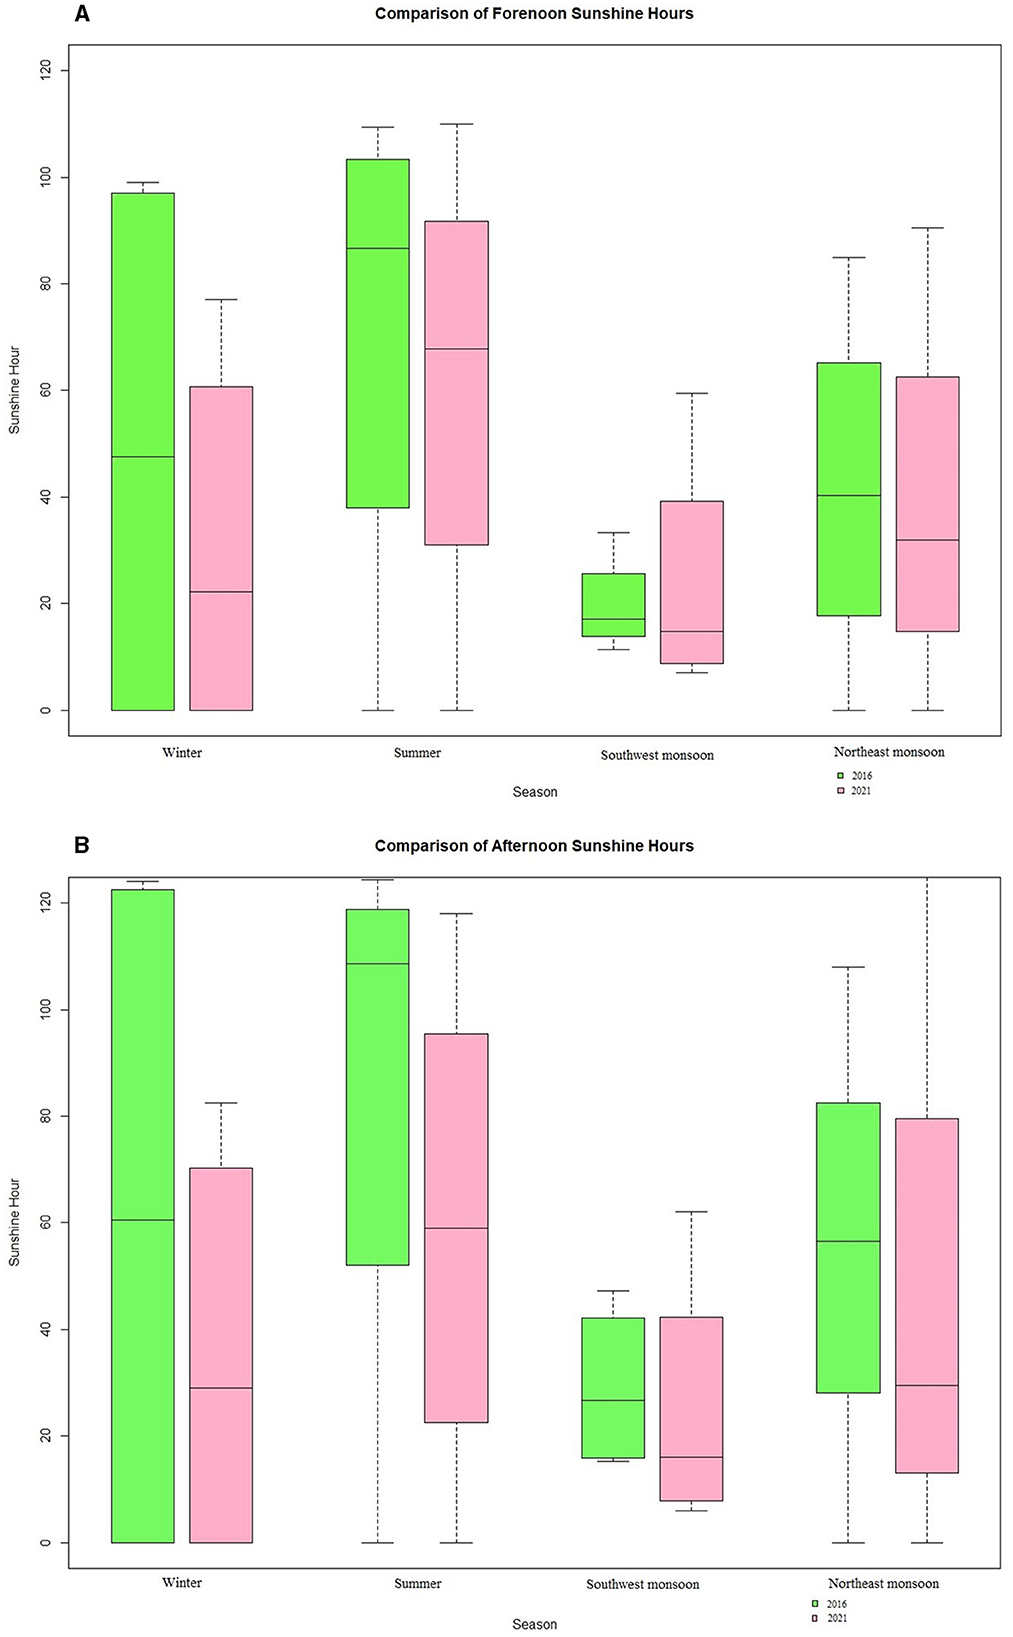
Figure 5. Box and Whisker plots showing duration of forenoon (A) and afternoon (B) bright sun hours for the sunniest (2016) and cloudiest year (2021). The Box and whisker plots indicate change factors calculated for seasonal scale. These plots are interpreted as follows: middle line shows the median value; top and bottom of box show the upper and lower quartiles (i.e., 75thand 25thpercentile values); and whiskers show the 95thand 5thpercentiles.
Interestingly, more bright sun hours were received during SWM months in 2021 than the 2016. Hence, positively skewed and more variable bright sun hours plus higher rainfall enjoyed during 2021 could be the reason for the proliferation and multiplication of pests and diseases in cardamom. In all other months of 2016, the duration of bright sun hours was high compared to 2021. Positively skewed values were registered for most of the months in 2021, except for March-May. The values were negatively skewed for the summer months of 2016. The year 2021 was considered a well-distributed rainfall with higher bright forenoon sun hours that occurred only during SWM months. It was reported to have the highest disease intensity on cardamom. This year, farmers across the cardamom growing areas have taken up as many as eight rounds of fungicidal sprays during the SWM and NEM months (Murugan et al., 2022). High rainfall with more forenoon bright sun hours is the main reason for the proliferation of rot diseases in cardamom.
A record-high average bright afternoon sunshine hour was recorded for 2016 compared to 2021. Maximum monthly sunshine hour values during SWM and NEM were reported in 2021 (Figure 5B). The data indicated a striking difference in the duration of bright afternoon sunshine hours on a sub-seasonal scale. Longer duration and larger variations have occurred irrespective of the years compared to winter and summer months (Jan–May) and monsoon months (SWM and NEM). Except for SWM, the bright afternoon sun hours of 2016 they have exceeded the cloudiest year's (2021) median values. The data for bright afternoon sun hours in 2021 were positively skewed across all seasons (winter, summer, SWM, and NEM). Values of bright afternoon sun hours for 2016 skewed negatively.
Interestingly, the bright afternoon sun hours were lower for the summer months of 2016 than the 2021. Winter months also registered very high bright afternoon sun hours during the lowest rainfall year (2016) (Figure 5B). Thus, negatively skewed and more variable bright afternoon sun hours plus the higher duration of winter months' sun hours experienced during 2016 might be the reason for the increase and fast development of insects in cardamom and black pepper. In the first 5 months (Jan–May) of 2016, the duration of bright sun hours was high compared to 2021. The year 2016 was considered a poorly distributed and the lowest rainfall year, with higher bright afternoon sun hours during the winter and summer months (Jan–May) and maximum insect pest intensity on crops such as cardamom and black pepper (Murugan et al., 2017). In 2016, the higher atmospheric air temperature, and elevated surface soil temperature also led to increase the population of root-feeding soil insect pests such as root grubs, nematodes, etc.; this led planters to go for 12–14 rounds of insecticidal sprays to avoid crop loss. Poor rainfall distribution coupled with more afternoon bright sun hours is the main reason for pest multiplication in cardamom and black pepper. The average sunshine was also higher in 2016, irrespective of the season. Especially in the summer, it was significantly higher in 2016. But in 2021, the SWM and NEM seasons hit their maximum values on monthly scales.
Average temperature at 5 cm and 10 cm soil depths during the morning hours was higher for 2021 than for 2016. Soil temperature at 15 cm remains same between the years 2016 and 2021 (Figure 6A). Considerable variations and higher average temperatures were reported through the afternoon hours for the year 2016 than 2021 for 5 and 10 cm soil depths (Figure 6B). Data for both years were highly positively skewed throughout the afternoon hours, indicating that the soil temperature at the uppermost layers is rising. The maximum annual average temperature of 25.8 degrees Celsius was recorded in April 2016. The extreme conditions of 2021 were in January and April (Figure 6B).
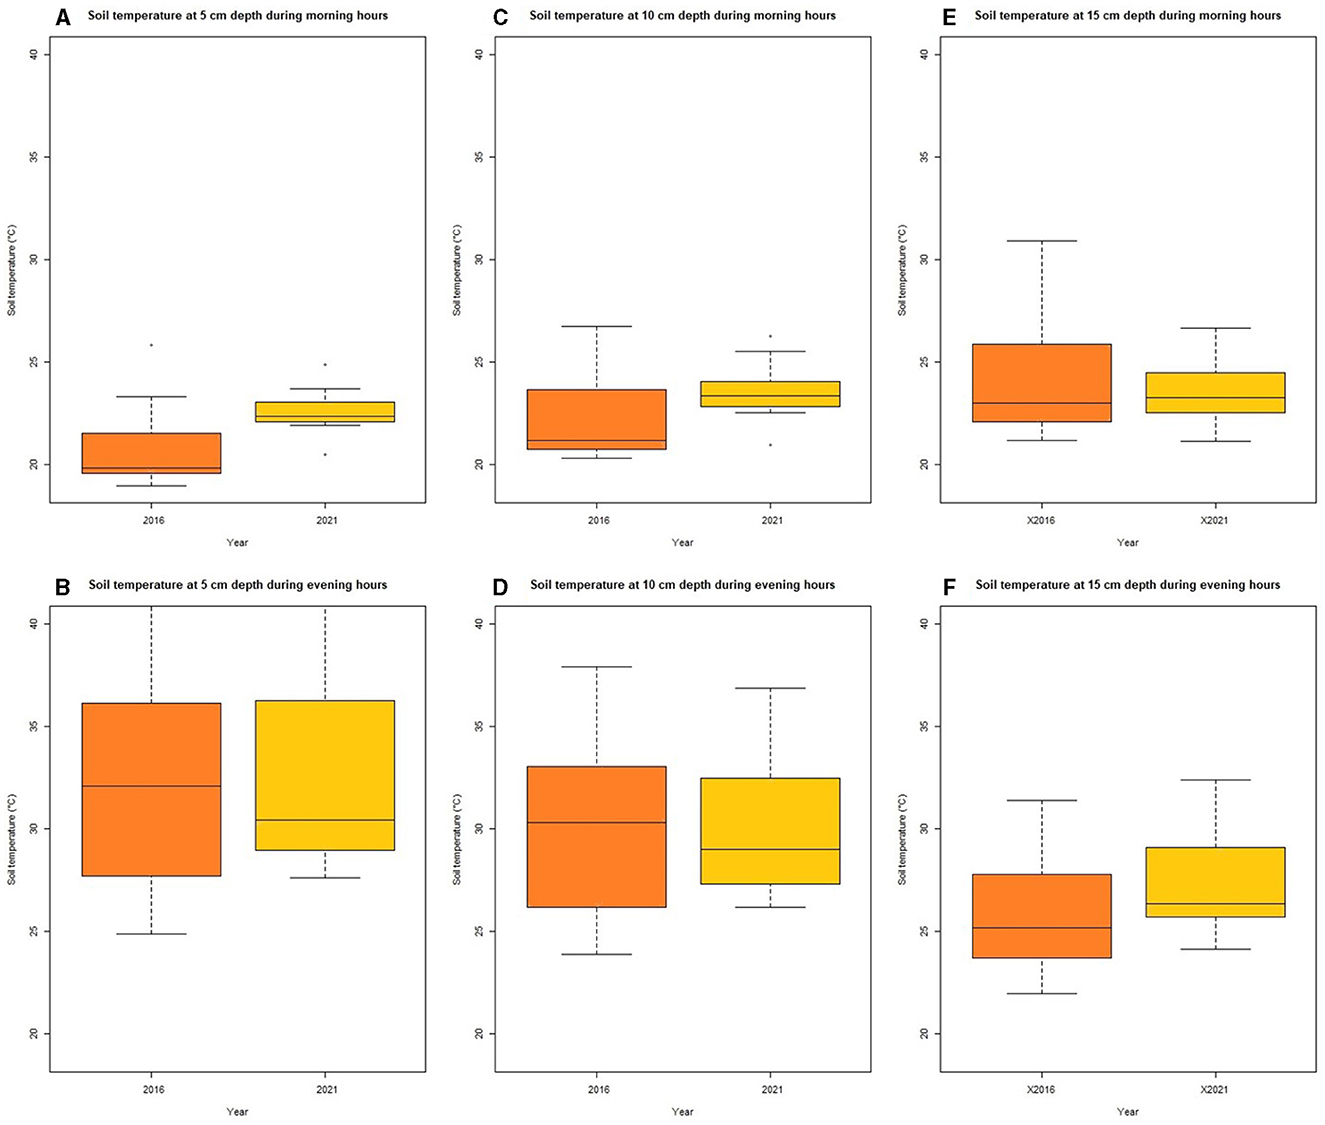
Figure 6. Box and Whisker plots for the lowest (sunniest) and high rainfall (cloudiest) years (2016 and 2021). (A) Soil temperature (FN) at 5 cm depth; (B) Soil temperature (AN) at 5 cm depth; (C) Soil temperature (FN) at 10 cm depth; (D) Soil temperature (AN) at 10 cm depth; (E) Soil temperature (FN) at 15 cm depth, (F) Soil temperature (FN) at 15 cm depth.
Even for the high rainfall cloudiest year 2021, the afternoon temperature was higher than that of the lowest rainfall year, 2016. Outliers of 2021 were observed during January and April. A higher extreme temperature was registered for 2016 in the afternoon period.
The average soil temperature at 10 cm depth during the morning hours was higher for 2021 (the high rainfall year) than for 2016 (the lowest rainfall year) (Figure 6C). Higher extreme values (outliers) were also observed for the year 2021. The average soil temperature in the morning was much lower in 2016, but the temperature range was bigger. The data was positively skewed for the lowest rainfall year of 2016. The soil temperature at this depth, even during the morning time, remains high for the rainiest year of 2021. The variations in soil temperature during the afternoon hours were much greater in 2016 than in 2021. Furthermore, the average temperature for 2016 was higher than in 2021 (Figure 6D). No outliers were found for both years, but the data were positively skewed, which means the subsoil layer is also experiencing soil warming.
The temperature of the soil at 15 cm depth in the morning hours varied greatly between 2016 and 2021. The average temperature at this depth remained more or less the same for both 2016 and 2021 (Figure 6E). Even with the high rainfall, the cloudiest year of 2021, and the lowest rainfall year of 2016, the rate of change in the temperature levels was reduced. Therefore, no outliers or extreme values were observed for 2016 and 2021. The average soil temperature during the afternoon period was higher in 2021 than in 2016 (Figure 6F). A minimum lower soil temperature was registered for 2016 than for 2021.
Nevertheless, the highest temperature level was given by 2021 compared with 2016, both years recorded positively skewed values. Changes in surface soil temperature dynamics have many implications for cardamom pest and disease management. Soil temperature variation for the lowest and higher rainfall years can favor the development of soil insect pests and disease-causing pathogens because of the conducive soil environment driven by clement soil hydrothermal regimes. Similar results were reported by Murugan et al. (2017, 2022).
Tropical high uplands in the ICH experience strong relative humidity change across seasons. A strong coupling between air temperature and relative humidity plays an essential role on crop phenology and pathogenic infection on crops. Relative humidity levels at cardamom research station, Pampadumpara remains high for morning hours than afternoon irrespective of seasons (Figures 7A, B). Relative humidity during southwest monsoon season changed only a little, whereas, considerable variations were noticed for other seasons. Winter and summer months relative humidity varied greatly. Higher relative humidity coupled with enhanced soil temperatures and surface air temperature can have profound influence on growth and capsule settings of cardamom besides proliferation of insect pests and pathogenic diseases.
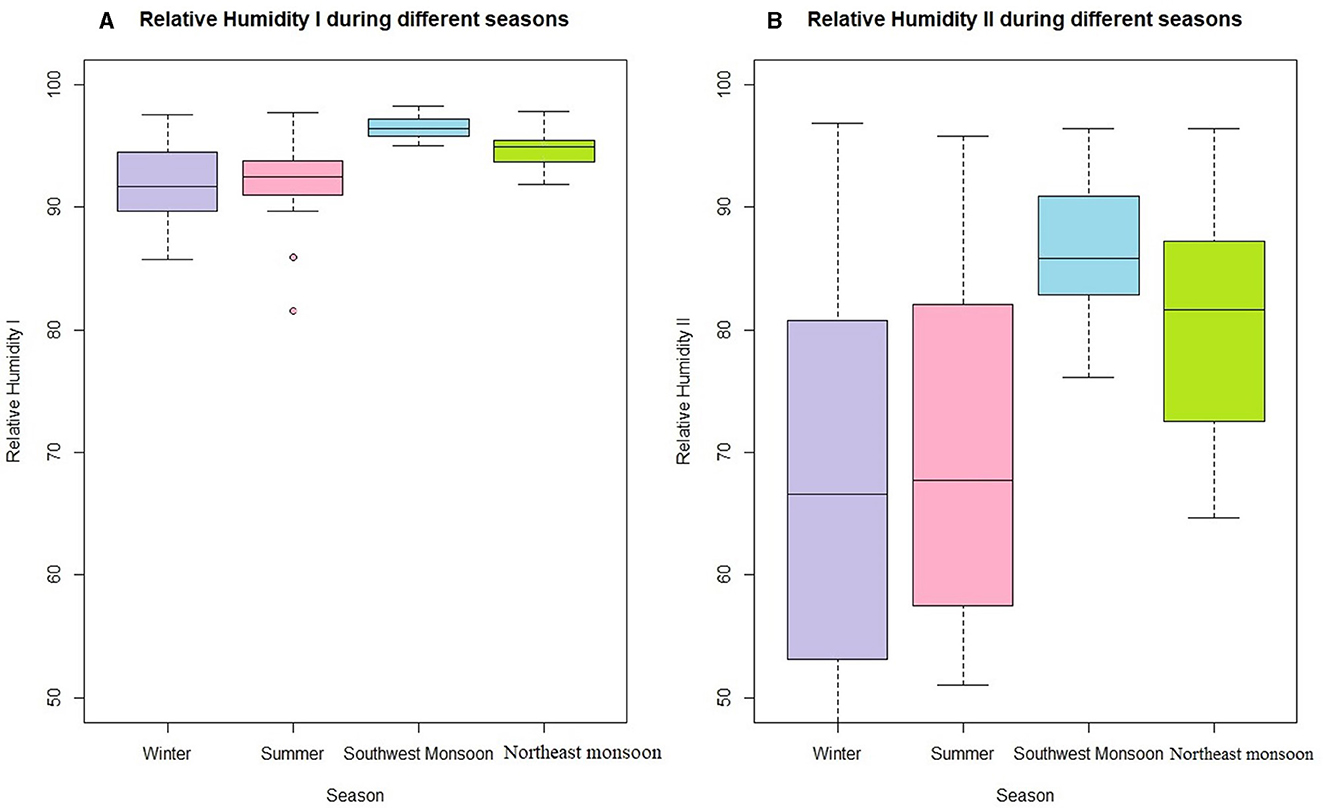
Figure 7. Box and Whisker plots for the seasonal relative humidity. (A) Morning hours relative humidity-I. (B) Afternoon hours relative humidity-II.
Cardamom is highly sensitive to soil moisture and sunshine hours or cloudiness. The observed climate and yield records data indicate that some relationships exist. For instance, the highest sunshine year (2016), we registered the lowest number of rainy days (116), which is also noted as the lowest rainfall year (1,167 mm) since record-keeping began. While the highest rainfall year (2018) recorded 2,730 mm spread across 151 days, reporting at least a 25% yield reduction from the decadal average, the highest rainy days (170) observed during 2021 envisaged 40% more yield across Cardamom hills. The reason for the yield reduction could be due to the below average rainfall with erratic distribution during previous years. Cardamom being perennial crop requires at least two seasons for stabilizing the yield. Climatic conditions of the previous year also influence the yield during subsequent year. During this year, the bright sun hours were the lowest. Therefore, it is evident that rainy days positively influence cardamom production, productivity, and harvest frequency. The quantum of rainfall has no direct link with production and harvest frequency because even one of the lowest rainfall years (1433.5 mm) (2020) had reported above-average productivity, and the increase was considerable. Therefore, sunshine hours and cloudiness can be important climatic elements in cardamom production. Relative humidity has been considered the most important climatic element for the cardamom capsule set. In another study conducted (2016–2019) in Kodagu district, Karnataka, when the atmospheric air relative humidity (microclimate near the panicle) prevails at 78–95%, it favors maximum capsule setting (>50%) (Alagupalamuthirsolai et al., 2019) in variety Appangala-1. At the same time, in ICH of Kerala, when the average leaf relative humidity was between 55 and 60% from June to August month (1999–2008) its highly positively correlated with the net photosynthetic rate (R = 0.83, P = 0.05) (Murugan et al., 2012b) and showed strong positive trend for capsule set in high yielding variety Green Gold. However, in a mountain ecosystem, the surrounding atmospheric air temperature and air movement might be deciding the leaf relative humidity and leaf temperature. In the present study, except for December the capsule set was higher for the monsoon months (southwest and northeast monsoon). The average capsule set percentage in high-yielding variety Green Gold was almost above 80% for all the months of the monsoons. The lowest values of capsule set percentage were registered for the summer months (January, February, and March). Intensive irrigation can modify the humidity levels inside the cardamom canopy (in summer months) and increase capsule set. Over the last three decades, cardamom production has shown a steady upward tendency, which could be ascribed to the intensification of productivity. Despite the climate vagaries and stagnation of the area under cultivation, the productivity of cardamom has also been increasing significantly. Although global ENSO phenomena affect crop yields across the world, the influence of ENSO phase on the production and productivity of cardamom has not given any clear trend (Figures 8, 9). Interestingly, the recent decades have experienced many fold increase in the production and productivity of cardamom. There has been no significant change observed between ENSO affected year and neutral years.
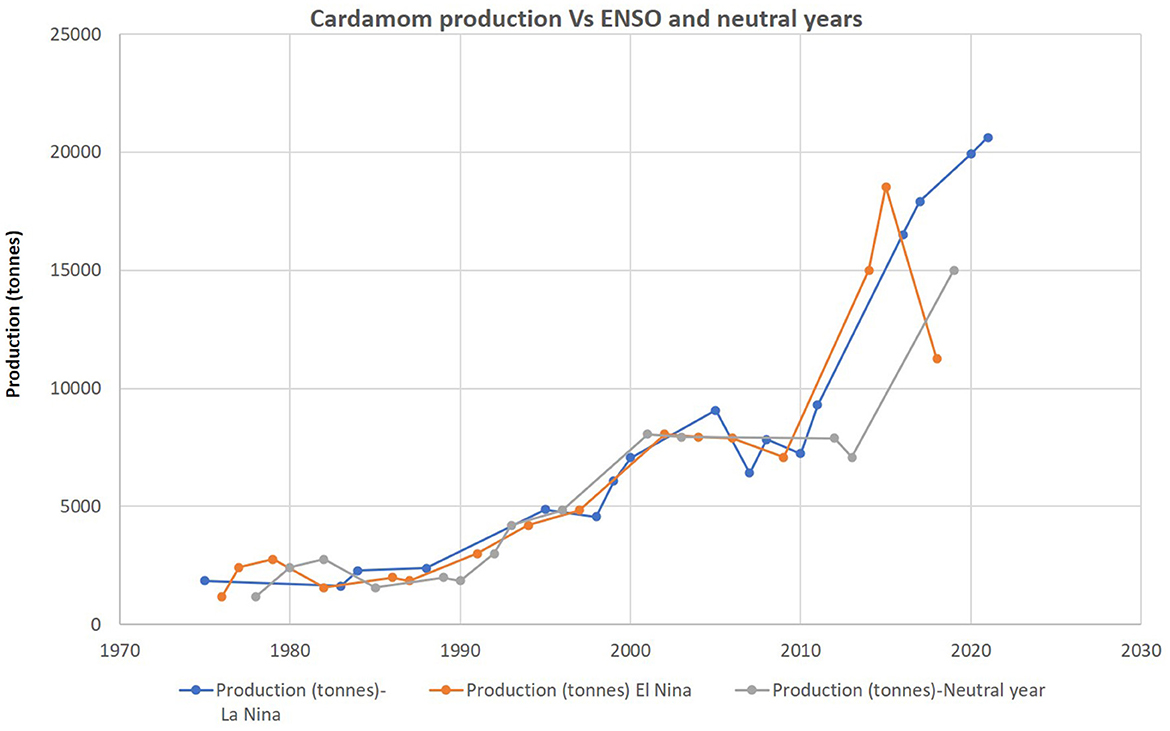
Figure 8. Production of cardamom during ENSO and neutral years since 1975.
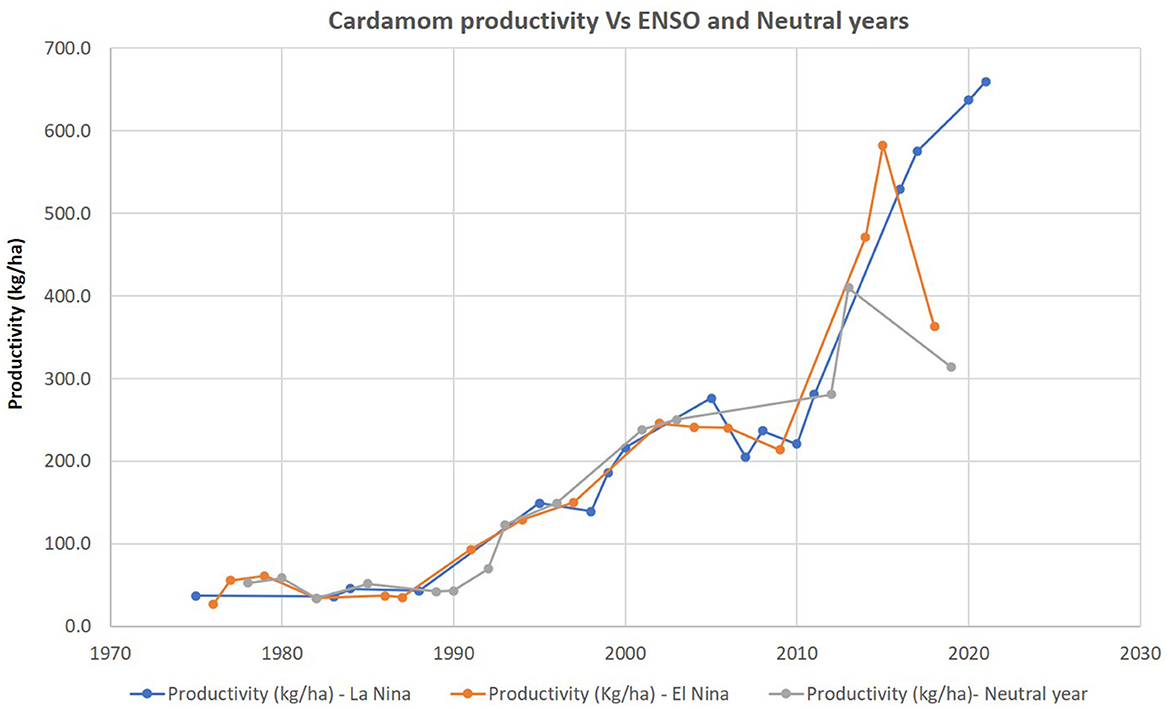
Figure 9. Productivity of cardamom during ENSO and neutral years since 1975.
The behavior of rainfall in the ICH has been highly variable and complex, in which the influence of ENSO has been tremendous and warrants detailed investigation by improved statistical analysis. The frequency of rainy days on an annual scale did not increase much, although it was positive. Also, the percentage variability of annual rainfall and rainy days over the study period was very low, indicating that the rainforest rainfall characteristics are less variable. Annual total rainfall has no direct link with production and harvest frequency because even one of the lowest rainfall years, 2016 (1433.5 mm), had reported above-average productivity, and the increase was substantial. However, it is evident from our data analysis that rainy days positively influence cardamom production, productivity, and harvest frequency. Poor rainfall distribution and more afternoon bright sun hours are the main reasons for fast pest development and multiplication in cardamom and black pepper gardens. Prominently, bright sunshine hours and cloudiness can be considered critical climatic elements for increased cardamom production and biotic stresses. The highest insect pest intensity on cardamom and black pepper was reported across the cardamom growing area, owing to erratic and lower rainfall with higher bright afternoon sun hours during the winter and summer months (Jan–May), and farmers were forced to apply 12–14 rounds of insecticidal sprays during the 2016 season. Forest tree cover and stand (density) can be essential for mitigating the effects of excessive bright sun hours. Thus, pest and disease problems can be minimized to increase the sustainability of cardamom farming in the ICH under increased rainfall anomaly. Maintaining shade levels mitigates the negative impacts of rising surface air temperature, decreasing rainy days, and rising soil temperature. To avoid environmental stress, cardamom farmers should keep shade levels above the suggested levels. Cardamom yield-forest sustainability models need to be developed based on empirical analysis for each climatic element in future research. Availability of reliable long-term metrological data from more observatories is the main limitations.
The original contributions presented in the study are included in the article/supplementary material, further inquiries can be directed to the corresponding authors.
MM, AK, and AA planned, conceived, and wrote the paper. KA, MD, AP, AS, MA, and NS collected, verified, and analyzed the data. All authors reviewed the manuscript and approved.
This study was partially supported by the National Science Foundation under Grant no. 1735235 awarded as part of the National Science Foundation Research Traineeship, USDA-NIFA Capacity Building (Grants 2017-38821-26405 and 2022-38821-37522), USDA-NIFA Evans-Allen Project (Grant 11979180/2016-01711), and USDA-NIFA (Grant no. 2018-68002-27920).
All the authors wish to express their gratitude to the Spices Board, Government of India, Ministry Commerce, for yield and acreage data on cardamom.
The authors declare that the research was conducted in the absence of any commercial or financial relationships that could be construed as a potential conflict of interest.
All claims expressed in this article are solely those of the authors and do not necessarily represent those of their affiliated organizations, or those of the publisher, the editors and the reviewers. Any product that may be evaluated in this article, or claim that may be made by its manufacturer, is not guaranteed or endorsed by the publisher.
Alagupalamuthirsolai, M., Ankegowda, S. J., Murugan, M., Sivaranjani, R., Balaji, R., and Akshitha, H. J. (2019). Influence of light intensity on photosynthesis, capsule yield, essential oil and insect pest incidence of small cardamom (Elettaria cardamomum (L.) Maton). J. Essent. Oil Bear. Plant. 22, 1172–1181. doi: 10.1080/0972060X.2019.1690587
Baig, I. A., Chandio, A. A., Ozturk, I., Kumar, P., Khan, Z. A., and Salam, M. (2022). Assessing the long-and short-run asymmetrical effects of climate change on rice production: empirical evidence from India. Environ. Sci. Pollut. Res. 29, 34209–34230. doi: 10.1007/s11356-021-18014-z
Baig, I. A., Irfan, M., and Salam, M. Isik (2023). Addressing the effect of meteorological factors and agricultural subsidy on agricultural productivity in India: a roadmap toward environmental sustainability. Environ. Sci. Pollut. Res. 30, 15881–15898. doi: 10.1007/s11356-022-23210-6
Cleveland, W. S., and Devlin, S. J. (1988). Locally-weighted regression: an approach to regression analysis by local fitting. J. Am. Stat. Assoc. 83, 596–610. doi: 10.2307/2289282
Ghosh, S., Luniya, V., and Gupta, A. (2009). Trend analysis of Indian summer monsoon rainfall at different spatial scales. Atmos. Sci. Lett. 10, 285–290. doi: 10.1002/asl.235
Helsel, D. R., and Hirsch, R. M. (1992). Statistical Methods in Water Resources. Elsevier, Amsterdam, 546.
Islam, A. R. M., Nabila, I. A., Hasanuzzaman, M., Rahman, M., Elbeltagi, A., Mallick, J., et al. (2022). Variability of climate-induced rice yields in northwest Bangladesh using multiple statistical modeling. Theor. Appl. Climatol. 147, 1263–1276. doi: 10.1007/s00704-021-03909-1
Malhi, Y., and Wright, J. (2004). Spatial patterns and recent trends in the climate of tropical rainforest regions. Philos. Trans. R. Soc. Lond. B. Biol. Sci. 359, 311–329. doi: 10.1098/rstb.2003.1433
Murugan, M., Ashokkumar, K., Alagupalamuthirsolai, M., Anandhi, A., Ravi, R., Dhanya, M. K., et al. (2022). Understanding the effects of cardamom cultivation on its local environment using novel systems thinking approach-the case of Indian cardamom hills. Front. Sustain. Food Syst. 6:728651. doi: 10.3389/fsufs.2022.728651
Murugan, M., Mukund, V., Ramesh, R., Hiremath, M. B., Josephrajkumar, A., and Shetty, P. K. (2008). Centennial rainfall variation in semi-arid and tropical humid environments in the cardamom hill slopes, southern Western Ghats, India. Caspian J. Environ. Sci. 6, 31–39. doi: 10.54207/bsmps1000-2008-27J960
Murugan, M., Raj, N. M., and Joseph, C. R. (2000). Changes in climatic elements and their impact on production of cardamom (Elettaria cardamomum M.) in the cardamom hills of Kerala; India. J. Spices Aromat. Crops, 9, 157–160.
Murugan, M., Ravi, R., Anandhi, A., Sajan, K., and Dhanya, M. K. (2017). Pesticide use in Indian cardamom needs change in cultivation practices. Curr. Sci. 113, 1058–1063. doi: 10.18520/cs/v113/i06/1058-1063
Murugan, M., Shetty, P. K., Anandhi, A., and Ravi, R. (2012a). Present and future climate change in Indian Cardamom Hills: implications for cardamom production and sustainability. Br. J. Environ. Clim. Change, 2, 368–390.
Murugan, M., Shetty, P. K., Ravi, R., Anandhi, A., and Josephrajkumar, A. (2012b). Climate change and crop yields in the Indian Cardamom Hills, 1978-2007 CE. Clim. Change 110, 737–753.
Okonkwo, G. N., Anthony, O., and Nwokoye, C. (2014). Relationship between global solar radiation and sunshine hour duration for Bida in Nigeria. Int. J. Sustain. Green Energy, 3, 43–46. doi: 10.11648/j.ijrse.20140302.12
Prashant, G., Renu, G., Prakasa, R. E. V. S., Ramesh, L. K. V., Sudarshan, M. R., and Ajay, D. (2014). A weather-based forecast model for capsule rot of small cardamom. Curr. Sci. 107, 1013–1019.
Praveen, B., Kumar, P., Baig, I. A., Bhardwaj, M., Singh, K., and Yadav, A. K. (2022). Impact of environmental degradation on agricultural efficiency in India: evidence from robust econometric models. J. Bioeconomics 24, 203–222. doi: 10.1007/s10818-022-09327-1
Reyes, T., Quiroz, R., Luukkanen, O., and Mendiburu, F. (2009). Spice crops agroforestry systems in the East Usambara Mountains, Tanzania: growth analysis. Agroforest Systems, 76, 513–523. doi: 10.1007/s10457-009-9210-5
Sen, P. K. (1968). Estimates of the regression coefficient based on Kendall's Tau. J. Am. Stat. Assoc. 63, 1379–1389. doi: 10.1080/01621459.1968.10480934
Sheng, Y., Pilon, G. P., and Cavadias, G. (2002). Power of the Mann–Kendall and spearman's rho tests for detecting monotonic trends in hydrological series. J. Hydrol. 259, 254–271. doi: 10.1016/S0022-1694(01)00594-7
Theil, H. (1950). A rank-invariant method of linear and polynomial regression analysis. Proc. Royal Netherlands Acad. Sci. 53, 386–392.
Keywords: climate change, rainfall, bright sun hours, time series, soil temperature, yield
Citation: Murugan M, Kuruvila A, Anandhi A, Pooja A, Ashokkumar K, Dhanya MK, Subbiah A, Alagupalamuthirsolai M and Sritharan N (2023) Cardamom agro-environmental interrelationships analysis in Indian cardamom hills. Front. Clim. 5:1107804. doi: 10.3389/fclim.2023.1107804
Received: 28 November 2022; Accepted: 16 May 2023;
Published: 13 June 2023.
Edited by:
Carlos Antonio Da Silva Junior, State University of Mato Grosso, BrazilReviewed by:
Katarina Zabret, University of Ljubljana, SloveniaCopyright © 2023 Murugan, Kuruvila, Anandhi, Pooja, Ashokkumar, Dhanya, Subbiah, Alagupalamuthirsolai and Sritharan. This is an open-access article distributed under the terms of the Creative Commons Attribution License (CC BY). The use, distribution or reproduction in other forums is permitted, provided the original author(s) and the copyright owner(s) are credited and that the original publication in this journal is cited, in accordance with accepted academic practice. No use, distribution or reproduction is permitted which does not comply with these terms.
*Correspondence: Muthusamy Murugan, bXV0aHVwZXlhbkBnbWFpbC5jb20=; Kaliyaperumal Ashokkumar, YmlvdGVjaC5hc2hva0BnbWFpbC5jb20=
Disclaimer: All claims expressed in this article are solely those of the authors and do not necessarily represent those of their affiliated organizations, or those of the publisher, the editors and the reviewers. Any product that may be evaluated in this article or claim that may be made by its manufacturer is not guaranteed or endorsed by the publisher.
Research integrity at Frontiers
Learn more about the work of our research integrity team to safeguard the quality of each article we publish.