 Hanadi S. Rifai
 Amin Kiaghadi
 Daniel W. Burleson1
- 1Civil and Environmental Engineering, University of Houston, Houston, TX, United States
- 2Computational Hydraulics Group, Oden Institute, University of Texas at Austin, Austin, TX, United States
In this study, a novel framework was developed to provide a holistic damage assessment caused by severe hydrologic events whether individually or as a compound event. The novel framework uses a developed hurricane-specific water quality model, Environmental Fluid Dynamic Code-Storm Surge model (EFDC-SS) and an ArcGIS-based framework, the Facility Economic Damage and Environmental Release Planning (FEDERAP) to assess damages to the built and natural environment. The developed framework could be used to compare different hurricanes and storms with a focus on land inundation, spill destination in both land and water and their associated risks, as well as economic loss including both physical and secondary losses. The results showed different spreading mechanisms during surge and rainfall-based hurricanes. While storm surge pushed contaminants (from spills) upstream, the rainfall-based hurricane caused a larger footprint of contamination on land. Though different in spreading patterns, spills during both hurricane types can widely spread miles away from the release location in a very short period of time. The FEDERAP economic loss model showed that facility area, average land elevation, the number of storage tanks and process units at the facility, and daily production are key drivers in the calculated total losses for a given hydrologic event.
Introduction
Storm surge, the rise in water level due to wind and pressure stresses, is known to be the most devastating aspect of a hurricane due to the retention time of inundated areas, currents, and water pressures within affected regions (Godoy, 2009; Naito et al., 2012). The literature is replete with studies that have demonstrated the catastrophic impacts of storm surge on residential areas (e.g., Robertson et al., 2007; Frazier et al., 2010) as well as on industrial regions (e.g., Cruz et al., 2001; Cauffman et al., 2006; Pine, 2006; Godoy, 2007; Harris and Wilson, 2008; Santella et al., 2010; Hallegatte et al., 2011; Burleson et al., 2015). However, in recent years, hurricanes with historical rainfall (e.g., Hurricane Harvey with >125 cm of rainfall in Houston, Texas, United States) have also caused billions of dollars in damages to the economy (e.g., Kiaghadi and Rifai, 2019; NCDC, 2020). The catastrophic impacts of severe hydrologic events whether from storm surge or inland flooding can be amplified when they occur concurrently or in sequence (compound flooding). In addition, numerous articles in the general literature have reported on environmental impacts of hurricanes, both in built and natural environments and encompassing damages from the hurricane itself and from cascading impacts associated with hurricanes (referred as secondary losses) such as failures in environmental infrastructure and spills and leaks from industrial and hazardous waste facilities (e.g., Chang et al., 1997; Khan et al., 2001; Verter and Kara, 2001; Hoobler et al., 2003; Ashley et al., 2008; Srinivas and Nakagawa, 2008; Kim et al., 2011; Liao et al., 2011; Qi and Altinakar, 2011; Eldrandaly and AbdelAziz, 2012; Mamauag et al., 2013; Kiaghadi et al., 2018; Kiaghadi and Rifai, 2019; Kiaghadi et al., 2020). However, and to the best knowledge of the authors, there is no integrated framework that covers both economic and environmental impacts at the detailed facility level due to vulnerabilities to storm surge, inland flooding, or compound flooding.
Despite the recent progress in hydrodynamic models to simulate compound flooding events (e.g., Bilskie et al., 2016; Moftakhari et al., 2017; Kumbier et al., 2018; Zhang et al., 2019; Loveland et al., 2021), there is still no single model that could accurately represent the complex nature of such events that involve various forcing and processes (Santiago-Collazo et al., 2019). To address the lack of a seamless framework integrating all these processes, nested (most common) and dynamic (most challenging) coupling of various models (i.e., two or three) have been used by researchers across the globe (e.g., Santiago-Collazo et al., 2019; Loveland et al., 2021). Additionally, the majority of the aforementioned modeling efforts have focused on land inundation and physical damages and less attention has been paid to environmental impacts such as spills and leaks (Kiaghadi et al., 2018). While the results of hydrodynamic or geospatial models could be used to estimate the occurrence probability of spill and leaks (Burleson et al., 2015; Kiaghadi et al., 2020), simulating the fate and transport of spills and leaks during compound flooding events requires more complex hydro-environmental modeling. For this purpose and depending on the nature of the hydro-environmental modeling effort (i.e., hindcast or forecast), a hydrodynamic model with a mass transport module, individually or in combination with an infrastructure failure model, is required. A modeling system developed for hindcasting could work with observed values at its boundary conditions without the need for other models while for forecasting purposes, it is required to have other models to provide flux and water heights at the boundaries. As one of the few examples in the literature, Kiaghadi et al. (2018) coupled the U.S Environment Protection Agency's (EPA) Environmental Fluid Dynamic Code (EFDC) code (Hamrick, 1992) to the SWAN (Simulating WAves Nearshore) + ADCIRC (Advanced Circulation) hurricane simulation model from Hope et al. (2013) and a stochastic tank failure model developed by Kameshwar and Padgett (2015). The developed Environmental Fluid Dynamic Code-Storm Surge model (EFDC-SS) uniquely captures storm surge, local runoff, and compound flooding effects on the fate and transport of pollutants in the environment associated with severe hydrologic events.
In the case of a compound flooding event, when both storm surge and local runoff are present, the residential impact would be more severe in areas prone to fluvial and pluvial flooding (Huang et al., 2001). Thus, the focus of this study is on industrial parcels where both storm surge and local runoff could cause inundation. Losses during extreme events entail both primary (direct losses to product or infrastructure due to inundation) and secondary losses such as environmental cleanup and downtime that may result from the inundation in addition to catastrophic losses of units/processes that have been discussed in previous research on hurricanes (e.g., Cauffman et al., 2006; Pine, 2006; Santella et al., 2010; Burleson et al., 2015) and tsunamis (Srinivas and Nakagawa, 2008; Naito et al., 2012).
Numerous researchers have reported on damages experienced by industrial facilities during hurricanes such as significant failure of electrical centers, processing buildings, control centers (Harris and Wilson, 2008), structural failure, floating tanks, and significant production downtime due to power failure (Cruz et al., 2001; Godoy, 2007; Santella et al., 2010). Productivity loss has been discussed previously in the literature (e.g., Bailey and Levitan, 2008; Cruz and Krausmann, 2013) but never accounted for in damage estimates associated with natural disasters. Furthermore, only a few studies have discussed potential environmental impacts during hurricanes (e.g., Ashley et al., 2008; Santella et al., 2010); however, environmental cleanup has not been accounted for in any of them. Moreover, studies on tank failure have been limited to conducting surveys in the aftermath of extreme events to report losses (e.g., Cauffman et al., 2006; Pine, 2006; Godoy, 2007; Naito et al., 2012) as opposed to rigorous studies aimed at providing a framework to predict failure based on locations and elevation. While various tools have been developed and used to assess hazardous waste transport (e.g., Zografos et al., 2000; Verter and Kara, 2001; Kim et al., 2011), community businesses (Yang et al., 2009), and population impact (Qi and Altinakar, 2011), there is no framework for assessing the vulnerability of industrial facilities to compound flooding that encompass both primary and secondary losses. Additionally, and despite the presence of some Geographic Information System (GIS)-based tools such as Hazards United States-Multi Hazard (HAZUS-HM, https://www.fema.gov/hazus) that could be used to estimate the regional losses due to varios hazards, there is a gap for a framework that could capture losses based on detailed industrial facility data at the parcel resolution.
To estimate damages at industrial parcels that encompass physical damage from inundation as well as secondary losses from environmental spills and releases and downtime effects on productivity, an ArcGIS-based framework, the Facility Economic Damage and Environmental Release Planning (FEDERAP) framework was developed in this study. Unlike previous ArcGIS-based toolboxes (e.g., Chang et al., 1997; Khan et al., 2001; Verter and Kara, 2001; Hoobler et al., 2003; Kim et al., 2011; Liao et al., 2011; Qi and Altinakar, 2011; Eldrandaly and AbdelAziz, 2012; Mamauag et al., 2013), the developed model is the first effort that integrates secondary losses from environmental releases and facility downtime into the overall loss assessment. This paper presents the coupling of the ADCIRC+SWAN model with EPA's EFDC model as a framework for assessing environmental and economic damages associated with storm surge and the cascading effects of storm surge that include failures in environmental infrastructure such as wastewater plants, hazardous waste facilities and failures in industrial infrastructure including unit processes and above ground storage tanks that store chemicals and petrochemicals. The paper demonstrates the implementation of the developed coupled models to the Houston-Galveston (HSC-GB) region, and more specifically in the HSC-GB Estuary in Texas, United States that will be collectively referred to as the GBS, for Hurricanes Ike and Harvey in 2008 and 2017, respectively.
Materials and Methods
Study Region
The Houston Ship Channel (HSC) region (Figure 2), located in Harris County, Texas, United States, was selected for demonstrating the developed coupled modeling and economic damage framework. The HSC itself is a highly industrialized area with more than 900 industrial facilities and more than 4,300 above ground storage tanks (Burleson et al., 2015; Kiaghadi et al., 2018). The HSC is tidally influenced and geographically extends from the Port of Houston, near downtown Houston, Texas, to the Gulf of Mexico. The navigational channel average width and depth are 162 and 13.7 m, respectively. This region is an ideal setting for the study due to the historical record of hurricanes in the Houston-Galveston region (Needham and Keim, 2012) combined with the significant presence of chemical and petrochemical industries.
EFDC-SS: Coupling ADCIRC + SWAN and EFDC Models
In this paper, the Kiaghadi et al. (2018) EFDC-SS model is used to simulate pollutant transport from spills during a rainfall-based hydrologic event. The EFDC-SS framework developed by Kiaghadi et al. (2018) has sufficient spatial, temporal, and stratification resolution to: (1) investigate the compound effects of inundation from rainfall and storm surge that may lead to spills and leaks from environmental infrastructure and industrial facilities, (2) provide water velocity estimates that can be used to understand erosion, sediment transport, and the probability of damage to physical infrastructure such as above-ground storage tanks within industrial facilities, (3) investigate the transport and trajectory of pollutant releases as surge water moves inland and recedes back to the ocean, (4) provide pollution sourcing input functions to air quality models for hydrocarbon spills on land or in riverine systems that volatilize and create airshed plumes, and (5) assess the economic loss and recovery periods when combined with other economic models (e.g., coupled with FEDERAP) as shown in Figure 1. However, this study is focuced on 1, 3, and 5.
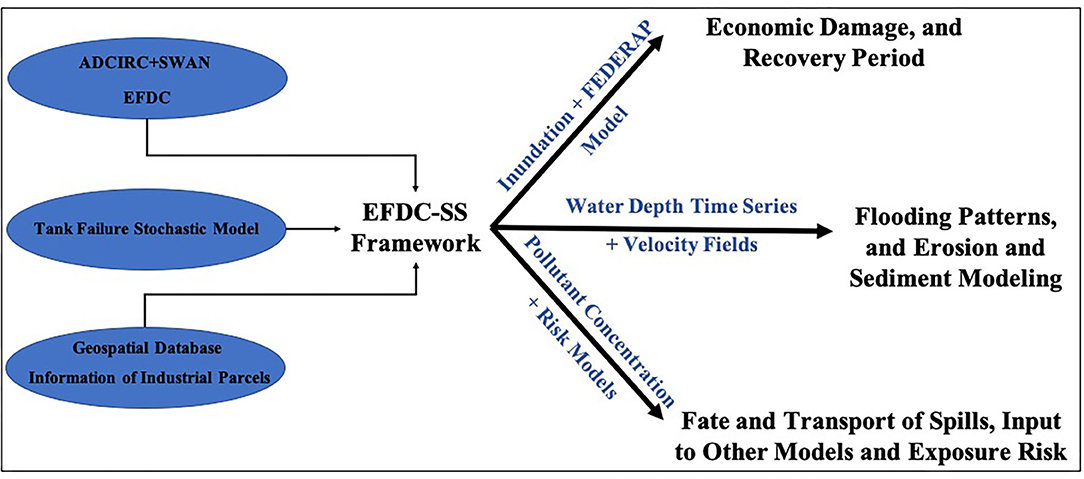
Figure 1. EFDC-SS framework with the input information/models and potential applications.
In brief, a detailed grid for the HSC was developed that includes wet (within the waterway) and dry cells (on land) with a total of 42,975 cells. The cells are 96 × 96 m with a total 396 km2 area coverage. The bathymetry data were combined from various sources and dry and wet depth values of 0.12 and 0.15 m, respectively, were assigned to dry and wet cells, respectively. In this case, when the water depth is <0.12 m, the cell is excluded from hydrodynamic calculations. The coupling of EFDC to ADCIRC + SWAN was completed via a surge-based head boundary condition at the mouth of the HSC before it reaches Upper Galveston Bay (see Figure 2). For the headwater boundary, the Water Surface Elevations (WSEs) throughout a given severe storm duration were extracted from a gauge maintained by the National Oceanic and Atmospheric Administration (NOAA) or the SWAN + ADCIRC model when no measured data was available (e.g., Hurricane Ike). Since the SWAN + ADCIRC model developed by Hope et al. (2013) was calibrated for Hurricane Ike, using varios observed data, it is assumed that the WSEs values at at the mouth of HSC have the same accuracy as the NOAA gauge. However, using headwater boundary conditions from two different sources may result in some uncertainties in intrepting the results. The discharge flow rates were incorporated into EFDC-SS as headwater flow boundary conditions at the locations of bayou outfalls into the HSC (see flow boundary locations in Figure 2). No wind within the EFDC-SS domain and no direct rainfall on the model grid were considered in this study. The effect of rainfall was incorporated in the model through the flow boundaries and the wind effect was accounted in the SWAN + ADCIRC model. Furthermore, in this study, the inundation duration was defined as the duration in which a cell initially dry remains wet before the flooding recedes. However, and a limitation of numerical models, it is worth mentioning that if an originally dry cell (land with a water depth of zero) becomes wet (inundated with positive water depths) and loses its connectivity with the adjacent cells, it remains wet for the rest of the simulation period.
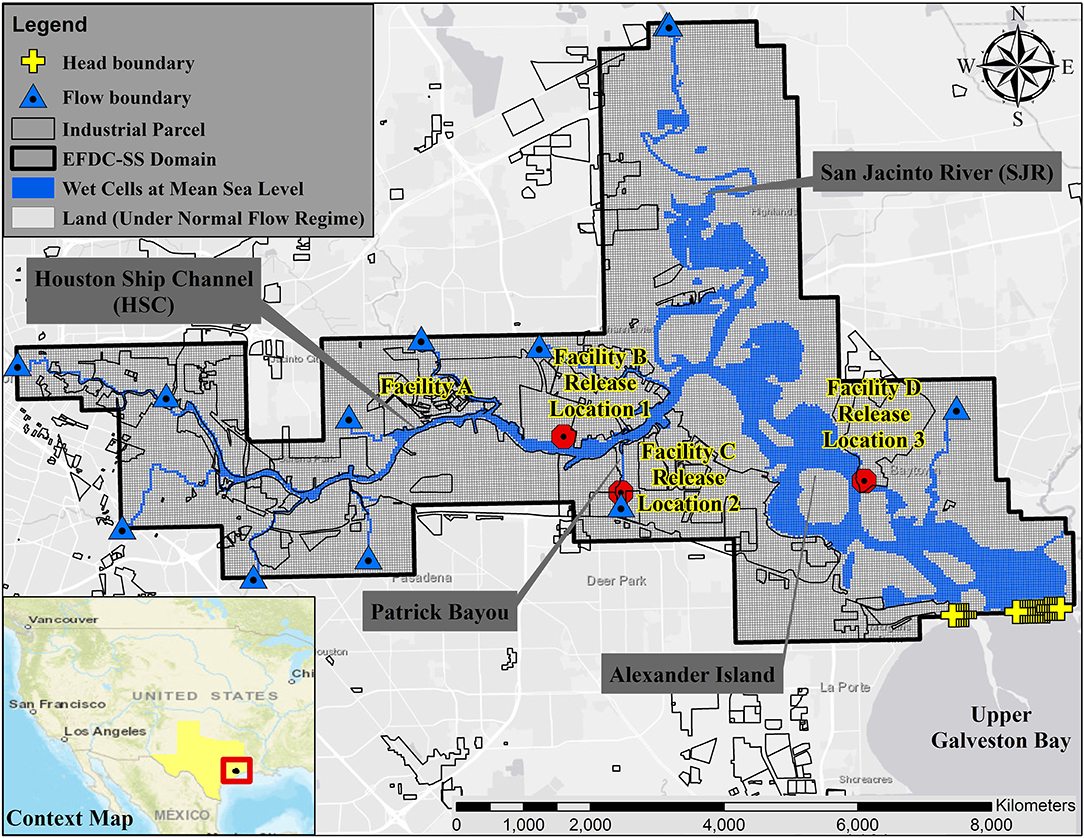
Figure 2. Modeled domain with EFDC-SS.
Release Locations 1–3 (see Figure 2) were selected because tanks located within these areas showed the highest probability of failure during Hurricane Ike and Harvey. The results of the calibrated EFDC-SS for Hurricane Harvey (RMSE of 0.87 m for 265 high water marks) was used to estimate the probability of failure for all ~4,300 above ground storage tanks using the stochastic method developed by Kameshwar and Padgett (2015). The resulting probabilities and potential spill volumes were used to set-up the tracer module and simulate the fate and transport of potential spills during compound events. A passive tracer dye was used to estimate the trajectory of the dissolved phase of a spill. However, it should be noted that using a passive tracer dye limits the ability to capture weathering processes (i.e., evaporation and emulsification) and the chemical reactions among chemicals. Three release locations with the highest probability of failure (Release Locations 1–3 in Figure 2) were chosen for spill simulations. In the case of a spill, the waterbody is not the only contaminated matrix and due to high WSEs and inundation, chemicals released during a spill can reach and pollute surrounding land areas, and possibly volatilize to the airshed (this aspect was not considered in this study). The cells in the model domain toggle between being dry and wet throughout the storm. One of the novel aspects of the study is in including the effect of spills on land in addition to waterways.
FEDERAP Economic Damage Framework
The Facility Economic Damage and Environmental Release Planning (FEDERAP) framework combines an ArcGIS toolbox with Excel-based economic-function worksheets for estimating costs for a single facility and to accumulate costs across an entire industrial complex. The GIS toolbox is used to develop spatial analysis data for various storm surge levels for a given facility (for example, to determine areas within an industrial facility that are inundated at a given storm surge level). Built-in tools such as Clip, Select by Location, and raster conversion tools were used in an intentional order to accurately evaluate the inundation of the facility infrastructure. The result is several geodatabases of shapefiles and statistics that represent the inundation for each aspect of the facility at multiple storm surge levels. The data from these geodatabases are exported into a tabular format for economic damage assessment within the FEDERAP Excel Analysis. The Excel worksheets allow users to compile the spatial analysis data from the GIS toolbox and use the information in conjunction with economic loss algorithms in order to predict losses for a given storm surge level for a specific facility.
The FEDERAP framework requires a spatial analysis to determine the extent of inundation of a given facility, its unit-processes, and storage tanks for a given storm surge depth. This spatial analysis is undertaken using the results from the EFDC-SS model scenarios described above. For the purposes of this research, inundation is defined to occur in any part of the geographic study extent where the elevation of land is lower than the predicted storm surge level. The inputs to the spatial analysis toolbox include:
i. Facility boundary. Facility boundaries are represented using a polygon shapefile with multiple objects that accurately represent the entire facility. The data were derived from parcel boundaries and ownership information from the Harris County Appraisal District (HCAD, https://hcad.org) and vcrified with 0.3 × 0.3 m (1 × 1 ft) aerial photography from the Houston-Galveston Area Council (HGAC) GIS database (https://gishub-h-gac.hub.arcgis.com/).
ii. Water surface elevation (WSE) of interest. The outputs of the EFDC-SS are used here. Alternatevily, the user could specify a minimum and maximum value for WSE to be used in the analysis. The model loops over the WSE range using a step of one unit. For example, for a minimum storm surge of ~3 m (10 ft) and a maximum of ~4.6 m (15 ft), storm surge levels of 3.04, 3.35, 3.66, 3.96, 4.27, and 4.57 m (10, 11, 12, 13, 14, and 15 ft) would be evaluated within the toolbox (6 loops).
iii. Unit-processes. A polygon shapefile defining each unit-process as a single object is used for this input. A unit-process is defined in this research as a region within the facility where chemical or oil refining occurs and/or is processed. The data were obtained from the HGAC aerial photography described above.
iv. Storage Tanks. A separate polygon shapefile is used to represent the various storage tank types within the HSC: horizontal, fixed-top vertical, and floating-top vertical tanks (illustrated in Figure 3). The shape of the object in the input file reflects the shape of the tank (circular for vertical tanks and oval for horizontal tanks). The data were obtained from the HGAC aerial photography described above.
v. Elevation for Region. The elevation for the region input is a point file with elevation locations throughout the region in which the facility is located. The FEDERAP toolbox includes commands to extract only the elevation for the facility within the boundary specified; ArcGIS point to raster conversion is utilized based on least squares to develop a high-density elevation-point surface for the entire facility. Alternatively, Digital Elevation Models (DEMs) compiled from Light Detection and Ranging (LiDAR) could be used.
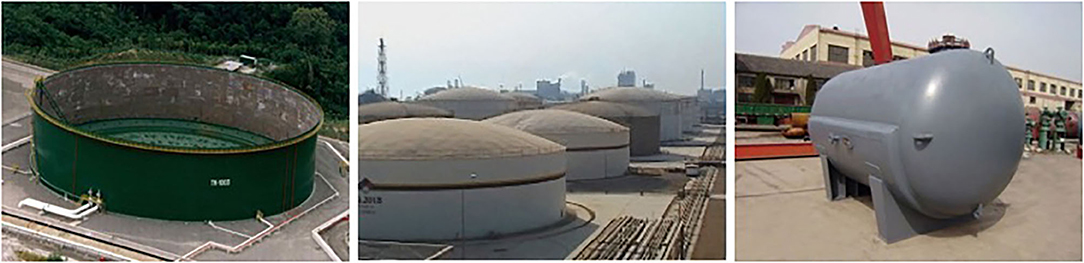
Figure 3. Types of storage tanks from left to right (floating top vertical, horizontal, and fixed top vertical).
The FEDERAP framework encompasses four categories of loss as shown in Figure 4: (1) facility loss, (2) unit process loss, (3) environmental release loss, and (4) productivity loss. Each of these components is a function of inundation caused by the storm surge level and is associated with models of economic losses due to inundation. The economic loss variables used in the analysis for each facility ranged between a high and a low value, therefore, 3 estimates of economic losses were developed: high, low and average. The framework incorporates aspects of downtime, production, and potential cleanup costs that have not been previously combined into a single model for evaluating vulnerability. Each of these categories is explained in more detail in the following sections.

Figure 4. The FEDERAP model framework.
Category 1: Facility Inundation Loss
Facility inundation, defined as the part of a facility that is covered with water for a given WSE, is a key driver in FEDERAP similar to many of the developed models and regression such as HAZUS (Vickery et al., 2006). In FEDERAP, the percent of the facility area that is inundated for a given WSE is calculated using the detailed elevation data within the facility. Land value is based on the property-appraised value of the land parcels for the facility from the Harris County Appraisal District (HCAD) as noted above. Losses in facility value are modeled based on the percent of the facility that is under water for a given hydrologic event, as shown in Table 1; this input economic loss function can be altered by the user.
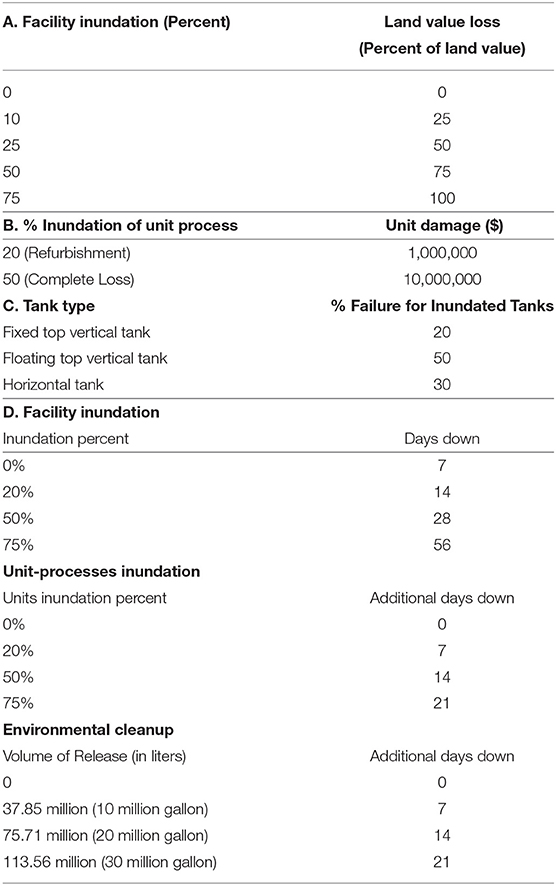
Table 1. (A) Land value loss as a function of facility inundation, (B) Loss algorithm for unit process inundation, (C) Storage tank types and their modeled failure under surge and (D) Modeled relationship between non-operational days and percent inundation of facilities.
Category 2: Unit Process Loss
Unit-processes, locations within a facility that are used to process (i.e., make and move) chemicals have a value relative to the overall production of the facility in addition to the intrinsic value of the structure itself. For each unit-process, a percent inundation is calculated and associated with a cost of refurbishment or a replacement cost using the relationship shown in Table 1. While recent reports have estimated costs for construction of process units at ~$340 million with refurbishment estimated at $60 million (Eggleston, 2014), convervative estimates were used in the study as shown in Table 1. As with facility losses in the previous section, the algorithm in Table 1 can be customized by the user.
Category 3: Environmental Release Loss
The environmental losses modeled in FEDERAP are based on an estimate of the tanks that would be inundated for a specific storm surge level that are calculated using the EFDC-SS model presented in the previous section. A tank is designated as inundated if the elevation of the bottom of the tank is below the WSEs caused by the extreme event. It is, however, unlikely that all inundated tanks would experience failure, thus a certain percentage of inundated tanks is modeled to fail. In this research, the percent of tanks that experience failure when inundated ranges from 20 to 50% depending on the type of tank (see Table 1); these modeled percentages are also a model variable that can be refined given specific data on tank structural integrity as discussed previously. The percent of total tanks inundated for each hydrologic event is applied to the total stored product for the facility to determine the projected spill quantity. Spills from previous hurricanes have had significant impact on contaminant levels in water that would require cleanup (Reible et al., 2006; Freund et al., 2014). A cost of cleanup of $31 dollars per liter of product released is applied to the projected spill amount based on work presented in Etkin (2000). The total environmental loss is the sum of the loss associated with cleanup of the spilled volume and an estimated cost for replacing the tank structure itself. For example, a facility having 10 fixed top vertical tanks that are inundated at a storm surge level of ~6 m (20 feet) with a total volume of stored product of ~1,893 L(500 gallons) would experience a loss of 20% of the product or ~378.5 L (i.e., 378.5 L with an associated cleanup cost of 378.5 L × $31/liter or $11,733.5). In this case, two tanks would fail and assuming a replacement cost of $1,000 per tank, the structural cost would be $2,000 yielding a total environmental cost of ~$13,733 for the facility at the ~ 6 m (20 ft) surge level.
Category 4: Productivity Loss
Productivity loss, as explained above, is the loss resulting from a disruption of normal business operations; sometimes referred to as “downtime.” In FEDERAP, downtime is modeled using the number of days that the facility is not operational in addition to the loss of physical product that would have been produced during the lost days (e.g., refined gasoline). The downtime is modeled using three key variables: the percent inundation of the facility, unit-process inundation, and the volume of released product resulting from a spill scenario (this triggers cleanup activities which cause further days of downtime). The modeled relationship between the percent inundation of the facility and days down is shown in Table 1D; for 75% inundation, for instance, 56 days of inactivity are projected based on the overall inundation. The total downtime, however, will be adjusted upwards if process units were inundated: a 20% inundation of process units adds 7 more downtime days to the 56 (Table 1D). Additionally, loss of products, for example, a release of 75.7 million liters (20 million gallons) of product will add 14 more downtime days to account for emergency response and cleanup that would needed. Thus, in the above example scenario, a total of 77 downtime days (56 + 7 + 14) are projected. The relationships shown in Table 1D were developed based on personal communications (via phone and/or in person interviews) with facility and emergency management personnel in Texas and can be customized for other regions or for a specific facility.
The downtime loss is estimated based on the number of days down and the daily revenue of the facility. Thus, for a facility that has daily revenue of $300K and using the 77 days down in the example above, the total downtime loss will be ~$23.1 million. Also included in the productivity loss is the cost associated with loss of production. Continuing with the example in this section, based on an estimated 10,000 barrels of oil-produced daily at the facility with a cost of $100 per barrel, a total production loss of $1 million is accrued per day during the 77 days of downtime ($77 million for production loss). The total productivity loss for the example is $100.1 million (the sum of the production loss of $77 million and the downtime loss of $23.1 million).
The Excel-based economic model (Table 2) has a total of seven worksheets that extract data from the geodatabases as discussed above. The first sheet incorporates general information about a facility including total land area, number of unit-processes, daily revenue and production. The next four sheets determine the results for each of the four categories of losses in the FEDERAP framework described above. The four loss estimation worksheets require the output statistics from the statistics geodatabase, as noted in Table 2. The losses are calculated for each category within the appropriate sheet in the Excel model. It is also here that users can modify the cost modeling algorithms and customize them for their specific application. The outputs from the FEDERAP Excel analysis are summarized in the final two sheets of the economic excel-based model. For each hydrologic event, the loss for each category and the total loss are both shown in tabular form as are loss curves showing the total loss and contribution from each of the four categories.

Table 2. FEDERAP Excel sheets.
Modeling Scenarios
The fate and transport of potential spills and their footprint on land, during compound flooding events were simulated for Hurricane Ike (2008) and Hurricane Harvey (2017), with storm surge and rainfall as the dominant sources of flooding, respectively. In other words, Hurricane Harvey (2017) was used to investigate how local flows emanating from different watersheds can affect land inundation and spill fate and transport compared to a surge-based event (e.g., Hurricane Ike in 2008). The EFDC-SS scenarios were named based on the storm type and release locations. For instance, Ike-3 represent a simulation with inputs from Hurricane Ike and tank failure at Release Location 3 (see Figure 2) resulting in a total of 6 scenarions (3 Release Locations for Ike and Harvey). The inundation patterns during these two types of hurricanes were compared. The extent of lands affected by the spill (both upstream and downstream of release location) were compared for Hurricane Harvey and Hurricane Ike for various release locations.
In this paper, while the EFDC-SS model is applied to three release locations (1–3), the FEDERAP framework is applied to four facilities identified as A (west of Release Location 1) and B (Release Location 1), C (Release Location 2), and D (Release Location 3). The locations and characteristics of the 4 facilities are shown in Figure 2 and Table 3, respectively. While Release Locations 1–3 from the EFDC-SS spill simulations were selected solely based on the probability of tank failure, the 4 identified facilities in the FEDERAP analysis were uniquely selected for their differing properties and to illustrate the rigor and range of possibilities for modeling damage associated with critical infrastructure. As mentioned earlier, the FEDERAP framework loops over the maximum WSE using a step of one unit. For Hurricane Ike, Kiaghadi et al. (2018) evaluated three scenarios included Hurricane Ike, Hurricane Ike worst-case scenario with regards to its landfall location by moving it to 150 miles southwest of its actual landfall location along the Texas coast, and Hurricane Ike worst landfall location scenario with a 30% increase in wind speed. The maximum modeled WSEs in the study area for the three scenarios ranged between 4.5 and 7.6 m (15−25 ft). Thus the FEDERAP framework was run within this range.
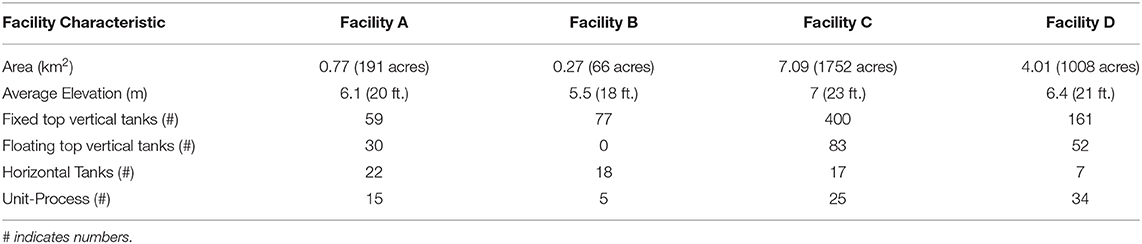
Table 3. Facility characteristics for the modeled Case Study facilities in the HSC.
A sensitivity analysis with FEDERAP further illustrates the rigor of the developed framework in estimating upper and lower bounds for damages and losses on a facility basis or for a group of facilities or an entire region with different types of critical infrastructure. A sensivity analysis was conducted to illustrate the utility of FEDERAP and the developed loss estimation framework. The sensitivity analysis was performed on Facility A, with a relatively large area of 0.77 km2 (191 acres) and an average elevation above 6 m. This facility has a number of tanks and process-units at various elevations and locations within the facility boundary (Table 3). The modeled losses for facility A ranged from $360 million to $3 billion and were non-linear relative to storm surge (referred to as the base case). Ten variables that affect cost estimates in FEDERAP were evaluated in the sensitivity analysis; each was varied between a lower (halved) and higher (doubled) value relative to the base run for Facility A. For example, the property value was varied between the range of half the base case value and double the base case value. Another example is the cost of cleanup of a release that was halved and doubled in the sensitivity analysis. The results sections include the results of EFDC-SS scenarios on both hydrodynamics and fate and transport of spills as well as FEDRAP model results.
Results and Discussion
EFDC-SS Hydrodynamics
Total inundated areas at the peak of the event was slightly higher during Hurricane Harvey (63.35 km2) compared to Hurricane Ike (59.72 km2). Compared to Hurricane Ike, Hurricane Harvey flooded more areas in the northern parts of the model domain, as shown in Figure 5, presumably because of higher flows in the San Jacinto River (SJR, historical high flow rates as high as 10,000 m3/s during Hurricane Harvey). In contrast, higher land inundation was observed within the southern parts of the domain and in shallow side bays during Hurricane Ike. The western parts of the model showed very similar inundation during both events. The different spatial distribution of inundated areas during different types of compound flooding events, emphasizes the need for considering all flooding sources (individually and in combination) in flood management. For instance, the results presented in Kiaghadi et al. (2018) shows that only focusing on storm surge (as is common practice for industrial corridors) could lead to underestimating the WSEs in northern parts of the system.
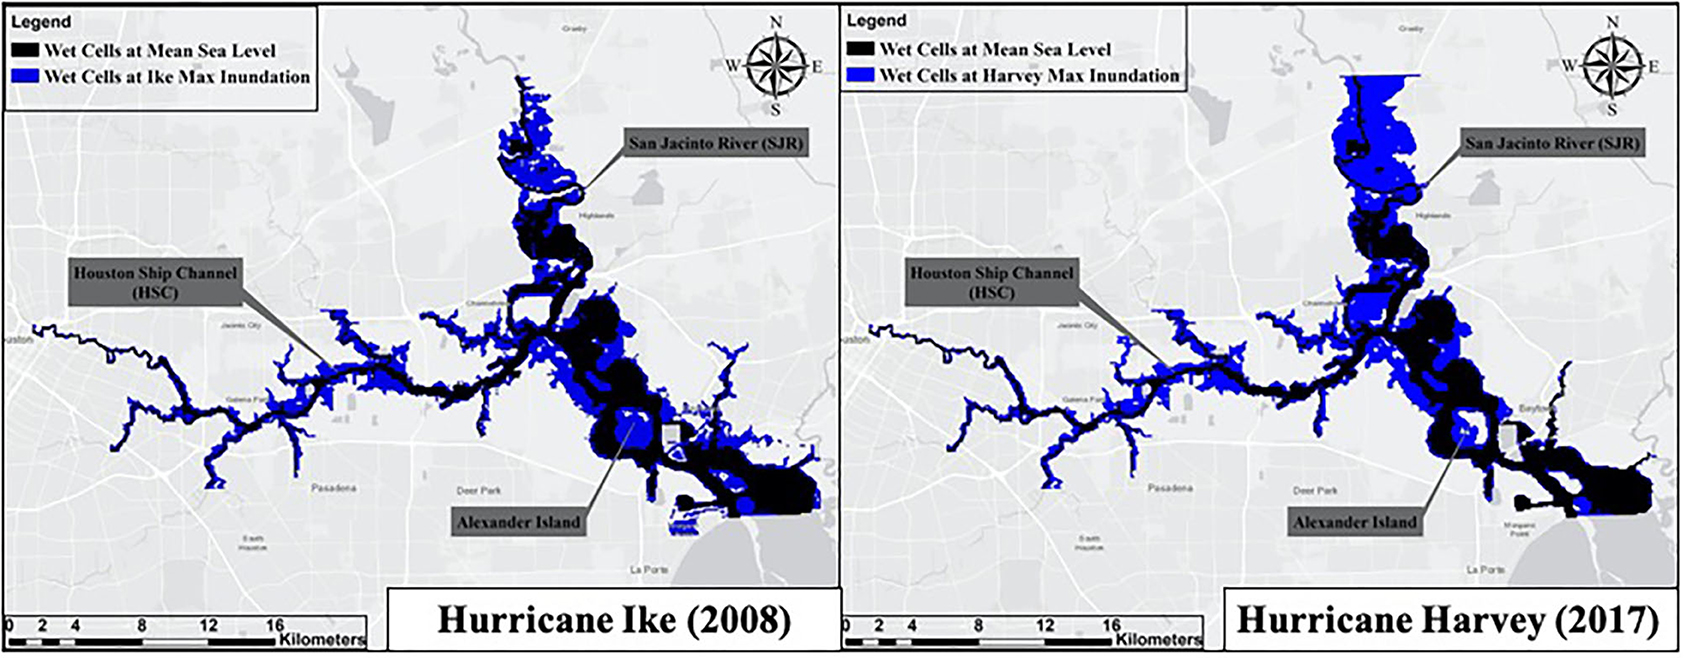
Figure 5. Comparison of maximum inundated areas for Hurricane Ike (left) and Hurricane Harvey (right).
The bottom/land elevation as well as the water depth time-series at several originally dry locations (dry at mean sea level) of the study area during Hurricane Ike and Harvey were shown in Figure 6. Different flooding patterns, as shown in Figure 6, were observed during the two different hurricane types across the modeling domain. A rapid increase in water depth (Figure 6), across the domain, was observed during Hurricane Ike, which was a surge-dominated event, followed by a rapid recession of the inundation. The entire inundation duration due to the storm surge (Hurricane Ike) was <24 h. However, due to the discharges emanating from the greater Houston bayous, a second peak in water depth and inundation pattern was observed during Hurricane Ike making the entire event last for 2.5 days everywhere except the SJR (4.5 days). Continuous water release from Lake Houston dam caused the elongated flood in areas adjacent to SJR (P3 in Figure 6). In the absence of a strong storm surge (about 0.6 m), the inundation process during Hurricane Harvey was driven by tidally forced in the downstream boundaries and local runoff in the flow boundaries (dominant). Considering that the travel time for most of the bayous in the study area is around 2–7 days (Petersen, 2006), Hurricane Harvey caused longer (between 5 and 6 days) and wider-spread land inundation compared to Hurricane Ike as shown in Figure 6. The peak water depth was almost the same for both hurricanes except areas closer to the downstream boundary of the model (P4 close to the mouth of Galveston Bay in Figure 6). Lower water depths and consequently lower inundation in the southern portion of the modeling domain during Hurricane Harvey compared to Ike is mainly due to the dictation of the downstream boundary condition. In other words, despite the high volume of water discharged to the system during Hurricane Harvey, the water surface elevation at the final water receptor was not significantly changed.

Figure 6. Bottom/land elevation in the study area and water depth time-series at several originally dry (dry at mean sea level) locations of the study area during Hurricanes Ike and Harvey.
EFDC-SS Tank Failure and Pollutant Transport
The estimated probabilities of failure for the above-ground storage tanks within the study area during both modeled hurricanes are shown in Figure 7. Considering the aforementioned logic in the previous section and the fact that inundation was for a longer period of time during Harvey (Figure 6), a higher number of tanks with high probabilities of failure in the western part of the HSC during Hurricane Harvey (Figure 7) could be justified. In addition, tanks located adjacent to the rivers/bayous were more prone to failure during Harvey due to historic flow rates leading to overbanking (with higher depth compared to Ike) and flooding the tanks. For the southern part of the system (Release Location 3 in Figure 7), the probabilities were almost the same as the maximum WSEs in the two events were very close in that region. The tanks located north of Release Location 3 were in a higher elevation area (see Figure 6) so they did not become inundated during either of the two events.
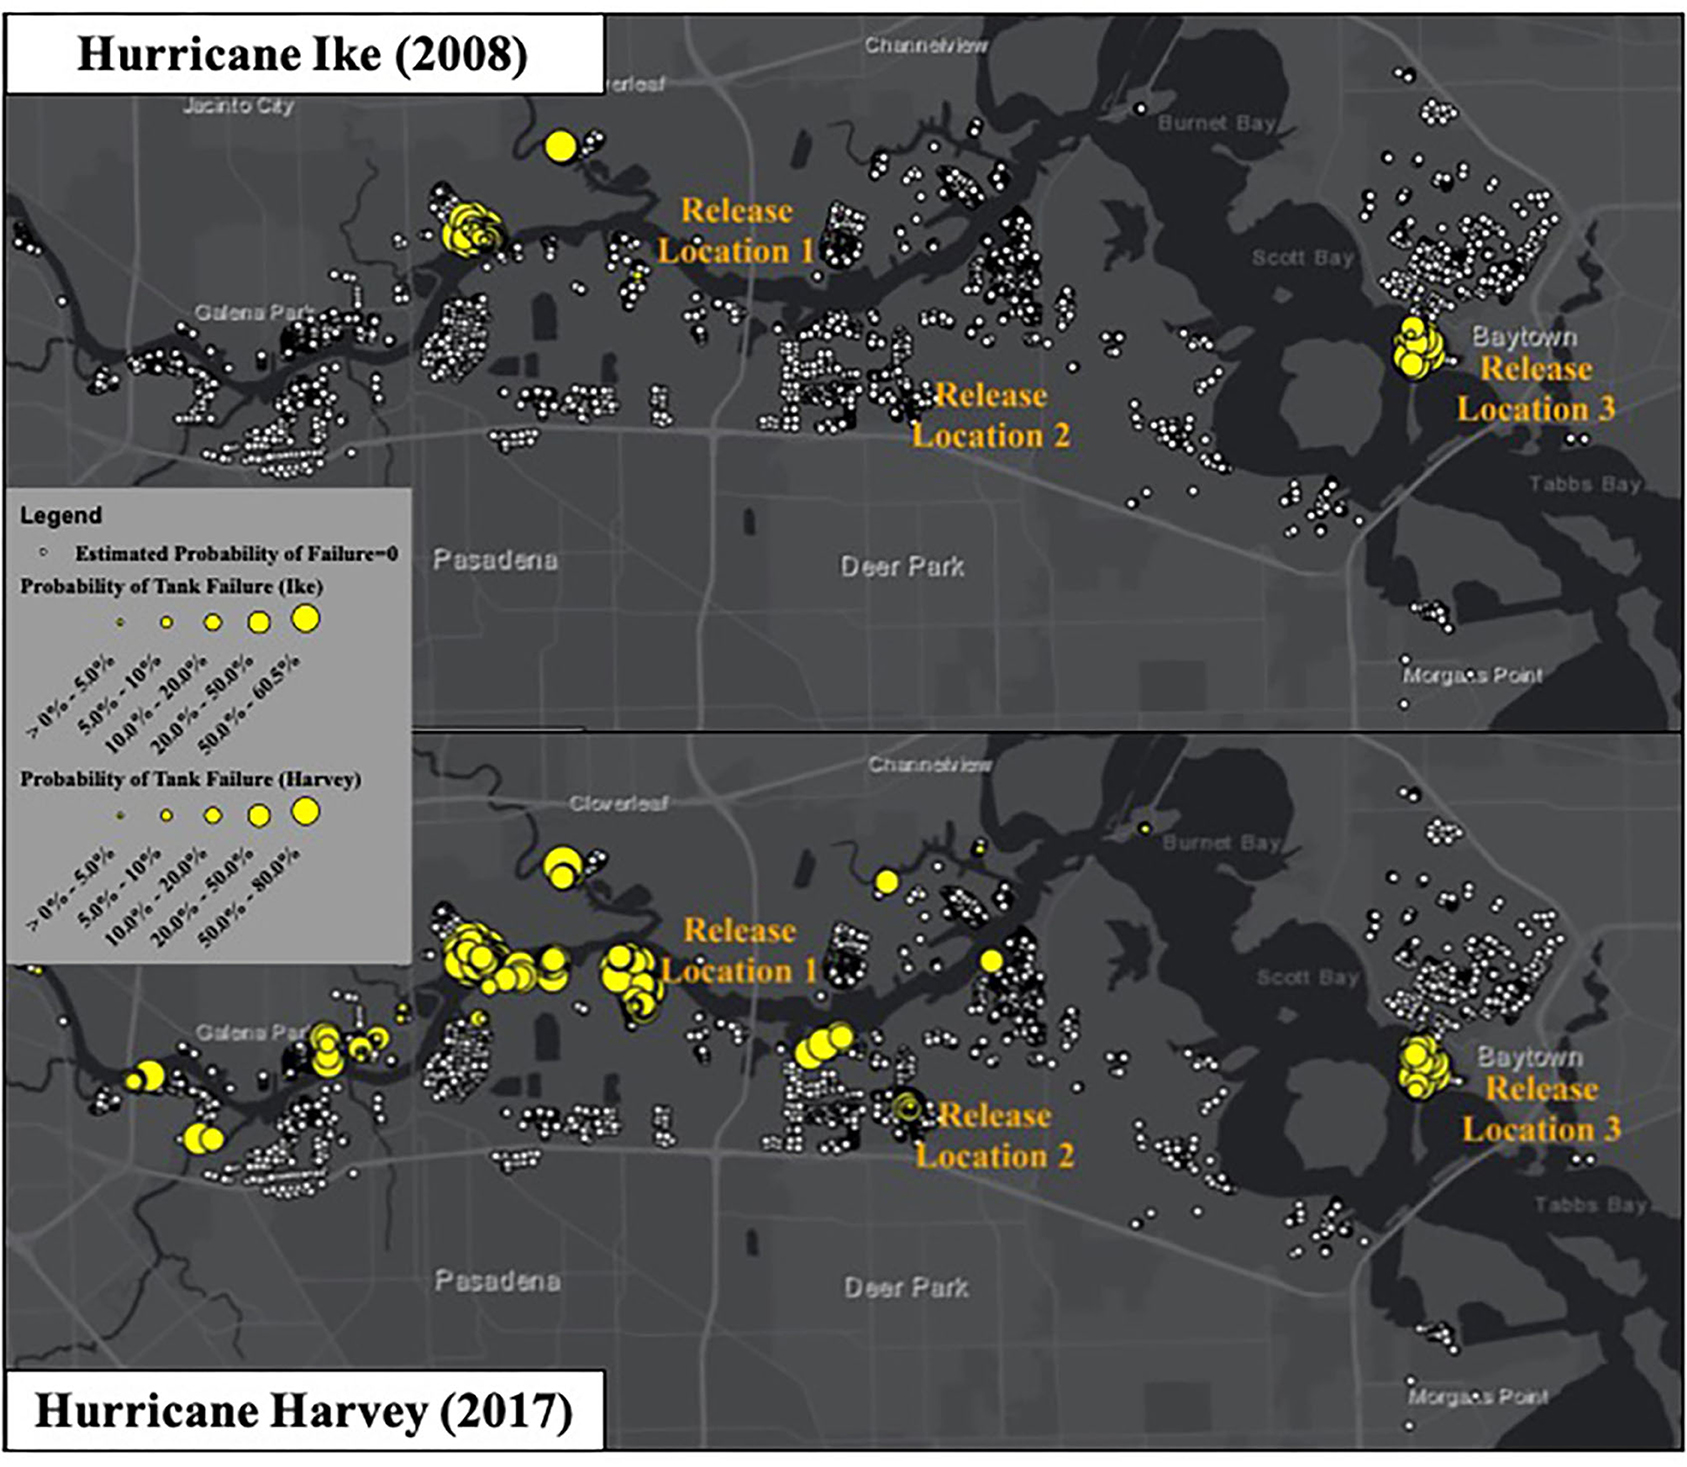
Figure 7. Estimated probability of failure for the ~4300 above ground storage tanks in the study area for Hurricane Ike (top) and Hurricane Harvey (bottom). Due to the absence of industrial tanks, the northern section of the domain (San Jacinto River, SJR area) is not shown.
As discussed in Kiaghadi et al. (2018), the release time relative to the peak of storm is a key parameter during an even like Hurricane Ike where the direction of the flow could change during the storm. However, the release time could not change the spread pattern (except the velocity) in a flow-dominated event such as Hurricane Harvey that the flow has always the same direction during the event. The dye concentrations for a release at the peak of the hydrograph during Hurricane Harvey for all of three release locations, are shown in Figure 8. Unlike Hurricane Ike scenarios shown in Kiaghadi et al. (2018), the conservative tracer was not spread upstream of Release Location 1 during Hurricane Harvey. In contrast, detectable dye concentrations were observed in north of the HSC confluence with the SJR (see Figure 6 for location) 1 week after the release (Figure 8). During Hurricane Harvey, dye concentrations 24 h after the release were lower than Ike. Also, 1 week after the release, dye concentrations were significantly lower within the system during Hurricane Harvey as compared to Ike, mainly due to continuous high flow rates. In other words, faster velocities during Harvey flooding (the results of the EFDS-SS simulations) caused the majority of the dye to pass through the boundary in a very short time and led to very low concentrations of dye remaining in the system after 1 week. For Release Location 2, Kiaghadi et al. (2018) showed that during Hurricane Ike a significant amount of dye mass remained in Patrick Bayou (Release Location 2, see Figure 2 for location), due to trapping within the bayou, that acted as a continuous source of dye that polluted the western part of the HSC after a week. For the same location, different mass transport behavior was observed during Hurricane Harvey. Here again, faster water velocities during Harvey caused more flushing and transportation of the contaminants in the HSC. The spread of the spill at Release Location 3 was very similar during both hurricanes. Just like Release Location 1, for Release Location 3, no upstream spread was observed during Hurricane Harvey. However, after water levels were back to normal (when water surface elevations are back to the mean sea level), tidal movements transferred the remaining contaminants in the system to the upstream regions. With regards to contaminant transport to the final receptor (Galveston Bay), the two hurricanes showed different behaviors for Release Locations 1 and 2 but similar behavior for location 3.
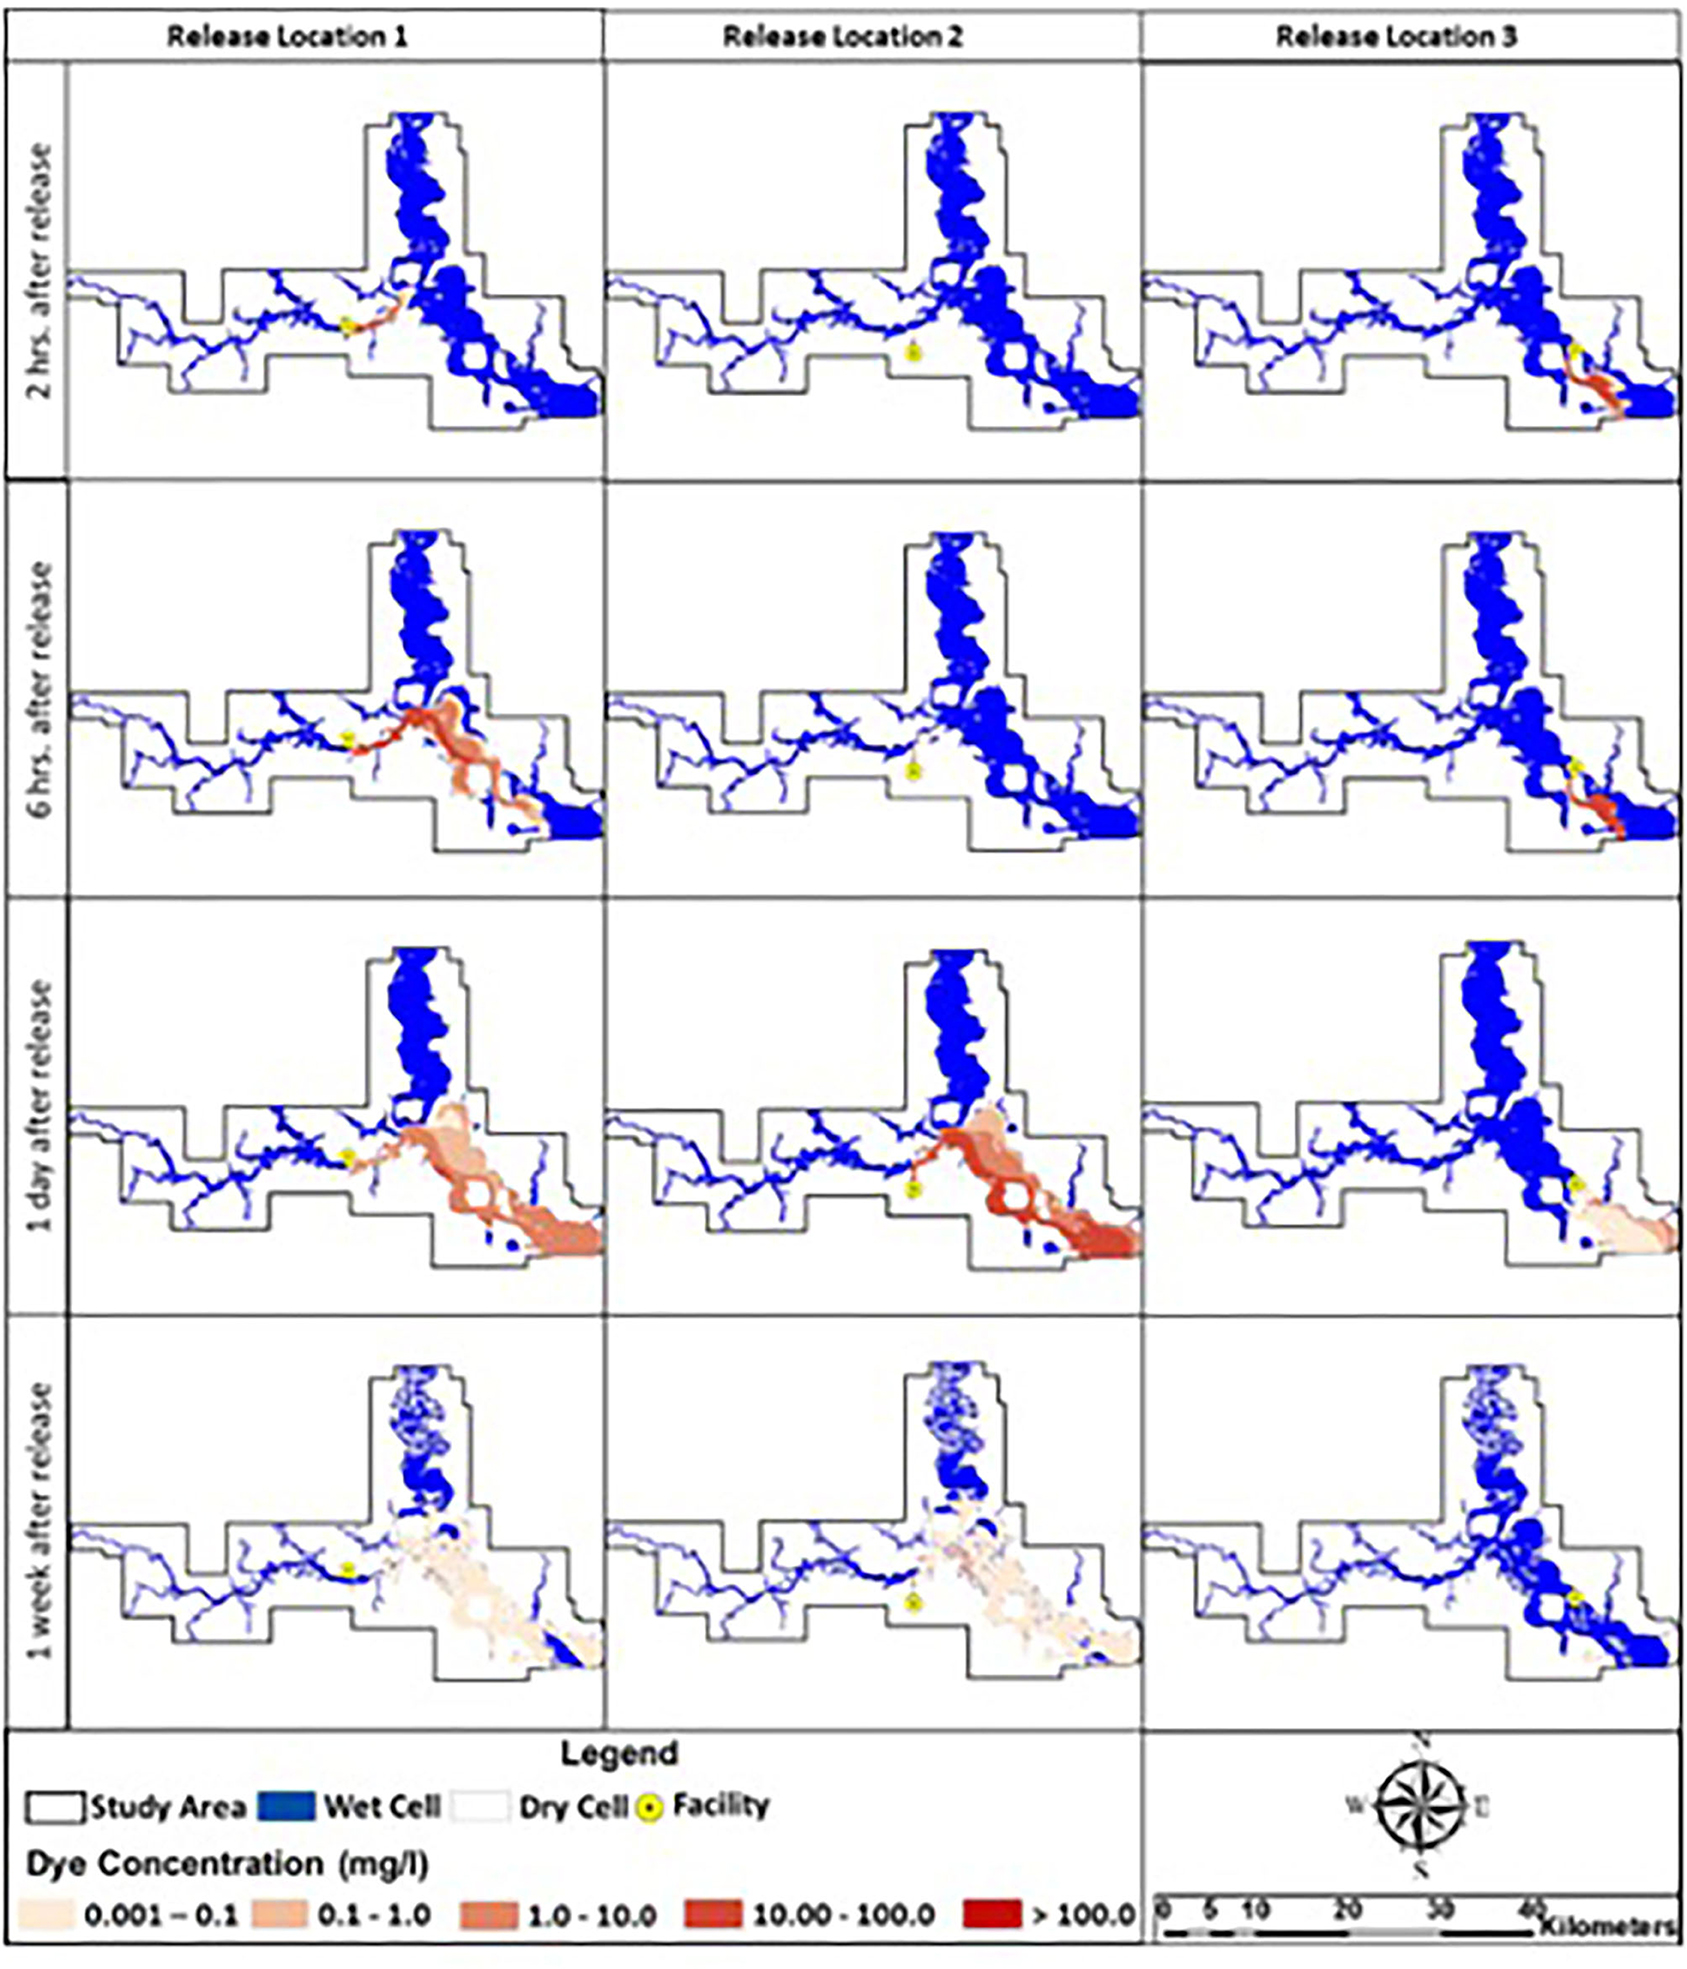
Figure 8. Dye concentration for Hurricane Harvey at various times during and following the event for different release locations. Blue cells represent concentrations below 0.001 mg/l.
The final percentage of the tracer dye (as a surrogate to the contaminant of interest) that reached Galveston Bay and the time for 85% of dye mass to reach Galveston Bay is shown in Table 4. The high percentage of mass within a low period of time reaching the final receptor indicates the risk of widespread contamination of a potential spill. In <3 days the majority of the modeled spill will reach the final receptor with larger water volume where dilution makes remediation efforts very difficult. In addition, in the first few days during the events (especially the rainfall-based events where the high flow rates last for more than a week), the priority is on saving lives; and, because of the presence of debris in the water, it is not possible to limit the spread or remove the contaminants from the water.
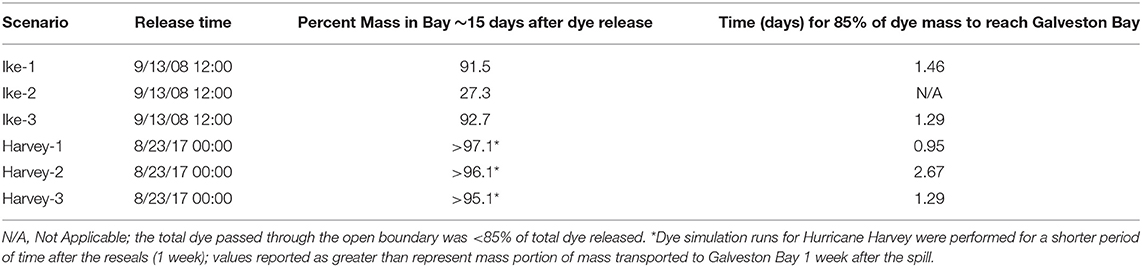
Table 4. Results for the Ike and Harvey spill scenarios with their corresponding release times, final percentage of mass in GB, and time lapse for 85% of the dye mass leaving the model domain.
Lands that were affected by the spill from different locations during Hurricane Ike and Harvey are shown in Figure 9. The affected land is directly related to the flooding extent and whether there were any contaminants in the water that caused the inundation or passed through the wet cell during the inundation period. Compared to Harvey, surge driven spill scenarios caused by Ike created a smaller environmental footprint of the spill on land for Release Locations 1 and 2 and a larger footprint for location 3. A spill from Release Location 1 could potentially affect 8.65 and 9.52 km2 of land, with almost 0.7 and 1% of the total spill mass retained on land during Hurricane Ike and Harvey, respectively. The contaminated lands for Release Locations 2 and 3 were 6.29 and 7.95 km2 for Hurricane Ike and 9.36 and 2.75 km2 for Hurricane Harvey. Downstream of the HSC-SJR confluence and upstream of Alexander Island were identified as the most polluted lands after Hurricane Harvey. Alexander Island (see Figure 2 for the location) and upstream of the HSC mouth were the most affected areas for Hurricane Ike. It is noted again that this does not account for air plume formation and transport onto land from spills in the waterway that may represent a significant health risk to nearby populations. The retention of contaminants on land could pose a threat to both natural and built environment. Thus, the developed framework could be used to identify the locations that might need remediation and a guideline for sampling efforts after severe storms.
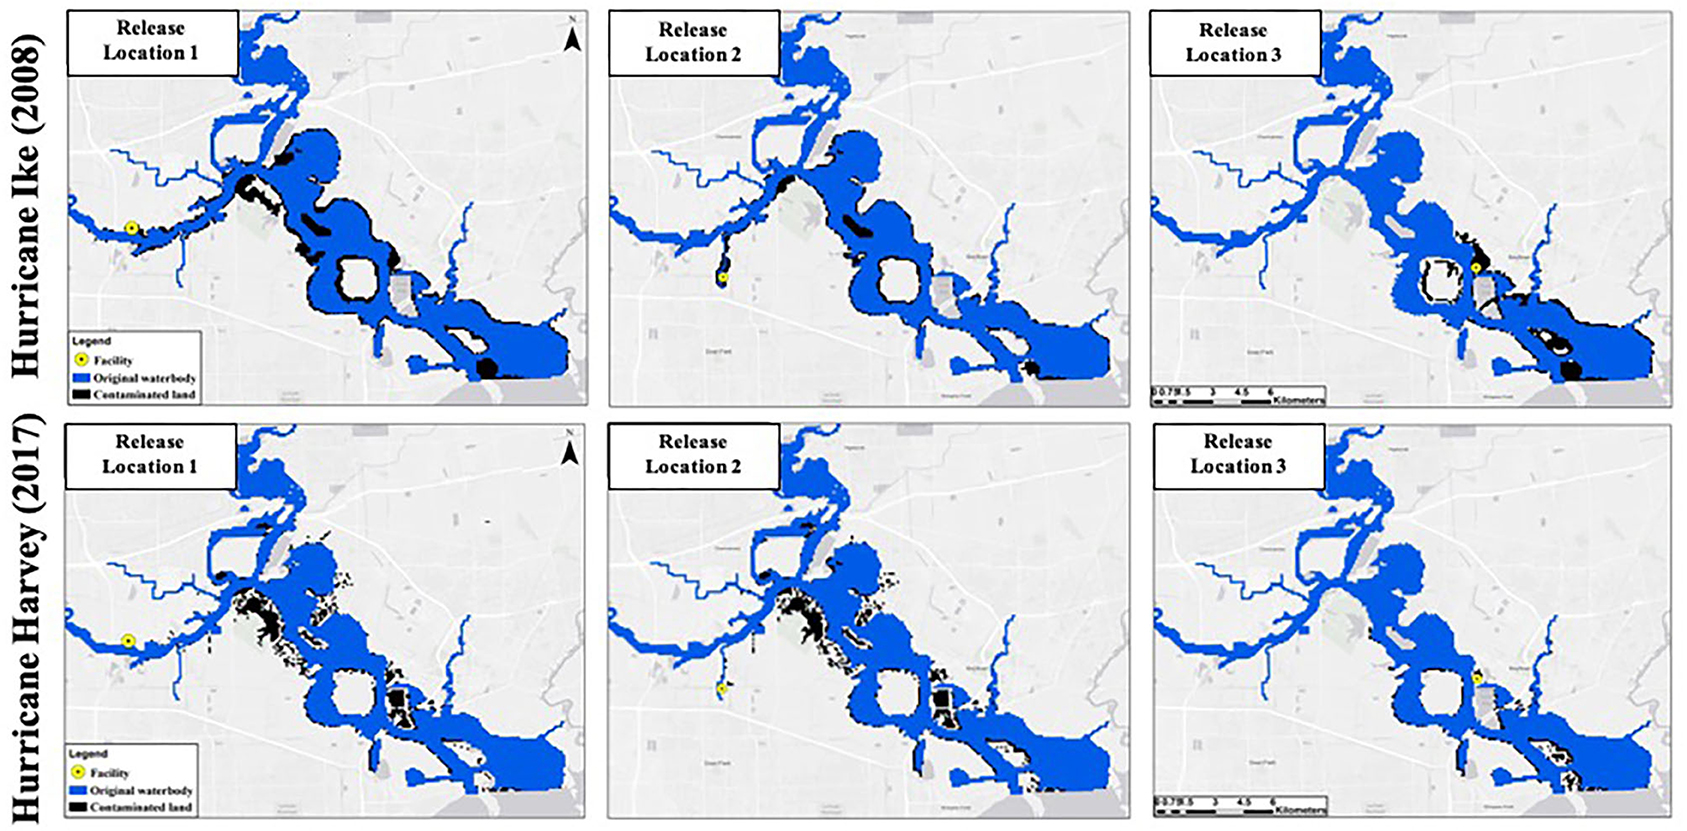
Figure 9. Comparison of land affected by spills from different locations within the model domain for Hurricane Ike (top) and Hurricane Harvey (bottom).
FEDERAP Projected Losses
The total loss estimates for each of the facilities are shown in Figure 10. The total modeled losses ranged from $30 million to $500 million for WSEs between 4.5 and 5.2 m (15–17 ft) while the total losses ranged from $80 million to $7 billion for WSEs near 7.6 m (25 ft). As can be seen in Figure 10, Facilities A and B loss curves are similar and distinctly different from C and D. While loss curves for A and B increase gradually and exhibit separation between the three scenarios shown (low, medium, and high), the loss curves for facilities C and D are almost superimposed up to WSEs around 5.8 m. Beyond this WSE, facilities C and D exhibit distinctly different losses that reflect the difference in facility characteristics (area, elevation, tanks, and unit-processes). Facility C has a larger area (but more of the area is at a higher elevation) and more tanks, whereas facility D has a lower average elevation and more process units. Thus, and as can be seen in Figure 10, the loss curves increase steadily for facility C beyond WSEs of 5.8 (19 ft) m whereas facility D experiences an exponential rise in losses between 6.4 (21 ft) and 7 (23 ft) m that stabilize beyond 7 m. It is noted that Facility B has a relatively smaller area and a smaller number of tanks and process units which explains the difference in the relative magnitude of losses when compared to the other facilities. It is also noted that facility D is the only facility that did not exhibit any sensitivity to the high, medium and low cost scenarios for inundation levels below 6.4 m (21 ft). This is because the facility is located at a relatively higher base elevation than the other facilities, similar to facility C, but unlike facility C; facility D has a relatively lower number of tanks.
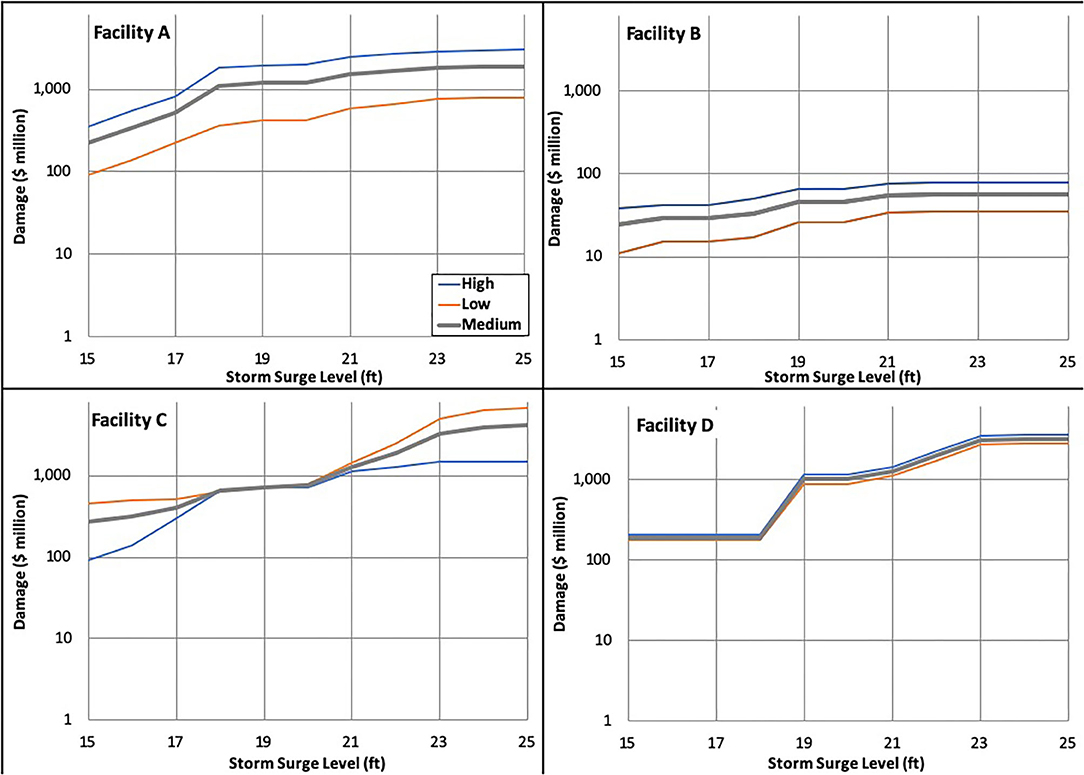
Figure 10. FEDERAP projected losses for 3 scenarios of cost models (blue line: higher estimate, gray line: medium estimate, red line: lower estimate).
The individual components of the total losses for each facility can be studied further to determine the main driver for losses as WSE increases. As discussed above in the Methods, economic loss variables had low and high values estimates as well as a calculated average value. For modeled high losses estimates, for example, as inundation increases, the downtime causes losses to rise significantly. For three of the four facilities, production loss was the most important driver for losses in the modeled scenarios (data not shown). This finding would likely change based on the specific event, its impacts, and variables used in the model. Additionally, probabilistic modeling using the developed economic modeling will further inform analyses for individual facilities or an industrial complex such as the Houston Ship Channel. For Facilities A and C, environmental release plays a significant role due to the number of tanks on site and the locations of the tanks. For Facility C in particular, environmental release is the largest component for losses. Facility C exhibits relatively high tank density (more than one tank per acre) and the resulting losses for this facility are due to the large number of tanks at low elevations (the majority of the facility and its unit-processes are not inundated even at high storm surge levels of ~7 m). The results from the analysis with the four facilities can be synthesized to allow general conclusions to be made for the entire HSC industrial region and beyond. For instance, when comparing across the 4 facilities, it was found that losses are at their lowest when the facility is <20% inundated and their highest once inundation exceeds 75% as would be expected. The results on a spatial basis were somewhat less intuitive, however. For facilities to the east near the mouth of the HSC, the initial response to storm surge level rise is minimal but begins a step increase at ~6 m (Facilities C and D). The two facilities investigated on the western portion of the study area have a more gradual loss curve to storm surge with increases occurring at 5.2 and 6 m. Thus, having an understanding of the relationship between facility elevations, storm surge levels, and expected losses (in addition to impacted infrastructure) is critical and can only be gleaned with the modeling framework presented here. Such an understanding, when developed, enables decision-makers to evaluate various mitigation strategies based on vulnerability, hazard, and risk within a projected losses framework.
The data in Figure 11 illustrate sensitivity analysis results for Facility A. The modeled losses for Facility A ranged from $360 million to $3 billion and were non-linear relative to storm surge levels (Figure 11 base run). The results of the sensitivity analysis for a surge level of between 4.6 m (15 ft) and 7.6 m (25 ft) ranged from $280 million to $4.2 billion indicating a high degree of sensitivity in modeling results to the assumed cost relationships. Results also indicated that damage estimates were most sensitive to environmental losses (cleanup cost and additional days down). At the lower modeled storm surge levels, FEDERAP damage estimates did not change in response to changes in most inputs except for percent tank release and cleanup costs. For these two variables, damage estimates increased more than 40% as the storm surge level increased from 4.6 m (15 ft) to 5.5 m (18 ft). When the storm surge level exceeds 5.5 m (18 ft), more of the facility infrastructure becomes inundated causing higher dependency on values used for production losses. Overall, the loss model had limited sensitivity to daily revenue, property value, and losses related to unit-processes with the major driver being productivity and environmental (spill) losses. The interplay between facility characteristics and the modeled cost relationships and their effect on total losses highlights the need for tools such as FEDERAP and the importance of integrating this type of analysis into decision-making for addressing vulnerability of critical industrial infrastructure.
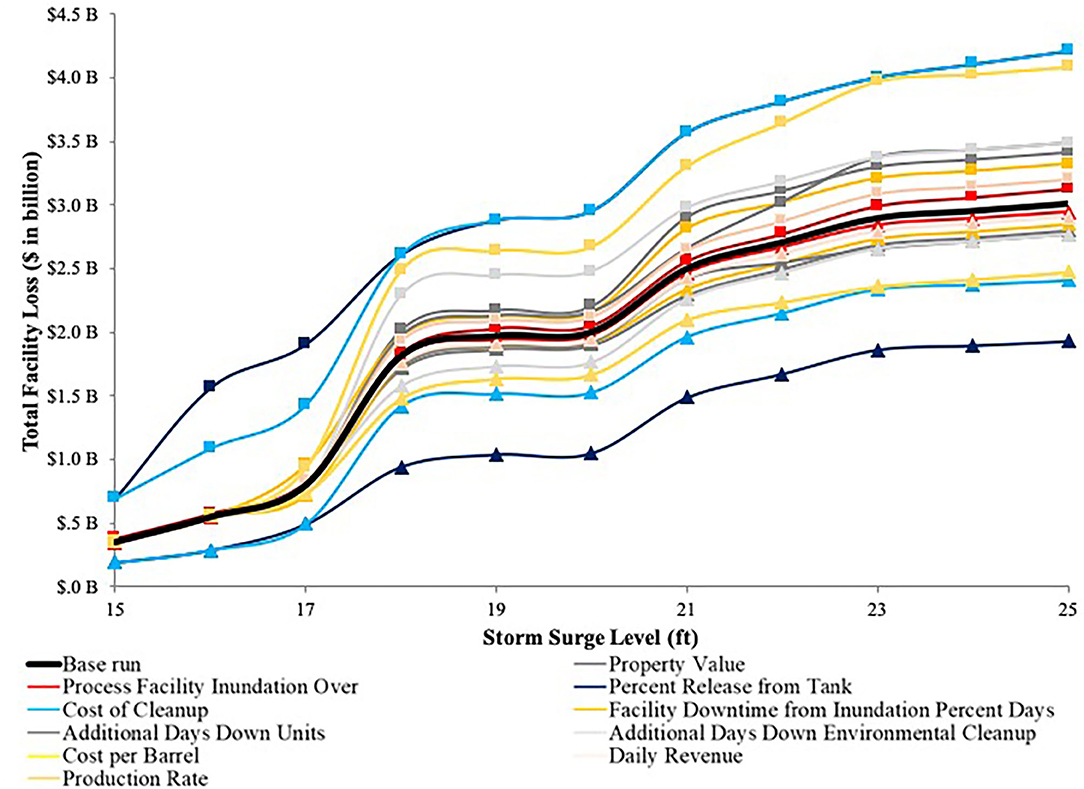
Figure 11. FEDERAP sensitivity analysis results for Facility A. Lines with squares and triangles represent doubled and halved scenarios, respectively.
It is important to acknowledge the limitations of the FEDERAP model in its current formulation. While chemical spills are included in FEDERAP, the interaction among stored chemicals within and between facilities in the water is not presently accounted for. The storm surge level is considered but the period of time where storm surge is present within the HSC is not accounted for in terms of pollutant dispersion within the inundated zones; longer storm surge durations are expected to push pollutants farther upstream and disperse them onto a larger area. The length of time and interaction among stored chemicals may need to be investigated using water quality and contaminant transport models in order to refine the cleanup losses determined in the FEDERAP framework. In addition, a facility may be operational but in reality may be prohibited from operating normally due to damages in nearby facilities and/or debris in the Channel or continued emergency response and cleanup activities. Lastly, this analysis is not probabilistic in nature and does not include risk (the risk of incurring a specific storm surge level); however, the model can be readily adapted to incorporate risk and probability when data on hurricane risks are developed in the future.
Conclusions
The results from the water quality model driven by storm surge (EFDC-SS) model containing both land and waterbodies showed the different mechanisms of spill spread under different hurricane types. While spreading differently, spills during a severe hydrologic event can widely spread miles away from the release location in a very short period of time and pollute both land and water in addition to the airshed. The developed framework could be applied to investigate the fate and transport of spills during compound flooding events. While damage assessments to date have failed to account for the complexities of industrial facility vulnerabilities to hurricanes and severe storm surge events, the Facility Economic Damage and Environmental Release Planning (FEDERAP) provides a modeling framework that allows for investigating the complex relationships between storm surge level and the specific losses that would be experienced by a specific facility or an entire industrial region. This research demonstrates that industrial regions should be evaluated using tools that reflect their specificity. In addition, this paper demonstrates that property loss is a relatively small component when compared to other losses that could be incurred due to storage tank damage or damage to process units. This research also demonstrates that storm surge levels are directly related to incurred damages and losses at industrial facilities and that storm surge above a facility specific threshold value would cause losses to increase at a steeper slope because of environmental pollution and loss of productivity. Without detailed studies and model scenarios similar to what is presented in this study, it would be very difficult to anticipate areas (and communities), whether on land or in water, that would be most vulnerable to contamination in a given medium (air, soil, water, biota). The methodology developed in this study can be easily applied to similar severe storms prone coastal plain estuaries such as the Hudson River in New York, Delaware Bay between New Jersey and Delaware, and other estuaries along the Gulf Coast. Future work could address some of the limitations of the study and expand on its capabilities. For instance, dynamic coupling of SWAN + ADCIRC with the EFDC, FEDERAP, and the tank failure model could provide a near real-time predictive and planning tool.
Data Availability Statement
The original contributions presented in the study are included in the article/supplementary material further inquiries can be directed to the corresponding authors.
Author Contributions
HR, AK, and DB brainstormed the research ideas and contributed in writing the manuscript equally. DB and AK did the majority of analyses under HR supervision. All authors contributed to the article and approved the submitted version.
Funding
The National Science Foundation award #1759440 provided funding for this research. Additional funding was received from the Hurricane Resilience Research Institute, the Severe Storm Prediction, Evaluation, and Evacuation from Disaster Center, the Texas Commission on Environmental Quality, and the US EPA. DSI, LLC is acknowledged for granting a license for use of the EFDC model and its interfaces to develop EFDC-SS. Their support is gratefully acknowledged.
Conflict of Interest
The authors declare that the research was conducted in the absence of any commercial or financial relationships that could be construed as a potential conflict of interest.
Publisher's Note
All claims expressed in this article are solely those of the authors and do not necessarily represent those of their affiliated organizations, or those of the publisher, the editors and the reviewers. Any product that may be evaluated in this article, or claim that may be made by its manufacturer, is not guaranteed or endorsed by the publisher.
References
Ashley, N. A., Valsaraj, K. T., and Thibodeaux, L. J. (2008). Elevated in-home sediment contaminant concentrations—The consequence of a particle settling–winnowing process from Hurricane Katrina floodwaters. Chemosphere 70, 833–840. doi: 10.1016/j.chemosphere.2007.07.010
Bailey, J. R., and Levitan, M. L. (2008). Lessons learned and mitigation options for hurricanes. Process Safety Prog. 27, 41–47. doi: 10.1002/prs.10218
Bilskie, M. V., Hagen, S. C., Alizad, K., Medeiros, S. C., Passeri, D. L., Needham, H. F., et al. (2016). Dynamic simulation and numerical analysis of hurricane storm surge under sea level rise with geomorphologic changes along the northern Gulf of Mexico. Earth's Futur. 4, 177–193. doi: 10.1002/2015EF000347
Burleson, D. W., Rifai, H. S., Proft, J. K., Dawson, C. N, and Bedient, P. B. (2015). Case study: vulnerability of an industrial corridor in texas to storm surge. Nat. Hazard. 77, 1183–1203. doi: 10.1007/s11069-015-1652-7
Cauffman, S. A., Phan, L. T., Sadek, F., Fritz, W. P., Duthinh, D., and Rossiter, W. J. (2006). “Performance of physical structures in hurricane katrina and hurricane rita: a reconnaissance report (NIST TN 1476),” in National Institute of Standards and Technology, 222. Availale online at: http://fire.nist.gov/bfrlpubs/build06/art016.html (accessed 24 November, 2014).
Chang, N.-B., Wei, Y. L., Tseng, C. C., and Kao, C. Y. J. (1997). The design of a GIS-based decision support system for chemical emergency preparedness and response in an urban environment. Comput. Environ. Urban Syst. 21, 67–94. doi: 10.1016/S0198-9715(97)01009-0
Cruz, A., and Krausmann, E. (2013). Vulnerability of the oil and gas sector to climate change and extreme weather events. Clim. Change 121, 41–53. doi: 10.1007/s10584-013-0891-4
Cruz, A. M., Steinberg, L. J., and Luna, R. (2001). Identifying hurricane-induced hazardous material release scenarios in a petroleum refinery. Nat. Hazard Rev. 2, 203–210. doi: 10.1061/(ASCE)1527-6988(2001)2:4(203)
Eggleston, K. (2014). “Valero refinery expansions pushed forward by eagle ford production growth—$730 Million,” in Eagle Ford Shale. Available online at: http://eaglefordshale.com/pipeline-midstream-news/valero-refinery-expansions-pushed-forward-by-eagle-ford-production-growth/ (accessed 16 Febuary, 2015).
Eldrandaly, K. A., and AbdelAziz, N. M. (2012). Enhancing ArcGIS decision making capabilities using an intelligent multicriteria decision analysis toolbox. J. Environ. Inform. 20, 44–57. doi: 10.3808/jei.201200219
Etkin, D. S. (2000). “Worldwide analysis of oil spill cleanup cost factors,” in Procceding 23rd Arctic and Marine Oilspill Program Tech. Sem, 161–174.
Frazier, T. G., Wood, N., Yarnal, B., and Bauer, D. H. (2010). Influence of potential sea level rise on societal vulnerability to hurricane storm-surge hazards, Sarasota County, Florida. Appl. Geograph. 30, 490–505. doi: 10.1016/j.apgeog.2010.05.005
Freund, A., Zuckerman, N., Luo, H., Hsu, H.-H., and Lucchini, R. (2014). Diesel and silica monitoring at two sites following hurricane sandy. J. Occup. Environ. Hyg.11, D131–D143. doi: 10.1080/15459624.2014.904518
Godoy, L. A. (2007). Performance of storage tanks in oil facilities damaged by Hurricanes Katrina and Rita. J. Perform. Constr. Facil. 21, 441–449. doi: 10.1061/(ASCE)0887-3828(2007)21:6(441)
Godoy, L. A. (2009). “Hurricane failures of tanks for the oil industry,” in Proceedings from International Association for Shell and Spatial Structures (IASS) Symposium, Valencia, Spain, 28 September−2 October 2009, 114–126.
Hallegatte, S., Ranger, N., Mestre, O., Dumas, P., Corfee-Morlot, J., Herweijer, C., et al. (2011). Assessing climate change impacts, sea level rise and storm surge risk in port cities: a case study on Copenhagen. Clim. Change 104, 113–137. doi: 10.1007/s10584-010-9978-3
Hamrick, J. M. (1992). A Three-Dimensional Environmental Fluid Dynamics Computer Code: Theoretical and Computational Aspects. Special Report in Applied Marine Science and Ocean Engineering; no. 317. Virginia Institute of Marine Science, William & Mary. doi: 10.21220/V5TT6C
Harris, S. P., and Wilson, D. O. (2008). Mitigating Hurricane storm surge perils at the DeLisle Plant. Process Saf. Prog. 27, 177–184. doi: 10.1002/prs.10226
Hoobler, B. M., Vance, G. F., Hamerlinck, J. D., Munn, L. C., and Hayward, J. A. (2003). Applications of land evaluation and site assessment (LESA) and a geographic information system (GIS) in East Park County, Wyoming. J. Soil Water Conserv. 58, 105–112. Available online at: https://www.jswconline.org/content/58/2/105/tab-article-info
Hope, M. E., Westerink, J. J., Kennedy, A. B., Kerr, P. C., Dietrich, J. C., Dawson, C., et al. (2013). Hindcast and validation of Hurricane Ike (2008) waves, forerunner, and storm surge. J. Geophys. Res. Ocean. 118, 4424–4460. doi: 10.1002/jgrc.20314
Huang, Z., Rosowsky, D. V., and Sparks, P. R. (2001). Long-term hurricane risk assessment and expected damage to residential structures. Reliabil. Eng. Syst. Saf. 74, 239–249. doi: 10.1016/S0951-8320(01)00086-2
Kameshwar, S., and Padgett, J. E. (2015). “Fragility assessment of above ground petroleum storage tanks under storm surge,” in 2th International Conference on Applications of Statistics and Probability in Civil Engineering. Vancouver, Canada.
Khan, F. I., Husain, T., and Abbasi, S. A. (2001). “Safety weighted hazard index (SWeHI)—a new, user-friendly tool for swift yet comprehensive hazard identification and safety evaluation in chemical process industries. Process Saf. Environ. Protect. 79, 65–80. doi: 10.1205/09575820151095157
Kiaghadi, A., Govindarajan, A., Sobel, R. S., and Rifai, H. S. (2020). Environmental damage associated with severe hydrologic events: a LiDAR-based geospatial modeling approach. Nat. Hazards 20:4099. doi: 10.1007/s11069-020-04099-1
Kiaghadi, A., and Rifai, H. S. (2019). Chemical, and microbial quality of floodwaters in Houston following Hurricane Harvey. Environ. Sci. Technol. 53, 4832–4840. doi: 10.1021/acs.est.9b00792
Kiaghadi, A., Rifai, H. S., and Burleson, D. W. (2018). Development of a storm surge driven water quality model to simulate spills during hurricanes. Mar. Pollut. Bull. 129, 714–728. doi: 10.1016/j.marpolbul.2017.10.063
Kim, M., Miller-Hooks, E., and Nair, R. (2011). A Geographic information system-based real-time decision support framework for routing vehicles carrying hazardous materials. J. Intell. Transport. Syst.15, 28–41. doi: 10.1080/15472450.2011.544584
Kumbier, K., Carvalho, R. C., Vafeidis, A. T., Woodroffe, C. D., and Carvalho, R. C. (2018). Investigating compound flooding in an estuary using hydrodynamic modelling: a case study from the Shoalhaven River, Australia. Hazards Earth Syst. Sci. 18, 463–477. doi: 10.5194/nhess-18-463-2018
Liao, Z. L., Xu, Z. X., Li, Y. X., Wang, D. B., and Borrebach, M. J. (2011). GIS development for environmental hazard management based on gridding management. J. Environ. Inform. 17, 83–90. doi: 10.3808/jei.201100190
Loveland, M., Kiaghadi, A., Dawson, C. N., Rifai, H. S., Misra, S., Mosser, H., et al. (2021). Developing a modeling framework to simulate compound flooding: when storm surge interacts with riverine flow. Front. Clim. 2:609610. doi: 10.3389/fclim.2020.609610
Mamauag, S. S., Alino, P. M., Martinez, R. J. S., Muallil, R. N., Doctor, M. V. A., Dizon, E. C., and Cabral, R. B. (2013). A framework for vulnerability assessment of coastal fisheries ecosystems to climate change—Tool for understanding resilience of fisheries (VA–TURF). Fish. Res. 147, 381–393. doi: 10.1016/j.fishres.2013.07.007
Moftakhari, H. R., Salvadori, G., AghaKouchak, A., Sanders, B. F., and Matthew, R. A. (2017). Compounding effects of sea level rise and fluvial flooding. Proc. Natl. Acad. Sci. U.S.A. 114, 9785–9790. doi: 10.1073/pnas.1620325114
Naito, C., Cox, D., Yu, Q., and Brooker, H. (2012). Fuel Storage container performance during the 2011 Tohoku, Japan, Tsunami. J. Perform. Constr. Facil. 27, 373–380. doi: 10.1061/(ASCE)CF.1943-5509.0000339
NCDC. (2020). Billion-Dollar Weather and Climate Disasters. NOAA's National Climatic Data Center. Available online at: https://www.ncdc.noaa.gov/billions/events (accessed May 17, 2020).
Needham, H. F., and Keim, B. D. (2012). A storm surge database for the US Gulf Coast. Int. J. Climatol. 32, 2108–2123. doi: 10.1002/joc.2425
Petersen, T. M. (2006). Spatial and Temporal Modeling of Escherichia Coli Sources and Load Allocations in an Urban, Watershed Ph. D. Dissertation Civil, and Environmental Engineering. Houston,Texas: University of Houston.
Pine, J. (2006). Hurricane Katrina and oil spills: Impacts on coastal and ocean environment. Oceanography. 19, 37–39. doi: 10.5670/oceanog.2006.61
Qi, H., and Altinakar, M. S. (2011). A GIS-based decision support system for integrated flood management under uncertainty with two dimensional numerical simulations. Environ. Modelli. Softw. 26, 817–821. doi: 10.1016/j.envsoft.2010.11.006
Reible, D., Haas, C., Pardue, J., and Walsh, W. (2006). Toxic and contaminant concerns generated by Hurricane Katrina. J. Environ. Eng. 132, 565–566. doi: 10.1061/(ASCE)0733-9372(2006)132:6(565)
Robertson, I., Riggs, H., Yim, S., and Young, Y. (2007). Lessons from Hurricane Katrina Storm Surge on Bridges and Buildings. J. Waterway Port Coast. Ocean Eng. 133, 463–483. doi: 10.1061/(ASCE)0733-950X(2007)133:6(463)
Santella, N., Steinberg, L. J., and Sengul, H. (2010). Petroleum and hazardous material releases from industrial facilities associated with hurricane Katrina. Risk Anal. 30, 635–649. doi: 10.1111/j.1539-6924.2010.01390.x
Santiago-Collazo, F. L., Bilskie, M. V., and Hagen, S. C. (2019). A comprehensive review of compound inundation models in low-gradient coastal watersheds. Environ. Model. Softw. 119, 166–181. doi: 10.1016/j.envsoft.2019.06.002
Srinivas, H., and Nakagawa, Y. (2008). Environmental implications for disaster preparedness: lessons learnt from the Indian Ocean Tsunami. J. Environ. Manage. 89, 4–13. doi: 10.1016/j.jenvman.2007.01.054
Verter, V., and Kara, B. Y. (2001). A GIS-Based framework for hazardous materials transport risk assessment. Risk Anal. Int. J. 21, 1109–1120. doi: 10.1111/0272-4332.216179
Vickery, P. J., Lin, J., Skerlj, P. F., Twisdale, L. A, and Huangx‘, K. (2006). HAZUS-MH Hurricane Model Methodology. II: damage and loss estimation. Nat. Hazards Rev. 7, 94–103. doi: 10.1061/(ASCE)1527-6988(2006)7:2(94)
Yang, Z., Lindell, M. K., and Prater, C. S. (2009). Vulnerability of community businesses to environmental disasters. Disasters 33, 38–57. doi: 10.1111/j.1467-7717.2008.01061.x
Zhang, Y. J., Ye, F., Yu, H., Sun, W., Moghimi, S., Myers, E., et al. (2019). Simulating compound flooding events in a hurricane. Ocean Dyn. 70, 621–640. doi: 10.1007/s10236-020-01351-x
Keywords: compound flooding, inundation, spills and leaks, ADCIRC, EFDC
Citation: Rifai HS, Kiaghadi A and Burleson DW (2021) Assessing Damages to Built and Natural Environments: Linking Hydrodynamic and Geospatial Enviro-Economical Models. Front. Clim. 3:610593. doi: 10.3389/fclim.2021.610593
Received: 26 September 2020; Accepted: 27 July 2021;
Published: 19 August 2021.
Edited by:
Valentina Prigiobbe, Stevens Institute of Technology, United StatesReviewed by:
Roohollah Noori, University of Tehran, IranJuan L. Garzon, University of Algarve, Portugal
Copyright © 2021 Rifai, Kiaghadi and Burleson. This is an open-access article distributed under the terms of the Creative Commons Attribution License (CC BY). The use, distribution or reproduction in other forums is permitted, provided the original author(s) and the copyright owner(s) are credited and that the original publication in this journal is cited, in accordance with accepted academic practice. No use, distribution or reproduction is permitted which does not comply with these terms.
*Correspondence: Hanadi S. Rifai, cmlmYWlAdWguZWR1